Impression learning: Online representation learning with ...
27
Impression learning: Online representation learning with synaptic plasticity Colin Bredenberg Center for Neural Science New York University [email protected] Benjamin S. H. Lyo Center for Neural Science New York University [email protected] Eero P. Simoncelli Center for Neural Science, New York University Flatiron Institute, Simons Foundation [email protected] Cristina Savin Center for Neural Science, Center for Data Science New York University [email protected] Abstract Understanding how the brain constructs statistical models of the sensory world remains a longstanding challenge for computational neuroscience. Here, we derive an unsupervised local synaptic plasticity rule that trains neural circuits to infer latent structure from sensory stimuli via a novel loss function for approximate online Bayesian inference. The learning algorithm is driven by a local error signal computed between two factors that jointly contribute to neural activity: stimulus drive and internal predictions — the network’s ‘impression’ of the stimulus. Physio- logically, we associate these two components with the basal and apical dendrites of pyramidal neurons, respectively. We show that learning can be implemented online, is capable of capturing temporal dependencies in continuous input streams, and generalizes to hierarchical architectures. Furthermore, we demonstrate both analyt- ically and empirically that the algorithm is more data-efficient than a three-factor plasticity alternative, enabling it to learn statistics of high-dimensional, naturalistic inputs. Overall, the model provides a bridge from mechanistic accounts of synaptic plasticity to algorithmic descriptions of unsupervised probabilistic learning and inference. 1 Introduction Sensory systems are faced with a task analogous to the scientific process itself: given a steady stream of raw data, they must extract meaningful information about its underlying structure. Because the true underlying structure of the data is rarely accessible, this “representation learning” must be largely unsupervised. Framing perception in the language of Bayesian inference has proven fruitful in perceptual and cognitive science [1–4], but has been difficult to connect to biology, because we still lack a satisfactory account of how the machinery of Bayesian inference and learning is implemented in neural circuits [5, 6]. Past work includes several examples of circuits that simultaneously learn a top-down generative model of incoming stimuli and perform approximate inference with respect to these models. These differ in the nature of the approximation, from maximum a posteriori estimation [7], to efficient population codes that embed prior structure [8] to either parametric [9, 10] or sampling-based [11] variational inference. Learning generally takes the form of optimizing a probabilistic objective, either by backpropagation [9, 10] or through local parameter updates, which match biological learning more 35th Conference on Neural Information Processing Systems (NeurIPS 2021).
Transcript of Impression learning: Online representation learning with ...

Impression learning: Onlinerepresentation learning with synaptic plasticity
Colin BredenbergCenter for Neural Science
New York [email protected]
Benjamin S. H. LyoCenter for Neural Science
New York [email protected]
Eero P. SimoncelliCenter for Neural Science,
New York UniversityFlatiron Institute, Simons Foundation
Cristina SavinCenter for Neural Science,
Center for Data ScienceNew York [email protected]
Abstract
Understanding how the brain constructs statistical models of the sensory worldremains a longstanding challenge for computational neuroscience. Here, we derivean unsupervised local synaptic plasticity rule that trains neural circuits to inferlatent structure from sensory stimuli via a novel loss function for approximateonline Bayesian inference. The learning algorithm is driven by a local error signalcomputed between two factors that jointly contribute to neural activity: stimulusdrive and internal predictions — the network’s ‘impression’ of the stimulus. Physio-logically, we associate these two components with the basal and apical dendrites ofpyramidal neurons, respectively. We show that learning can be implemented online,is capable of capturing temporal dependencies in continuous input streams, andgeneralizes to hierarchical architectures. Furthermore, we demonstrate both analyt-ically and empirically that the algorithm is more data-efficient than a three-factorplasticity alternative, enabling it to learn statistics of high-dimensional, naturalisticinputs. Overall, the model provides a bridge from mechanistic accounts of synapticplasticity to algorithmic descriptions of unsupervised probabilistic learning andinference.
1 Introduction
Sensory systems are faced with a task analogous to the scientific process itself: given a steady streamof raw data, they must extract meaningful information about its underlying structure. Because thetrue underlying structure of the data is rarely accessible, this “representation learning” must belargely unsupervised. Framing perception in the language of Bayesian inference has proven fruitful inperceptual and cognitive science [1–4], but has been difficult to connect to biology, because we stilllack a satisfactory account of how the machinery of Bayesian inference and learning is implementedin neural circuits [5, 6].
Past work includes several examples of circuits that simultaneously learn a top-down generativemodel of incoming stimuli and perform approximate inference with respect to these models. Thesediffer in the nature of the approximation, from maximum a posteriori estimation [7], to efficientpopulation codes that embed prior structure [8] to either parametric [9, 10] or sampling-based [11]variational inference. Learning generally takes the form of optimizing a probabilistic objective, eitherby backpropagation [9, 10] or through local parameter updates, which match biological learning more
35th Conference on Neural Information Processing Systems (NeurIPS 2021).

closely [11, 7, 12, 13]. While these models are mostly restricted to static stimuli, several instancesalso operate over time [14–16].
Developing biologically plausible learning rules that are applicable to temporally-structured datais hampered by the fact that optimizing a probabilistic objective function in such contexts requiresaccess to non-local information across space and time. Previous research on local approximations tocredit assignment in BP address spatial credit assignment by ascribing differential functions to theapical and basal dendrites of pyramidal neurons in cortex, where apical dendrites are hypothesized toreceive top-down learning signals, and basal dendrites receive bottom-up sensory signals [17–25].Locally implementing temporal credit assignment is a bigger challenge [26, 27].
Our work, which we have dubbed ‘impression learning’ (IL), combines the tradition of probabilisticlearning [11, 14] with these recent developments in local optimization, in order to learn dynamicstimuli concurrently with perception. We propose a network architecture in which top-down stimuluspredictions arriving at the apical dendrites of neurons influence both network dynamics and synapticplasticity, allowing the network to concurrently learn a probabilistic model of the stimuli and anapproximate inference computation. We provide a mathematical derivation of synaptic plasticity rulesthat approximate gradient descent on a novel unsupervised loss function, along with detailed analysesof the biases induced by this approximation. We explore the empirical and mathematical relationshipsbetween IL and three other methods: backpropagation (BP) [28], the Wake-Sleep (WS) algorithm[29], and a specific form of neural variational inference (NVI∗) [30, 31]. We further demonstrate thatIL scales to naturalistic stimuli and multilayer network architectures 1.
2 Probabilistic inference and local learning in a recurrent circuit
We construct a network of neurons that aims to learn a generative model of the temporal sequence ofstimuli that it receives, pm(r, s) =
∏Tt=0 pm(rt, st|rt−1), in which s represents stimuli in an input
layer.2 The latent variables r are not defined by a physical model of the stimulus environment, butare learned in an unsupervised manner to provide the best generative explanation of stimuli received.We assume that stimuli are generated by a true probability distribution p(s|z), where s correspondsto the first layer of neural activations in an early sensory layer, and vector z ∼ p(z) corresponds tothe environmental factors which jointly caused that activity. Because learning is unsupervised, wedo not enforce explicit correspondence between the internal and true latent features, r and z, only acorrespondence between model predictions and ground truth stimuli. We also assume that the networkperforms online inference with respect to its model, inferring the corresponding latent cause r usingBayes’ rule: pm(r|s) = pm(r, s)/pm(s). Because the network won’t, in general, be able to explicitlycalculate Bayes’ rule, we will assume that the network learns an approximate inference distributionq(r|s), which it attempts to bring ‘close’ to pm(r|s). This joint process of learning and inference,known as Bayesian latent feature extraction, provides a general framework for conceptualizing earlysensory processing in the brain [5]. In subsequent sections, we will write a loss function for thisgeneral latent feature extraction objective, and show how local modifications at apical and basalsynapses can perform approximate gradient descent on this loss.
Loss function The loss function that we propose will produce a learning algorithm where neuronsalternate between sampling from the model, pm, and performing approximate inference according toq in response to real stimuli received from p(s|z). This alternation will allow the network to learnonline in a way that minimally perturbs the continuity of perception. First, consider two families ofhybrid probability distributions, which we denote in shorthand qθ and pθ:
qθ =
T∏t=0
qt(rt, st|zt, λt; θ) =
T∏t=0
(q(rt|st; θq)p(st|zt))λt pm(rt, st|rt−1, λt; θp)1−λt
pθ =
T∏t=0
pt(rt, st|zt, λt; θ) =
T∏t=0
(q(rt|st; θq)p(st|zt))1−λt pm(rt, st|rt−1, λt; θp)λt , (1)
where a collection of binary random variables λt determines whether, at a given time step, samplingoccurs due to q(rt|st; θq)p(st|zt) or pm(rt, st|rt−1, λt; θp), and the full parameter space is denoted
1Code provided at: https://github.com/colinbredenberg/Impression-Learning-Camera-Ready.2We use the shorthand notation ‘s’ to refer to the N × T matrix of stimuli across time.
2

θ = [θp, θq]. We define an objective of the form:
L = Eλ,z [KL[qθ||pθ]]
= Eλ,z[∫
[log qθ − log pθ] qθ drds
]. (2)
This loss provides a generalization of the widely-used evidence lower bound (ELBO), whichcorresponds to the case λt = 1 ∀t. Importantly, we can show that L = 0 if and only ifq(rt|st; θq)p(st|zt) = pm(rt, st|rt−1, λt; θp) ∀t. If this equality were achieved, it would alsoimply pm(r, s) = q(r|s)p(s|z). However, this absolute minimum will not be achievable unless ztis deterministic, because pm(rt, st|rt−1, λt; θp) has no dependency on the latent variables in theenvironment. Thus, our goal is inherently unachievable, and different choices of p(λt) and networkarchitectures may lead to different local minima. However, each choice will incentivize learning aclose correspondence between these distributions, and an approximation to gradient descent withrespect to any choice will lead to local synaptic plasticity rules, making this objective particularlyinteresting for the computational neuroscience community.
Update derivation We begin by taking the gradient of our new loss w.r.t. θ = [θq, θp]:
−∇θL =−∇θEλ,z[∫
[log qθ − log pθ] qθ drds
]=− Eλ,z
[∫[∇θ(log qθ − log pθ)] qθ drds +
∫[log qθ − log pθ]∇θ qθ drds
],
where the second equality follows from the product rule. Both integrals are analytically intractable,but if we can write both as expectations, they can be approximated by averaging over samples ofr and s. To accomplish this, we note that ∇θ qθ = ∇θelog qθ = [∇θ log qθ] qθ, which allows us torewrite our expression as an expectation over r and s:
−∇θL =− Eλ,z[∫
[∇θ log qθ −∇θ log pθ] qθ drds +
∫[log qθ − log pθ] (∇θ log qθ)qθ drds
].
We also observe that∫
[∇θ log qθ] qθ drds = ∇θ∫qθ drds = ∇θ1 = 0, allowing the elimination of
two terms:
−∇θL = Eλ,z[∫
[∇θ log pθ] qθ drds +
∫ [log
pθqθ
](∇θ log qθ)qθ drds
]≈ Eλ,z
[∫[∇θ log pθ] qθ drds +
∫ [pθqθ− 1
](∇θ log qθ)qθ drds
]= Eλ,z
[∫[∇θ log pθ] qθ drds +
∫ [pθqθ
](∇θ log qθ)qθ drds
]= Eλ,z
[∫[∇θ log pθ] qθ drds +
∫[∇θ log qθ] pθ drds
]. (3)
The approximation in the second line comes from a Taylor expansion of log pθqθ
about 0, i.e. whenpθqθ
= 1 (which introduces a bias to the parameter updates that we examine analytically in AppendixA). This expansion is the core of our derivation, and not all algorithms take this approach: for thisreason, in Appendix B and C we show how the properties of our algorithm compare to alternatives(NVI∗, BP, or WS).
At this point, we have not yet defined p(λ). We’ll assume that λ0 ∈ {0, 1}, that p(λ0 = 0) =p(λ0 = 1) = 0.5, and that the λ values alternate deterministically with a ‘phase duration’ K, i.e.λk+1 = 1 − λk if mod (k,K) = 0, and λk+1 = λk otherwise. Under these conditions, the twointegrals in Eq. (3) are equivalent, and computing our parameter updates only requires sampling fromq. If we define λ′ = 1− λ, then we have p(λ′) = p(λ) and q(r, s|z, λ; θ) = p(r, s|z, λ′; θ), which
3

generation
environment
network
input
Wake
Sleep
Impression
1
01 10 0
tsensory
hidden
sensory
hidden
a b
c d e f
basal
apical
10k
20k
30k
loss
0 200ktime steps
0 20 40 60 80
0.00.20.40.60.81.0
-1 0 1ground truth
−1
0
1
pred
ictio
n
0 200time steps
−0.4
0.0
0.4
stim
ulus
ground truthoutput
auto
corre
latio
n
time lag
datainferencegeneration
λ tλ t
stimuli
Figure 1: Network architecture and learning. a. Model schematic. A neural network receivesstimulus inputs at its basal dendrites, and returns lateral and top-down prediction signals via apicalsynapses. A gate, λt, determines whether apical or basal influences dominate network activity. b.Learning schedule: the Wake-Sleep (WS) algorithm (left) trains its synapses by alternating betweenprolonged periods where λt = 1 (Wake) or λt = 0 (Sleep). In contrast, our IL algorithm alternatesrapidly between λt = 1 and λt = 0 with phase duration K = 2. c. Network loss on the artificialstimulus task. Error bars indicate ±1 s.e.m. averaged across 20 network realizations. d. Comparisonbetween a ground truth stimulus (green) and the network’s prediction (blue) for a particular stimulusdimension. e. Same comparison across stimulus dimensions. f. The autocorrelation function ofr when the network is performing approximate inference (green; λt = 1), or in generative mode(orange; λt = 0) compared to the autocorrelation of the data (grey).
we make use of as follows:
−∇θL ≈Ez
[∑λ
[∫[∇θ log pθ] qθ drds +
∫[∇θ log qθ] pθ drds
]p(λ)
]
=Ez
[∑λ
∫[∇θ log pθ] qθ drdsp(λ) +
∑λ′
∫[∇θ log pθ] qθ drds p(λ
′)
]
=2Ez
[∑λ
∫[∇θ log pθ] qθ drds p(λ)
]. (4)
Using the definitions for qθ and pθ and the properties of the logarithm gives us the following parameterupdate rule:
∆θ ∝ 2Eλ0,z
[∫ [∑t
(1− λt)∇θ log qt + (λt)∇θ log pmt
]qθ drds
]. (5)
As we will show below, this parameter update equation produces updates that require only informationlocally available to synapses, a necessary condition for any biologically-plausible algorithm.
Basic model To make the above general learning procedure concrete, we need to specify how tosample from qθ, which in turn requires an architecture for performing approximate inference at eachtime step, q(rt|st; θq), and a joint model of stimuli and neural activations, pm(rt, st|rt−1, λt; θp). Wemap these two model components onto neural circuitry, with their own local variables correspondingto s and r, and segregated synaptic parameters: the ‘basal’ compartment is dedicated to feedforwardinference (q, index ‘inf’) and the ‘apical’ compartment is dedicated to generative sampling from themodel (pm, index ‘gen’); this segregation allows their influence on neural dynamics to be selectivelygated by λt (Fig. 1a).
4

First, the internal generative model of the circuit is implicitly defined by a set of currents to the apicaldendritic compartment corresponding to generated samples for the next latent variable, rgent :
rgent = ((1− kt)Dr + ktI) rt−1 + σgenr ηt (6)
sgent = f(Dsrt) + σgens ξt, (7)
where Dr is a diagonal transition matrix (constraining generated latent-variables to be independentAR(1) processes), Ds is a linear decoder, I is the identity function, ηt, ξt ∼ N (0, I) are independentwhite noise samples, and σgen
r and σgens denote respectively the generative standard deviation for
neurons at the stimulus and latent levels. We define kt = (1 − δ(λt − λt−1))λt, with δ(·) theDirac delta function; kt is 1 only if λt = 1 and λt−1 = 0. We chose a piecewise model (gatedby kt) for rgent because we observed that the statistics of stimuli st given previous activities rt−1are different if a transition has just occurred (λt = 1 and λt−1 = 0), which will bias the trainingof the generative transition parameters Dr. We chose I for this case, but one could alternativelyhave a different parametric model for after transitions have occurred. As we will show, adding thiscondition to our model will never affect the dynamics of our network, but will cause learning forDr to occur only on time steps when a transition has not just occurred. Nothing in our derivationrequires the transition matrix Dr to be diagonal, but we constrained it in this way to allow for learningindependent latent features. As is, Dr defines the leakiness of the apical dendritic compartment ofthe neuron; off-diagonal components of the transition matrix would correspond to recurrent synapses.These dynamics define a probability distribution: pm(r, s) =
∏Tt=0 pm(rt, st|rt−1, λt; θp).
Second, we define our inference model, a factorized conditional probability distribution q(r|s) =∏Tt=0 q(rt|st; θq), which applies a feedforward nonlinear transformation to incoming stimuli:
rinft = f(Wst) + σinfr ηt, (8)
where W denotes the feedforward weights, σinfr is the inference standard deviation for neurons at the
latent level, and the nonlinearity f(·) is the tanh function. During inference mode, the stimulus layerreceives latent-associated inputs from the environment, further corrupted by the same noise as theinternal representation:
sinft = s(zt) + σinfs ξt, (9)
where σinfs denotes the standard deviation for neurons at the stimulus level, and s(zt) is input from
external stimuli. During simulations, samples are determined by a combination of pm and q, given byqθ:
rt = λtrinft + (1− λt)rgent (10)
st = λtsinft + (1− λt)sgent . (11)
We interpret these dynamics biologically as network of recurrently connected pyramidal neurons withtwo sources of input, one to the apical dendrites (rgent or sgent ) and one to the basal dendrites (rinft orsinft ). The gating variable λt determines which input source controls the circuit dynamics.
Plasticity rule interpretation Inserting our particular choice of qt and pmt into our approximategradient descent derivation, the parameter updates can be interpreted as local synaptic plasticity rulesat the basal (for qt) or apical (for pmt) compartments of our neuron model:
log q(rt|st; θq) =− 1
2 (σinfr )
2 ‖rt − f(Wst)‖22 + cq (12)
log pm(rt, st|rt−1, λt; θp) =− 1
2(σgenr )2
‖rt − ((1− kt)Dr + ktI) rt−1‖22
− 1
2(σgens )2
‖st − f(Dsrt)‖22 + cp, (13)
where cq = −Nr log(√
2π(σinfr )2) and cp = −Nr log(
√2π(σgen
r )2 − Ns log(√
2π(σgens )2 are
constants that do not depend on network parameters. We can use these equations to evaluate ourweight updates, by using the general formula in Eq. 5 and calculating derivatives. For online parameter
5

updates, we assume that weights change stochastically at each time step, based on samples from λ0,z, r, and s (instead of explicitly calculating the expectation in Eq. 5):
∆W(ij) ∝ 1− λt(σinfr )
2 (r(i)t − f(Wst)
(i))f ′(Wst)(i)s
(j)t (14)
∆D(ii)r ∝ λt(1− kt)
(σgenr )
2 (r(i)t − (Drrt−1)(i))r
(i)t−1 (15)
∆D(ij)s ∝ λt
(σgens )
2 (s(i)t − f(Dsrt)
(i))f ′(Dsrt)(i)r
(j)t . (16)
Each of these updates has the form of a local synaptic plasticity rule, under the following assumptions:W(ij) is a basal synapse from neuron j to neuron i, r
(i)t and r
(j)t correspond to the pre- and post-
synaptic firing rates, respectively, and f(Wst)(i) corresponds to the local basal current injected
into neuron i. Thus, assuming that a basal synapse has access to both the neuron’s firing rate andits local basal synaptic current at a particular moment in time, ∆W(ij) is local; the same principleholds for the apical updates. If λt = 0, then network activity is driven by the generative inputs,and so the parameter updates for basal synapses depend on apically-driven activity, as has beenobserved experimentally [32]; similarly, apical synaptic plasticity should depend on basally-drivenactivity. The updates for the generative transition matrix, Dr–determining the leakiness of the apicaldendritic compartments–are gated by 1 − kt, indicating that parameter updates are delayed uponentering ‘inference’ mode: this could reasonably be implemented biologically by a slow cascade ofbiochemical processes that delay changes in neural parameters, as has been proposed by previousplasticity models [33, 34].
3 Numerical Results
Validation on artificial stimuli To analyze IL performance in an environment where we haveaccess to and control over the statistics of the latent dynamics zt, we constructed artificial stimuli asfollows:
zt = Λzt−1 + σtrueηt (17)s(zt) = Azt, (18)
where Λ is a Nz × Nz diagonal matrix with Λii < 1 ∀i, A is a Ns × Nz random matrix withAij ∼ N (0, 1
Nz), and ηt ∼ N (0, 1).3 For simplicity, we fix the dimension of the latent space and
the generative noise in the network to the ground truth values, Nr = Nz neurons, and σtrue = σgenr ,
so that in principle our model∫pm(r, s)dr can match the ground truth data distribution
∫p(s, z)dz
exactly. This also means that we can verify that the network has learned an optimal model bycomparing its second-order statistics to those of the ground truth distribution.
We trained the network using IL, verifying that the online synaptic updates minimize the lossL (Fig. 1c). We further validate that the network has learned to accurately perform inference,so that q(r|s) ≈ pm(r|s), and that the network has learned a good model of the data, so that∫pm(r, s)dr ≈ p(s), as per our original goals. We show that when the network is performing
approximate inference, i.e. λt = 1, ∀t, stimulus reconstructions based on the network’s latent stateare closely matched to the actual stimuli, i.e. st ≈ f(Dsrt), meaning that the network is functioningas a good autoencoder across time (Fig. 1d), and across all stimulus dimensions (Fig. 1e). Toverify the network’s generative performance, we also show that the temporal autocorrelations for thenetwork rates rt in generative mode (λt = 0 ∀t) closely overlap with the ground truth autocorrelationstructure of z, suggesting that the learned latent features correspond (modulo a rotation) to the truelatent features. Note that this latent variable match occurs because we have enforced a correspondencebetween the true data-generating distribution and our model, and would not necessarily happen if adifferent model architecture were used.
Algorithm comparisons Having verified that IL is capable of training the network on simulateddata, we next compared it to alternative algorithms in the literature, including neural variational
3The parameter values and initialization details for all simulations are included in the supplementary code,which was run on an internal cluster; Ns = 100 and Nz = 20.
6

0
1
2k
12k
asym
ptot
ic lo
ss
0 100ktime steps
0 100ktime steps
cosi
ne s
imila
rity
loss
10-1
10-3
10-5
10-7
10-9
impressionNVI*
0 100ktime steps
gra
dien
t SN
R
stimulus dimension
a b c dimpressionNVI*
8k
4k
010 30 50
BP
Figure 2: Comparing learning algorithms and effects of dimensionality. a. Loss throughouttime. b. Cosine similarity between gradient updates given by IL and NVI∗, averaged over 106
samples. c. The signal-to-noise ratio for IL (blue), compared to NVI∗ (purple) across learning. d.Asymptotic negative ELBO loss for IL (blue), NVI∗ (purple), and BP (gray) as a function of thestimulus dimensionality. Error bars indicate ±1 s.e.m. averaged across 20 network realizations.
inference (NVI∗), BP, and WS (see Appendix B for detailed mathematical comparisons and deriva-tions). In particular, NVI∗ provides an alternative candidate model of how the brain could plausiblylearn neural representations through variational inference [31]. Because NVI∗ performs poorly forhigh-dimensional stimuli and large numbers of time steps (Appendix C; [35]), we simplified the taskby reducing the dimensionality of the latent space, Nz = 2, and stimulus space, Ns = 4. For twentyevenly-spaced time points over the course of the learning trajectory, we compared the inference pa-rameter updates given by IL, ∆θILq , to the inference parameter updates given by NVI∗, ∆θNVI
q , for a 4time-step stimulus sequence (Fig. 2a). To get good estimates of the mean and variance of these sampleparameter updates, we averaged over 106 different realizations of the network noise, and comparedthe samples using two measures. First, we considered the cosine similarity (normalized inner product)between the two empirical mean updates, ∆θ
IL
q = 1N
∑Nk=0 ∆θILq and ∆θ
NVI
q = 1N
∑Nk=0 ∆θNVI
q
(Fig. 2b), where cos(θ) ∈ [−1, 1], and cos(θ) < 0 in this case would indicate that the parameterupdates are anticorrelated. Because the NVI∗ update is unbiased, ie. E[∆θNVI
q ] = − ddθqL, as long
as we have averaged over a sufficient number of samples N , a positive cosine similarity acrosslearning between the IL update and the NVI∗ update (Fig. 2b) indicates that our update is aligned inexpectation to the true gradient of the loss, and hence will improve performance. This is a way ofempirically verifying that the bias we introduce in our derivation does not impair the learning process.
Having verified that the IL update and the true gradient are aligned on average, we next examinewhether the updates given by NVI∗ differ in terms of their signal-to-noise ratio (SNR) from the ILupdates, where we define the SNR as:
SNR(∆θq) =1
Nθ
Nθ∑i=0
(∆θ
(i)
q
)2S2(∆θ
(i)q )
, (19)
where S2(·) denotes the sample variance. This measure is an average across individual parameterupdates ∆θ(i), and it increases with
∥∥∆θq∥∥22
and decreases as the estimator variance grows. As Fig.2c shows, the SNR is many orders of magnitude lower for NVI∗ than for IL over learning, likelydue to the high estimator variance of the NVI∗, which we demonstrate analytically for a simpleexample in the Appendix C. The estimator variance has direct implications for the speed of learningand asymptotic performance, so that even though NVI∗ and IL can have parameter updates that arealigned in expectation, due to its low variance IL will greatly outperform NVI∗ during training.
We verified the generality of these benefits in the same task, as we variedNs, Nz andNr concurrently,so that Ns = 2Nz = 2Nr. We optimized learning rates for NVI∗, BP, and IL separately on the lowestdimensional condition by grid search across orders of magnitude (10−2, 10−3, etc.), and found thatNVI∗ performed worse over the entire range, while IL and BP showed similar performance (usingthe negative ELBO loss as a standard). Moreover, while NVI∗ showed worse performance as thestimulus dimension increased, this was not the case for IL or BP (Fig. 2d).
Phase duration effects The previous numerical results verify that IL is able to effectively learn agenerative model of artificial data, and to perform inference with respect to that model. However, for
7

1 01 0 1 10 200
−1.5
0.0
1.5
0 200−1.5
0.0
1.5
time steps
time steps
0.9
0.8
0.7
corr
elat
ion
duration = 2duration = 32
0 100ktime steps
2k
6k
10k
14k
phase duration5 30
loss
inferenceduration = 2
inferenceduration = 32
a c
b d
e
f
1 11 1 0 0
duration = 2
duration = 32
...
...
λ t
λ t
Figure 3: The effects of phase duration on dynamics and learning. a. Schematic of IL with aphase duration of 2 b. Same as a, but for a switch period of 32. c. Comparison of an example neuron’sactivity through time when the network is in inference mode (green, λt = 1) and when the network isalternating phase with duration 2 (blue); the random seed and stimuli are identical in both cases. d.Same as c, but for a phase duration of 32 (pink). e. The correlation across time between neurons ininference mode vs. while alternating phase, for identical random seeds. f. The negative ELBO lossfor a network trained with a phase duration of 2 (blue, solid line) or 32 (pink, dashed line).
IL to be a valid candidate for online learning in the brain, the learning process should not significantlyinterfere with perception. To test this, we explored how the ‘phase duration’ K affects the correlationbetween network activity in a simulation where λt = 1, ∀t, and a simulation where λt alternatesphases every K time steps (for a fixed random seed and stimulus sequence). If the learning processdid not interfere with perception at all, this correlation would be 1, and if it completely disruptedperception it would be 0, or even negative. In Fig. 3c and d, we show two example traces withK = 2 and K = 32, respectively, comparing the network in inference mode to the network duringlearning. While neural trajectories for the shorter phase durations are closely correlated, they deviateconsiderably for longer phase durations (Fig. 3c-e). Despite this, the loss profile (negative ELBO) isidentical. Since WS can be viewed as a special case of IL for very long phase durations (AppendixB.3; see Fig. S1a for an even longer phase duration), this implies that the two methods have similarperformance. However, IL operating in a mode of fast fluctuations between inference and generationmay be more biologically relevant, as this reduces the interference with perception without impairinglearning. Moreover, we found that lengthening the duration of the inference phase alone whilekeeping very short bursts of generative activity further reduced perceptual disturbance, while onlyslightly increasing the time required to learn (Fig. S1b-d).
Spoken digits task Having verified the performance of IL on artificial stimuli, we next tested itsperformance on higher-dimensional and more complex naturalistic stimuli. We used the training andtest sets of the Free Spoken Digits Dataset [36], which provides audio time series of humans speakingdigits 0-9.4 We transformed these time series into log-mel spectrograms as a coarse approximation ofthe initial stages of the human auditory system, shifted the inputs by a constant so as to make themall positive, and divided the result by the across-channel standard deviation. The results of Fig. 4 areshown in the original log-mel spectrogram input space.
To assess the hierarchical processing capabilities of IL, we added an additional feedforward layer tothe network architecture (Fig. 4a); we provide the details of how this modification affects simulationand parameter updates in Appendix D. To compare IL to NVI∗, we again optimized learning ratesvia grid search across orders of magnitude, and found that IL greatly outperformed NVI∗ when eachwas evaluated at its respective optimal learning rate (Fig. 4b). Furthermore, we observed that our
4The FSDD is available at https://github.com/Jakobovski/free-spoken-digit-dataset.
8

0 10 0 10-80 dB
-60 dB
-40 dB
-20 dB
0 20-80 dB
-60 dB
-40 dB
-20 dB
generation
stimulus
network
input
a b c
epoch num0 20
impressionNVI*
freq
uenc
y
time steps
input output
freq
uenc
y
time steps
generated
freq
uenc
y
d e f
loss
auto
corr
elat
ion
time lagfrequency frequency
1
0
106
105
1.0
0.0
0 40
stimulus generated
inferencegenerated
0 dB3100
1800
1100
500
0
3100
1800
1100
500
0
310018001100
5000
31000 31000
environment
Figure 4: Learning auditory sequences in a multilayer network. a. Hierarchical networkarchitecture. b. Test loss across epochs for IL (blue) and NVI∗ (purple). c. Comparison between anexample data input and the corresponding network output in inference mode (λt = 1). d. Samplenetwork output in generative mode (λt = 0). e. Across-frequency amplitude correlations for the data(left) and for network-generated samples (right). f. Auto-correlation function of a neuron in inferenceand generative modes.
trained network meets the same criteria for success as for our artificial stimuli, namely its stimulusreconstructions closely match the true stimulus while in inference mode (λt = 1 ∀t; Fig. 4c), andsample stimuli produced while the network is in generative mode (λt = 0 ∀t) qualitatively correspondto ground-truth stimuli (Fig. 4d), and quantitatively match the structure of both spatial (Fig. 4e) andtemporal (Fig. 4f) autocorrelation of the input. These results collectively demonstrate that IL iscapable of training neural representations of complex real-world stimuli. They also show that ILcan function when there is a mismatch between its architecture and the structure of environmentallatent variables, which are in this case unknown. In general, learning may fail if the chosen networkarchitecture is too restrictive.
4 Discussion
Impression learning (IL) provides a potential mechanism for the brain to learn generative modelsof its sensory inputs through local synaptic plasticity, while concurrently performing approximateinference with respect to these models. IL is a direct generalization of the Wake-Sleep algorithm [29],which replaces lengthy offline ‘Sleep’ phases with brief substitutions of network-generated samplesin place of incoming data, in a way that minimally perturbs natural neural trajectories. Transitionsbetween ‘inference mode’ and ‘generative mode’ are controlled by a global signal λt, which decideswhether generative signals to the apical synapses or inference signals to the basal synapses dominatenetwork activity.
Computationally, IL outperforms NVI∗ [30, 31], a particular instance of three-factor plasticity [37],because its internal model provides explicit ‘credit assignment’ for each individual neuron, ratherthan implicitly calculating it via correlations between neural activity and a global reward signal. Thisleads to lower-variance gradient estimates and faster learning. Alternative learning algorithms such asbackpropagation (through time) [38] are not intrinsically probabilistic, but can be used for optimizingprobabilistic objectives. Like IL, BP provides explicit credit assignment, but the parameter updates itprovides are nonlocal across both network layers and time. It is worth noting that IL was developedin a purely unsupervised learning setting, whereas both BP and NVI∗ extend to supervised andreinforcement learning [39, 40]. In the context of supervised learning, several biologically-plausibleapproximations to BP leverage the apical-basal dendritic structure of pyramidal neurons to learn
9

[25, 21], based primarily on target-propagation [41] or its variants [42]. It would be valuable toexplore the combination of such extensions with the continuous online learning capabilities of IL.
Local computations are considered a necessary condition for learning algorithms to be biologically-plausible. In our framework, locality is enforced through the structure of the internal graphical model(pm) and the approximate inference distribution (q): any choice of neural network architecture withindependent noise will guarantee local plasticity. Our framework is relatively agnostic to the details:neurons could be either rate-based with Gaussian intrinsic noise (as in the examples presented here),or generate spikes with Poisson variability, which would result in synaptic updates analogous toempirically observed spike-timing-dependent plasticity, as found in generalizations of WS [14]. Itwould also be possible to make distinctions between excitatory and inhibitory neurons, by requiringall outgoing synapses from individual neurons to be either positive or negative, or to include morecomplex dendritic arborizations, as have been explored in recent experimental [43] and modeling[44] efforts. Our current model enforces hard, global phase distinctions (λt ∈ {0, 1} for all neurons),which could potentially correspond to alternations between activity driven by apical dendritic calciumevents and basal spiking tied to theta oscillations in the hippocampus [32]. However, cortical dataindicate that input to apical and basal dendrites contribute concurrently and constructively to spikingactivity [45]. We are currently working to extend our derivation to these circumstances, by allowingλt to be non-binary and heterogenous across neurons.
Traditional predictive coding [7] requires steady-state assumptions for learning, meaning that neuraldynamics must occur on a timescale much faster than that of stimuli. In contrast, IL requires amechanism by which the relative influence of the apical and basal dendrites of pyramidal neuronscan be rapidly switched, along with learning mechanisms that operate at that timescale. If such amechanism could be experimentally identified and controlled, our model makes the specific predictionthat increasing the dominance of apical dendritic input on neural activity (λt ≈ 1) would causethe network to sample from its generative model, i.e. the manipulation will induce structuredhallucinations that mimic realistic stimuli (and associated neural activity), without being tied tothe sensory world. One candidate gating mechanism is rapid inhibition targeting apical dendritesspecifically [46–49]; but much work remains to explicitly relate this mechanism to learning andplasticity.
IL predicts that synapses will use an error signal based on the difference between local dendriticcompartmental currents (either apical or basal) and the neuron’s total firing rate to perform learning.There is some evidence that spiking activity driven by apical inputs to pyramidal neurons can induceplasticity at basal synapses [32, 50], and several studies have found systematic changes in synapticplasticity between apical and basal synapses, in particular the sign changes induced by local dendriticinputs that IL predicts [51–54]. Hence, IL has the potential to explain the diversity of plasticityphenomena observed experimentally and inform future experiments.
Acknowledgments and Disclosure of Funding
We thank Camille Rullán Buxó, Caroline Haimerl, Owen Marschall, Pedro Herrero-Vidal, SiavashGolkar, David Lipshutz, Yanis Bahroun, Tiberiu Tesileanu, Eilif Muller, Blake Richards, GuillaumeLajoie, Maximilian Puelma Touzel, and Alexandre Payeur for helpful discussions and feedback onearlier versions of this manuscript. We gratefully acknowledge the Howard Hughes Medical Instituteand the Simons Foundation for their support of this work. CS is supported by National Institute ofMental Health Award 1R01MH125571-01, by the National Science Foundation under NSF AwardNo.1922658 and a Google faculty award.
10

References[1] David C Knill and Whitman Richards. Perception as Bayesian inference. Cambridge University
Press, 1996.[2] Yair Weiss, Eero P Simoncelli, and Edward H Adelson. Motion illusions as optimal percepts.
Nature neuroscience, 5(6):598–604, 2002.[3] Pascal Mamassian, Michael Landy, and Laurence T Maloney. Bayesian modelling of visual
perception. Probabilistic models of the brain, pages 13–36, 2002.[4] Daniel Kersten, Pascal Mamassian, and Alan Yuille. Object perception as Bayesian inference.
Annu. Rev. Psychol., 55:271–304, 2004.[5] József Fiser, Pietro Berkes, Gergo Orbán, and Máté Lengyel. Statistically optimal perception and
learning: from behavior to neural representations. Trends in cognitive sciences, 14(3):119–130,2010.
[6] Richard D Lange, Sabyasachi Shivkumar, Ankani Chattoraj, and Ralf M Haefner. Bayesianencoding and decoding as distinct perspectives on neural coding. bioRxiv, 2020.
[7] Rajesh PN Rao and Dana H Ballard. Predictive coding in the visual cortex: a functionalinterpretation of some extra-classical receptive-field effects. Nature neuroscience, 2(1):79–87,1999.
[8] Deep Ganguli and Eero P Simoncelli. Efficient sensory encoding and Bayesian inference withheterogeneous neural populations. Neural computation, 26(10):2103–2134, 2014.
[9] Diederik P Kingma and Max Welling. Auto-encoding variational Bayes. arXiv preprintarXiv:1312.6114, 2013.
[10] Danilo Jimenez Rezende, Shakir Mohamed, and Daan Wierstra. Stochastic backpropagationand approximate inference in deep generative models. In International conference on machinelearning, pages 1278–1286. PMLR, 2014.
[11] Peter Dayan, Geoffrey E Hinton, Radford M Neal, and Richard S Zemel. The Helmholtzmachine. Neural computation, 7(5):889–904, 1995.
[12] Stefan Habenschuss, Johannes Bill, and Bernhard Nessler. Homeostatic plasticity in Bayesianspiking networks as Expectation Maximization with posterior constraints. Advances in neuralinformation processing systems, 25:773–781, 2012.
[13] Johannes Bill, Lars Buesing, Stefan Habenschuss, Bernhard Nessler, Wolfgang Maass, andRobert Legenstein. Distributed Bayesian computation and self-organized learning in sheets ofspiking neurons with local lateral inhibition. PloS one, 10(8):e0134356, 2015.
[14] Peter Dayan and Geoffrey E Hinton. Varieties of Helmholtz machine. Neural Networks,9(8):1385–1403, 1996.
[15] Anna Kutschireiter, Simone Carlo Surace, Henning Sprekeler, and Jean-Pascal Pfister. NonlinearBayesian filtering and learning: a neuronal dynamics for perception. Scientific reports, 7(1):1–13, 2017.
[16] David Kappel, Bernhard Nessler, and Wolfgang Maass. STDP installs in winner-take-all circuitsan online approximation to hidden markov model learning. PLoS Comput Biol, 10(3):e1003511,2014.
[17] Konrad P Körding and Peter König. Supervised and unsupervised learning with two sites ofsynaptic integration. Journal of computational neuroscience, 11(3):207–215, 2001.
[18] Robert Urbanczik and Walter Senn. Learning by the dendritic prediction of somatic spiking.Neuron, 81(3):521–528, 2014.
[19] Mathieu Schiess, Robert Urbanczik, and Walter Senn. Somato-dendritic synaptic plasticity anderror-backpropagation in active dendrites. PLoS computational biology, 12(2):e1004638, 2016.
[20] Joao Sacramento, Rui Ponte Costa, Yoshua Bengio, and Walter Senn. Dendritic error backprop-agation in deep cortical microcircuits. arXiv preprint arXiv:1801.00062, 2017.
[21] Jordan Guerguiev, Timothy P Lillicrap, and Blake A Richards. Towards deep learning withsegregated dendrites. ELife, 6:e22901, 2017.
[22] Blake A Richards and Timothy P Lillicrap. Dendritic solutions to the credit assignment problem.Current opinion in neurobiology, 54:28–36, 2019.
11

[23] Siavash Golkar, David Lipshutz, Yanis Bahroun, Anirvan M Sengupta, and Dmitri B Chklovskii.A biologically plausible neural network for local supervision in cortical microcircuits. arXivpreprint arXiv:2011.15031, 2020.
[24] Siavash Golkar, David Lipshutz, Yanis Bahroun, Anirvan Sengupta, and Dmitri Chklovskii. Asimple normative network approximates local non-hebbian learning in the cortex. Advances inNeural Information Processing Systems, 33, 2020.
[25] Alexandre Payeur, Jordan Guerguiev, Friedemann Zenke, Blake A Richards, and Richard Naud.Burst-dependent synaptic plasticity can coordinate learning in hierarchical circuits. Natureneuroscience, pages 1–10, 2021.
[26] James M Murray. Local online learning in recurrent networks with random feedback. ELife,8:e43299, 2019.
[27] Owen Marschall, Kyunghyun Cho, and Cristina Savin. A unified framework of online learningalgorithms for training recurrent neural networks. Journal of machine learning research, 2020.
[28] Yann LeCun, Bernhard Boser, John S Denker, Donnie Henderson, Richard E Howard, WayneHubbard, and Lawrence D Jackel. Backpropagation applied to handwritten zip code recognition.Neural computation, 1(4):541–551, 1989.
[29] Geoffrey E Hinton, Peter Dayan, Brendan J Frey, and Radford M Neal. The "wake-sleep"algorithm for unsupervised neural networks. Science, 268(5214):1158–1161, 1995.
[30] Rajesh Ranganath, Sean Gerrish, and David Blei. Black box variational inference. In Artificialintelligence and statistics, pages 814–822. PMLR, 2014.
[31] Andriy Mnih and Karol Gregor. Neural variational inference and learning in belief networks. InInternational Conference on Machine Learning, pages 1791–1799. PMLR, 2014.
[32] Katie C Bittner, Christine Grienberger, Sachin P Vaidya, Aaron D Milstein, John J Macklin,Junghyup Suh, Susumu Tonegawa, and Jeffrey C Magee. Conjunctive input processing drivesfeature selectivity in hippocampal ca1 neurons. Nature neuroscience, 18(8):1133–1142, 2015.
[33] Stefano Fusi, Patrick J Drew, and Larry F Abbott. Cascade models of synaptically storedmemories. Neuron, 45(4):599–611, 2005.
[34] Claudia Clopath, Lorric Ziegler, Eleni Vasilaki, Lars Büsing, and Wulfram Gerstner. Tag-trigger-consolidation: a model of early and late long-term-potentiation and depression. PLoScomputational biology, 4(12):e1000248, 2008.
[35] Justin Werfel, Xiaohui Xie, and H Sebastian Seung. Learning curves for stochastic gradientdescent in linear feedforward networks. In NIPS, pages 1197–1204. Citeseer, 2003.
[36] Zohar Jackson, César Souza, Jason Flaks, Yuxin Pan, Hereman Nicolas, and Adhish Thite.Jakobovski/free-spoken-digit-dataset: v1. 0.8, 2018.
[37] Nicolas Frémaux and Wulfram Gerstner. Neuromodulated spike-timing-dependent plasticity,and theory of three-factor learning rules. Frontiers in neural circuits, 9:85, 2016.
[38] Paul J Werbos. Backpropagation through time: what it does and how to do it. Proceedings ofthe IEEE, 78(10):1550–1560, 1990.
[39] Volodymyr Mnih, Koray Kavukcuoglu, David Silver, Andrei A Rusu, Joel Veness, Marc GBellemare, Alex Graves, Martin Riedmiller, Andreas K Fidjeland, Georg Ostrovski, et al.Human-level control through deep reinforcement learning. nature, 518(7540):529–533, 2015.
[40] Ronald J Williams. Simple statistical gradient-following algorithms for connectionist reinforce-ment learning. Machine learning, 8(3-4):229–256, 1992.
[41] Yoshua Bengio. How auto-encoders could provide credit assignment in deep networks via targetpropagation. arXiv preprint arXiv:1407.7906, 2014.
[42] Dong-Hyun Lee, Saizheng Zhang, Asja Fischer, and Yoshua Bengio. Difference target propaga-tion. In Joint European conference on machine learning and knowledge discovery in databases,pages 498–515. Springer, 2015.
[43] Shannon K Rashid, Victor Pedrosa, Martial A Dufour, Jason J Moore, Spyridon Chavlis,Rodrigo G Delatorre, Panayiota Poirazi, Claudia Clopath, and Jayeeta Basu. The dendriticspatial code: branch-specific place tuning and its experience-dependent decoupling. bioRxiv,2020.
12

[44] Eren Sezener, Agnieszka Grabska-Barwinska, Dimitar Kostadinov, Maxime Beau, SanjuktaKrishnagopal, David Budden, Marcus Hutter, Joel Veness, Matthew Botvinick, Claudia Clopath,et al. A rapid and efficient learning rule for biological neural circuits. bioRxiv, 2021.
[45] Matthew E Larkum, J Julius Zhu, and Bert Sakmann. A new cellular mechanism for couplinginputs arriving at different cortical layers. Nature, 398(6725):338–341, 1999.
[46] Matthew Larkum. A cellular mechanism for cortical associations: an organizing principle forthe cerebral cortex. Trends in neurosciences, 36(3):141–151, 2013.
[47] Ausra Saudargiene, Stuart Cobb, and Bruce P Graham. A computational study on plasticityduring theta cycles at Schaffer collateral synapses on CA1 pyramidal cells in the hippocampus.Hippocampus, 25(2):208–218, 2015.
[48] Ines Guerreiro, Zhenling Gu, Jerrel Yakel, and Boris Gutkin. Disinhibitory and neuromodulatoryregulation of hippocampal synaptic plasticity. bioRxiv, 2020.
[49] Richardson N Leão, Sanja Mikulovic, Katarina E Leão, Hermany Munguba, Henrik Gezelius,Anders Enjin, Kalicharan Patra, Anders Eriksson, Leslie M Loew, Adriano BL Tort, et al. Olminterneurons differentially modulate ca3 and entorhinal inputs to hippocampal CA1 neurons.Nature neuroscience, 15(11):1524–1530, 2012.
[50] Katie C Bittner, Aaron D Milstein, Christine Grienberger, Sandro Romani, and Jeffrey C Magee.Behavioral time scale synaptic plasticity underlies ca1 place fields. Science, 357(6355):1033–1036, 2017.
[51] Robert C Froemke, Mu-ming Poo, and Yang Dan. Spike-timing-dependent synaptic plasticitydepends on dendritic location. Nature, 434(7030):221–225, 2005.
[52] Per Jesper Sjöström and Michael Häusser. A cooperative switch determines the sign of synapticplasticity in distal dendrites of neocortical pyramidal neurons. Neuron, 51(2):227–238, 2006.
[53] Johannes J Letzkus, Björn M Kampa, and Greg J Stuart. Learning rules for spiketiming-dependent plasticity depend on dendritic synapse location. Journal of Neuroscience,26(41):10420–10429, 2006.
[54] Robert C Froemke, Johannes J Letzkus, Bjorn Kampa, Giao B Hang, and Greg Stuart. Dendriticsynapse location and neocortical spike-timing-dependent plasticity. Frontiers in synapticneuroscience, 2:29, 2010.
13

Impression learning: Online representation learningwith synaptic plasticity
–Appendices–
Colin BredenbergCenter for Neural Science
New York [email protected]
Benjamin S. H. LyoCenter for Neural Science
New York [email protected]
Eero P. SimoncelliCenter for Neural Science,
New York UniversityFlatiron Institute, Simons Foundation
Cristina SavinCenter for Neural Science,
Center for Data ScienceNew York [email protected]
A Bias calculation
Our derivation of the update for IL (Eq. 3) is based on an expansion of log pθqθ
about pθqθ = 1:∫ [log
pθqθ
](∇θ log qθ)qθ drds =
∫ [pθqθ− 1
](∇θ log qθ)qθ drds (S1)
− 1
2
∫ [ ( pθqθ − 1)
1 + ε(r, s)
]2
(∇θ log qθ)qθ drds,
for some ε(r, s) st. |ε(r, s)| < | pq − 1|. Note that this is not a truncated Taylor series approximation –we are instead using Taylor’s theorem, and the second term provides an exact expression for the bias.We can use the Caucy-Schwartz inequality for expectations to bound this as follows:
|bias| = 1
2
∣∣∣∣∣∣∫ [ ( pθqθ − 1)
1 + ε(r, s)
]2
(∇θ log qθ)qθ drds
∣∣∣∣∣∣≤ 1
2
√√√√∫ [ ( pθqθ − 1)
1 + ε(r, s)
]4
qθ drds
√∫(∇θ log qθ)2qθ drds, (S2)
We examine the consequences of this bias formula for our specific model. Consider the component ofthe gradient with respect to the feedforward weight W(ij):
d
dW (ij)log qθ =
∑t
λt(σinfr )2
(r(i)t − f(Wst)
(i))f ′(Wst)(i)s
(j)t .
Note that f(·) < 1 and f ′(·) < 1 for the tanh function, and assume that (s(j)t )2 < S ∀t for some
constant S. Defining B =
√∫ [ (pθqθ−1)
1+ε(r,s)
]4
qθ drds, and substituting the gradient component gives:
35th Conference on Neural Information Processing Systems (NeurIPS 2021).

|bias| ≤ B
2
√√√√∫ (∑t
λt(σinfr )2
(r(i)t − f(Wst)(i))f ′(Wst)(i)s
(j)t
)2
qθ drds
=B
2
√∫ ∑t
∑t′
λtλt′
(σinfr )4
(r(i)t − f(Wst)(i))(r
(i)t′ − f(Wst′)(i))f ′(Wst)(i)f ′(Wst′)(i)s
(j)t s
(j)t′ qθ drds
=B
2
√∫ ∑t
λ2t
(σinfr )4
(r(i)t − f(Wst)(i))2(f ′(Wst)(i)s
(j)t )2qθ drds,
where this second equality follows from the fact that r(i)t − f(Wst)
(i) ∼ N (0, σinfr ) without
any temporal correlation, so that E[(r
(i)t − f(Wst)
(i))(r(i)t′ − f(Wst′)
(i))]r|s
= 0 for t 6= t′.
Continuing our derivation, we have:
|bias| ≤ B
2
√∑t
λ2t
(σinfr )4
∫(r
(i)t − f(Wst)(i))2(f ′(Wst)(i)s
(j)t )2qθ(r, s) drds
=B
2
√∑t
λ2t
(σinfr )2
∫(f ′(Wst)(i)s
(j)t )2qθ(s) ds
≤ B
2
√S
(σinfr )2
∑t
λ2t
=B
2
√ST
2(σinfr )2
, (S3)
where T is the total time. Thus, for our particular choice of neural model, the bias is proportional toB, which vanishes as performance improves. Note that the update term in Eq. (S1) is O(| pq − 1|), soits magnitude is expected to be much larger than the bias in the vicinity of a global optimum. The√T/(σinf
r )2 proportionality constant also should not be a cause for concern: the gradient itself scaleswith T/(σinf
r )2, and thus small values of (σinfr )2 will not make the relative error explode.
B Comparison to other algorithms
In this section, we explore the relationships between impression learning (IL) and other stochasticlearning algorithms. Specifically, we consider a variant of neural variational inference (NVI∗),backpropagation (BP), and Wake-Sleep (WS).
B.1 Neural Variational Inference
Neural variational inference is a learning algorithm for neural networks that optimizes the evidencelower bound (ELBO) objective function. Here, we modify the algorithm by incorporating our novelloss (Eq. 2), producing a variant that we call NVI∗. We first take the derivative of our loss, withoutapproximations. These steps are identical to the initial steps in our derivation of IL, up to the Taylorexpansion:
−∇θL =−∇θEλ,z[∫
[log qθ − log pθ] qθ drds
]=− Eλ,z
[∫[∇θ(log qθ − log pθ)] qθ drds +
∫[log qθ − log pθ]∇θ qθ drds
]=− Eλ,z
[∫[∇θ log qθ −∇θ log pθ] qθ drds +
∫[log qθ − log pθ] (∇θ log qθ)qθ drds
]=Eλ,z
[∫[∇θ log pθ] qθ drds +
∫ [log
pθqθ
](∇θ log qθ)qθ drds
](S4)
2

Updates calculated by these samples will be unbiased in expectation, because there are no approxima-tions. However, we will show in Appendix C that these updates may have high variance.
To provide a fair comparison to IL, we have added two additional features that have been shown toreduce the variance of sample estimates [1, 2]. The first involves subtracting a control variate fromour second term:
−∇θL = Eλ,z[∫
[∇θ log pθ] qθ drds +
∫ (log
pθqθ− E
[log
pθqθ
])(∇θ log qθ)qθ drds
]. (S5)
The subtracted term, E[log pθ
qθ
] ∫(∇θ log qθ)qθ drds, is zero because it is a constant times the
expectation of the score function. As such, it keeps the weight updates unbiased, but can stillsignificantly reduce the variance.
The original NVI method employs a dynamic baseline estimated with a neural network as a functionof inputs s. It is likely that this more flexible control variate can further reduce the variance ofparameter estimates beyond the baseline that we explore here. However, this baseline was trainedwith backpropagation, and as such, would not provide a biologically-plausible comparison. We canapproximate Eq. S5 by summing over samples from qθ, and updating our weights at every time point:
∆θ ∝ [∇θ log pt(rt, st; θ)] +
[log
ptqt− L
] t∑s=0
(∇θ log qt(rt, st; θ))
∝ [∇θ log pt(rt, st; θ)] +
[log
ptqt− L
]gθ, (S6)
where L is approximated online according to a running average of the loss at each time step, and gθ,called an ‘eligibility trace’ [3], is computed by a running integral. These quantities are both computedonline as follows:
Lt = γL logptqt
+ (1− γL)Lt−1 (S7)
gθt = ∇θ log qt(rt, st; θ) + γggθt−1, (S8)
where γL � 1, so that Lt is a weighted average of past losses. If we want an unbiased estimate ofthe gradient, then we would take γg = 1, so that gθt =
∑ts=0(∇θ log qt(rt, st; θ)). However, the
variance of this eligibility trace grows without bound as T →∞, which makes online learning usingthis algorithm nearly impossible without approximation. For this reason, we take γe as a constantless than, but close to 1 when we compare NVI∗ to IL performance, which introduces a small bias,with the benefit of allowing for online learning. This is a technique commonly employed in thethree-factor plasticity literature [4, 5], and can be thought of as an analog to temporal windowing inbackpropagation through time [6]. For our numerical gradient comparisons (Fig. 2), however, weused a short number of time steps, but took γg = 1 to remove all bias.
This method of differentiation is particularly important to compare to IL, because it can be thought ofas a three-factor synaptic plasticity rule, where for a neural network, the parameter update becomes aglobal ‘loss’ signal log pt
qt− L combined with synaptically local terms gθ and ∇θ log pt(rt, st; θ),
the second of which comprises the entirety of the IL update. Typically for reinforcement learning,the global ‘reward’ signal is justified by referencing neuromodulatory signals that project broadly tosynapses throughout the cortex and carry information about reward [7, 4, 8, 9]. However, the originsof the global ‘loss’ in our unsupervised case are unclear. Furthermore, as we show in AppendixC, the term
[log pt
qt− L
]gθ is high variance, and requires orders of magnitude more samples (or
lower learning rates) in order to get a useful gradient estimate. A technical way of viewing ourcontribution in this paper is that we have shown that the
[log pt
qt− L
]gθ term is largely redundant
and unnecessary for effective learning on our unsupervised objective, and that discarding it producessubstantial performance increases while allowing the parameter update to remain a completely localsynaptic plasticity rule for neural networks.
B.2 Backpropagation
Backpropagation (BP) cannot be performed for stochastic variables rt, because under an expectation,these are integration variables with no explicit dependency on any parameters. For this reason, when
3

computing a derivative of our loss using NVI∗, we differentiate the probability distribution, whichdepends on network parameters. However, as we will show below, this straightforward methodcan result in high variance parameter estimates. The classical alternative to NVI∗ is to perform the‘reparameterization trick,’ in which a change of variables allows the use of stochastic gradient descentwith BP. This trick is largely responsible for the success of the variational autoencoder [10, 11],though it is well known that BP does not produce synaptically local parameter updates. Here, weuse BP as an upper bound for comparison, with the understanding that local learning algorithms areunlikely to be able to completely match its performance. Below, we review its calculation, startingwith changing our variable of integration.
It is worth noting that this ‘reparameterization’ will work only for additive Gaussian noise. As such,applying BP to our network will only be possible for a restricted set of noise models, and can failin particular for Poisson-spiking network models, where IL, NVI∗, and WS will not. For each timepoint, we define ηt = rt − rqt (θ, λ,η0:t−1, ξ0:t−1), where rqt (θ, λ,η0:t−1, ξ0:t−1) is the mean firingrate conditioned on noise, stimulus, and λ values from previous time steps (given by q). Similarly,we define ξt = st − sqt (θ, λ,η0:t−1, ξ0:t−1). This defines ηt and ξt as the noise added on top ofevery firing rate and stimulus at time t. Instead of integrating over the rates and stimuli, we integrateover these fluctuations, replacing each instance of rt with rqt (θ, λ,η0:t−1, ξ0:t−1) + ηt and st withsqt (θ, λ,η0:t−1, ξ0:t−1) + ξt. We will refer to the mean parameters of pθ where these substitutionshave been made as rpt (θ, λ,η0:t−1, ξ0:t−1) and sqt (θ, λ,η0:t−1, ξ0:t−1). Our new random variableshave the probability distributions: p(ηt) = N (0, λtσ
infr + (1−λt)σgen
r ) and p(ξt) = N (0, λtσinfs +
(1− λt)σgens ). Performing our change of variables gives:
−∇θL =−∇θ∫
[log qθ − log pθ] qθ drds
=−∇θ∫ [
log∏t
1
Zexp(
−η2t
2(λtσinfs + (1− λt)σgen
s )2)
]p(η, ξ) dηdξ
−∇θ∫ [
log∏t
1
Zexp(
−ξ2t
2(λtσinfs + (1− λt)σgen
s )2)
]p(η, ξ) dηdξ
+∇θ∫ [
log∏t
1
Zexp(
−(rqt + ηt − rpt )2
2((1− λt)σinfr + λtσ
genr )2
)
]p(η, ξ) dηdξ
+∇θ∫ [
log∏t
1
Zexp(
−(sqt + ξt − spt )2
2((1− λt)σinfs + λtσ
gens )2
)
]p(η, ξ) dηdξ
=Eη,ξ
[∇θ∑t
− (rqt (θ,η, ξ) + ηt − rpt (θ,η, ξ))2
2((1− λt)σinfr + λtσ
genr )2
− (sqt (θ,η, ξ) + ξt − spt (θ,η, ξ))2
2((1− λt)σinfs + λtσ
gens )2
],
(S9)
where the last equality follows from the fact that ηt and ξt have no dependence on the networkparameters. Now, the parameter dependence is contained in rqt , r
pt , sqt , and spt , all of which depend
on the mean firing rates at each previous time step: using BP to compute the gradients of thesemean parameters leads to nonlocal updates, which is the key reason BP is a biologically-implausiblealgorithm [12]. For our simulations, we set λt = 1 ∀t, so that our parameter updates were equivalentto minimizing the negative ELBO, and gradients were computed using Pytorch [13]. In subsequentsections, we will show that weight updates computed using samples from this expectation willgenerally have much lower variance than NVI∗.
B.3 Wake-Sleep
As already mentioned, WS can be viewed as a special case of IL. To show this, we can take λt = λ0 ∀t,with p(λ0 = 0) = p(λ0 = 1) = 0.5 (for IL, λt alternates with phase duration K = 2). For this
4

choice of λ, we follow our IL derivation (Eq. 5), and get:
−∇θL ≈ 2Eλ0,z
[∫ [∑t
(1− λt)∇θ log qt + (λt)∇θ log pmt
]qθ drds
]
= Ez
[∫ [∑t
∇θ log qt
]pm(r, s) drds +
∫ [∑t
∇θ log pmt
]q(r|s)p(s|z) drds
].
(S10)
Since WS is a special case of IL, the bias properties of its individual samples are identical. However,typically WS weight updates are computed coordinate-wise, updating parameters for pm and qseparately, whose updates are computed after averaging over many samples. This can lead to behaviorthat approximates the EM algorithm under restrictive conditions, a fact that is used in the proofs ofconvergence of the WS algorithm for simple models [14]. Because our algorithm does not performcoordinate descent, it is best viewed as an approximation to gradient descent with a well-behavedbias, rather than an approximation of the EM algorithm.
The WS parameter updates can also be interpreted as synaptic plasticity at apical and basal dendritesof pyramidal neurons, as with IL. The key difference is that WS requires lengthy phases whereλt = 1 ∀t (Wake) and where λt = 0 ∀t (Sleep). The requirement that the network remain in agenerative state while training the inference parameters θq would require a biological organism toexplicitly hallucinate while training its parameters. Though such generative states may be possible insome restricted form, and WS could perfectly coexist with IL in a biological organism, we believethe more general perspective afforded by IL is much more likely to correspond to biology than thephase distinctions required by WS. The benefits to perceptual continuity given by IL over WS comefrom its ability to leverage temporal predictability in both network states and stimuli by only stayingin a generative state for a brief period of time. However, for static images and neural architectures, ILand WS are much more similar, effectively amounting to different schedules for updating generativeand inference parameters in alternating sequence.
C Estimator variance
In Appendix A, we explored the bias introduced by the approximations used in the derivation of IL.Here, we consider the variance of sample weight updates, and compare to the variability of samplesobtained from more standard methods, in particular BP and NVI∗, whose sampling-based estimateshave can have very different variances [11].
To keep the analysis tractable, we will study a simple example: maximizing our modified KL diver-gence between two time series composed of temporally-uncorrelated univariate normal distributionswith identical variance and different means: p(rt) ∼ N (µp, σ
2), q(rt) ∼ N (µq, σ2). We define λt
such that p(λt = 0) = p(λt = 1) = 0.5 ∀t. This produces the two hybrid distributions:
p(r|λt) =
T∏t=0
p(rt)λtq(rt)
(1−λt) (S11)
q(r|λt) =
T∏t=0
p(rt)(1−λt)q(rt)
λt . (S12)
Using these hybrid distributions, we can write our objective function as:
L = Eλt [KL(q||p)] =
∫ [∫(log q(r|λt)− log p(r|λt))q(r|λt)dr
]p(λt)dλt. (S13)
We will show that our three methods: NVI∗, BP, and IL (which here will coincide exactly with WS),all produce unbiased stochastic gradient estimates, with very different variance properties.
It is worth explicitly outlining why variance is such an important quantity for stochastic gradientestimates. Suppose we obtain N independent samples of a weight update ∆µq , and want to compute
5

the MSE of our estimated weight update to the true gradient, in expectation over samples:
MSE(∆µq) = E∆µ
(n)q
(− d
dµqL − 1
N
N∑n=0
∆µ(n)q
)2
=
(− d
dµqL − E
∆µ(n)q
[1
N
N∑n=0
∆µ(n)q
])2
+ V ar
[1
N
N∑n=0
∆µ(n)q
]. (S14)
Here, the equality follows from bias-variance decomposition of the mean-squared error. In our toyexample (but not in general) the biases for IL, BP, and NVI∗ will all be 0. This gives:
MSE(∆µq) = V ar
[1
N
N∑n=0
∆µ(n)q
]=V ar
[∆µ
(n)q
]N
. (S15)
Suppose we want the mean-squared error to be less than some value ε� 1. How many samples (N )do we need to take to bring ourselves below this error on average? We have:
V ar[∆µ
(n)q
]N
< ε ⇒V ar
[∆µ
(n)q
]ε
< N. (S16)
This means that increases in the variance of a weight estimate require proportionate increases in thenumber of samples required to reduce the error of the estimate. In practice, this requires high variancemethods to process more data and to have lower learning rates, in some cases by several orders ofmagnitude. Even if a stochastic weight update is ‘local’ in a biologically-plausible sense, it may stillrequire so much data for learning to occur as to be completely impractical.
C.1 Comparing Variances
Analytic variance calculations are only possible for the simplest of examples, but the intuitions theyprovide are nevertheless valuable. In the sections that follow, we will show that samples from all threemethods have exactly the same expectation (the ‘signal’), but only IL and BP agree on their variance,while NVI∗ typically has much higher variance. For univariate normal distributions with identicalvariance, the loss L = Eλ [KL(q||p)] = KL[q||p] = T (µp − µq)2/2σ2. Writing the variances interms of the loss, we have:
V arIL = V arBP =T
σ2(S17)
V arNVI =T
2σ2+L
8σ2(3T + 5) (S18)
This shows that for the most part, IL and BP hugely outperform NVI∗. However, it is possible forNVI∗ to outperform these methods in the limit as L → 0 (a regime only achieved after successfuloptimization). Here, as with our numerical results, we have incorporated two methods that partiallyameliorate the high variance of the NVI∗ estimate, which for reasonably low-dimensional tasks, canstill allow it to perform comparably to BP; however, NVI∗ is unlikely to scale well to high dimensions,even with these additions. The purpose for our analysis is to show that these high variance difficultiesdo not apply to IL, whose scaling properties are much closer to BP.
C.2 Backpropagation
Expectation We will focus only on ddµq
for simplicity. Because the entropy of q is constant withrespect to the mean µq, we don’t have to worry about the second term in the objective function.Instead, we focus on:
− d
dµqL =
d
dµq
∫ [∫(log p(r|λ))q(r|λ)dr
]p(λ)dλ
=d
dµq
∑t
[∫1
2(log p(rt))q(rt)drt +
∫1
2(log q(rt))p(rt)drt
]= − d
dµq
∑t
[∫1
4σ2((rt − µp)2)q(rt)drt +
∫1
4σ2((rt − µq)2)p(rt)drt
]. (S19)
6

At this point, we employ the ‘reparameterization trick,’ which reduces the variance of the weightupdate relative to NVI∗. For the first integral we use the change of variables rt = µq + ηt, and forthe second integral we use the change of variables rt = µp + ηt, where ηt ∼ N (0, σ2). This gives:
− d
dµqL = − d
dµq
T∑t=0
[∫1
4σ2((µq + ηt − µp)2)p(ηt)dηt +
∫1
4σ2((µp + ηt − µq)2)p(ηt)dηt
]
= − d
dµq
T∑t=0
∫1
2σ2((µq + ηt − µp)2)p(ηt)dηt
=
T∑t=0
∫1
σ2(µp + ηt − µq)p(ηt)dηt. (S20)
Computing this expectation analytically, we have: − ddµqL = T
σ2 (µp−µq), which is unbiased, becausewe have not employed any approximations. If we were to compute this expectation using samplesfrom p(ηt), each individual parameter update would be given by ∆µq ∝
∑Tt=0
1σ2 (µp + ηt − µq) for
a given sample from η. Given our expected weight update, we now ask for the variance.
Variance The variance of a sample,∑Tt=0
1σ2 (µp + ηt − µq), is given by:
V ar(∆µq) =
∫ (1
σ2(
T∑t=0
(µp + ηt − µq − (µp − µq)))
)2
p(ηt)dηt
=
∫ T∑t=0
η2t
σ4p(ηt)dηt
=T
σ2. (S21)
C.3 Impression learning
Expectation We can use our previous derivation of the IL weight update to write:
− d
dµqL ≈ 2
T∑t=0
[∫ [(1− λt)
d
dµqlog q(rt) + (λt)
d
dµqlog p
]q(rt|λt)drt
]p(λt)dλt
= 2
T∑t=0
[∫(1− λt)
d
dµqlog q(rt)]q(rt|λ)drt
]p(λt)dλt
=
T∑t=0
∫d
dµqlog q(rt)p(rt)drt (S22)
where this last equality follows from the fact that q(rt|λ) = p(rt) whenever 1− λt = 1. Continuingour derivation by substituting in log q(rt) and discarding constants, we have:
− d
dµqL ≈
T∑t=0
∫− d
dµq
1
2σ2(rt − µq)2p(rt)drt
=
T∑t=0
∫1
σ2(rt − µq)p(rt)drt. (S23)
Computing this expectation analytically gives: − ddµqL ≈ T
σ2 (µp−µq). Interestingly, in this case, theexpected weight update coincides directly with the update given by BP, meaning that for this contrivedexample, IL is unbiased. This is clearly not the case in general, but works because our simplifiednetwork has no temporal interdependencies between variables and lacks hierarchical structure. Infact, the IL update also directly corresponds to the WS update in this case for the same reason. Aswith BP, we can ask about the variance of an individual sample of an update given by IL, assuming∆µq ∝
∑Tt=0
1σ2 (rt − µq).
7

Variance The variance of a sample,∑Tt=0
1σ2 (rt − µq), is given by:
V ar(∆µq) =
∫ (1
σ2(
T∑t=0
rt − µq − (µp − µq))
)2
p(rt)drt
=
∫1
σ4(
T∑t=0
(rt − µp))2p(rt)drt
=
∫1
σ4
T∑t=0
T∑t′=0
(rt − µp)(rt′ − µp)p(rt)drt
=
∫1
σ4
T∑t=0
(rt − µp)2p(rt)drt
=T
σ2, (S24)
where here we have exploited the fact that E[(rt − µp)(rt′ − µp)] = 0 ∀t 6= t′. This shows that forthis simple example, there is a perfect correspondence between both the expectation and the varianceof IL compared to BP.
C.4 Neural Variational Inference
Expectation The difference between NVI∗ and BP is that we do not use a change of variables.Given our previous derivation of the NVI∗ update (Eq. S4), we have:
− d
dµqL =
∫ [∫d
dµqlog p(r|λt)q(r|λ) + (log p− log q) (
d
dµqlog q(r|λ))q(r|λ)dr
]p(λt)dλt
=
∫ [∫ ( T∑t=0
(1− λt)σ2
(rt − µq) + (log p− log q)
T∑t=0
λtσ2
(rt − µq)
)q(r|λ)dr
]p(λt)dλt,
where the second equality follows from substituting in ddµq
log p(r|λt) and ddµq
log q(r|λ). Notingthat log p− log q = log p− log q when λt = 1, we continue:
− d
dµqL =
∫ [∫ ( T∑t=0
(1− λt)σ2
(rt − µq) + (log p− log q)
T∑t=0
λtσ2
(rt − µq)
)q(r|λ)dr
]p(λt)dλt
= Er,λ
[T∑t=0
(1− λt)σ2
(rt − µq)−
(T∑t=0
(rt − µp)2 − (rt − µq)2
)T∑t=0
λt2σ4
(rt − µq)
]
= Er,λ
[T∑t=0
(1− λt)σ2
(rt − µq)−
(T∑t=0
2rt(µq − µp) + µ2p − µ2
q
)T∑t=0
λt2σ4
(rt − µq)
].
(S25)
At this point, we’ll allow ourselves to exploit the structure of our problem in two ways commonlyemployed in NVI∗. First, we observe that the loss at a particular time step, 2rt(µq − µp) + µ2
p − µ2q
is independent of rt′ −µq for t′ > t, i.e. fluctuations in variables at future time steps do not influencethe current loss. Incorporating this fact modifies our update to give:
− d
dµqL = Er,λ
T∑t=0
(1− λt)σ2
(rt − µq)−T∑t=0
∑t′≤t
λt2σ4
(2rt(µq − µp) + µ2
p − µ2q
)(r′t − µq)
.(S26)
8

Next, we notice that E[∑
t′≤tλt
2σ4 (r′t − µq)]
= 0, so we can subtract from our update a ×∑t′≤t
λt2σ4 (r′t − µq) for some constant a, without modifying the expectation of our loss. Choosing
a constant a that will reduce the variance of the parameter update is a common technique used inNVI∗, called using a ‘control variate’ [1, 2]. We notice that the average loss contributes nothing tothe expectation, so we take a = 2µq(µq − µp) + µ2
p − µ2q , giving the improved-variance update:
− d
dµqL = Er,λ
T∑t=0
(1− λt)σ2
(rt − µq)−T∑t=0
∑t′≤t
λtσ4
(rt − µq)(µq − µp)(r′t − µq)
. (S27)
Individual samples from this method of differentiation are more complicated (and higher variance)than IL or BP. An individual sample would give:
∑Tt=0
(1−λt)σ2 (rt − µq) −
∑Tt=0
∑t′≤t
λtσ4 (rt −
µq)(µq − µp)(r′t − µq). We’ll first compute the expectation of this expression (to verify that it isequivalent to BP and IL), and then we’ll compute its variance. Continuing our calculation, we get:
− d
dµqL = Er,λ
T∑t=0
1− λtσ2
(rt − µq)−T∑t=0
∑t′≤t
λtσ4
(rt − µq)(µq − µp)(r′t − µq)
=
∫ T∑t=0
(1− λt)σ2
(rt − µq)p(r)dr +
∫1
2σ4
T∑t=0
∑t′≤t
(rt − µq)(µp − µq)(r′t − µq)q(r)dr
=T
2σ2(µp − µq) +
∫(µp − µq)
2σ4
T∑t=0
∑t′≤t
(rt − µq) (r′t − µq)q(r)dr
=T
2σ2(µp − µq) +
∫(µp − µq)
2σ4
T∑t=0
∑t′≤t
(ηt) (ηt′)p(η)dη
=T
2σ2(µp − µq) +
∫(µp − µq)
2σ4
T∑t=0
η2t p(η)dη
=T
σ2(µp − µq), (S28)
where the fourth equality comes from reparameterizing with the transformation ηt = rt − µq andthe fifth equality stems from the fact that E [ηt] = 0 and E [ηtηt′ ] = 0. This verifies that whether wesample over r using the black-box differentiation method, or over η using the reparameterizationtrick, or use IL, we will arrive at the same weight update in expectation. The variance of sampleestimates thus distinguishes IL from NVI∗ (on this example at least).
Variance Because of the NVI∗ sample estimate’s increased complexity, the variance calculation isalso much more involved:
V ar(∆µq) =Er,λ
[(∆µq −
T
σ2(µp − µq)
)2]
=Er,λ
T∑t=0
(1− λt)σ2
(rt − µq)−T∑t=0
∑t′≤t
λt2σ4
(rt − µq)(µq − µp)(r′t − µq)−T
σ2(µp − µq)
2
=1
2
∫1
σ4
T∑t=0
(rt − µp)2p(r)dr
+1
2
∫ 1
2σ4
T∑t=0
∑t′≤t
(rt − µq)(µp − µq)(r′t − µq)−T
σ2(µp − µq)
2
q(r)dr,
(S29)
9
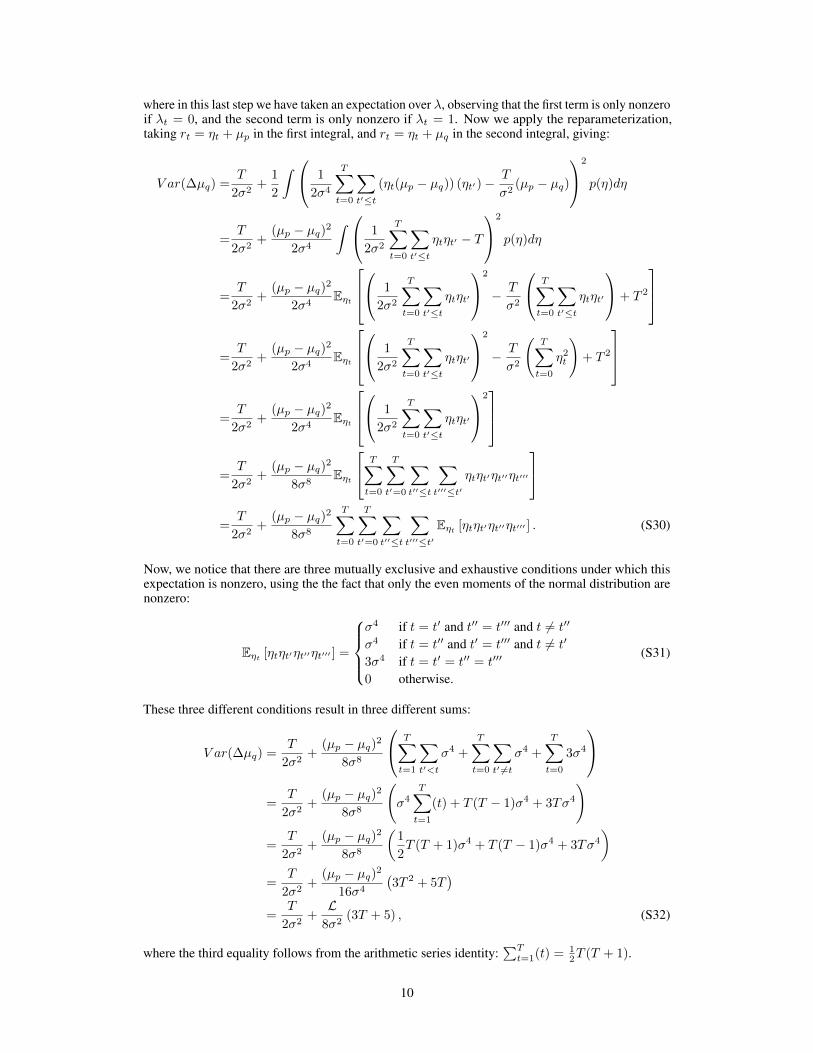
where in this last step we have taken an expectation over λ, observing that the first term is only nonzeroif λt = 0, and the second term is only nonzero if λt = 1. Now we apply the reparameterization,taking rt = ηt + µp in the first integral, and rt = ηt + µq in the second integral, giving:
V ar(∆µq) =T
2σ2+
1
2
∫ 1
2σ4
T∑t=0
∑t′≤t
(ηt(µp − µq)) (ηt′)−T
σ2(µp − µq)
2
p(η)dη
=T
2σ2+
(µp − µq)2
2σ4
∫ 1
2σ2
T∑t=0
∑t′≤t
ηtηt′ − T
2
p(η)dη
=T
2σ2+
(µp − µq)2
2σ4Eηt
1
2σ2
T∑t=0
∑t′≤t
ηtηt′
2
− T
σ2
T∑t=0
∑t′≤t
ηtηt′
+ T 2
=
T
2σ2+
(µp − µq)2
2σ4Eηt
1
2σ2
T∑t=0
∑t′≤t
ηtηt′
2
− T
σ2
(T∑t=0
η2t
)+ T 2
=
T
2σ2+
(µp − µq)2
2σ4Eηt
1
2σ2
T∑t=0
∑t′≤t
ηtηt′
2
=T
2σ2+
(µp − µq)2
8σ8Eηt
T∑t=0
T∑t′=0
∑t′′≤t
∑t′′′≤t′
ηtηt′ηt′′ηt′′′
=
T
2σ2+
(µp − µq)2
8σ8
T∑t=0
T∑t′=0
∑t′′≤t
∑t′′′≤t′
Eηt [ηtηt′ηt′′ηt′′′ ] . (S30)
Now, we notice that there are three mutually exclusive and exhaustive conditions under which thisexpectation is nonzero, using the the fact that only the even moments of the normal distribution arenonzero:
Eηt [ηtηt′ηt′′ηt′′′ ] =
σ4 if t = t′ and t′′ = t′′′ and t 6= t′′
σ4 if t = t′′ and t′ = t′′′ and t 6= t′
3σ4 if t = t′ = t′′ = t′′′
0 otherwise.
(S31)
These three different conditions result in three different sums:
V ar(∆µq) =T
2σ2+
(µp − µq)2
8σ8
T∑t=1
∑t′<t
σ4 +
T∑t=0
∑t′ 6=t
σ4 +
T∑t=0
3σ4
=
T
2σ2+
(µp − µq)2
8σ8
(σ4
T∑t=1
(t) + T (T − 1)σ4 + 3Tσ4
)
=T
2σ2+
(µp − µq)2
8σ8
(1
2T (T + 1)σ4 + T (T − 1)σ4 + 3Tσ4
)=
T
2σ2+
(µp − µq)2
16σ4
(3T 2 + 5T
)=
T
2σ2+L
8σ2(3T + 5) , (S32)
where the third equality follows from the arithmetic series identity:∑Tt=1(t) = 1
2T (T + 1).
10

D Multilayer Network Architecture
Here we outline the architecture for the 2-layer network used for processing the Free Spoken Digitsdataset [15] in Figure 4.
D.1 Model structure
Our inference architecture simply adds an additional feedforward layer of neurons to the network:
sinft = zt + σinf
s ξt (S33)
rinf1t = f(W1st + a) + σinf
1 η1t (S34)
rinf2t = f(W2r
inf1t ) + σinf
2 η2t , (S35)
where Wl denotes the feedforward weights from layer l− 1 to layer l, a is an additive bias parameter,η1t ,η
2t , ξt ∼ N (0, 1) are independent white noise samples, σinf
1 , σinf2 , and σinf
s denote the inferencestandard deviations for their respective layers, and the nonlinearity f(·) is the tanh function. Themultilayer generative model includes an additional feedforward decoder step:
rgen2t = ((1− kt)D2 + ktI)) rt−1 + σgen
2 η2t (S36)
rgen1t = f(D1r
gen2t + b) + σgen
1 η1t (S37)
sgent = f(Dsr
gen1t ) + σgen
s ξt, (S38)
where D2 is a diagonal transition matrix, D1 and Ds are prediction weights to their layers fromhigher layers, b is an additive bias parameter, I is the identity matrix, and σgen
1 , σgen2 , and σgen
s denotethe generative standard deviations for their layers. We define kt as in the 1-layer network. Also inkeeping with the basic model, during simulation, samples are determined by a combination of pmand q, given by qθ:
r2t = λtr
inf2t + (1− λt)rgen2
t (S39)
r1t = λtr
inf1t + (1− λt)rgen1
t (S40)
st = λtsinft + (1− λt)sgen
t . (S41)
D.2 Parameter updates
Adding additional layers to our model does not change the fact that the parameter updates can beinterpreted as local synaptic plasticity rules at the basal (for q) or apical (for p) compartments of ourneuron model. Plugging our probability models into the equation for the IL parameter update (Eq.5), calculating derivatives, and updating our parameters stochastically at every time step as with ourbasic model gives:
∆W(ij)1 ∝ 1− λt
(σinf1 )2
((r1t )
(i) − f(W1st + a)(i))f ′(W1st + a)(i)s(j)t (S42)
∆a(i) ∝ 1− λt(σinf
1 )2((r1
t )(i) − f(W1st + a)(i))f ′(W1st + a)(i) (S43)
∆W(ij)2 ∝ 1− λt
(σinf2 )2
((r2t )
(i) − f(W2r1t )
(i))f ′(W2r1t )
(i)(r1t )
(j) (S44)
∆D(ii)2 ∝ λt(1− kt)
(σgen2 )2
((r2t )
(i) − (D2r2t−1)(i))(r2
t−1)(i) (S45)
∆D(ij)1 ∝ λt
(σgens )2
((r1t )
(i) − f(D1r2t + b)(i))f ′(D1r
2t + b)(i)(r2
t )(j) (S46)
∆b(i) ∝ λt(σgens )2
((r1t )
(i) − f(D1r2t + b)(i))f ′(D1r
2t + b)(i) (S47)
∆D(ij)s ∝ λt
(σgens )2
(sit − f(Dsr1t )
(i))f ′(Dsr1t )
(i)(r1t )
(j). (S48)
11

0 200−1.5
0.0
1.5
0 200−1.5
0.0
1.5
time steps time steps
inferenceduration = 2
inferenceduration = 32
ca
corr
elat
ion
inference duration5 30
0.90
0.94
0.98
2k
6k
10k
14k
loss
0 100ktime steps
2k
14k
loss
dduration = 2duration = 1k
0 100ktime steps
b
Figure S1: Additional variations on the phase duration. a. Comparison of ELBO loss for IL(black) to WS with a 1000 time step phase duration (gray) over training. b. Comparison of anexample neuron’s activity through time when the network is in inference mode (green, λt = 1) andwhen the network is alternating phase, spending 2 time steps in the inference phase, and two timesteps the generative phase (blue); the random seed and stimuli are identical in both cases. c. Same asb, but the alternating network spends 32 time steps in the inference phase. d. The correlation acrosstime between neurons in inference mode vs. while alternating phase, for identical random seeds. Theinference duration is incremented, while the generative duration is kept constant at 2 time steps. Insetshows the loss for an inference duration of 2 (blue) compared to the loss for an inference duration of32 (pink).
References[1] Rajesh Ranganath, Sean Gerrish, and David Blei. Black box variational inference. In Artificial
intelligence and statistics, pages 814–822. PMLR, 2014.[2] Andriy Mnih and Karol Gregor. Neural variational inference and learning in belief networks. In
International Conference on Machine Learning, pages 1791–1799. PMLR, 2014.[3] Wulfram Gerstner, Marco Lehmann, Vasiliki Liakoni, Dane Corneil, and Johanni Brea. Eli-
gibility traces and plasticity on behavioral time scales: experimental support of neohebbianthree-factor learning rules. Frontiers in neural circuits, 12:53, 2018.
[4] Nicolas Frémaux and Wulfram Gerstner. Neuromodulated spike-timing-dependent plasticity,and theory of three-factor learning rules. Frontiers in neural circuits, 9:85, 2016.
[5] Thomas Miconi. Biologically plausible learning in recurrent neural networks reproduces neuraldynamics observed during cognitive tasks. Elife, 6:e20899, 2017.
[6] Paul J Werbos. Backpropagation through time: what it does and how to do it. Proceedings ofthe IEEE, 78(10):1550–1560, 1990.
[7] Ila R Fiete, Michale S Fee, and H Sebastian Seung. Model of birdsong learning based ongradient estimation by dynamic perturbation of neural conductances. Journal of neurophysiology,98(4):2038–2057, 2007.
[8] Gregor M Hoerzer, Robert Legenstein, and Wolfgang Maass. Emergence of complex compu-tational structures from chaotic neural networks through reward-modulated Hebbian learning.Cerebral cortex, 24(3):677–690, 2014.
[9] Colin Bredenberg, Eero Simoncelli, and Cristina Savin. Learning efficient task-dependentrepresentations with synaptic plasticity. Advances in Neural Information Processing Systems,33, 2020.
[10] Diederik P Kingma and Max Welling. Auto-encoding variational Bayes. arXiv preprintarXiv:1312.6114, 2013.
[11] Danilo Jimenez Rezende, Shakir Mohamed, and Daan Wierstra. Stochastic backpropagationand approximate inference in deep generative models. In International conference on machinelearning, pages 1278–1286. PMLR, 2014.
[12] Timothy P Lillicrap, Adam Santoro, Luke Marris, Colin J Akerman, and Geoffrey Hinton.Backpropagation and the brain. Nature Reviews Neuroscience, 21(6):335–346, 2020.
[13] Adam Paszke, Sam Gross, Francisco Massa, Adam Lerer, James Bradbury, Gregory Chanan,Trevor Killeen, Zeming Lin, Natalia Gimelshein, Luca Antiga, et al. Pytorch: An imperativestyle, high-performance deep learning library. arXiv preprint arXiv:1912.01703, 2019.
12

[14] Shiro Ikeda Shun-ichi Amari and Hiroyuki Nakahara. Convergence of the wake-sleep algorithm.In Advances in Neural Information Processing Systems 11: Proceedings of the 1998 Conference,volume 11, page 239. MIT Press, 1999.
[15] Zohar Jackson, César Souza, Jason Flaks, Yuxin Pan, Hereman Nicolas, and Adhish Thite.Jakobovski/free-spoken-digit-dataset: v1. 0.8, 2018.
Checklist1. For all authors...
(a) Do the main claims made in the abstract and introduction accurately reflect the paper’scontributions and scope? [Yes] We provide a derivation of our online learning algorithm(Section 2), and demonstrate its relationships (Appendix B) and relative performance(Fig. 2) to existing algorithms (WS, BP, NVI∗). We also demonstrate impressionlearning’s online learning capabilities (Fig. 3) and scalability to naturalistic stimuli(Fig. 4).
(b) Did you describe the limitations of your work? [Yes] We describe several limitationsand possible extensions of our work in the Discussion (Section 4).
(c) Did you discuss any potential negative societal impacts of your work? [N/A] IL is atheoretical development intended to provide insight into brain function; as such, wedo not foresee it having any substantial negative societal impacts. Our hope is thatby demonstrating how artificial neural networks of pyramidal neurons can use theirdendritic compartments and synaptic plasticity to learn models of their sensory dataonline, we have come closer to an understanding of how unsupervised learning canoccur in early sensory systems in the brain, and will inform experiments attempting tofurther elucidate the brain’s learning processes.).
(d) Have you read the ethics review guidelines and ensured that your paper conforms tothem? [Yes]
2. If you are including theoretical results...(a) Did you state the full set of assumptions of all theoretical results? [Yes](b) Did you include complete proofs of all theoretical results? [Yes] Our key theoretical
results are described and proved in Section 2.3. If you ran experiments...
(a) Did you include the code, data, and instructions needed to reproduce the main ex-perimental results (either in the supplemental material or as a URL)? [Yes] Thecode used to produce the main experimental results can be found here: https://github.com/colinbredenberg/Impression-Learning-Camera-Ready
(b) Did you specify all the training details (e.g., data splits, hyperparameters, how theywere chosen)? [Yes]
(c) Did you report error bars (e.g., with respect to the random seed after running experi-ments multiple times)? [Yes]
(d) Did you include the total amount of compute and the type of resources used (e.g., typeof GPUs, internal cluster, or cloud provider)? [Yes] We used an internal cluster for allsimulations.
4. If you are using existing assets (e.g., code, data, models) or curating/releasing new assets...(a) If your work uses existing assets, did you cite the creators? [Yes] We cite the Free
Spoken Digits Dataset.(b) Did you mention the license of the assets? [Yes] The Free Spoken Digit Dataset uses a
Creative Commons Attribution-ShareAlike 4.0 International license.(c) Did you include any new assets either in the supplemental material or as a URL? [Yes]
Code and the data used for training are linked in the main text.(d) Did you discuss whether and how consent was obtained from people whose data you’re
using/curating? [N/A](e) Did you discuss whether the data you are using/curating contains personally identifiable
information or offensive content? [N/A]
13

5. If you used crowdsourcing or conducted research with human subjects...(a) Did you include the full text of instructions given to participants and screenshots, if
applicable? [N/A](b) Did you describe any potential participant risks, with links to Institutional Review
Board (IRB) approvals, if applicable? [N/A](c) Did you include the estimated hourly wage paid to participants and the total amount
spent on participant compensation? [N/A]
14