IMPLICIT AND EXPLICIT ANTI-FAT ATTITUDES AND GESTURAL … · 2015. 10. 15. · to measure explicit...
41
IMPLICIT AND EXPLICIT ANTI-FAT ATTITUDES AND GESTURAL MIMICRY A THESIS SUBMITTED TO THE GRADUATE DIVISION OF THE UNIVERSITY OF HAWAI‘I AT MANOA IN PARTIAL FULFILLMENT OF THE REQUIREMENTS FOR THE DEGREE OF MASTER OF ARTS IN PSYCHOLOGY DECEMBER 2014 By Wilhelmina E. Sauer Thesis Committee: Elaine Hatfield, Chairperson Kentaro Hayashi Richard Rapson Yiyuan Xu Keywords: anti-fat attitudes, explicit attitudes, implicit attitudes, mimicry
Transcript of IMPLICIT AND EXPLICIT ANTI-FAT ATTITUDES AND GESTURAL … · 2015. 10. 15. · to measure explicit...

IMPLICIT AND EXPLICIT ANTI-FAT ATTITUDES AND GESTURAL MIMICRY
A THESIS SUBMITTED TO THE GRADUATE DIVISION OF THE
UNIVERSITY OF HAWAI‘I AT MANOA IN PARTIAL FULFILLMENT
OF THE REQUIREMENTS FOR THE DEGREE OF
MASTER OF ARTS
IN
PSYCHOLOGY
DECEMBER 2014
By
Wilhelmina E. Sauer
Thesis Committee:
Elaine Hatfield, Chairperson
Kentaro Hayashi
Richard Rapson
Yiyuan Xu
Keywords: anti-fat attitudes, explicit attitudes, implicit attitudes, mimicry

ii
ABSTRACT
Gestural mimicry is a fundamental building block of interpersonal relationships. Attitudes have
been shown to influence mimicry. The present study was designed to investigate anti-fat attitudes
and mimicry. Two types of attitudes were measured: implicit and explicit. Face-touching was
measured as an index of gestural mimicry. Sixty-seven participants (N=67) were randomly
assigned to one of two experimental conditions; they either watched a video with an obese
speaker or a video with a non-obese speaker. The speaker delivered a speech and touched their
faces several times. The viewers where monitored for gestural mimicry. All participants
completed a computer-based Implicit Associations Test (IAT) and the Anti-Fat Attitudes Scale
(AFAS). Ultimately, the video manipulation was too weak to elicit mimicry. Therefore, the
present study neither supports nor disconfirms that there is an association between attitudes
(implicit or explicit) and gestural mimicry.
iii
TABLE OF CONTENTS
ABSTRACT……………………..…………………………………………….…. ii
TABLE OF CONTENTS………………………………………………………….. iii
INTRODUCTION……………………………………………..…………..……… 5
ATTITUDES TOWARDS THE OBESE…...……….……………..…………….…… 5
MIMICRY………………….…………….…………………….…………….…... 6
ATTITUDES AND MIMICRY….…………….….…………….…...………….…... 7
ATTITUDES: IMPLICIT AND EXPLICIT ….……..……….………….……..……... 7
EXPLICIT ATTITUDES….…………….….…………….…...…………….….…... 8
IMPLICIT ATTITUDES….…………….….…………….…...…………….….…... 9
MIMICRY, OBESITY, IMPLICIT AND EXPLICIT ATTITUDES ………………………… 10
STUDY AIM AND HYPOTHESES ….…..……….…….…………………..…..….. 11
METHODS ………………………………………………………………...…… 12
PARTICIPANTS …….…………….….…………….…..…………………….….. 12
PROCEDURES .…….…………….….…………….…..………………..……….. 12
EXPERIMENTAL MANIPULATION…….….….…………….……..……….…….. 14
Video Conditions ……….…………...……………………...……………. 14
MEASURES ...……………………………………………………...……………. 14
Demographics ……….……………………………………...……………. 14
Unconscious Behavioral Mimicry ..………………………...……………. 14
Anti-Fat Attitudes Scale ………………………………….…………….... 14
Implicit Associations Test …..……………………………...…............…. 15
RESULTS……………………………………………..……..………..…..…….. 17
SAMPLE SIZE ………………………………………………………………..……. 17
DATA ANALYSIS ……………...…………………….……..…………….…… 17
Mimicry …….……….……………………………………...……………. 17
Anti-fat Attitudes Scale …………..………………………...……………. 17
Anti-Fat Attitudes Scale and Mimicry ……………..…………………..... 18
Implicit Associations Test …..……………………………...…............…. 18
Implicit Associations Test and Mimicry…..………………..…............…. 19

iv
Implicit Associations Test and The Anti-fat Attitudes Scale …............…. 19
DISCUSSION …….……………………………………..…………………..…... 20
LIMITATIONS AND FUTRUE DIRECTIONS …..................................................…. 21
APPENDICES …………………………………………..…………………..…... 23
APPENDIX A………………………………………………………...……..…… 23
APPENDIX B…………………………………………………………...…..…… 24
APPENDIX C…………………………………………………………...…..…… 25
APPENDIX D…………………………………………………………...…..…… 28
APPENDIX E …………………………………………………….……...…..….. 29
APPENDIX F…………………………………………………………...…..…… 31
APPENDIX G…………………………………………………………...…..…… 33
APPENDIX H …………………………………………………….……...…..….. 35
REFERENCES ...………………………………………………………….…..… 36

5
INTRODUCTION
Humans are social beings and have an extraordinary capacity to build rapport. However,
people do not bond with everyone they meet. There are a number of factors, among which are
attitudes, defined as positive or negative evaluations of an attitude-object (Eagly & Chaiken,
1993; Olson & Kendrick, 2010), which direct people towards or away from affiliation (Dovidio,
Kawakami, Smoak & Gaertner, 2008; Kurzban & Leary, 2001). Attitudes have been shown to
influence the nonverbal behavior mimicry, a fundamental tool in building rapport. People who
are motivated to affiliate will mimic each other’s mannerisms more than those who lack that
motivation (Chartrand & Bargh, 1999; Chartrand & van Baaren, 2009). When we mimic another
person, we like that person more (Chartrand & van Baaren, 2009; Inzlicht, Gutsell, & Legault,
2012). When we ourselves are mimicked, we feel more liked (Chartrand & van Baaren, 2009).
The current study was designed to investigate how anti-fat attitudes modulate mimicry. Mimicry
of an obese or non-obese confederate was counted as a dependent variable in a video-based
experimental manipulation. Further, borrowing from the logic of a dual-processing model,
attitudes where measured as two distinct types: implicit and explicit.
Attitudes towards the obese
Anti-fat attitudes are global devaluations of people based on weight (Kurzban & Leary,
2001). Within the United States negative attitudes towards obese individuals are rampant.
Discrimination is found in all major domains of life including social, educational, professional,
and medical (Bissell & Hayes, 2011; Crandall & Hebl, 2009). Based on their weight, people are
not receiving the same academic support in school (Bissell & Hayes, 2011; Crandall & Hebl,
2009; Puhl & Brownell, 2003). Obese children are nominated less frequently as ‘very good’ or
‘best friends’ (Crandall & Hebl, 2009). They don’t receive the same job opportunities, pay
6
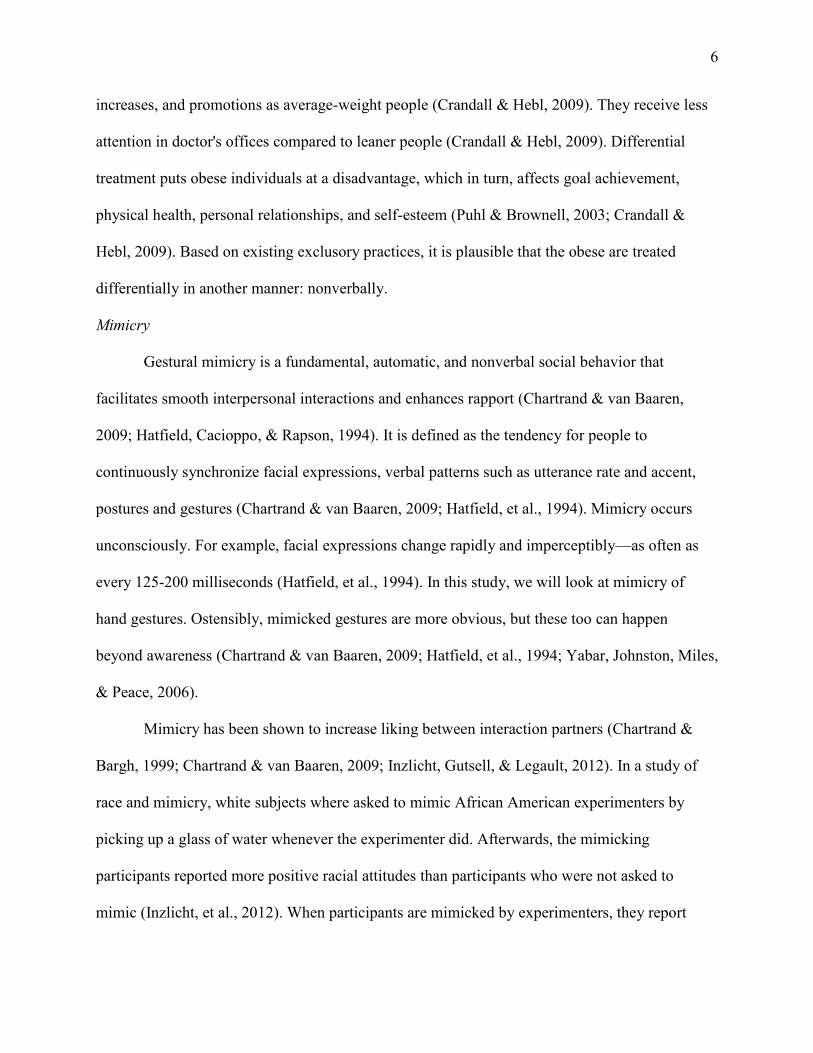
increases, and promotions as average-weight people (Crandall & Hebl, 2009). They receive less
attention in doctor's offices compared to leaner people (Crandall & Hebl, 2009). Differential
treatment puts obese individuals at a disadvantage, which in turn, affects goal achievement,
physical health, personal relationships, and self-esteem (Puhl & Brownell, 2003; Crandall &
Hebl, 2009). Based on existing exclusory practices, it is plausible that the obese are treated
differentially in another manner: nonverbally.
Mimicry
Gestural mimicry is a fundamental, automatic, and nonverbal social behavior that
facilitates smooth interpersonal interactions and enhances rapport (Chartrand & van Baaren,
2009; Hatfield, Cacioppo, & Rapson, 1994). It is defined as the tendency for people to
continuously synchronize facial expressions, verbal patterns such as utterance rate and accent,
postures and gestures (Chartrand & van Baaren, 2009; Hatfield, et al., 1994). Mimicry occurs
unconsciously. For example, facial expressions change rapidly and imperceptibly—as often as
every 125-200 milliseconds (Hatfield, et al., 1994). In this study, we will look at mimicry of
hand gestures. Ostensibly, mimicked gestures are more obvious, but these too can happen
beyond awareness (Chartrand & van Baaren, 2009; Hatfield, et al., 1994; Yabar, Johnston, Miles,
& Peace, 2006).
Mimicry has been shown to increase liking between interaction partners (Chartrand &
Bargh, 1999; Chartrand & van Baaren, 2009; Inzlicht, Gutsell, & Legault, 2012). In a study of
race and mimicry, white subjects where asked to mimic African American experimenters by
picking up a glass of water whenever the experimenter did. Afterwards, the mimicking
participants reported more positive racial attitudes than participants who were not asked to
mimic (Inzlicht, et al., 2012). When participants are mimicked by experimenters, they report

7
feeling more liked (Chartrand & van Baaren, 2009). Because mimicry is such a powerful tool, it
is important to ask: Who mimics whom and why?
Attitudes and mimicry
Studies on attitudes and mimicry demonstrate that people are most likely to mimic based
on a priori liking (Avenanti, Sirigu, & Aglioti, 2010; Hatfield, et al., 1994; Stel, et al., 2010;
Yabar, et al., 2006) and a preexisting desire to affiliate (Guéguen & Martin, 2009; Lakin &
Chartrand, 2003; Likowski, Mühlberger, Seibt, Pauli, & Weyers, 2008). Conversely, we are less
likely to mimic a person with whom we don't want to affiliate or for whom we have an a priori
disliking (Hatfield, et al., 1994; Stel, et al., 2010). In a study by Stehl, et al. (2010), participants
were induced to hold either positive or negative attitudes towards an experimenter.
Consequently, they mimicked the experimenter more or less (respectively). In a study by Gutsell
and Inzlicht (2010), results demonstrated that extant racial prejudice inhibited mimicry. In 2006,
Yabar, et al. found attitudes towards religious group predicted mimicry. Most relevant to this
study, Johnston (2002) found the stigma of obesity modulated mimicry between study
participants and an obese experimenter.
Attitudes: Implicit and explicit
Currently, the most widely agreed upon definition of an attitude is that it is an evaluation
of a person, thing, or concept (i.e. attitude-object) (Albarracin, Johnson, Zanna, & Kumkale,
2005; Eagly and Chaiken, 1993). That evaluation is valenced with some degree of favor or
disfavor (Albarracin, et al., 2005). It seems the link between attitude and behavior would be
straightforward: if you don’t like something, you avoid it. However, historically this relationship
has been difficult to demonstrate in the laboratory with consistency (Ajzen & Fishbein, 2005).
Within the past two decades, attitude research has looked to the dual-processing model to

8
better understand the lack of predictive validity of attitudes (Chaiken & Ledgewood, 2007;
Wilson, Lindsey, & Schooler, 2000). The model purports that social cognition happens both
explicitly and implicitly (i.e. deliberately and unintentionally) (Chaiken & Ledgewood, 2007;
Wilson, et al., 2000). Research has shown that parsing attitudes in this manner, better accounts
for different types of behaviors, especially deliberate versus unintentional behaviors (Dovidio,
Kawakami, & Gaertner, 2002).
Explicit Attitudes
Explicit processing involves deliberation. This results in evaluations that that have been
consciously processed (Ajzen & Fishbein, 2005; Dovidio, et al., 2002; Fabrigar, MacDonald, &
Wegener, 2005; Olson & Fazio, 2008; Olson & Kendrick, 2010). One common way to gauge a
person’s explicit attitudes is in questionnaire format (Morrison, Roddy, & Ryan, 2009). As soon
as you ask a person to answer the question, “On average, are fat people are lazier than thin
people?” explicit processing begins. They consider the question and generate a response.
Self-report measures are problematic because they are influenced by many factors (Ajzen
& Fishbein, 2005; Morrison, et al., 2009) such as social desirability concerns (Jaccard &
Blanton, 2005; Krosnick, Judd, & Wittenbrink, 2005; McConnell & Leibold, 2000; Schwartz,
Vartanian, Nosek & Brownell, 2006) and limited introspective access (McConnell & Leibold,
2000). Essentially, a response to a question is formulated based on a number of factors. For
instance, an individual may not want to appear biased. Or, an individual may weigh their
judgment differently because they know several hard-working obese people. In the present study,
to measure explicit attitudes, participants were asked to complete the Anti-fat Attitudes Scale
(Morrison, et al., 2009). This Likert-scale questionnaire is comprised of five anti-fat statements
including the example above, “On average, fat people are lazier than thin people,” (see Appendix

9
A for the complete questionnaire).
Implicit Attitudes
Implicit attitudes are evaluations that are automatically activated beyond one’s
introspective awareness. Processing occurs without intention and deliberation and is triggered by
the mere presence of an attitude-object (Albarracin et al., 2005; Bassili & Brown, 2005; Dovidio
Kawakami, Johnson, Johnson, & Howard, 1997; Dovidio et al., 2002; Schupp & Renner, 2011;
Wilson, et al. 2000; Zárate, 2009). Because implicit attitudes sit beyond introspective capacity,
they are thought to be better predictors of spontaneous behaviors, especially nonverbal ones
(Ajzen & Fishbein, 2005; Wilson, et al., 2002). Between mixed racial pairs, negative implicit
attitudes are related to interpersonal cues of disliking: increased blinking, diminished eye contact
(Dovidio, et al., 1997), less smiling and greater spatial distance (Fazio, et al., 1995; McConnell
& Leibold, 2000). Especially relevant to this study, Yabar and Johnston (2006) found that
implicit measures, over explicit measures, predicted mimicry.
One of the great challenges of studying implicit processes is that, by their nature, they
work beyond introspective awareness. As soon as you ask a study subject what their attitude is
towards obesity, processing becomes explicit. The Implicit Associations Test is touted for its
ability to circumvent explicit processing (Nosek, Greenwald, & Banaji, 2007). It is a rapid-fire
categorization task. Test-takers quickly pair concepts such as ‘fat’ and ‘good’ or ‘fat’ and ‘bad’.
As demonstrated by numerous studies, it typically takes people longer to pair ‘fat’ and ‘good’
together over ‘fat’ and ‘bad’ (Schupp & Renner, 2011). A criticism of the IAT is that test-takers
are still explicitly aware that the test is based on fat people. However, researchers have found
that ‘faking’ responses on the IAT is difficult (Nosek, et al., 2007).
Associations between explicit and implicit attitudes
10
Explicit and implicit tests tend to correlate more when the topics are neutral such as one’s
feelings towards flowers or insects (Nosek, et al., 2007; Tiege-Mocigemba, et al., 2010).
Alternatively, for socially sensitive topics, such as attitudes towards obesity, there seems to be
little association (Nosek, et al., 2007; Tiege-Mocigemba, et al., 2010). People give greater
deliberation to socially sensitive topics (Nosek, et al., 2007; Tiege-Mocigemba, et al., 2010).
With greater processing the expressed attitude is likely to be very different than one that is
unconsciously processed. Thus we have two types of attitudes: explicit and implicit. For the
current study, we expected to see a disassociation between implicit and explicit attitudes.
Mimicry, obesity, implicit attitudes and explicit attitudes
To date, there is one peer-reviewed study involving obesity stigma and mimicry. A
correlation was found between the weight of an experimenter and the extent, to which, the
experimenter was mimicked by a study participant (Johnston, 2002). However, implicit and
explicit attitudes were not measured. Another study looked at implicit and explicit anti-fat
attitudes and the nonverbal behavior seating choice (Bessenoff & Sherman, 2000). The
researchers found a moderately significant association between seating choice and implicit
attitudes (Bessenoff & Sherman, 2000). Yet, as the authors themselves point out, construing
seating choice as an unconscious nonverbal behavior may be problematic (Bessenoff &
Sherman, 2000). Deliberation may influence chair placement (Bessenoff & Sherman, 2000).
Researchers have explored the influence of anti-fat implicit and explicit attitudes on a deliberate
behavior: hiring practices (O’Brien, et al., 2008). They found hiring discrimination based on
obesity (O’Brien, et al., 2008). However, data did not show that hiring discrimination was related
to explicit or implicit attitudes (O’Brien, et al., 2008). Again, it may be that the behavior
measured was deliberate by nature. The present intends to explore how explicit and/or implicit

11
attitudes modulate an unconscious behavior: gestural mimicry. The specific gesture in question is
face-touching.
Study aims and hypotheses
This study investigated mimicry of an obese and non-obese video speaker, and implicit
and explicit anti-fat attitudes. The hypotheses are:
Hypothesis 1: Participants will mimic an obese person less than a non-obese person.
Hypothesis 2: Attitudes towards obese people will correlate with the participants’ mimicry
of the obese person. However, attitudes towards obese people will not predict mimicry of
non-obese target.
Hypothesis 3: Implicit attitudes towards obese people will best predict mimicry of the obese
target. Implicit attitudes towards obese people will not predict mimicry of the non-obese
target.
Hypothesis 4: Implicit and explicit anti-fat attitudes will not be associated.

12
METHODS
Participants
Seventy-one participants were recruited from undergraduate psychology courses at the
University of Hawaiʻi at Manoa (UH). Four participants were excluded; 2 were too young; 2 did
not complete the study. Sixty-seven participants where included in final analysis (N=67). They
were both male (20) and female (47). Age of participants were as follows: 18-24 years (N = 56),
25-34 years (N = 8), 35-44 years (N = 2), and 45-54 years (N = 1). The participants were ethnically
diverse: 15 Japanese; 14 White/Caucasian; 12 Fillipino; 10 Chinese; 2 Pacific Islander; 3
Hispanic/Latino; 2 Hawaiian; 1 Native American; 8 ‘Other’. In exchange for participation, students
received extra credit points for the course from which they were recruited.
Procedures
Upon arrival to the lab, participants were welcomed. They were seated and the
experimenter read an introduction to the study (for full script see Appendix B). They were then
asked to carefully read and sign an informed consent form (for full form see Appendix C). The
introduction and consent form provided as much detail about the study as possible without
exposing the true purpose of the study, which could potentially bias results. Subjects were told
that we were looking to better understand the relationship between visual attention and
information retention. This was a cover story to hide the true purpose of the study, which was to
gauge mimicry and anti-fat attitudes. The consent form also outlined the type of activities the
study entailed, any known hazards of participation, and an estimate of how much time the
participant would be at the lab. With signed consent, the participants could begin.
Subjects were seated at a quiet study carol with a computer. They were handed a packet
of paper. Page (1)--and every odd numbered page thereafter--was blue and read, “Please finish

13
the following task before looking at or beginning another.” Page (2)—and every even numbered
page thereafter--was white and contained a questionnaire or instructions for the next task. One
example is, “Please ask experimenter to start the video.” The order of the questionnaires and
tasks where counterbalanced across packets. Questionnaires and tasks included: the Anti-fat
Attitudes Scale (Morrison, et al., 2009)(see Appendix A), the Implicit Associations Test (see
Appendix D), watching a video, and the Symbolic Racism Scale as a distractor item (Henry &
Sears, 2002)(for full form see Appendix E), and a demographic questionnaire (for full form see
Appendix F).
It is important to note that the demographic questionnaire was not counterbalanced. This
was the first questionnaire in the packet for all participants. Also, the racial attitudes scale was a
distractor item so the study did not seem to focus only on obesity. This measure was not used in
final analysis. Additionally, and most importantly, there were two video conditions. Participants
were randomly assigned to watch one video with a non-obese speaker or an obese speaker. The
speaker delivered a short speech and touched their face several times. As participants watched
the videos they themselves were video recorded. These recordings were assessed, for mimicry, at
a later date by two judges.
When debriefed, participants were asked if they had suspected what the experiment was
truly about. No participants said they suspected it was about obese people or mimicry. They were
then told the experiment was actually investigating social attitudes and gestural mimicry. They
were asked to sign a second consent form (for full form Appendix G), which allowed use of their
questionnaires and videos to assess anti-fat attitudes and mimicry as opposed to impression
formation and visual attention. Then they were thanked for their help.
Experimental Manipulation

14
Video Conditions. Participants were randomly assigned to watch one of two, 3.5minute videos.
In one version an obese female speaker (5’5, 220lbs) delivered a short speech. In the second, a
non-obese female speaker delivered the same speech (5’5, 125lbs). Speakers were matched as
closely as possible in all ways: speech content (for speech content see Appendix H), hair color,
and clothing. During the video, the speaker touched her face five times.
As the participant watched the video, he/she was taped. At a later time two judges, blind to
the purpose of the study, reviewed the footage to count how many times participants touched
their faces (i.e. mimicked the speaker). The first minute of the video was a baseline phase.
During this time screen was blank, but subjects were still recorded. This was to get a baseline
count of participants face-touching to compare to face-touching during the second phase
(referred to throughout the study as the real-time phase). The real-time phase lasted 2.5 minutes.
During this time, the video speaker was on screen speaking and gesturing and the subject was
still being recorded.
Measures
Demographics. A short questionnaire on demographic information was presented as the first
questionnaire the experiment (see Appendix F).
Unconscious Behavioral Mimicry. Mimicry was measured by the number of times the
participant mimicked the video actor. Two judges, blind to the purpose of the study, watched the
footage of the participant and counted the number of times the participant touched his or her
face.
Anti-fat Attitudes Scale. The Anti-fat Attitudes Scale is comprised of five items. Each item is a
statement such as, “I would never date a fat person.” Study participants are asked to rate each
statement on a five-point Likert-type scale (1 = strongly disagree to 5 = strongly agree). A lower
15
mean score indicates lesser negative explicit attitudes towards obesity. Scale authors (Morrison
& O’Connor, 2009) report acceptable reliability (alpha coefficients between .70 and .77), good
construct validity, and uni-dimensional factor structure (Morrison & O’Connor, 2009) (see
Appendix A).
Implicit Associations Test (IAT). The IAT measures implicit attitudes towards obesity
(Morrison, et al., 2009). It is a rapid-fire, computer-based, categorization task. Subjects assign
pictures and words to a target category. The target categories are Obese/Good, Obese/Bad,
Thin/Good, Thin/Bad. The images are of obese or non-obese people (Nosek, at al., 2007b). The
words are positive or negative words such as “horrible” and “glorious” (Nosek, at al., 2007b).
The IAT demonstrates good reliability, good convergent and divergent validity, and satisfactory
internal consistency (Nosek, et al., 2007). The IAT has also been shown to capture valid
construct-related variance (Teige-Mocigemba, Klauer, & Sherman, 2010).
Target categories are placed in the upper left and right corners of a computer screen. Target
category placement varies. For instance, if Obese/Good is on the left, Thin/Bad will be on the
right. When Obese/Bad is on the left, Thin/Good will be on the right. Target category placement
in the upper corners is counterbalanced across subjects.
An image or word is presented in the middle of the screen. The item is paired with target
categories by pressing the ‘e’ and ‘i’ keys, which correspond to the left and right target
categories, respectively. There are 10 obese images, 10 non-obese images, 8 positive words, and
8 negative words (Nosek, et al., 2007b). All participants categorize all 20 images and 16 words.
However, the order of the images and words are not presented in the same order to each subject.
They are presented randomly.
The IAT is made up of 7 activity blocks. A preliminary training block introduces the subject

16
to the categorization task. This is followed by a practice block and a critical block. The practice
block consists of 40 categorization trials and is used as a warm-up for the critical block. Critical
blocks have 60 trials. Practice and critical blocks present the participant with a pairing of target
categories (Obese/Good and Thin/Bad, on the left and on the right, respectively). The final two
blocks of the IAT are also a practice block and critical block. These will present whichever target
category pairing was not utilized in the first practice and critical blocks (i.e. Thin/Bad and
Obese/Good, on the left and on the right, respectively)(see Appendix D). For the present study,
scores from the practice and critical blocks are both included in final analysis, as is standard
practice (Lane, Banaji, Nosek & Greenwald, 2007; Teige-Mocigemba, et al., 2010).
The IAT is predicated on the assumption that if two concepts (obese and bad) are highly
associated, then categorization of those concepts will occur more quickly (Teige-Mocigemba, et
al., 2010). Based on prevailing social stigma, it is assumed that test-takers will take longer to
place an obese image in a target category labeled “good” than an obese image into the target
category labeled “bad.” Also, due to prevailing social stigma, it is assumed a test-taker will be
slower categorizing a word such as “glorious” in the “obese” category resulting in larger reaction
times.
To analyze participants’ data, mean reaction times are divided by a pooled standard
deviation so that each participant has a D Score (Lane, et al., 2007; Teige-Mocigemba, et al.,
2010). A higher D score represents greater bias (Nosek, Greenwald, & Banaji, 2010; Williams.
& Steele, n.d).

17
RESULTS
Sample Size
Power analysis revealed a required sample size (n) of 56. This was based on an estimated
medium effect size for a 2 x 2 mixed-groups ANOVA, a power of .8, and alpha level of .05.
Data Analysis
Mimicry A mixed ANOVA demonstrated no statistically significant interaction between video
phase (baseline vs. real-time) and video condition (obese vs. non-obese) on mimicry, F(1,64) =
.115, p = .736. Nor was there a statistically significant main effect of phase, F(1, 64) = .115, p >
.05, or video condition F(1, 64) = .242, p = .624. There were 7 outliers in the data, as assessed by
inspection of a boxplot. One extreme outlier (1=6) was removed and the other outlying (1=4,
5=3) values were included in analysis. This test was in violation the normal distribution
assumption and sphericity. Inter-rater reliability was strong r(65) = .871, p < .0000.
Anti-fat Attitudes Scale (AFAS) Across the whole group, participants demonstrated neither a
strong explicit like or dislike towards obese people, (M = 2.92, SD = .7). The AFAS is comprised
of five Likert-scale questions. A score of three on any item represents a neutral attitude of
‘neither agree or disagree”. Hence, overall an average score of three across all five items
represents neither negative nor positive anti-fat attitudes. There was one outlier (1=2.20). This
was kept as deleting or transforming did not make a significant difference in final results. The
AFAS had a good level of internal consistency as determined by a Cronbach's alpha of 0.71.
Further analysis, using a test for independent means, demonstrated that there was no
difference between male (M= 2.87, SD = .7027) and female (M = 2.948, SD = .6573) responses (t
(65) = -.441, p = .661). All assumptions for this t test were met except outliers. There were 4 data

18
points (3=1.4,1=1.0). These were given the value of the highest-valued data point (1.60), falling
closest to the outliers, yet still within 1.5 standard deviations of the mean.
Anti-fat Attitudes Scale (AFAS) and Mimicry There was a very weak negative correlation
between explicit attitudes and mimicry of the obese, rs = -.190, p = .282. There was also very
weak positive correlation between explicit attitudes and mimicry of the non-obese, rs = .111, p =
.580.
Implicit Associations Test (IAT) D Scores—as described in the Procedures Section under
Implicit Associations Test—were used to analyze participant’s responses on the IAT measure.
Overall, participants demonstrated implicit anti-fat bias relative to pro-fat bias (D=.30, SD=.35,
t(65)=7.036, p > .000). One outlier was removed (1= -.88). Subjects were faster to pair non-
obese images with the ‘Good’ category and obese images with the ‘Bad’ category. Alternatively,
they were slower to categorize non-obese images with the ‘Bad’ category and obese images with
the ‘Good’ category. An internal test of consistency using split-half correlation yielded a result
of r = .704.
A test for independent means was run to investigate gender as an independent variable.
Males and females (F=47, M=19) demonstrated no significant difference in implicit anti-fat bias
t(64)=.038, p=.970. As per the recommendation of previous research, D-scores were calculated
using group-based standard deviations in lieu of whole sample pooled deviations: females
(D=.28, SD=.352); males (D=.28, SD=.428).
Lastly, a test for independent means was run to see if there was a difference in participants
who were in the obese versus the non-obese condition (obese=34, non-obese=33). There was no
significant difference in implicit anti-fat bias between the two video conditions t(53.867)=1.532,
p=.132. D-scores were calculated used group-based standard deviations as opposed to a whole

19
sample pooled deviations: obese video condition (D = .41, SD = .55); non-obese video condition
(D = .2442, SD = .316).
Implicit Associations Test (IAT) and Mimicry There was a very weak, non-significant,
negative correlation between implicit attitudes and mimicry of the obese, rs (65) = -.063, p =
.611. There was also very weak, non-significant, positive correlation between implicit attitudes
and mimicry of the non-obese, rs (65) = .069, p = .702.
Implicit Associations Test (IAT) and the Anti-Fat Attitudes Scale Pearson’s correlation was
used to investigate association between D scores on the implicit and mean scores of the explicit
measures. Analysis demonstrated that implicit bias was virtually unassociated to explicit bias,
r(65) = 0.002, p = 0.978.

20
DISCUSSION
As detailed in the Introductory Section, this study set out to investigate four hypotheses.
Due to ineffective video manipulation results are mostly inconclusive. Three out of the four
hypotheses cannot be supported, however, they cannot also be considered null.
Hypotheses
(1) Participants will mimic an obese person less than a non-obese person:
The video failed to elicit mimicry as evidenced by the lack of difference in the baseline
versus real-time phases on the video manipulation. A mixed groups ANOVA indicated no effects
given video phase or video condition: F(1,64) = .115, p = .736. Consequently, there is no way to
tell if participants would mimic an obese person more or less than a non-obese person.
(2) Attitudes towards obese people will correlate with the participants’ mimicry of the
obese person. However, attitudes towards obese people will not predict mimicry of non-obese
target:
Correlations between anti-fat explicit attitudes towards the obese and mimicry of the obese
and mimicry of the non-obese were both non-significant. Spearman rho’s were, respectively: rs =
-.190, rs = .111. Correlations between anti-fat implicit attitudes towards the obese and mimicry of
the obese and mimicry of the non-obese were both non-significant. Spearman rho’s were,
respectively: rs (65)= -.063, rs (65)= .069.
(3) Implicit attitudes towards obese people will best predict mimicry of obese. Implicit
attitudes towards obese people will not predict mimicry of the non-obese target:
As there were no effects given video phase or video condition, nor main effects of phase or
video condition, nor a difference in mimicry counts of the obese versus non-obese, it is
impossible to determine if implicit over explicit attitudes would be predict mimicry of obese.

21
(4) There would not be an association between implicit and explicit attitudes:
This hypothesis is supported. There was no correlation between explicit and implicit
attitudes: r(65) = 0.002, p = 0.978. These results support the dual-processing model. The IAT
and AFAS are both reported to have good construct validity—they are said to both measure anti-
fat attitudes. So, that they don’t correlate supports divergent validity (Nosek, et al., 2007). They
are measuring anti-fat attitudes subjected to two different types of processing: implicit and
explicit attitudes. This yields two different types of attitudes (implicit and explicit) especially
when dealing with a socially sensitive topic.
Limitations and future directions
A limitation of the current study is experimental design—particularly the mimicry
manipulation. Regardless of video condition, there was virtually no difference between baseline
and real-time mimicry. There is precedence for video manipulation as exemplified in a study by
Yabar, et al. (2006). However, in that study there is a pre-established motivation to affiliate. The
study included an element of cooperation, which necessitates engagement. The present study’s
video did not require engagement but allowed for passive viewing. As mimicry is a tool used to
affiliate, the motivation to engage may be necessary to elicit gestural mimicry. It is conceivable
that a more effective experimental manipulation will yield data that more reliably supports (or
negates) the hypotheses that anti-fat attitudes can predict gestural mimicry. Consequently, a future
avenue of study would include experimental design changes.
Experimental changes would include a stronger experimental manipulation utilizing
motivational factors to would increase the subject’s motivation to affiliate. A larger sample size
would also be helpful. Even though the correlations were weak between mimicry and the attitude
measures it is worth noting that in all instances attitudes versus mimicry counts were positive for
mimicry in the non-obese conditions, and negative in the non-obese conditions. The effect size

22
for this may increase given a greater sample size.
An additional limitation to note is the existing controversy that surrounds the use of the
IAT. Criticism of the IAT is that it measures cultural knowledge, not implicit attitudes (Nosek,
et. al. (2007). This means that test-takers respond based on what they “know” not what they
think or feel. For the current study this would be problematic because the measures used (AFAS
and IAT) are not both assessing anti-fat attitudes (this would nullify the fourth hypothesis). This
is also problematic because the study is based on the assumption that we are measuring a
verifiable construct, “implicit attitudes,” when we are measuring something completely different.
However, if the IAT does measure cultural knowledge, and cultural knowledge seems to predict
differential treatment of the obese better than explicit attitudes, we have still learned something.
This would add another dimension to our understanding and assumptions about attitudes. That is,
that cultural knowledge may better predict nonverbal behavior towards the obese and other
stigmatized groups. As the test has been so widely used, and is still frequently questioned for
construct validity, the IAT calls to be further investigated.

23
APPENDIX A: ANTI-FAT ATTITUDES SCALE (AFAS)
Anti-Fat Attitudes Scale (AFAS)(Morrison, et al., 2009)
Directions: For the following questions, select the response option that corresponds with your
opinion. Please note that there are no right or wrong answers. Therefore, try to answer each
question as honestly as possible.
strongly
disagree
disagree neither
disagree
or agree
agree strongly agree
Fat people are less sexually
attractive than thin people.
1 2 3 4 5
I would never date a fat
person.
1 2 3 4 5
On average, fat people are
lazier than thin people.
1 2 3 4 5
Fat people only have
themselves to blame for
their weight.
1 2 3 4 5
It is disgusting when a fat
person wears a bathing suit
at the beach.
1 2 3 4 5

24
APPENDIX B: INTRODUCTION TO THE STUDY (COVER STORY)
Briefing script to be read to participants upon their arrival to the lab.
Hello, and welcome to the social psychology lab. I am going to tell you a little bit about the
study before we begin.
We are interested in the role of visual gaze and information retention. Therefore, we will ask you
to watch a video. While you watch, you will be video recorded. This recording will span 4
minutes. At a later date these videos will be analyzed for eye movement. After you watch the
video, you will be asked questions regarding what you saw to check for information retention.
Additionally, we will ask you to complete a few random distractor tasks immediately after
watching the video. Also, we will ask you to complete a few random distractor items before the
video.
Distractor items allow us to look at two additional aspects that influence information retention:
the number of tasks completed and the order in which they were completed. These distractor
items could include questionnaires and computerized tasks. While they may seem random, the
information you provide is still important and can be used for additional research. Please
complete all tasks carefully.

25
APPENDIX C: INFORMED CONSENT FORM
University of Hawai'i
Consent to Participate in Research Project:
Visual Attention and Information Retention
My name is Wilhelmina E. Sauer. I am a Master’s student in the department of social
psychology, at the University of Hawai’i, Manoa. I am also the Principal Investigator for
this research project. This project is being conducted under the guidance of my social
psychology department advisor Elaine Hatfield, PhD. The focus on this research is to
determine how visual attention relates to information retention. You have been asked to
participate in this project because you are male or female and 18 years of age or older.
Project Description - Activities and Time Commitment: Participation in this project
only requires a single visit (i.e. today’s visit) to this lab. Your time spent here will be
approximately 40 to 45 minutes. You may be asked to fill out 3 short questionnaires, to
complete a computerized categorization task, and to watch a 3-minute long video. To
track your eye movements as you watch the video, you will be video recorded for a total
of 4 minutes. To check for information retention you will also be asked a few questions
after watching the video. Upon completion of the study activities you will be debriefed.
We will provide additional information on the study and ask you to ask any questions or
express any concerns that you may have regarding the study.
Benefits and Risks: There are no direct benefits to you for participating in this project.
However, the results of this project will help myself and other researchers understand
information retention. This ultimately provides a greater understanding of human
psychology and could provide benefits to society at large.
I believe there is little risk of psychological harm by participating in this project.
However, some of the questions may be uncomfortable to answer. If you become upset
by any of the tasks we ask you to complete, you may take a break, skip the task, or
withdraw from the project altogether without penalty.
Confidentiality and Privacy: During this research project, your data will be kept in a
secure and locked location. This includes the video, the questionnaires, and the
categorization task results. Your name will not be associated with any of these items—
they will remain anonymous. The video is a form of visual identification however, only I,
and my research assistants, will have access to that information. These items will be
destroyed when the project is complete.
Any data that is published from this study is summarized into broad categories and
remains completely disconnected from the your identity. If you would like a summary of

26
the findings from my final report, please contact me at the number listed near the end of
this consent form.
Your privacy will be protected to the maximum extent allowable by law. However,
legally authorized agencies, including the University of Hawai'i Human Studies Program,
have the right to review research records.
Voluntary Participation: Your participation in this project is completely voluntary.
You may stop participating at any time without any penalty or loss. I understand that you
were recruited by your course professors. You might feel pressure to participate.
However, your decision to not participate or to leave the study early because of
discomfort, will not impact your relationship with your professors. Your professor will
not know if you leave early or not and you will still receive credit for participating.
Compensation: In exchange for your participation, you will receive extra credit in the
course from which you were recruited. How many extra credit points you receive is up to
your instructor. Please speak with them for further details.
Questions: For questions about your rights as a research participant, contact the
University of Hawaii Human Studies Program by phone at 808.956.5007 or by email at
[email protected]. You may also contact me (Wilhelmina Sauer, Principal Investigator)
by phone (864.612.3552) or e-mail ([email protected]). Or, you can contact my
advisor Elaine Hatfield in the social psychology department:
[email protected]. If you experience distress due to your participation you
may contact on-campus psychological services: You may also contact me and I can put
you in touch with the University of Hawaii, Manoa counseling services. Their number is:
(808) 956-7927.
If you agree to participate in this project, please sign the following signature portion of
this consent form and return it to me or the research assistant working with you today.
Please keep the second copy of this consent form for your records.
---------------------------------------------------------------------------------------------------
Signature for Consent:
I agree to participate in the research project entitled, Impression Formation. I understand
that I can change my mind about participating in this project, at any time, by notifying the
researcher.
Your Name (Print): _____________________________________________

27
Your Signature: _____________________________________________
Date: _________________________________
You will be given a copy of this consent form for your records.
28
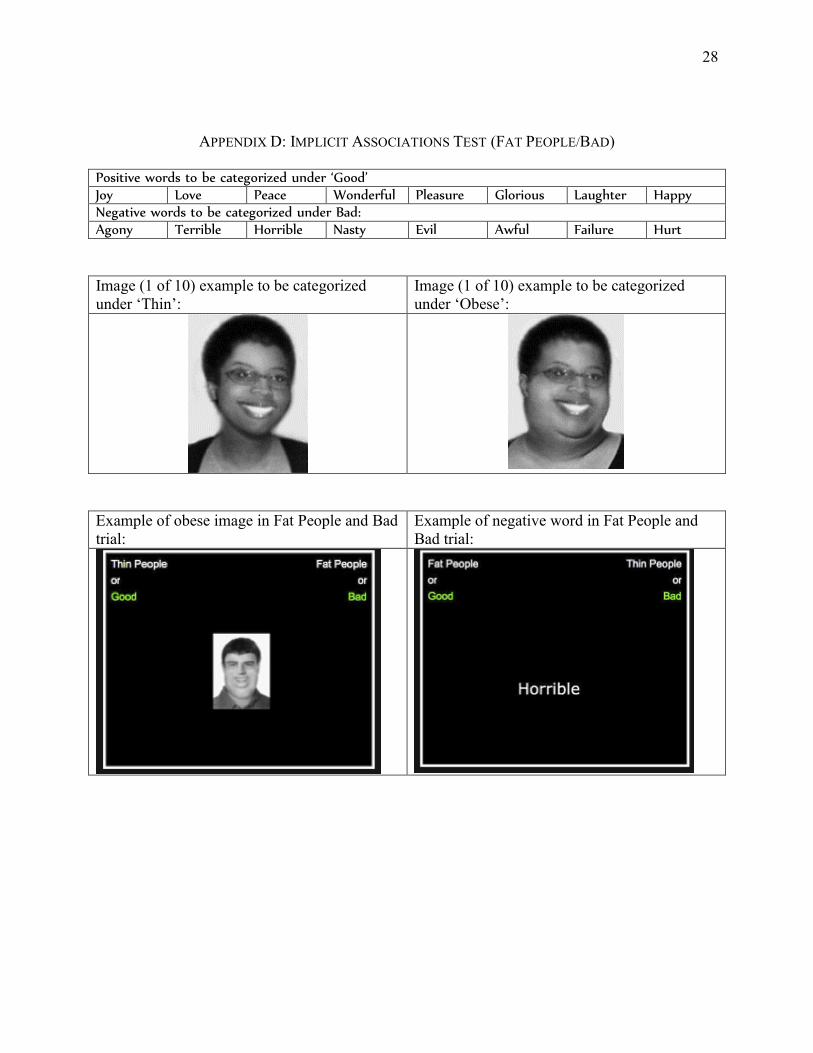
APPENDIX D: IMPLICIT ASSOCIATIONS TEST (FAT PEOPLE/BAD)
Positive words to be categorized under ‘Good’ Joy Love Peace Wonderful Pleasure Glorious Laughter Happy Negative words to be categorized under Bad: Agony Terrible Horrible Nasty Evil Awful Failure Hurt
Image (1 of 10) example to be categorized
under ‘Thin’:
Image (1 of 10) example to be categorized
under ‘Obese’:
Example of obese image in Fat People and Bad
trial:
Example of negative word in Fat People and
Bad trial:

29
APPENDIX E: DISTRACTOR ITEM
The Symbolic Racism 2000 Scale*
1. It’s really a matter of some people not trying hard enough; if blacks would only try harder they could
be just as well off as whites.
1) Strongly agree
2) Somewhat agree
3) Somewhat disagree
4) Strongly disagree
2. Irish, Italian, Jewish and many other minorities overcame prejudice and worked their way up. Blacks
should do the same.
1) Strongly agree
2) Somewhat agree
3) Somewhat disagree
4) Strongly disagree
3. Some say that black leaders have been trying to push too fast. Others feel that they haven’t pushed
fast enough. What do you think?
1) Trying to push very much too fast
2) Going too slowly
3) Moving at about the right speed
4. How much of the racial tension that exists in the United States today do you think blacks are
responsible for creating?
1) All of it
2) Most
3) Some
4) Not much at all
5. How much discrimination against blacks do you feel there is in the United States today, limiting their
chances to get ahead?
1) A lot
2) Some
3) Just a little
4) None at all
6. Generations of slavery and discrimination have created conditions that make it difficult for blacks to
work their way out of the lower class.
1) Strongly agree
2) Somewhat agree
3) Somewhat disagree
4) Strongly disagree
7. Over the past few years, blacks have gotten less than they deserve.
1) Strongly agree
2) Somewhat agree
3) Somewhat disagree
4) Strongly disagree

30
8. Over the past few years, blacks have gotten more economically than they deserve.
1) Strongly agree
2) Somewhat agree
3) Somewhat disagree
4) Strongly disagree
* Henry, P. J., & Sears, D. O. (2002). The symbolic racism 2000 scale. Political Psychology, 23, 253-
283.

31
APPENDIX F: DEMOGRAPHIC INFORMATION
I. Background Questions
Please circle the number that best represents your answer.
1. What is your gender?
a. Male
b. Female
2. What is your age in years? ________________.
3. Which one group best describes you’re the ethnic group with which you most strongly
identify?
a. American Indian / Native American
b. African American
c. Chinese
d. Fillipino
e. Hawaiʻian
f. Hispanic / Latino
g. Japanese
h. White / Caucasian
i. Pacific Islander
j. Other ______________________
4. What is your religious affiliation?
a. Buddhist
b. Catholic
c. Hindu
d. Judaism
e. Muslim
f. Protestant
g. No Preference / No religious affiliation
h. Other _______________
5. How religious are you? Please circle one.
0 1 2 3 4 5 6 7 8 9 10
Not at all Very Religious
6. Highest level of education completed (check one)

32
Current grade level:
a. Freshman
b. Sophmore
c. Junior
d. Senior
e. Uncategorized, not pursuing a degree
a. BS/BA
b. MS/MA
c. Ph. D.
7. Growing up, what was your family’s total household income?
Less than $10,000
$10,000 to $19,999
$20,000 to $29,999
$30,000 to $39,999
$40,000 to $49,999
$50,000 to $59,999
$60,000 to $69,999
$70,000 to $79,999
$80,000 to $89,999
$90,000 to $99,999
$100,000 to $149,999
$150,000 or more.
8. Please estimate your current weight _____________________.
9. Please estimate your height _____________________.

33
APPENDIX G: DEBRIEFING SCRIPT
Debriefing script (to be read to participants upon study completion)
Thank you very much for coming in today and helping us with this experiment. Now that it is
finished I have a few more questions for you, and invite you to ask questions in return. Also, I
would like to provide more information on the study.
To clarify, when we review the video recording that we took of you we will be looking for
something call gestural mimicry, not eye movements. Gestural mimicry is our tendency to
physically mimic other people. We are interested in whether or not our participant’s mimicked
the actor in the video. We said we were looking for eye movements to ensure that we wouldn’t
somehow inhibit or encourage mimicry.
Additionally, we are not concerned with eye focus and information retention. Instead we are
looking at the relationship between attitudes towards obesity and mimicry. This is why we had
you complete the questionnaires and computerized task. This means, information from the
questionnaires will be compared to how frequently you did or didn’t mimic the video actor.
Please note that the questionnaires and video data will be processed separately. By the time we
compare your answers to the amount of mimicry, the data will be coded, and consequently
anonymous. We will not be connecting your “face” with answers on the questionnaires.
If you agree to us using the videos and the questionnaires in this manner, please sign below. If
you do not agree, we will destroy the data that we collected from you today. You will still
receive extra credit in the course from which you were recruited.
We felt this cover story was integral to the structure of the experiment. However, we also want to
ensure your well-being. Do you have any concerns or feelings regarding this deception?
Do you have any further questions or concerns regarding your time spent here in the lab?
Again, we appreciate your participation. If you have further questions please refer to the contact
information available on your first consent from.
----------------------------------------------------------------------------------------------------------
Signature for Consent:
I understand that the video taken of me today will be reviewed for hand gestures and NOT eye
movements. I consent to my video being reviewed in this manner. I understand the attitude
measures were not distractor tasks but those answers will be compared to counts of gestures. I
consent to my questionnaires and computerized task results being reviewed in this manner.

34
Your Name (Print): _____________________________________________
Your Signature: _____________________________________________
Date: _________________________________

35
APPENDIX H: 2-MINUTE SCRIPT
Appendix D: Video Script
Video Script
Hi my name is Claire. I am going to share my top 10 study tips with you.
1. Get a calendar and plan everything out. Make note of all major due dates for exams and
papers. Also make note of goals posts. For instance for a major paper, schedule out due dates for
the outline, rough draft, and final copy.
2. Don’t schedule classes back-to-back. Give yourself sometime before and after each class to
go over notes and key concepts. This will help make the information stick!
3. Create a good routine where you get enough study time, but also make time to have fun and
blow off steam. Also, it is important to get enough sleep.
4. Find study buddies in every class. Talk over the material. You can ask each other questions,
edit each other’s papers, and quiz each other.
5. Study your least favorite and most complicated materials first. Save easier tasks for later in the
day and nighttime.
6. Take good notes.
7. Find a good place to study, one that is quiet and comfortable and free of distractions. I enjoy
the library.
8. Always ask your professor questions in class if you don’t understand something.
9. Study in shorter, but more frequent time periods. This is much better than cramming the night
before an exam.
10. Reward yourself for your hard work!
Thank you for listening to my top ten study tips.
36
REFERENCES
Ajzen, I., & Fishbein, M. (2005). The Influence of attitudes on behavior. In D. Albarracin, B. T.
Johnson, & M. P. Zanna (Eds.), The handbook of attitudes (pp. 173–221). Mahwah, NJ:
Lawrence Erlbaum Associates, Publishers.
Albarracin, D., Johnson, B. T., Zanna, M. P., & Kumkale, G. T. (2005). Attitudes: Introduction
and scope. In D. Albarracin, B. T. Johnson, & M. P. Zanna (Eds.), The handbook of
attitudes (pp. 3–19). Mahwah, NJ: Lawrence Erlbaum Associates, Inc.
Avenanti, A., Sirigu, A., & Aglioti, S. M. (2010). Racial bias reduces empathic sensorimotor
resonance with other-race pain. Current Biology, 20(11), 1018–1022.
doi:10.1016/j.cub.2010.03.071
Bassili, J. N., & Brown, R. D. (2005). Implicit and explicit attitudes: Research, challenges, and
theory. In D. Albarracin, B. T. Johnson, & M. P. Zanna (Eds.), The handbook of attitudes
(pp. 543–574). Mahwah, NJ: Lawrence Erlbaum Associates, Inc.
Bissell, K., & Hays, H. (2011). Understanding Anti-Fat bias in children: The Role of media and
appearance anxiety in third to sixth graders’ implicit and explicit attitudes towards
obesity. Mass Communication and Society, 14(113), 113-140.
Bessenoff, G. R., & Sherman, J. W. (2000). Automatic and controlled components of prejudice
toward fat people: Evaluation versus stereotype activation. Social Cognition, 18(4), 329–
353. doi:10.1521/soco.2000.18.4.329
Chaiken, S., & Ledgerwood, C. (2007). Dual process theories. In R. Baumeister, & K. Vohs
(Eds.), Encyclopedia of social psychology. (pp. 269-272). Thousand Oaks, CA: SAGE
Publications, Inc. doi: http://dx.doi.org/10.4135/9781412956253.n164

37
Chartrand, T. L., & Bargh, J. A. (1999). The Chameleon effect: The perception–behavior link
and social interaction. Journal of Personality and Social Psychology, 76(6), 893–910.
doi:10.1037/0022-3514.76.6.893
Chartrand, T. L., & Van Baaren, R. (2009). Human mimicry. In M. P. Zanna (Ed.), Advances in
experimental social psychology: Vol. 41. (pp. 219–274). San Diego, CA: Elsevier
Academic Press.
Dovidio, J., Kawakami, K., Johnson, C., Johnson, B., & Howard, A. (1997). On the nature of
prejudice: Automatic and controlled processes. Journal of Experimental Social
Psychology, 33(5), 510–540. doi:10.1006/jesp.1997.1331
Dovidio, J.F., Kawakami, K., Gaertner, S.L. (2002). Implicit and explicit prejudice and
interracial interaction. Journal of Personality and Social Psychology, 82(1), 62-68.
Dovidio, J., Kawakami, K., Smoak, N., & Gaertner, S. L. (2008). The nature of contemporary
racial prejudice: Insight from implicit and explicit measures of attitudes. In R. E. Petty,
R. H. Fazio, & P. Brinol (Eds.), Attitudes: Insights from the new implicit measures (pp.
165–192). New York, NY: Psychology Press.
Eagly, A. H., & Chaiken, S. (1993). Psychology of attitudes (1st ed.). Wadsworth Publishing.
Fabrigar, L. R., MacDonald, T. K., & Wegener, D. T. (2005). The structure of attitudes. In D.
Albarracin, B. T. Johnson, & M. P. Zanna (Eds.), The handbook of attitudes (pp. 79–
125). Mahwah, NJ: Lawrence Erlbaum Associates, Inc.
Fazio, R. H., Jackson, J. R., Dunton, B. C., & Williams, C. J. (1995). Variability in automatic
activation as an unobtrusive measure of racial attitudes: A bona fide pipeline? Journal of
Personality and Social Psychology, 69(6), 1013–1027. doi:10.1037/0022-3514.69.6.1013

38
Guéguen, N., & Martin, A. (2009). Incidental similarity facilitates behavioral mimicry. Social
Psychology, 40(2), 88–92. doi:10.1027/1864-9335.40.2.88
Hatfield, E., Cacioppo, J. T., & Rapson, R. L. (1994). Emotional contagion. Cambridge
University Press.
Henry, P. J., & Sears, D. O. (2002). The symbolic racism 2000 scale. Political Psychology, 23,
253-283.
Inzlicht, M., Gutsell, J. N., & Legault, L. (2012). Mimicry reduces racial prejudice. Journal of
Experimental Social Psychology, 48(1), 361–365. doi:10.1016/j.jesp.2011.06.007
Jaccard, J., & Blanton, H. (2005). The origins and structure of behavior: Conceptualizing
behavior in attitude research. In D. Albarracin, B. T. Johnson, & M. P. Zanna (Eds.), The
handbook of attitudes (pp. 125–171). Mahwah, NJ: Lawrence Erlbaum Associates, Inc.
Johnston, L. (2002). Behavioral mimicry and stigmatization. Social Cognition, 20(1), 18–35.
Krosnick, J. A., Judd, C. M., & Wittenbrink, B. (2005). The measurement of attitudes. In D.
Albarracin, B. T. Johnson, & M. P. Zanna (Eds.), The handbook of attitudes (pp. 21–76).
Mahwah, NJ: Lawrence Erlbaum Associates, Inc.
Kurzban, R., & Leary, M.R. (2001). Evolutionary origins of stigmatization: The functions of
social exclusion. Psychological Bulletin. 127(2), 187-208.
Lakin, J. L., & Chartrand, T. L. (2003). Using nonconscious behavioral mimicry to create
affiliation and rapport. Psychological science, 14(4), 334–339.
Lane, K. A., Banaji, M.R., Nosek, B.A., Greenwald, A.G. (2007) Understanding and using the
Implicit Association Test: IV what we know (so far) about the method. In B. Wittenbrink
& N. Schwarz (eds.) Implicit Measures of Attitudes. New York, NY: Guilford Press.

39
Likowski, K. U., Mühlberger, A., Seibt, B., Pauli, P., & Weyers, P. (2008). Modulation of facial
mimicry by attitudes. Journal of Experimental Social Psychology, 44(4), 1065–1072.
doi:10.1016/j.jesp.2007.10.007
McConnell, A.R., & Leibold, J. M. (2000). Relations among the implicit associations test,
discriminatory behavior, and explicit measures of racial attitudes. Journal of
Experimental Social Psychology, 37, 435-442.
Morrison, T., Roddy, S., & Ryan, T. (2009). Methods for measuring attitudes about obese
people. In D. B. Allison & M. L. Baskin (Eds.), Assessment methods for eating behaviors
and weight-related problems: Measures, theory and research (2nd ed., pp. 79–113). Los
Angeles, CA: Sage.
Nosek, B.A., Hawkins, C.B. and Frazier, R.S. (n.d). Implicit social cognition. Unpublished
manuscript.
Nosek, B. A., Greenwald, A. G., & Banaji, M. R. (2007). The Implicit association test at age 7:
A methodological and conceptual review. In J. A. Bargh (Ed.), Automatic processes in
social thinking and behavior. New York, New York: Psychology Press.
Nosek, B. A., Smyth, F. L., Hansen, J. J., Devos, T., Lindner, N. M., Ratliff (Ranganath), K. A.,
Smith, C. T., Olson, K. R., Chugh, D., Greenwald, A. G., & Banaji, M. R. (2007b).
Pervasiveness and correlates of implicit attitudes and stereotypes. European Review of
Social Psychology, 18, 36-88.
O’Brien, K. S., Latner, J. D., Halberstad, J., Hunter, J. A., Anderson, J., & Caputi, P. (2008). Do
antifat attitudes predict antifat behaviors? Obesity, 16(suppl2), S87–S92.
doi:10.1038/oby.2008.456
40
Olson, M.A., & Kendrick, R.V. (2010). Origins of attitudes. In W.D. Crano & R. Prislin (Eds.),
Attitudes and attitude change, (pp. 111-130). New York, NY: Psychology Press.
Olson, M. A., & Fazio, R. H. (2008). Implicit and explicit measures of attitudes: The perspective
of the MODE model. In R. E. Petty, R. H. Fazio, & P. Brinol (Eds.), Attitudes: Insights
from the new implicit measures, (pp. 19–63). New York, NY: Psychology Press.
Puhl, R., & Brownell, K.D. (2003). Ways of coping with obesity stigma: Review and conceptual
analysis. Eating Behaviors, 4, 53-78.
Schupp, H.T. & Renner, B. (2011). The implicit nature of the anti-fat bias. Frontiers in Human
Neuroscience, 5, 1-8.
Stel, M., Blascovich, J., McCall, C., Mastop, J., Van Baaren, R. B., & Vonk, R. (2010).
Mimicking disliked others: Effects of a priori liking on the mimicry-liking link.
European Journal of Social Psychology, 40(5), 867–880.
Schwartz, M.B., Vartanian, L.R., Nosek, B.A., & Brownell, K.D. (2006). The Influence of one's
own body weight on implicit and explicit anti-fat bias. Obesity, 14(2), 440–447.
Teige-Mocigemba, S., Klauer, K.C., Sherman, J.W. (2010). A practical guide to implicit
association tests and related tasks. In B. Gawronski & B.K. Payne (Eds.) Handbook of
implicit social cognition: Measurement, theory, and applications. New York, NY: The
Guilford Press.
Williams, A. & Steele, J. R. (n.d.) Everything you didn’t want to know about the IAT: A pocket
guide. Unpublished Manuscript.
Wilson, T.D., Lindsay, S., & Schooler, T.Y. (2000). A model of dual attitudes. Psychological
Review, 107(1), 101-126.
41
Yabar, Y., Johnston, L., Miles, L., & Peace, V. (2006). Implicit behavioral mimicry:
Investigating the impact of group membership. Journal of Nonverbal Behavior, 30(3),
97–113. doi:10.1007/s10919-006-0010-6
Zárate, M. A. (2009). Racism in the 21st century. In Handbook of prejudice, stereotyping, and
discrimination (pp. 387–406). New York, NY: Psychology Press.