IMPLICATIONS OF MARKET ACCESS FOR HOUSEHOLD
112
IMPLICATIONS OF MARKET ACCESS FOR HOUSEHOLD LIVELIHOOD SECURITY IN TANZANIA: A CASE OF BAGAMOYO DISTRICT JOYCE MUGAMBI A DISSERTATION SUBMITTED IN PARTIAL FULFILMENT OF THE REQUIREMENTS FOR THE DEGREE OF MASTER OF ARTS IN RURAL DEVELOPMENT OF SOKOINE UNIVERSITY OF AGRICULTURE. MOROGORO, TANZANIA. 2013
Transcript of IMPLICATIONS OF MARKET ACCESS FOR HOUSEHOLD

IMPLICATIONS OF MARKET ACCESS FOR HOUSEHOLD LIVELIHOOD
SECURITY IN TANZANIA: A CASE OF BAGAMOYO DISTRICT
JOYCE MUGAMBI
A DISSERTATION SUBMITTED IN PARTIAL FULFILMENT OF THE
REQUIREMENTS FOR THE DEGREE OF MASTER OF ARTS IN RURAL
DEVELOPMENT OF SOKOINE UNIVERSITY OF AGRICULTURE.
MOROGORO, TANZANIA.
2013

ii
ABSTRACT
Participation in markets is crucial for enhancing household incomes and the quality
of their lives. Despite this fact, empirical information on the implications of market
access and livelihood security is missing especially in Bagamoyo District. Therefore,
the research was conducted in Bagamoyo District in December 2011 and January
2012, and the specific objectives were to: determine market access, identify goods
and services accessed in markets, explore factors affecting market access, and
determine the contribution of marketing of goods and services to households‘
livelihood security in the study area. The study population was all households living
in the district. A sample size of 180 households was selected. Chi-square was used to
find which factors were more associated with access to the market than other factors.
It was found that availability of market information on prices of goods and services
was the factor most associated with market access in the study area. The results from
Chi-square test analysis indicated that there was significant association between
information on prices of goods and services and access to the market places (χ2
=
42.123; p < 0.0001). The findings on the contributions of market access to household
livelihood security was tested using multiple linear regression; the findings were that
the coefficient of determination, R2 was 0.344 which implies that the independent
variables were able to explain about 34% of variation in the dependent variable; the
other variation was due to natural errors in the model and other variables not entered
in the model. Although markets are the engine of all production activities, very few
market places exist. This hinders trading activities in the study area. So there is a
need to make initiatives to increase access to the market.
iii
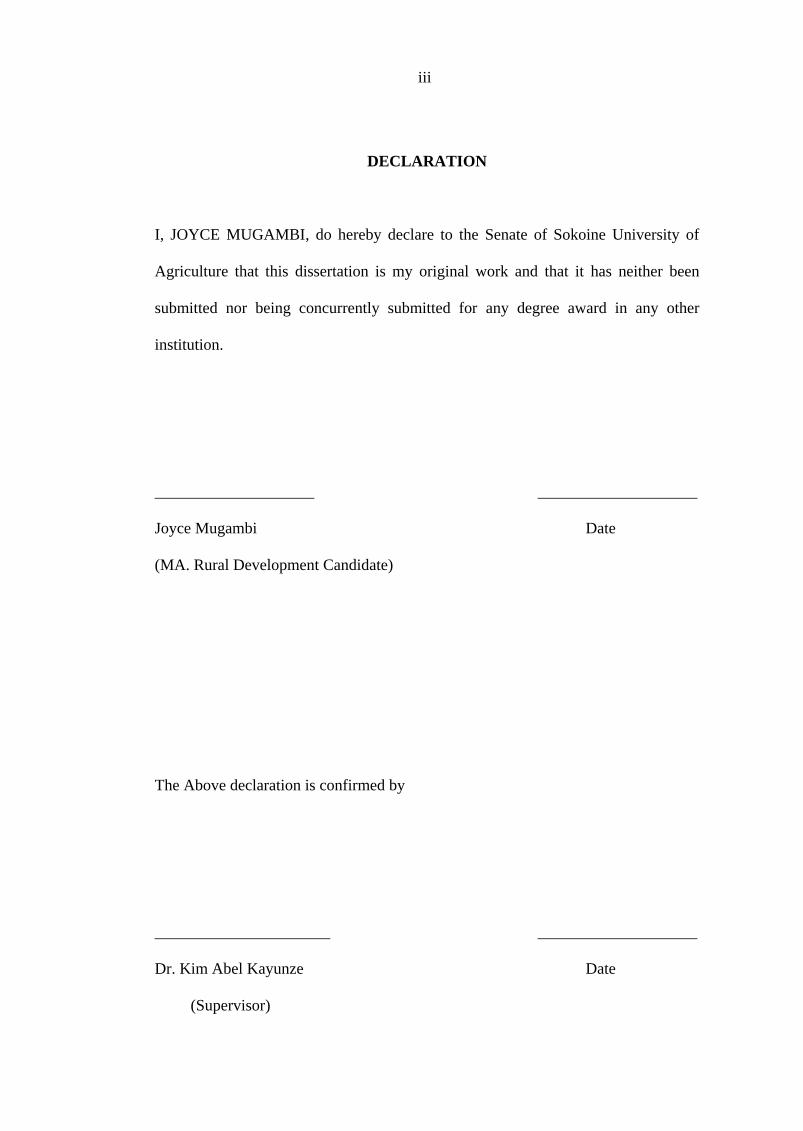
DECLARATION
I, JOYCE MUGAMBI, do hereby declare to the Senate of Sokoine University of
Agriculture that this dissertation is my original work and that it has neither been
submitted nor being concurrently submitted for any degree award in any other
institution.
____________________ ____________________
Joyce Mugambi Date
(MA. Rural Development Candidate)
The Above declaration is confirmed by
______________________ ____________________
Dr. Kim Abel Kayunze Date
(Supervisor)

iv
COPYRIGHT
No part of this dissertation may be produced, stored in any retrieval system, or
transmitted in any form or by any means without prior written permission of the
author or Sokoine University of Agriculture in that behalf.

v
ACKNOWLEDGEMENTS
Firstly, I thank the Almighty God for the protection, guidance and wisdom I received
from Him. I also give my heartfelt thanks to my parents Mr. and Mrs. Revocatus
Busanya Mugambi for their financial assistance without which I would not have
been able to cover all the costs required for the Masters Degree Programme.
I sincerely thank my supervisor, Dr. Kim Abel Kayunze, whose guidance, comments
and encouragement in writing this dissertation helped me a lot. I also express my
sincere thanks to the District Executive Director of Bagamoyo District Council, and
to the Ward Executive Officers (WEOs) of the two wards, Bwilingu and Lugoba, for
their much co-operation during the data collection exercise. Moreover, I thank the
six Village Executive Officers (VEOs) of Chalinzemzee, Bwilingu, Chahua, Lunga,
Kinzagu and Saleni who devoted their time and knowledge to facilitation of the data
collection exercise in their villages, including mobilizing heads of selected
households to appear for interview. I also thank Mr. George. A. Mhode who drove
me to the six villages mentioned above for the whole period of data collection for his
kindness and tolerance.
Finally, I thank my family – my Husband Alex Mtesigwa Bulenga and my Precious
children Daniel and McDennis – for their patience and understanding during the
whole time of my studies. They missed the love and affection of a wife and a
mother. Due to space and time I cannot mention everyone who facilitated access to
data and information, but I thank all who contributed in one way or another to the
success of my Masters Degree studies.

vi
DEDICATION
This work is dedicated to my beloved Father Mr. Revocatus Busanya Mugambi and
my lovely mother Mrs. Judith Mugeta Mugambi who laid my education foundation
and made me who I am today.
vii
TABLE OF CONTENTS
ABSTRACT ............................................................................................................... ii
DECLARATION ...................................................................................................... iii
COPYRIGHT ............................................................................................................ iv
ACKNOWLEDGEMENTS ....................................................................................... v
DEDICATION ........................................................................................................... vi
TABLE OF CONTENTS ........................................................................................ vii
LIST OF TABLES .................................................................................................. xii
LIST OF FIGURES ................................................................................................ xiv
LIST OF APPENDICES .......................................................................................... xv
LIST OF ABBREVIATIONS ................................................................................. xvi
CHAPTER ONE ......................................................................................................... 1
1.0 INTRODUCTION ............................................................................................. 1
1.1 Background Information ..................................................................................... 1
1.2 Problem Statement .............................................................................................. 4
1.3 Justification of the Study ..................................................................................... 5
1.4 Objectives ............................................................................................................ 6
1.4.1 General objective ................................................................................... 6
1.4.2 Specific objectives ................................................................................. 6
1.4.3 Research questions ................................................................................. 7
1.5 Limitations Encountered ..................................................................................... 7
CHAPTER TWO ....................................................................................................... 8
viii
2.0 LITERATURE REVIEW ................................................................................. 8
2.1 General Information on Market Access and Livelihood Security ...................... 8
2.1.1 Information on market access ................................................................ 8
2.1.1.1 Global market access ............................................................. 10
2.1.1.2 Market access in Africa ......................................................... 12
2.1.1.3 Market access in Tanzania .................................................... 16
2.1.1.4 Market access in Bagamoyo .................................................. 20
2.1.2 Information on livelihood security ....................................................... 20
2.1.2.1 Livelihood, livelihood assets and livelihood security ........... 20
2.1.2.2 Global livelihood security ..................................................... 24
2.1.2.3 Livelihood security in Africa ................................................ 25
2.1.2.4 Livelihood security in Tanzania ............................................ 27
2.1.2.6 Livelihood security in Bagamoyo ......................................... 28
2.2 Positive and Negative Linkages between Market Access and Livelihood
Security ............................................................................................................ 30
2.3 Theoretical Information on Linkages between Market Access and
Livelihood Security .......................................................................................... 30
2.4 Empirical Literature .......................................................................................... 31
2.5 Paucity in Literature .......................................................................................... 32
2.6 Conceptual framework ...................................................................................... 33
CHAPTER THREE ................................................................................................. 35
3.0 RESEARCH METHODOLOGY .................................................................. 35
3.1 Description of the Study Area ........................................................................... 35

ix
3.2 Research Design and Sampling ......................................................................... 36
3.3 Population of the Study and the Sample Size ................................................... 36
3.4 Sampling Procedures ......................................................................................... 36
3.5 Pre-Survey ......................................................................................................... 37
3.6 Data Collection Methods ................................................................................... 37
3.6.1 Primary data ......................................................................................... 37
3.6.2 Secondary data ..................................................................................... 38
3.7 Data Analysis .................................................................................................... 38
CHAPTER FOUR .................................................................................................... 40
4.0 RESULTS AND DISCUSSION ..................................................................... 40
4.1 Socio-Demographic Characteristics of the Respondents .................................. 40
4.1.1 Age ....................................................................................................... 40
4.1.2 Marital status ........................................................................................ 40
4.1.3 Education level ..................................................................................... 41
4.1.4 Household size ..................................................................................... 42
4.1.5 Household main sources of income and income gained ...................... 43
4.1.6 Land size owned ................................................................................... 44
4.2 Market Access in the Selected Study Areas ...................................................... 45
4.2.1 Number of markets in the study area ................................................... 45
4.2.2 Distance from respondents‘ residences to the nearest market places .. 45
4.2.3 The average time taken to the nearest market place ............................ 46
4.2.4 Means of transport to and from market places ..................................... 46
4.2.5 Accessibility of market places in the study area .................................. 47
x
4.3 Goods and services accessed in markets in the study area ................................ 47
4.3.1 Agricultural goods accessed in the market ........................................... 48
4.3.2 Non-agricultural goods accessed at the market place .......................... 49
4.3.3 Services accessed at market place ........................................................ 50
4.4 Factors Affecting Market Access in the Study Areas ....................................... 51
4.4.1 Types of road and road passability ....................................................... 51
4.4.1.1 Types of road from / to the market places ............................. 51
4.4.1.2 Road passability .................................................................... 52
4.4.2 Means of transport used ....................................................................... 52
4.4.3 Storage equipments used ...................................................................... 53
4.4.4 Market information .............................................................................. 55
4.4.4.1 Information on demand and supply of goods and
services at market places………………………………….. 55
4.4.4.2 Information on prices of goods and services at a
market place ......................................................................... 56
4.4.5 Rules and regulations at market places ................................................ 57
4.4.6 Transaction costs .................................................................................. 58
4.5 Effects of Market Access on Households‘ Livelihood Security ....................... 59
4.5.1 Assets possession within households ................................................... 59
4.5.2 Food security ........................................................................................ 61
4.5.3 Engagement in formal and informal groups ......................................... 62
4.5.3.1 Formal and informal groups .................................................. 62
4.5.3.2 Reasons for not joining formal and informal groups ............ 63
4.5.4 Livelihood security and market access ................................................ 64

xi
4.5.5 Regression model to explain effect of market access on household
livelihood security………………………………………………….. .. 65
CHAPTER FIVE ...................................................................................................... 67
5.0 CONCLUSIONS AND RECOMMENDATIONS ........................................ 67
5.1 Conclusions ....................................................................................................... 67
5.2 Recommendations ............................................................................................. 68
5.2.1 Policy level recommendations ............................................................. 69
5.2.2 Local government level recommendations .......................................... 69
5.2.3 Household level recommendations ...................................................... 70
5.2.4 Recommendations for further research ................................................ 71
REFERENCES ......................................................................................................... 72
APPENDICES .......................................................................................................... 85

xii
LIST OF TABLES
Table 1: Distribution of respondents involved in the study ................................... 36
Table 2: Distribution of the respondents by age .................................................... 40
Table 3: Marital status of the respondents ............................................................. 41
Table 4: Education level of the respondents .......................................................... 42
Table 5: Household size of the respondents ........................................................... 42
Table 6: Main source of income of the respondents ............................................... 43
Table 7: Income gained from off farm activities and agricultural produce ............. 44
Table 8: Land size owned by the Respondents ....................................................... 44
Table 9: Number of market places in the study area ............................................... 45
Table 10: Distance from home to the nearest market place ...................................... 46
Table 11: The average time taken to the nearest market .......................................... 46
Table 12: Means of transport to and from market places ......................................... 47
Table 13: Accessibility to the market places of households .................................... 47
Table 14: Agricultural goods accessed at the market place by households ……… . 49
Table 15: Off farm produce at the market place ...................................................... 50
Table 16: Services accessed at the market places ...................................................... 50
Table 17: Road types from home to the nearest market ........................................... 51
Table 18: Means of transportation of people, goods and services ........................... 53
Table 19: Storage places, facilities used at home and at the market ........................ 54
Table 20: Information on demand and supply of goods and services ...................... 55
Table 21: Information on prices of goods and services ........................................... 56
Table 22: Rules and regulations found at market place ............................................ 57
Table 23: Transaction costs ....................................................................................... 58

xiii
Table 24: Ranking transaction costs ........................................................................ 59
Table 25: Distribution of respondents according to the value of assets owned…....60
Table 26: Number of meals per households ............................................................. 61
Table 27: Costs of meals in Tanzanian shillings in each household ........................ 62
Table 28: Formal and informal groups ...................................................................... 63
Table 29: Reasons for not joining with formal and informal groups ........................ 64
Table 30: Livelihood security and market access ..................................................... 64
Table 31: Regression analysis ............................................................................... 65

xiv
LIST OF FIGURES
Figure 1: Conceptual framework for the research, adapted from DFID (2001) ........ 34
Figure 2: Road passability in the year ....................................................................... 52
xv
LIST OF APPENDICES
Appendix 1: Operational definitions of key variables ............................................ 85
Appendix 2: Household questionnaires for the implications of market
access for households livelihood security……………………… ..... 86
Appendix 3: Interview for the key informants (Checklist) ....................................... 96
xvi
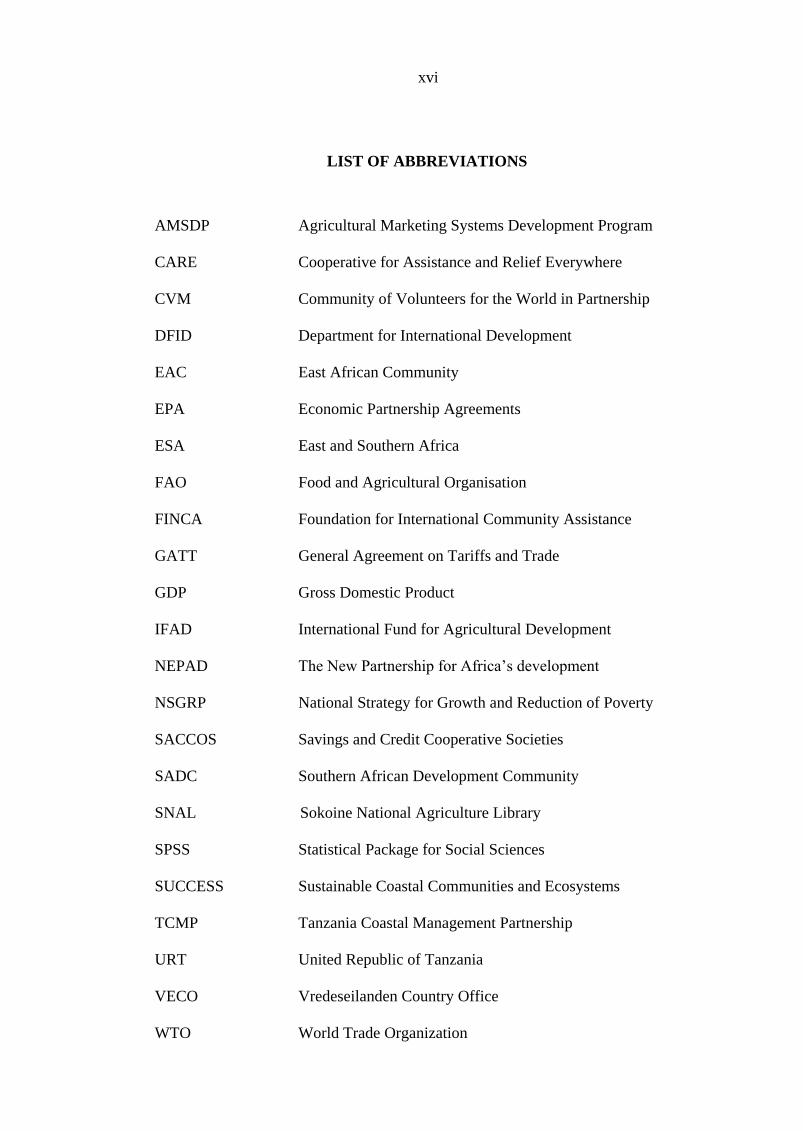
LIST OF ABBREVIATIONS
AMSDP Agricultural Marketing Systems Development Program
CARE Cooperative for Assistance and Relief Everywhere
CVM Community of Volunteers for the World in Partnership
DFID Department for International Development
EAC East African Community
EPA Economic Partnership Agreements
ESA East and Southern Africa
FAO Food and Agricultural Organisation
FINCA Foundation for International Community Assistance
GATT General Agreement on Tariffs and Trade
GDP Gross Domestic Product
IFAD International Fund for Agricultural Development
NEPAD The New Partnership for Africa‘s development
NSGRP National Strategy for Growth and Reduction of Poverty
SACCOS Savings and Credit Cooperative Societies
SADC Southern African Development Community
SNAL Sokoine National Agriculture Library
SPSS Statistical Package for Social Sciences
SUCCESS Sustainable Coastal Communities and Ecosystems
TCMP Tanzania Coastal Management Partnership
URT United Republic of Tanzania
VECO Vredeseilanden Country Office
WTO World Trade Organization

1
CHAPTER ONE
1.0 INTRODUCTION
1.1 Background Information
A market is the interaction of demand and supply (buyers and sellers) of particular
types of goods or services (Koenig et al., 2008). More formally, a market is an
institution or organization that manages the business of goods and services. This
means that any relationship between buyers and sellers of a product within a certain
period of time has been able to exchange goods and services even if the
communication is done via communication devices like telephone, mobile phone or
internet is a market (Chartier and Johnson, 2011).
Markets are where household livelihoods depend directly as either producers or
workers buying their inputs or selling their products (Taylor, 2010), and where
consumers spend their income from the sale of crops or from their non-agricultural
activities, to buy their food requirements and other consumption goods (IFAD,
2003). The efficient functioning of markets is seen as the primary force underlining
growth and development of the people‘s livelihood which are from farm and non-
farm activities (Ireland et al., 2004). Perhaps the most important point is that
development of livelihoods critically depends upon, among other things, demand for
the outputs (goods and services) supplied by those livelihoods (Doward et al., 2002).
Livelihoods are diverse and made up of multiple activities to achieve a desired
outcome. They are also determined by what assets (resources) are available at the

2
household level in terms of ownership and access. Depending on household assets,
people undertake a diverse array of activities to earn their living. Poor access to
markets for both farm and non-farm products poses a serious challenge to the
improvement of household livelihood security, especially among the sub-Saharan
African countries.
In Tanzania, agriculture provides 82% of households‘ livelihoods of the population
(URT, 2009a), while the remaining 18% comes from non-agricultural produce.
There is increasing recognition of the need to develop efficient, integrated and highly
responsive markets because rural people in Tanzania, especially the poor, cannot
improve their living without accessing markets (Heinemann, 2002). However, access
to markets is a multi-faceted problem and a hurdle that smallholders have to
overcome (URT, 2009a). Producers are commonly faced with poor infrastructure to
reach markets, barriers in penetrating markets due to limited resources, lack of
information, few support mechanisms and restrictive policies (URT, 2009b).
The period of 1990s was characterized by reforms in the public sector. The
Government of the United Republic of Tanzania (Mainland) undertook the reforms
in order to increase efficiency and the capacity of the public sector to deliver quality
services. The reforms centered on the following areas: Civil Service Reforms, Local
Government Reforms, Financial Sector Reform, Legal Sector Reform, Planning and
Budgeting Reform, Parastatal Organizations Reform and Restructuring of the
Regional Administration (URT, 2003b and 2007b).

3
Tanzania adopted economic reforms in the 1980s after experiencing a steady decline
in economic growth in the late 1970s that led to a financial crisis in the early 1980s.
These economic reforms were: National Economic Survival Programme (NESP)
formulated in 1981 to address the economic crisis, Structural Adjustment
Programme (SAP) formulated in 1982 and was designed to finance the fiscal deficit
largely through domestic borrowing in the absence of external assistance and
Economic Reform Programme (ERP) formulated in 1986, which was supported by
multilateral institutions, including the World Bank, IMF, and bilateral donors
(Muganda, 2004). Fifteen years of structural adjustment programs (SAPs) did not
improve the quality of life for Tanzanian citizens (Weissman, 2005).
Moreover in 1999, the government formulated the Development Vision 2025 and in
2005 the National Strategy for Growth and Reduction of Poverty (NSGRP), while in
2003 it formulated Rural Development Policy (2003) and agricultural based
programmes including Agricultural Sector Development Programme (ASDP), and
District Agricultural Development Programmes (DADPs), primarily as means
towards growth and reduction of poverty in order to improve the quality of lives and
social well being of the people, enhance good governance and accountability (URT,
1999; 2000; 2003b; 2007b).
The above economic reforms have forced the withdrawal of the state from
agricultural commodity markets, and livelihoods have become increasingly
commercialized. Rural households are restructuring the ways they manage their
economic activities and are transforming their social relations. Access to markets in
4
most parts of the country is becoming more difficult and, therefore, is becoming of
central focus to the government and most of development practitioners in the
developing world (VECO Tanzania, 2006).
The government has recognized the above challenges from market and taken some
measures to support the development of rural livelihoods. These measures
principally focus upon increasing productivity, market access, and the sustainable
use of natural resources (URT, 2008). Apart from those efforts, Tanzania still has
uncertain market participation, risky and conduct on unfavourable terms. The
rewards, costs and risks of doing so are all contexts and vary for different producers
and sellers of goods and services (IFAD, 2011).
Market participation is also a challenge in Bagamoyo as Kikula et al. (2003) asserts
that road infrastructure is still poor, especially to and from villages which constrain
marketing of farm produce and forest products. Marketing uncertainties discourage
farmers, waste people‘s efforts and income, and intensify poverty. Also Masaiganah
(2010) observes that lacking information on transport and markets, low-skilled
personnel and low education standards hinder sustainable development to be reached
among women in Bagamoyo District.
1.2 Problem Statement
It has been noted that, with access to market and not one but multiple markets, poor
households will find a pathway out of poverty and generate more income, which
contributes to their livelihood security (Taylor, 2010). Participation in markets is

5
crucial for enhancing household incomes and the quality of their lives. Despite this
fact, empirical information on the implications of market access and livelihood
security is missing, especially concerning Bagamoyo District. This research aimed at
finding the linkage between the outcome of accessing to the market and livelihood
security.
1.3 Justification of the Study
This study intended to establish the relationship between market access and
households‘ livelihood security in Tanzania. The study is of particular significance
as it provides a deeper understanding of the subject, based on empirical evidence. So
far little theoretical information about market and livelihood security in Tanzania
and elsewhere has been provided, with very little empirical evidence on the subject.
Most of the studies available, for example Masaiganah (2010); Amani (2006);
Kikula et al. (2003) have focused on problems of market access for agricultural
produce rather than its link to livelihood security. As the study looked at how market
access contributes to the livelihood security, particularly on three components of
food security, asset possession and social networks; it came up with proposed
interventions on improvement of livelihood of the households. Moreover, in the
studies cited above the researchers used different methods by looking into market
problems in general, or linking markets with groups like farmers groups, smallholder
farmers, and women, but not specifically into the households‘ livelihoods.

6
Also, this study is in line with millennium development goal number 8, which insists
on development of a global partnership for development, where market access is one
of the aspects in this goal. It is also in line with the Tanzania Development Vision
2025 which defines the course of the country‘s economic and social goals which
include high quality livelihood. The study is also related to the National Strategy for
Growth and Reduction of Poverty (NSGRP II) cluster II which focuses on quality of
life and social well being.
The study findings led to recommendations to policy makers and planners on some
of the consequences, which will be the starter for improving planning. Therefore, in
this study the effort was made to link market access to households‘ livelihood
security. The study was specifically focused on the possible outcomes of market
access of goods and services at market places for households‘ livelihood security in
Tanzania, particularly in Bagamoyo District.
1.4 Objectives
1.4.1 General objective
The main objective of this study was to examine the implications of market access
for households‘ livelihood security in Tanzania, particularly in Bagamoyo District.
1.4.2 Specific objectives
(i) To determine market access in the selected study areas.
(ii) To identify goods and services accessed in market places in the study area.
(iii) To explore factors affecting market access in the study areas.
7
(iv) To determine the contribution of marketing of goods and services to
households‘ livelihood security in the study area.
1.4.3 Research questions
(i) How many market places exist in the study area?
(ii) What are the goods and services offered in the markets in the study area?
(iii) What are the factors affecting market access in the study area?
(iv) What are the contributions of market activities in households‘ livelihood
in the study areas?
1.5 Limitations Encountered
The issue of record keeping in households was rarely practised and more time was
consumed in responding to the issue of household income per month, assets and
meals costs. Tolerance and more time in interviewing the respondents helped to
resolve the problem.
8
CHAPTER TWO
2.0 LITERATURE REVIEW
2.1 General Information on Market Access and Livelihood Security
2.1.1 Information on market access
Before scrutinizing the concept of market access it is better to start with the issue of
market. Arthur and Sheffrin (2003) define market as one of many varieties of
systems, institutions, procedures, social relations and infrastructures whereby parties
engage in exchange. Arthur and Sheffrin (2003) argue that parties may exchange
goods and services by barter where most markets rely on sellers offering their goods
or services (including labour) in exchange for money from buyers. It can be said that
a market is the process by which the prices of goods and services are established. In
this work, a market is defined as an actual place and not nominal where buyers and
sellers interact directly or via intermediaries through exchange of goods and services
by using money. The exchange rules differ depending on the character of the goods
traded (example commodities, perishable products, investment goods or services).
Market access refers to the ability of providers of foreign goods and services to sell
in a given country. For the purposes of market access negotiations in the World
Trade Organization (WTO) context, tradable items are subdivided into four groups
namely agricultural goods, textiles and clothing, industrial goods, and services. As
different multilaterally agreed rules apply to each group, analytical and monitoring
work usually follows the same pattern (Geithner and Nankani, 2002). Market access
has traditionally been analyzed from a very narrow international trade perspective. In

9
the trade policy literature, market access is an umbrella term aimed at including
analysis of a number of measures that a country may use to restrict imports. There is
a long list of such measures, including tariffs on imported goods, and non-tariff
barriers such as technical standards, anti dumping actions, import quotas and import
licensing (World Trade Report, 2012).
Tariffs were cut on a selective product-by-product basis through requests and offers
made between participants. However, subsequently contracting parties decided to
use formulas to cut tariffs across-the-board .Many non-tariff measures are based on a
legitimate goal (such as the protection of human health) and can be introduced in a
WTO consistent manner (WTO, 2010). Market access is interpreted in the General
Agreement on Tariffs and Trade (GATT) to reflect the competitive relationship
between imported and domestic products. For example, when a government agrees
to reduce its import tariff on a particular product, it alters the competitive
relationship between imported and domestic units of the product in favour of
imported units, and it thereby provides greater market access to foreign producers
(Bagwell and Kraiger, 2001).
By agreeing to lower its tariff, the government is effectively agreeing to engineer an
outward shift of its import demand curve that is, all else equal, a greater volume of
imports will be demanded at any given price from foreign exporters and as a result,
foreign exporters can expect to enjoy an increase in sales into the domestic market
and to receive a higher price (Bagwell and Staiger, 2001). Moreover, market access
is defined according to three dimensions which are the physical access to markets

10
(especially distances and costs), structure of the markets (asymmetry of relations
between farmers, market intermediaries and consumers) and producers‘ skills,
information and organization (understanding of the market, prices bargaining)
(IFAD, 2003).
In this work, market access is defined as the ability of a household to reach actual
market place by considering actual distance to the market place, time taken to the
market, road type, transport and transportation facilities, market information of
demand, supply and price of commodities, rules and regulations, and storage
facilities used.
2.1.1.1 Global market access
Over the past half century, WTO and its predecessor GATT have gradually increased
market access as a series of outcomes from the various ‗Rounds‘ of trade
negotiations. As a consequence of tough negotiations on market access during the
Uruguay Round, most countries cut tariffs significantly, and adopted tariff bindings -
levels above which tariffs may never rise for almost all imports (Geithner and
Nankani, 2002).
Market access negotiations in the WTO encompass trade in goods and services .The
market access negotiations, mandated at the time of establishment of the WTO and
began in early 2000, cover only agriculture and services. Market access
negotiations in goods essentially concern tariff reductions and the elimination or
reduction in the incidence of certain non-tariff barriers to imports. Should this be
11
agreed, then such negotiations on industrial products will be carried out separately
from those in agriculture, perhaps under a special committee, although many of the
technicalities on market access are similar, as discussed below. While these
negotiations will be separate, WTO Members are likely to be mindful of the need to
obtain a cross-sectoral balance (Laird, 2001).
More recently, WTO members agreed at the 2001 Doha Ministerial conference that
more aggressive negotiations should begin toward the goal of increasing market
access in recognition that the main purpose of the original GATT was to ultimately
eliminate tariffs on industrial goods. According to Geithner and Nankani (2002), the
Doha Development Agenda envisages negotiations on market access in three areas
mentioned below:
(a) Import tariffs and other price-based border measures
These are government policies usually targeted at restricting market access in a
particular commodity and raising budget revenue. These measures include import
duties, tariff quotas, and other border duties, levies, and charges (Sumner, (2003).
(b) Non tariff border measures
These are government policies that may restrict market access through non-price
instruments. Such measures include quantitative restrictions (import quotas, direct
prohibitions, domestic content requirements, licensing); contingency measures
(antidumping, countervailing, and safeguard measures); technical barriers to trade
(TBT) (regulations, standards, testing and certification procedures); sanitary and

12
phytosanitary measures (SPS) (food, animal and plant health and safety) (World
Trade Report, 2012).
(c) Domestic policy measures
These are government policies, which may restrict market access if not applied
uniformly to domestic and imported goods and services. These are tax, competition,
credit, and investment policies; price controls; and fiscal incentives, in particular,
trade-distorting export subsidies and domestic support (Sumner, 2003 and World
Trade Report, 2012).
Globally, the interpretation of market access as applied in GATT is that when
governments expand market access through GATT negotiation they do so as
importers, not exporters. That is, in effect, each government agrees to undertake
certain obligations (its tariff concessions) which shift out its import demand curve
and thereby provides greater market access to foreign exporters in exchange for the
market access benefits that its own exporters enjoy when foreign governments
similarly undertake obligations which shift out their respective import demand
curves. GATT‘s legal structure is designed to facilitate this kind of exchange among
governments (Bagwell and Staiger, 2001).
2.1.1.2 Market access in Africa
The issue of market access is a crucial one for Africa. Ever since the WTO came into
force, subsequently, with their increasingly dynamic role in that institution, African
countries have placed this matter high on the agenda. The importance of market

13
access in development probably stands out more visibly in the case of Africa than in
much of the rest of the world. This situation is explained by the restricted nature of
Africa‘s markets and the need for the continent to rely on export markets in order to
support growth and diversification efforts (Hammouda et al., 2007).
Market access for industrial products is a key factor for African countries. Even
though industrial tariffs have decreased sharply for several years, world markets
continue to witness high tariffs for some of the sectors, which are sensitive for
African countries because they are labour intensive sectors. At the same time,
African countries are also adversely affected by high tariffs on industrial goods,
which hamper their efforts to diversify their economies (Hammouda et al., 2007).
Alongside the opening up of developed countries‘ markets, African countries yearn
for more protection mechanisms to foster their development in the industrial sphere.
Integrating Africa‘s economies into the globalizing international arena and achieving
rapid economic growth will depend upon improved global market conditions for
industrial commodities and more attention being given to Africa‘s concerns. The
present study is aimed at assisting African countries to formulate concrete proposals
in regard to market access for non-agricultural commodities (Hammouda et al.,
2007).
However, in terms of market access, for developing countries especially the LDCs
market access has become a chicken and egg issue. On one hand developed countries
make market access available to developing countries, especially LDCs, while on the

14
other hand these countries fail to have production capacities to export into these
markets. Accordingly, we will endeavour to identify the most appropriate formulas
for African countries those agreed to allow for greater liberalization of developed-
country markets while offering ample opportunity for African countries to develop
their industries and to diversify (Hammouda et al., 2007).
The issue of market access for industrial commodities is a crucial one for African
countries. The main issue relates to average tariffs applied on exports from these
countries. The developed countries have reduced by half their tariffs on industrial
exports from developed countries while the reduction for products from the
developing countries has been only by one-third. Thus, the average weighted rate
applied by the developed countries among themselves has been in the region of 3 per
cent while that applied on imports from developing countries has been around 5 per
cent. These data reveal a sharp decline in industrial tariffs over a period of several
years (Sumner, 2003).
This decline has obviously been more marked in the developed countries than in
African countries, some of which have continued to protect their industrial sector in
an effort to address the productivity divide that separates them from the developed
countries (Laird, 2001). It should also be noted, however, that the reduction of tariffs
on industrial commodities has benefited developed countries more than developing
countries. This escalation poses a major hurdle to diversification in the developing-
country economies. In most cases, the brunt of these pressures is borne by wage
levels to enable developing-country exporters to break even. Thus, despite the tariff

15
reductions applied on industrial commodities and preferential treatment extended to
them, exports of African countries continue to face major obstacles in accessing
developed-country markets. Imbalances in the tariff reductions, the tendency towards
escalation, and tariff peaks, all weigh heavily on competitiveness of products from
developing countries and so are at the very core of WTO negotiations (Laird, 2001).
A number of challenges face smallholder farmers in market participation. For most
African smallholder farmers, markets are difficult to access (Makhura, 2001).
Formal market access is difficult for smallholder farmers in rural areas because of a
wide range of barriers and constraints. These include lack of assets (example tenure
and collateral), market information, appropriate training, limited access to services
necessary for crop production and high costs involved in production and marketing
(Matungul, 2002 and Makhura, 2001).
Effective market participation is further challenged by a lack of innovative
institutions to support farmers (Chema et al., 2002). Most African countries have a
poor infrastructure in rural areas and weak institutions, such as credit provision, to
support smallholder agricultural development. Market access and transport costs are
some obstacles that inhibit the growth of smallholder farmers in developing
countries (Matungul, 2002).
Rich countries limit and control poor countries' share of the world market by
charging high taxes on imported goods. As a result, many poor countries can only
afford to export raw materials, which give far lower returns than finished products.

16
For example, the rich world buys cheap cotton and cocoa and turns them into
expensive clothes and chocolate reaping all of the profit. At the same time, poor
countries are threatened with having loans withheld unless they open their markets to
rich countries' exports. Trade generates incredible wealth, and links the lives of
everyone on the planet. However, millions of people in poor countries are losing out
because the rules controlling trade heavily favour the rich nations that set the rules
(VECO Tanzania, 2006).
2.1.1.3 Market access in Tanzania
As a member of the WTO, Tanzania has most favoured nation access to market and
national treatment commitments scheduled by other WTO members. In the same
way, all WTO members have access to Tanzania‘s own commitments on market
access and national treatment scheduled in the tourism sector. In addition, under
Article V of the GATT on Economic Integration Agreements, Tanzania would also
have access to any regional arrangements that provide enhanced market access
beyond what is available to other WTO members. The various integration processes
undergoing under the East African Community (EAC) and Southern African
Development Community (SADC) would fit under this provision. The EAC is still
charting out its path on services integration within the region, while the SADC had
its protocol on services (URT, 2006a).
Tanzania is also in the process of negotiating Economic Partnership Agreements
(EPA) on services and other issues such as investments, competition, government
procurement and others with the European Union through the EAC. The EPA is

17
supposed to be WTO compatible in order to meet the conditions of Article V of the
GATT. Tanzania‘s participation in regional cooperation is aimed at reducing the
trade imbalances with regional partners, achieving harmonization of economic
policies, legislation, procedures, facilitating trade through smooth movement of
goods and services, as well as promoting diversification of exports and becoming a
competitive trading country. Trading through bilateral and regional groupings has
several advantages such as proximity, cultural similarity and business environment,
all of which substantially reduce operational costs (URT, 2006a).
The Economic Survey (2006) indicates that while Tanzania exports more goods and
services to Kenya than in the past, it still has negative terms of trade with Kenya,
SADC and the EAC as a whole. When disaggregated, the findings are that Tanzania
is a net exporter to some individual countries like Uganda and Democratic Republic
of Congo (DRC). Most small scale farmers in remote areas like the southern
highlands of Tanzania cannot link to markets. Lack of information and lack of power
at the negotiating table leave them open to exploitation by other participants in the
market chain. Poor farmers in Tanzania‘s southern highlands participated in the First
Mile Project, an initiative supported by the International Fund for Agricultural
Development (IFAD) and the Government of Switzerland. It is implemented in
collaboration with the Tanzanian Government‘s Agricultural Marketing Systems
Development Programme (AMSDP), a seven year programme that will increase poor
rural people‘s food security and incomes by improving the structure and
performance of the country‘s crop marketing systems (Lightfoot et al., 2008).
18
The First Mile Project developed an innovative way to tackle these challenges; it
encouraged people in isolated rural communities to use new information and
communication technologies (ICTs), including mobile phones, to obtain access to
pertinent market information. It also used the Linking Local Learners (LLL)
approach, which combines face-to-face action learning with use of an Internet based
learning platform. This enabled farmers, traders, processors, and other stakeholders
to learn how to build profitable marketing chains from producers to consumers
(Lightfoot et al., 2008).
Poor farmers in Tanzania face two main challenges when trying to develop access to
markets and thus improve their livelihoods. First, they lack access to relevant
information and knowledge and to communication technologies such as mobile
phones, the Internet, and e-mail. Second, they need better access to other key people
in the market chain, including processors, traders, and consumers. Without this
information and knowledge, poor farmers are subject to market fluctuations and
receive only low prices for their products. Farmers often respond to low prices by
cheating, which further increases inefficiencies along the market chain (Lightfoot et
al., 2008).
In Tanzania, nearly all goods are distributed through wholesalers and retailers.
Wholesalers import goods from the manufacturers or other wholesalers abroad in
bulk, transport the goods to bonded warehouses, and later distribute them to retailers
in the local market. Retailers purchase the goods, pay the required duties, and sell in
small shops, usually specializing in one type of product. Some wholesalers, usually
19
operators of supermarket chains and shopping malls, run both wholesale and retail
operations.
In the chain of distribution, imports come through ports of entry, are cleared and
taken to bonded warehouses, unless customs duties are paid at the time of entry.
Major sea ports include Dar es Salaam, Tanga, Mtwara and Zanzibar; major airports
include Dar es Salaam International Airport, Kilimanjaro International Airport, and
Zanzibar International Airport. In most cases, market forces determine the pricing
technique to be adopted. The Tanzanian government has eliminated most price
controls; however, the government regulates the price of gasoline, diesel fuel and
kerosene through the Energy and Water Utilities Regulatory Authority (EWURA).
The 18 percent value-added tax charged in Tanzania must be factored into the price
(URT, 2006a).
Although Tanzania has undertaken market reforms in recent years, these reforms are
not sufficient to generate greater supply response and competitiveness. Market
liberalization may have removed price distortions, reduced marketing margins, and
improved market integration, but the agricultural market in Tanzania remain
underdeveloped, and most small scale farmers, especially those living away from
roads and market places, have not benefited much from the reforms (Amani, 2005).
VECO contributes to family farmers‘ empowerment to improve their positions in the
whole agricultural commodity chains, from production to consumption. In these
chains, consumer demand and markets are driving forces. Enhancement of the active

20
participation of smallholder farmers in the market is therefore central to VECO
Tanzania‘s realization and progress towards the desired economic impact at
household level (VECO Tanzania, 2006).
2.1.1.4 Market access in Bagamoyo
Very few literatures touched the area of market in Bagamoyo district especially on
off farm produce like tourism and some sort of farm produce. For example Kikula et
al. (2003) reiterate that roads are very poor from most of the villages to the nearest
city of Dar es salaam which hinders smallholder farmers from selling their farm
produce.
2.1.2 Information on livelihood security
2.1.2.1 Livelihood, livelihood assets and livelihood security
A livelihood comprises the capabilities, assets (stores, resources, claims and access)
and activities required for a means of living: a livelihood is sustainable if it can cope
with and recover from stress and shocks, maintain or enhance its capabilities and
assets, and provide sustainable livelihood opportunities for the next generation: and
which contributes net benefits to other livelihoods at the local and global levels in
the long and short terms (Chambers and Conway, 1992).
A range of assets is required to achieve positive livelihood outcomes since no single
category of assets can alone meet the varied needs of people. Those assets are both
tangible and intangible assets that allow them to meet their needs. Those assets are as
follows:
21
(a) Natural capital
This consists of natural resource stocks from which resource flows useful for
livelihoods are derived (e.g. land, water, wildlife, biodiversity, and environmental
resources) (CARE, 2002). Natural capital provides communities with the resources
they require for their production activities on farm and off farm activities. These
resources provide a foundation for formal and informal sector economy.
(b) Financial capital
Comprises cash and other liquid resources (e.g. savings, credit, remittances,
pensions, etc) (CARE, (2002); Chambers and Conway, (1991). The households
wishing to start a business, whether in the farming or non-farming sector they need
access to credit. Without having amount of cash they will be limited to a small
number of activities will yield poor returns and hence their livelihood security will be
low.
(c) Physical capital
This includes basic infrastructure (e.g. transport, shelter, energy, communications
and transportation, production equipment, and other material means) that enable
people to maintain and enhance their relative level of wealth (CARE, 2002).
Availability of physical infrastructure like roads enables households to travel to
market places easily and reduce time taken to the market places, thus accelerates the
trading process.

22
(d) Human capital
Human capital consists of the skills, knowledge, ability to labour and good health,
which are important to the pursuit of livelihood strategies (CARE, 2002).For
example, provision of training to households increases their ability to manage
business activities as well as their income generating activities, hence contribute to
increase productivity. It is considered that, the health status of household members
has a significant bearing on their participation in income generating activities
(Luoga, 2008).
(e) Social capital
This is the quantity and quality of social resources (example networks, membership
in groups, social relations, and access to wider institutions in society) upon which
people draw in pursuit of livelihoods. The quality of the networks is determined by
the level of trust and shared norms that exist among network members. People use
these networks to reduce risks, access services, protect themselves from deprivation,
and to acquire information to lower transaction costs (CARE, 2002). This social
component is extremely important to marketing activities. Group members often feel
to improve social status due to their increased wealth and social interactions that
group membership confer. There is evidence of the influence of social capital on
accessibility of financial services and increasing a person status in the community
(Wild et al., 2007).
Livelihoods are made up of strategies which are in a range and combination of
activities and choices that people undertake to achieve livelihood outcomes. These
23
are usually based on-farm and off-farm activities that together provide a variety of
procurement strategies for food and cash which depends on what access there is to
resources, control of resources and the institutional environment (Houston, 2002).
The choices made are also influenced by income status, religion, political or social
status. The range of activities differs from household to household and from one
community to another. Thus, each household can have several possible sources of
entitlement which constitute its livelihood. Entitlements include the rights, privileges
and assets that a household has, and its position in the legal, political, and social
fabric of society (CARE, 2002).
By livelihood we refer to people‘s means of living, including the activities they carry
out to sustain themselves, the property or assets they hold, and the linkages between
their livelihoods and institutional and physical environments. Importantly, livelihood
does not just refer to how people gain cash income but the many ways, monetary and
non-monetary, they make a living. It can also suggest people‘s particular lifestyles,
their inheritance and their future aspirations (Mwaipopo et al., 2004).
Livelihood security can be defined as the adequate and sustainable access to income
and other resources to enable households to meet basic needs. This includes adequate
access to food, potable water, health facilities, educational opportunities, housing,
and time for community participation and social integration. Household livelihood
security is defined as a family‘s or community‘s ability to maintain and improve its
income, assets and social well-being from year to year and the relief to rehabilitation
to development continuum (Frankenberger et al., 2000). A household will be secure

24
if it will show positive changes in livelihood activities and its outcome in improving
standard of living have to be sustainable.
2.1.2.2 Global livelihood security
The integration of livelihoods into an increasingly global economy where the
destinies of people living continents apart are no longer separate is called
development. New forms of social consciousness emerge from the effects of these
globalized resource flows. Conflicts arise more and more over control of resource
flows and the way in which these resources are conceived, managed, and sustained.
These conflicts, in turn, pose challenges to existing ways of governing at different
levels. (Hyden, 1997 and Summer, 2003).
The growing realization that individual livelihoods and the fate of local communities
can no longer be viewed in isolation from national or international structures and
processes has given rise to new forms of scholarship in which micro and macro
considerations are being combined to provide fresh perspectives and insights on
issues that previously were studied in isolation from each other. This means that in
the same way that we are increasingly interdependent in pursuit of our livelihoods,
we are as scholars more and more dependent on each others' theoretical and
methodological contributions. Even though many are slow in recognizing it,
interdisciplinarity is no longer something to be despised of or discarded (Hyden,
1997).

25
2.1.2.3 Livelihood security in Africa
The last two decades of the 20th
century stand out as a period of momentous change
for sub-Saharan African economies. Amidst high levels of material uncertainty and
risk, rural populations have become more occupationally flexible, spatially mobile
and increasingly dependent on non-agricultural income-generating activities.
Households are often pursuing more than one, sometimes several, different non
agricultural activities simultaneously or at different points throughout the year. Most
of the activities are highly opportunistic in nature, involving quick responses to
market demand and supply (Bryceson, 2000).
Countries in SSA vary considerably in terms of livelihood activities. By looking at
characteristics of East and Southern Africa (ESA) (Ethiopia, Kenya, Malawi,
Mozambique, Tanzania and Uganda), agricultural sectors of the ESA accounted for
an estimated 41% of their GDPs. This region differs in some ways from overall
average statistics for SSA. It represents countries that have relatively high
dependence on agriculture in SSA. Eighty two percent of the population in the ESA
region resides in the rural areas (URT, 2009c) and depend on agriculture for their
livelihoods.
The contribution of agriculture to east and southern Africa is more than double the
average contribution of agriculture in sub-Saharan Africa, and East Asia and Pacific
regions, of which their agricultural sectors contribute only 18 and 16 percent
respectively. Returns to traditional export commodities have been declining over the
years due to a fall in world prices, and as a result, domestic production has declined.
26
Meanwhile, the High Value Agricultural Products (HAVPs) sub-sector is becoming
an important source of income for rural dwellers (farm labourers, small-scale
farmers, and traders) in the region. However, there is a need to overcome several
new barriers for small-farmers to be integrated in the sub-sector and benefits from
the emerging market (Wang et al., 2012).
Nonetheless, people in the region continue to depend on agricultural production for
their livelihoods, albeit by producing of agricultural raw materials, or intermediate
products with limited value added. Limited added value in the agribusiness chain, in
turn, results in low returns to the agricultural sector. This has serious implications for
the development of the region, a concern that needs to be addressed. For example, it
is clear that the contribution of agriculture to GDP in ESA has remained relatively
high, more than double the average for SSA as a whole. The disquieting fact is that
the GDP per capita is consistently lower in countries that are much more dependent
on agriculture compared to those that are less dependent on it, for example, Ethiopia
(51%: $106), Uganda (49%: $300), and Tanzania (46%: $186) have lower GDP per-
capita than Kenya (27%, $342) (Temu and Temu , 2006).
Government intervention was least in domestic HVAPs markets. Traditional local
traders managed the whole of domestic fruits, vegetables, fish and spices trade. Such
market chains supplied all the produce in daily urban and weekly up-country food
produce markets. Non-traditional crops are gaining even greater importance as
sources of income, as positive contributors to better rural livelihoods and to the
growth of the economy in the region. However, such progress is still slow and

27
patchy, and research and development is still not adequately geared towards the
emerging HVAPs (Temu and Temu, 2006).
2.1.2.4 Livelihood security in Tanzania
Overall, the most prominent livelihood activities within the households were found
to be food crop production (90%); livestock production (24%); petty trading (17%);
growing non-food crops (14%); and agricultural labour (11%).this is reflected in the
dispersion of livelihoods (URT, 2006b). Moreover, about 99% of rural households
are involved in self-employed agriculture and around 61% are dependent on
livestock for part of their livelihoods. Within the rural Tanzania, livestock contribute
about 13% to total household income (Ciamarra et al., 2011).
A more sustainable agriculture will lead to rural livelihood improvements where
people can be better off, have more food, be better organized, have access to external
services and power structures, and have more choices in their lives. These impacts
make it worthwhile for Vredeseilanden (VECO mother organisation) to invest in
processes heading towards sustainable agriculture. Vredeseilanden (VECO) wants to
contribute to viable livelihoods of organized family farmers in the South and North
of the country, choosing family farmers as the starting point in the implementation of
its ambition. Income from sustainable agriculture is a key element in livelihood
improvement. VECO contributes to family farmers‘ empowerment to improve their
position in whole agricultural commodity chains (VECO Tanzania, 2006).

28
2.1.2.6 Livelihood security in Bagamoyo
The income generating activities pattern from households living around coastal areas
vary between and within villages. In coastal villages of Bagamoyo, activities are
divided into five major categories namely: agriculture activities (farming and
livestock production), fishing, seaweed-farming, wage employment (wages and
salaries from non-agricultural activities) and self-employment activities (for
instance, various business, collection of shells, coir rope making, and stone
collection) (Sesabo and Tol, 2005).
Households tend to increase their participation in agricultural activities when there
are market constraints in other sectors such as fishing and seaweed-farming
activities. The same variable is not significant in explaining the decision to
participate as well as the level of income from fishing and seaweed-farming
activities. It was observed that households residing in Mlingotini village are more
likely to reduce their participation in fishing and seaweed activities. This implies that
they fish less and have less income emanating from fishing and seaweed-farming.
The reason for this phenomenon was that Mlingotini Village lacks good feeder roads
which connect Bagamoyo and Dar-es-Salaam main road, despite being only a few
kilometers from this main road. This forces the fishermen to internally sell their fish.
A part from that fishmongers/traders of Mlingotini Village have no access to Marine
protected areas. This means fishermen in Mlingotini Village usually compete for the
same fishing grounds over the years. This increases the risk of overexploitation with
adverse consequences of dwindling fish resources (Sesabo and Tol, 2005).

29
The multiplicative interaction between agriculture and fishing dummy variables was
also included to measure separate impact of fishing activity and agricultural activity.
The results suggest that households participating in both fishing and agricultural
activities are more likely to increase their participation in agriculture compared with
their counterparts participating in other combination of economic activities (example
agricultural and seaweed-farming) (Sesabo and Tol, 2005).
Some programmes like, the Tanzania Coastal Management Partnership (TCMP) and
its Sustainable Coastal Communities and Ecosystems (SUCCESS) Programme, with
funding from USAID, have worked in Bagamoyo District since 2000 (Elin et al.,
2007). The Tanzania Coastal Management Partnership (TCMP), which is now the
Sustainable Coastal Communities and Ecosystems Tanzania (SUCCESS)
Programme, began working with FINCA in Bagamoyo in 2004. The thought was to
help villagers advance environmentally friendly livelihoods, such as seaweed
farming and tour guiding, by providing them with micro-loans. After some initial
negotiations with FINCA, two micro-credit groups were established, the Batren tour
guide group and the Msichoke seaweed farming group (Elin et al., 2007).
The main conclusion is that the FINCA micro lending programme is not suitable for
the livelihood activities promoted by the TCMP and SUCCESS (e.g. seaweed
farming and tour guiding). Due to the high interest rates and frequent pay-back
instalments, the villagers involved chose to use the loans for small petty businesses
instead of natural-resource based enterprises. However, no beneficiary had stopped
any of their original resource-dependent livelihoods, such as fishing or farming, to

30
expand their FINCA enterprises. Instead they add the FINCA enterprise to their
current mix of livelihood activities as a diversification strategy (Elin et al., 2007).
2.2 Positive and Negative Linkages between Market Access and Livelihood
Security
There is a connection between Market access and livelihood security since adequate
and sustainable access to income is the main issue in livelihood security and income
can only be obtained through different production activities. These production
activities can be both from farm and off farm. The farm and off-farm products have
to be sold or bought in order to get income, and here access to the market becomes
the engine of the production activities.
2.3 Theoretical Information on Linkages between Market Access and
Livelihood Security
The relationship between livelihoods and access to market services is best explained
by the theory of sustainable livelihood framework by Carney (1999) and DFID
(2001). The livelihoods approach is concerned first and foremost with people from
whom the households are made. It seeks to gain an accurate and realistic
understanding of people‘s strengths (assets or capital endowments) and how they
endeavour to convert these into positive livelihood outcomes. The approach is
founded on a belief that people require a range of livelihood assets to achieve
positive livelihood outcomes through several livelihood strategies in which
marketing activities and other strategies like production and income activities are of
great concern. All these strategies need to have a better access to the market.
31
2.4 Empirical Literature
Most studies on market access reiterate that there are problems linked to price risk
and uncertainty, difficulties of contract enforcement, insufficient numbers of
middlemen, cost of putting small dispersed quantities of produce together, inability
to meet standards (Dorward et al., 1998; Freeman and Silim, 2001; Kherallah and
Kirsten, 2002; IFAD, 2003; IFAD, 2009). Lack of access to markets has also
resulted to high input costs, high transaction costs, and low price of output. The
linkage between producers and market actors is also weak, thereby raising risks in
production and marketing. The latter is largely exacerbated by the limited bargaining
power that smallholder pig producers have (Lucila and Lapar, 2006).
Good communication is vital in marketing whereby the use of new information and
communication technologies (ICTs), including the mobile phones are spreading
rapidly throughout Tanzania, as well as email and the Internet to share local
experience and learn from one another (Lightfoot et al., 2008). Minot (2006) saw
that in Tanzania rural poverty is associated with remoteness and difficult markets of
their agricultural goods. He said that although poverty is somewhat higher in more
remote rural areas, no evidence that remote areas are being ―left behind‖ in the sense
of gaining less from economic growth than other areas.
Moreover, Charles (2008) observes that markets can only stimulate wealth creation
among small holders if the costs of market participation are minimized. Ngonyani
(2008) saw access to the market information sources increase farm level productivity
and hence eradicate poverty. Also Ashimogo (1995), when studying grain storage
32
and marketing in Tanzania, saw that a relatively good degree of market integration
within Sumbawanga district had some positive implications for food security and
possibilities for increases in income security. Ashimogo (1995), on the other hand,
studied market integration of the maize market in Sumbawanga district concluding
that rural markets are rather well integrated with the town market in Sumbawanga,
but the degree of integration depends on the accessibility and distance from the
central market, and high transfer costs drive the profits down.
Furthermore, Ashimogo (1995) argues that due to frictions in the market, the
fluctuation of the supply between the harvest seasons is not balanced by trade flows
from other regions, which leads to wide variation in prices as well as food insecurity
as farmers are unable to store their own production. On the whole, there seems to be
evidence in favour of the overall benefits of formal market liberalisation in Tanzania,
but also a growing literature of case studies demonstrating the prevailing
impediments to trade.
2.5 Paucity in Literature
From the above evidence, the researcher found that most of the related previous
studies had concentrated on agricultural production and its problems in marketing.
Very few studies had concentrated on problems facing market access and others had
looked at marketing problems between different groups of people including women
and smallholder farmers. However, all these studies did not pinpoint the implications
of market access on households‘ livelihoods. Therefore, there was a need to study
the implications of market access to household livelihood security and see to what

33
extent the marketing activities could improve livelihood security of the people of
Bagamoyo District.
2.6 Conceptual framework
For the conceptual framework of this study it is assumed that household livelihood
security, which is the dependent variable, is affected by market access of goods and
services from both farm and non-farm activities, which are independent variables.
For households to have access to the market they have to access the physical
infrastructure, market information, market regulations and transaction costs which
may sometimes influence or hinder household access to the market. Both availability
and utilization of physical, financial, human, natural and social assets influence
households‘ livelihood strategies which are strongly influenced by households‘
access to the market for their produce. Access to the market may cause changes of
households‘ living standards and make them achieve food security, increase their
asset possession, increase their income and have strong social networks.
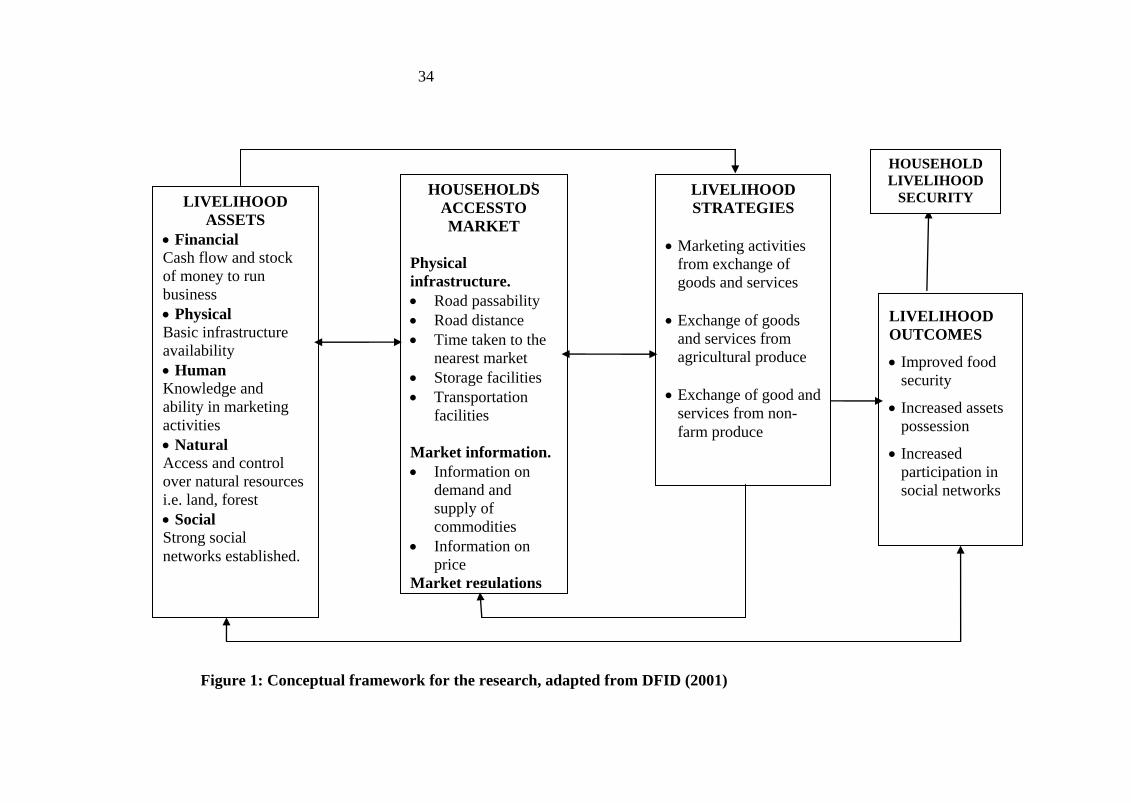
34
Figure 1: Conceptual framework for the research, adapted from DFID (2001)
HOUSEHOLDۥS
ACCESSTO
MARKET
Physical
infrastructure.
Road passability
Road distance
Time taken to the
nearest market
Storage facilities
Transportation
facilities
Market information.
Information on
demand and
supply of
commodities
Information on
price
Market regulations
Transaction cost.
LIVELIHOOD
STRATEGIES
Marketing activities
from exchange of
goods and services
Exchange of goods
and services from
agricultural produce
Exchange of good and
services from non-
farm produce
LIVELIHOOD
OUTCOMES
Improved food
security
Increased assets
possession
Increased
participation in
social networks
HOUSEHOLD
LIVELIHOOD
SECURITY LIVELIHOOD
ASSETS
Financial
Cash flow and stock
of money to run
business
Physical
Basic infrastructure
availability
Human
Knowledge and
ability in marketing
activities
Natural
Access and control
over natural resources
i.e. land, forest
Social
Strong social
networks established.
35
CHAPTER THREE
3.0 RESEARCH METHODOLOGY
3.1 Description of the Study Area
The study was conducted in Bagamoyo District, which is one of the six districts of
the Coast Region. The district borders with Morogoro District to the West;
Mvomero, Kilindi, and Handeni Districts to the North; Pangani District to the North-
East; the Indian Ocean to the East; Kinondoni District to the South - East and Kibaha
District to the South. The District has an area of 9 847 square kilometres with a
population of 228 967, it has 7 administrative divisions, 22 wards and 97 villages
(URT, 2003a).
This study was conducted in 6 villages, selected from 2 wards of Bwilingu and
Lugoba. Those villages were Bwilingu, Chahua, Chalinzemzee, Lunga, Saleni and
Kinzagu. The main inhabitants of Bagamoyo District are the Kwere, the Doe and the
Zigua with few people of other ethnic groups including the Maasai, the Chaga, the
Pare and Makonde who have immigrated into the area for the purposes of pastures or
trade. Their main livelihood activities were small scale farming, small scale trade,
livestock keeping and fishing.
Bagamoyo District was selected for the study for the reason that it is still highly
vulnerable to income and other services as URT (2007a) and URT (2009b) have
reported. Apart from that, no similar study had been carried out in the district.

36
3.2 Research Design and Sampling
In this study a cross sectional research design was employed where by data were
collected at one point in time. The variables in this study were examined once, and
the relationship between and among them were determined (Bryman, 2004). This
method also was preferred because it is useful in resource constraints and time
limitation (Bailey, 1998).
3.3 Population of the Study and the Sample Size
The targeted population for this study was all households living in Bagamoyo
District. The unit of analysis was the household. The sample size was 180
households, which is large enough for meaningful statistical analysis (Bailey, 1998).
The sample is presented in Table 1.
Table 1: Distribution of respondents (n=180) involved in the study
Ward Village Respondents
Male Female Total
Bwilingu Bwilingu 17 13 30
Chalinzemzee 19 11 30
Chahua 23 07 30
Lugoba Lunga 27 03 30
Saleni 21 09 30
Kinzagu 12 18 30
3.4 Sampling Procedures
A simple random sampling procedure was employed to select the households in the
study area. Two out of seven divisions in the district were randomly selected; then
one ward from each division was selected randomly. In each selected ward, 3
villages were randomly selected making a total of 6 villages. The simple random
37
sampling procedure was also used to select 30 households from each village, which
made a total of 180 households.
3.5 Pre-Survey
A pre survey was conducted in Bwilingu Village so as to pre test the questionnaire
for the main study and to be familiar with the area of study. Twenty households were
visited and necessary modification was done to the questionnaire to check the
relevance of the questions and so that the required information for the study could be
obtained. Necessary changes were included in the questionnaire before the actual
study.
3.6 Data Collection Methods
3.6.1 Primary data
The primary data were gathered by using a structured questionnaire formulated of
both closed and open-ended questions and administered through physical visits to
respondents‘ localities. In using the questionnaire, the emphasis was placed on the
collection of information related to market access and livelihood of the households
by looking at how access to market influences livelihood security of the people in
the study area. The questionnaire was divided into five important sections. The first
section was designed to demand background information from the respondents
including household size, household income generating activities including farm and
non-farm production activities. The second section of the questionnaire dealt with
the market, goods and services accessed in the study area.

38
The following section was designed to find out the factors effecting market access
in the study area by looking at the physical infrastructure, transportation facilities,
storage equipments, market information and rules and regulations available. The last
section was aimed at assessing the effects of market access on household livelihood
security by looking at asset ownership and their monetary values in Tanzanian
shillings, number of meals per day and its cost and household‘s engagement in
formal and informal groups.
Qualitative method was also employed whereby key informant interviews were held
using a checklist guide. Key informants were ward executive officers from the two
selected wards, village executive officers from the six selected villages and two
market chairmen from two market places existing in the study area. The total number
of the key informants was ten and knowledgeable people in marketing and
livelihoods.
3.6.2 Secondary data
Secondary data were obtained from different reports on trade and markets within the
department of agriculture, livestock and cooperatives in Bagamoyo District and
Sokoine National Agriculture Library (SNAL).
3.7 Data Analysis
Quantitative data from structured interviews were analyzed by using the Statistical
Package for Social Sciences (SPSS). Descriptive statistics such as frequencies,
percentages, means and Chi-square were calculated by using this statistical package.

39
Qualitative data from the key informants were subjected to content analysis. These
were for the results meeting the first, the second and the third objectives.
For objective number four, multiple linear regression was employed to find out the
extent to which the independent variables affected the dependent variable, which
was household livelihood security, and this was considered as a function of market
access i.e. HLS= f (market access) + scalar called an error term. The model is
expressed mathematically as
yi = βo+β1X i 1 + β2X i 2 + β3X i 3 + … βk Xk + ui
Where Yi = Households livelihood security
βo = The constant term.
X1 = Road passability
X2 = Road distance
X3 = Storage facilities
X4 = Time taken to the market
X5 = Transportation facilities
X6 = Information on demand and supply of commodities
X7 = Information on price
X8 = Market regulations
X9 = Transaction costs
Ui = is a scalar called the error term
40
CHAPTER FOUR
4.0 RESULTS AND DISCUSSION
4.1 Socio-Demographic Characteristics of the Respondents
4.1.1 Age
The findings in Table 2 show that the majority of the household heads (66.1%) were
between the age of 36 and 60 years, while 32.8% were youths of 18 to 35 years, and
the remaining 1.1% were above 60 years. The mean age of the respondents, which
was 40.9 years and the fact that 98.9% of the household heads were between the age
of 18 and 60 years old show that almost all the household heads were economically
active. This middle age group is mostly responsible for economic activities as argued
by Rutasitara (2002) that in Tanzania the economically productive class ranges
between the ages of 15 to 64 years.
Table 2: Distribution of the respondents by age (n = 180)
Age of the respondent Frequency Percentage
18 – 35 59 32.8
36– 60 119 66.1
Above 60 2 1.1
4.1.2 Marital status
The findings in Table 3 show that the majority of the household heads (72.5 %) were
married, followed by single household heads (10.5 %), widowed household heads
(5.0 %), divorced household heads (7.8 %), and separated household heads (3.9 %).
Marriage in Coastal areas of Tanzania in areas like Bagamoyo is experienced at early
ages. The results show that about 73% of the household heads were married and the

41
mean age was 40.9. This result is supported by IRIN (2006), that early marriage is
experienced especially among women in coastal areas of Tanzania, Bagamoyo
District inclusive.
Table 3: Marital status of the respondents (n = 180)
4.1.3 Education level
The findings in Table 4 indicate that more than 72.8 % of the respondents had
primary education. This implies that the majority of the respondents involved in
market activities can read and write, and hence they can put records of purchasing
and selling prices and evaluate their business products. About one-eighth (12.2 %) of
them had completed secondary school, while 5.6% had secondary and further
education. This means that there were relatively very few secondary and college
graduates in the selected sample, but worse enough there were 3.3% of household
heads who had not attended school. These circumstances might be due to remoteness
of some of the study villages and too few secondary schools in the area.
Status Frequency Percent
Single 19 10.6
Married 131 72.8
Widowed 9 5.0
Divorced 14 7.8
Separated 7 3.9

42
Table 4: Education level of the respondents (n = 180)
4.1.4 Household size
The household compositions considered in this study were the residential groups
whose members lived together in close contact by sharing resources such as
accommodation, farmland and foodstuffs. The results in Table 5 show that more than
a half of the respondents (51.1%) had a family between 2 and 5 members.
Households with family sizes below 2 were 2.2 %, while those with families
consisting of 6 to 9 members were 43.9 %. Also, it was found that families with
members more than 10 were 2.8 %.
Table 5: Household size of the respondents (n = 180)
Size Frequency Percent
Below 2 4 2.2
2 to 5 92 51.1
6 to 9 79 43.9
Above 10 5 2.8
Level of education Frequency Percent
No education 7 3.9
Primary 131 72.8
Secondary 22 12.2
Post secondary 10 5.6
Adult education 10 5.6

43
4.1.5 Household main sources of income and income gained
During the study, the respondents were asked to indicate the major income
generating activities of their families and the income gained from those activities;
the results indicated that the largest proportion of the households (43.9%) depended
on farming as their main source of income; small scale business followed being done
by 36.7% of the households, then salaried household heads were 15%, while
livestock keeping households were 3.3%, and lastly fishing was being done by 1.1 %
of the households as shown in Table 6. The findings are in line with those by URT
(2006b), which found that small scale business occurs much more frequently in
Morogoro and Coast regions (approximately 30% of households) whereby
Bagamoyo District is within Coast region.
Table 6: Main source of income of the respondents (n = 180)
Moreover, a lot of activities were done by households as part of off farm income
earning activities like hair salon, selling of local brew, transportation by motorcycle
(bodaboda), butcher, selling vegetables, selling cooked food, poultry keeping,
animal husbandry, mason works, carpentry, selling charcoal, selling plaiting mats,
matching guys, grocery and salaried jobs. Also agricultural produce like maize,
sorghum, cassava, sesame seed and cow pea were produced and some were sold. The
Source of income Frequency Percent
Salary 27 15.0
Farming 79 43.9
Small scale business 66 36.7
Fishing 2 1.1
Livestock keeping 6 3.3
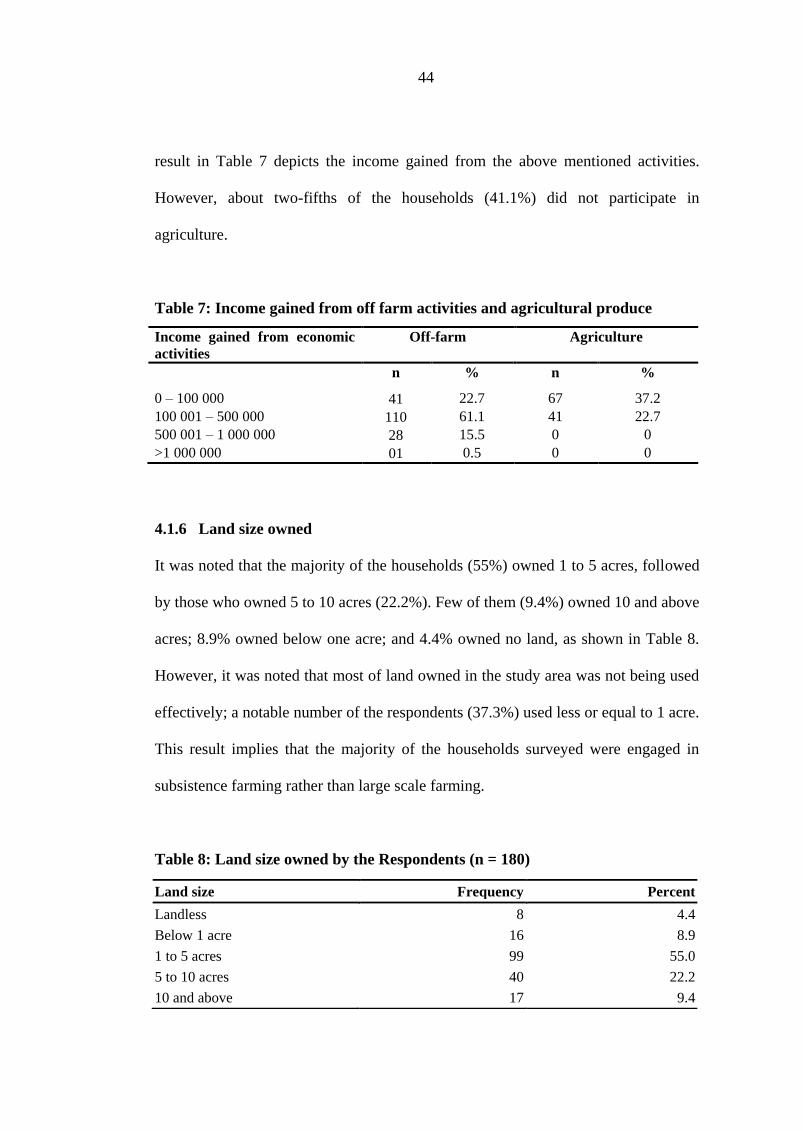
44
result in Table 7 depicts the income gained from the above mentioned activities.
However, about two-fifths of the households (41.1%) did not participate in
agriculture.
Table 7: Income gained from off farm activities and agricultural produce
4.1.6 Land size owned
It was noted that the majority of the households (55%) owned 1 to 5 acres, followed
by those who owned 5 to 10 acres (22.2%). Few of them (9.4%) owned 10 and above
acres; 8.9% owned below one acre; and 4.4% owned no land, as shown in Table 8.
However, it was noted that most of land owned in the study area was not being used
effectively; a notable number of the respondents (37.3%) used less or equal to 1 acre.
This result implies that the majority of the households surveyed were engaged in
subsistence farming rather than large scale farming.
Table 8: Land size owned by the Respondents (n = 180)
Income gained from economic
activities
Off-farm Agriculture
n % n %
0 – 100 000 41 22.7 67 37.2
100 001 – 500 000 110 61.1 41 22.7
500 001 – 1 000 000 28 15.5 0 0
>1 000 000 01 0.5 0 0
Land size Frequency Percent
Landless 8 4.4
Below 1 acre 16 8.9
1 to 5 acres 99 55.0
5 to 10 acres 40 22.2
10 and above 17 9.4
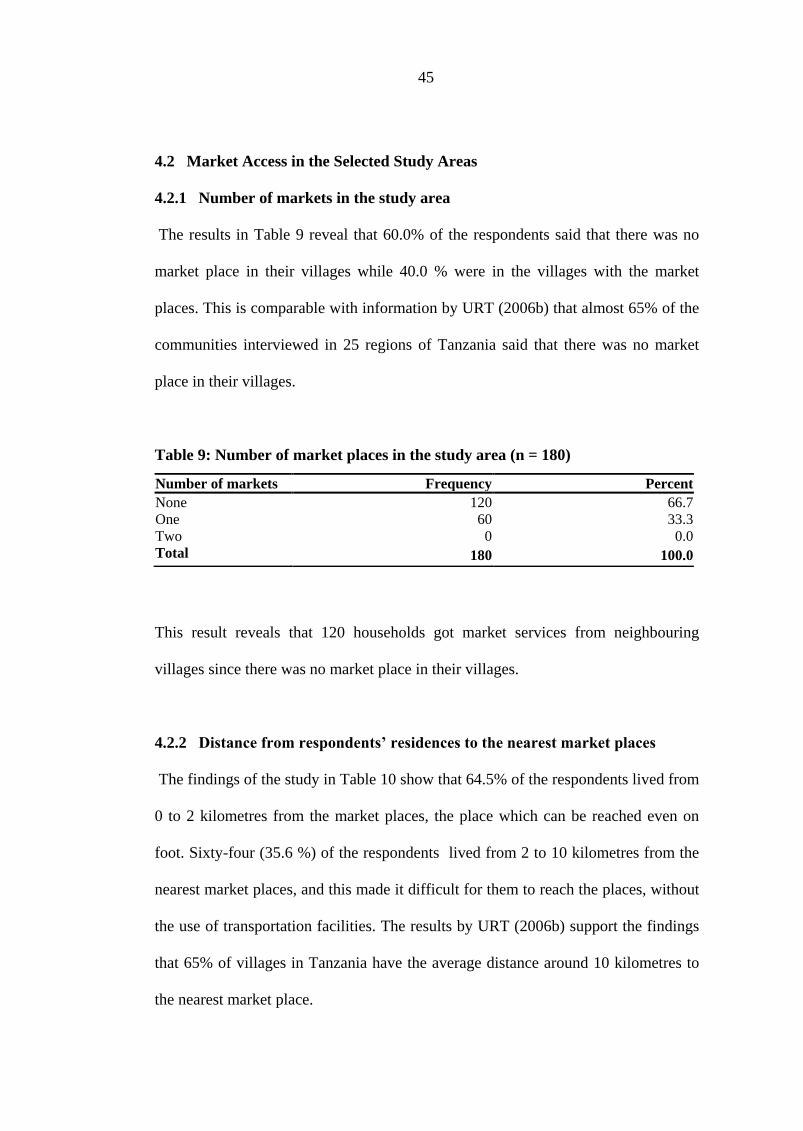
45
4.2 Market Access in the Selected Study Areas
4.2.1 Number of markets in the study area
The results in Table 9 reveal that 60.0% of the respondents said that there was no
market place in their villages while 40.0 % were in the villages with the market
places. This is comparable with information by URT (2006b) that almost 65% of the
communities interviewed in 25 regions of Tanzania said that there was no market
place in their villages.
Table 9: Number of market places in the study area (n = 180)
This result reveals that 120 households got market services from neighbouring
villages since there was no market place in their villages.
4.2.2 Distance from respondents’ residences to the nearest market places
The findings of the study in Table 10 show that 64.5% of the respondents lived from
0 to 2 kilometres from the market places, the place which can be reached even on
foot. Sixty-four (35.6 %) of the respondents lived from 2 to 10 kilometres from the
nearest market places, and this made it difficult for them to reach the places, without
the use of transportation facilities. The results by URT (2006b) support the findings
that 65% of villages in Tanzania have the average distance around 10 kilometres to
the nearest market place.
Number of markets Frequency Percent
None 120 66.7
One 60 33.3
Two 0 0.0
Total 180 100.0

46
Table 10: Distance from home to the nearest market place (n = 180)
4.2.3 The average time taken to the nearest market place
The results show that half (50%) of the households used 0 to 30 minutes to reach
market places; 38.3% used 30 minutes to 2 hours to reach the market places; and the
rest 11.7% used 2 to 5 hours to reach the market places as shown in Table 11.
Table 11: The average time taken to the nearest market (n = 180)
4.2.4 Means of transport to and from market places
The results in Table 12 show that more than a half of the respondents which is
57.8% used foot to go to the market places as their main transport and transportation
facilities; 35 which is 19.4% used bicycles; 29 which is 16.1% used vehicles; and
16.7% used motorcycles to go to the market places.
Distance to the market place
in kilometres Frequency Percent
0 – 0.5 48 26.7
0.5 – 2 68 37.8
2 – 10 37 20.6
> 10 27 15.0
Time taken in hours Frequency Percent
0 – 0.5 90 50.0
0.5 – 2 69 38.3
2 – 5 21 11.7
Total 180 100.0

47
Table 12: Means of transport to and from market places (n = 180)
4.2.5 Accessibility of market places in the study area
Most of the respondents said that market places in their villages were easily
accessible by 71%, while 29 % said were not easily accessible. Table 13 asserts the
reasons of easiness and difficult access to the market places.
Table 13: Accessibility to the market places of households (n = 180)
4.3 Goods and services accessed in markets in the study area
In Tables 14, 15 and 16 the goods and services accessed in the market places are
presented as per respondent opinions. Those goods and services were grouped into
Means of transport/ transportation Frequency Percent
Vehicles 29 16.1
Motorcycles 12 6.7
Bicycles 35 19.4
by foot 104 57.8
Total 180 100.0
Accessibility of market place Frequency Percent
Easy access Yes 128 71.1
No 52 28.9
Total 180 100.0
Yes easily Yes have own transport 27 15
It is too near 44 24.4
I use foot to go to the market 34 18.9
I use public transport 23 12.8
Not easily No feel tired 11 6.1
Don‘t have transport 12 6.7
Use money for fare 16 8.8
It is some how far. 13 7.2
Total 180 100

48
the following three categories: the agricultural goods in Table 13, off-farm goods in
Table 14, and services obtained at the market places in Table 15.
4.3.1 Agricultural goods accessed in the market
For agricultural goods the most accessed product was maize at 93.3% while the least
accessed was finger millet by 20%. Also varieties of fish, meat, legumes and
vegetables were accessible. Also these observations are supported by the argument
put forward during key informant interview, where one respondent, who was an
adult woman reported:
“Truly the problem is that how to access cash is very difficult, but goods
at the market places are so many; if you need grains, vegetables, fruits,
legumes and all types of fish are accessible.”
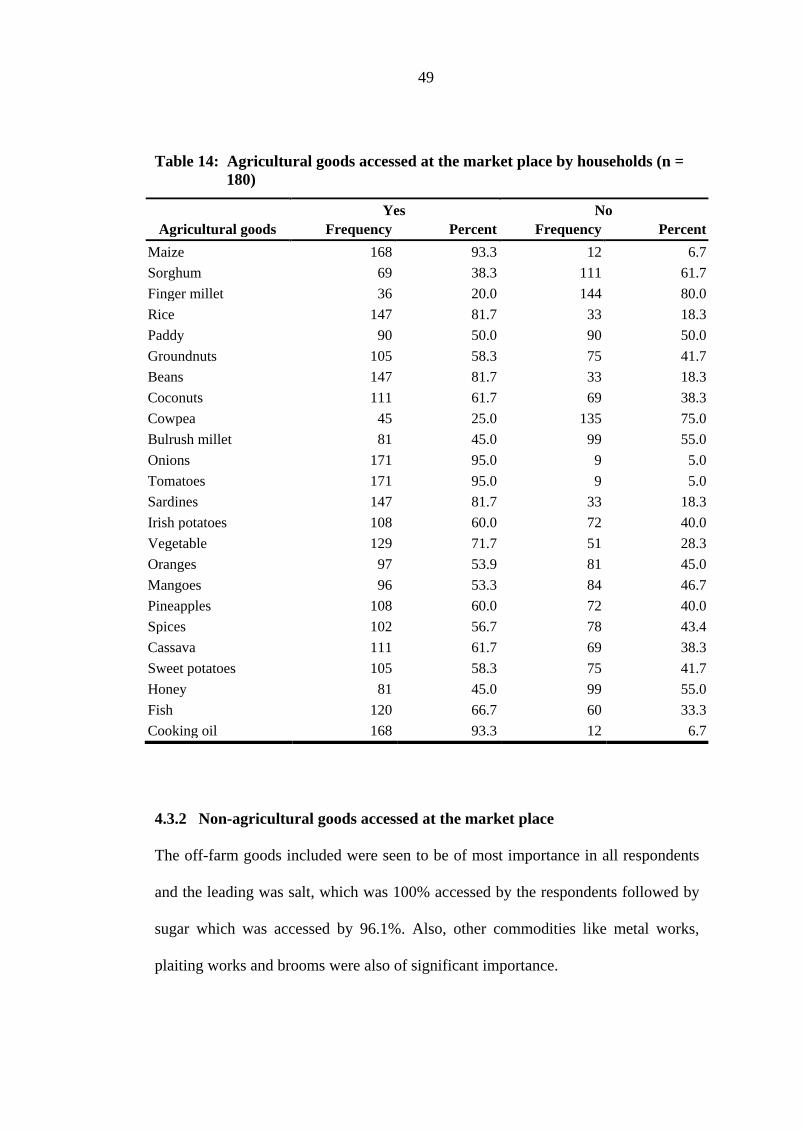
49
Table 14: Agricultural goods accessed at the market place by households (n =
180)
4.3.2 Non-agricultural goods accessed at the market place
The off-farm goods included were seen to be of most importance in all respondents
and the leading was salt, which was 100% accessed by the respondents followed by
sugar which was accessed by 96.1%. Also, other commodities like metal works,
plaiting works and brooms were also of significant importance.
Agricultural goods
Yes No
Frequency Percent Frequency Percent
Maize 168 93.3 12 6.7
Sorghum 69 38.3 111 61.7
Finger millet 36 20.0 144 80.0
Rice 147 81.7 33 18.3
Paddy 90 50.0 90 50.0
Groundnuts 105 58.3 75 41.7
Beans 147 81.7 33 18.3
Coconuts 111 61.7 69 38.3
Cowpea 45 25.0 135 75.0
Bulrush millet 81 45.0 99 55.0
Onions 171 95.0 9 5.0
Tomatoes 171 95.0 9 5.0
Sardines 147 81.7 33 18.3
Irish potatoes 108 60.0 72 40.0
Vegetable 129 71.7 51 28.3
Oranges 97 53.9 81 45.0
Mangoes 96 53.3 84 46.7
Pineapples 108 60.0 72 40.0
Spices 102 56.7 78 43.4
Cassava 111 61.7 69 38.3
Sweet potatoes 105 58.3 75 41.7
Honey 81 45.0 99 55.0
Fish 120 66.7 60 33.3
Cooking oil 168 93.3 12 6.7

50
Table 15: Off farm produce at the market place (n = 180)
4.3.3 Services accessed at market place
Not only goods, but also services were important in enhancing livelihoods. The
leading service was butchery by 96.7%, followed by saloon 76.7%, and then
transportation by motorcycles (bodaboda) by 73.3%. This implies that services help
in accessing other goods by taking an example of (bodaboda) which facilitates
transportation of goods and people too.
Table 16: Services Accessed at the market places
Off farm produce
Yes No
Frequency Percent Frequency Percent
Salt 180 100.0 0 0
Sugar 173 96.1 03 3.9
Ceramic equipments 87 48.3 93 51.7
Metal works equipment 102 56.7 78 43.3
Plaiting equipment 126 70.0 54 30.0
Soda (magadi) 129 71.7 51 28.3
Brooms 120 66.7 60 33.3
Plaiting carpets (mikeka) 93 51.7 87 48.3
Yeast 93 51.7 85 47.2
Services available
Yes No
Frequency Percent Frequency Percent
Saloon 138 76.7 42 23.3
Butcher 174 96.7 6 3.3
Tailoring 105 58.3 75 41.7
Carpentry 99 55.0 81 45.0
petrol station 87 48.3 93 51.7
Transportation(bodaboda) 132 73.3 48 26.7
Selling cooked food 108 60.0 72 40.0
clothes and shoes shop 99 56.7 78 43.3
Matching guys 87 48.3 93 51.7

51
4.4 Factors Affecting Market Access in the Study Areas
4.4.1 Types of road and road passability
4.4.1.1 Types of road from / to the market places
Roads are an integral part of the transport system. A country‘s road network should
be efficient in order to maximize economic and social benefits. They play a
significant role in achieving national development and contributing to the overall
performance and social functioning of the community. It is acknowledged that roads
enhance mobility, taking people out of isolation and therefore help to reduce
poverty. The roads in the study area were of tarmac, but others were of fine gravel
while others were of moram. The biggest proportion of the households (43.3%) had
roads with morum, and 36.7% had tarmac roads, while 20% had roads with fine
gravel as seen in Table 17.
Table 17: Road types from home to the nearest market (n= 180)
The findings revealed that there was no statistically significant association (p > 0.05)
between road type from the homes of the respondents and the accessibility of the
market places. The Chi-square value was 2.532 and the p-value of 0.282, which
imply that type of the road to the market place does not hinder the household
members to reach market places.
Type of road Frequency Percent
Tarmac 66 36.7
Fine gravels 36 20.0
Moram 78 43.3

52
4.4.1.2 Road passability
All the 180 respondents said that the roads from their home towards the nearest
market was passable but in most cases in not all the year. The results in the figure 2
reveal that 35% of the respondent‘s road from their homes to the nearest market
places was not passable all the year, while 65% respondents said that the roads from
their homes to the nearest market places were passable all the year.
Figure 2: Road passability in the year (n=180)
4.4.2 Means of transport used
Transportation on roads can be roughly grouped into two categories: transportation
of goods and transportation of people. The nature of road transportation of goods and
people depends much on the degree of development of the local infrastructure. The
results in Table 18 show that one-third (33.3%) of the households went on foot to the
65%
35%
Passable all the year
Not passable all the year

53
market places as their main transport and transportation means; 10% used bicycles;
28.3% used vehicles; 25% used motorcycles; and 3.3% used wheelbarrows.
The results from Chi-square test analysis indicated that there was statistically
significant association (p < 0.05) between transportation facilities and access to the
market places with a Chi-square value of 13.8 and a p-value of 0.03. This implies
that the use of transportation facilities increases access to market places within
households. That means the household members were able to participate more in
marketing activities at the market places regardless of their physical distances so
long as they used proper means of transport and transportation.
Table 18: Means of transportation of people, goods and services (n = 180)
4.4.3 Storage equipments used
Storage facilities are basically buildings and equipments used in storing goods.
These buildings and equipments are generally used by households involved in
businesses. These businesses include exporting, importing, manufacturing,
wholesaling, transporting, and many other industries that require both large and
small storage facilities.
Means of transport Frequency Percent
By vehicle 51 28.3
By motorcycle 45 25.0
By bicycle 18 10.0
By foot 60 33.3
Wheelbarrow 6 3.3
Total 180 100.0

54
The results in Table 19 reveal that all the respondents used storage equipments either
at home or at the market places. About two-fifths (36.7%) of the households had
storage problems, 63.3% of the households did not have storage problems. Also,
baskets and bags which covered 63% to 68% of storage facilities were the most
storage facilities used by the respondents at both places either at home or at the
market places. This is supported by URT (2006b) which reports that approximately
20-30% of communities in Rukwa, Mara and Kagera also mentioned storage
facilities as a problem.
Table 19: Storage places, facilities used at home and at the market (n = 180)
The findings revealed that there was no statistically significant association (p > 0.05)
between facilities used by the respondents and their access to the market places. The
Chi-square value was 7.146 and the p-value was 0.128. These values reveal that
Households storage facilities Frequency Percent
Problems in storage Yes 66 36.7
No 114 63.3
Total 180 100.0
Storage places Own rooms 135 75.0
Hired rooms 36 20.0
Others 9 5.0
Total 180 100.0
Storage at home Fridge 18 10
Baskets and bags 123 68.3
Tins and buckets 39 21.7
Total 180 100.0
Storage at market place Fridge 39 21.7
Baskets and bags 114 63.3
Tins and buckets 27 15.0
Total 180 100.0

55
storage facilities did not matter in enhancing the household members to reach the
market places.
4.4.4 Market information
4.4.4.1 Information on demand and supply of goods and services at market
places
The respondents were asked where they got market information on demand and
supply of commodities. The results in Table 20 show that about three-fifths (57%) of
the respondents got the information from their fellow traders and neighbours,
followed by 31.7% who got information when purchasing at the market places. Less
than one-tenth (6.7%) got such information from newspapers; 3.3% got it from
radios; and 1.7% got it through telephones.
Table 20: Information on demand and supply of goods and services (n = 180)
The results from Chi-square test analysis indicated that there was statistically
significant association (p < 0.05) between market information of demand and supply
of commodities and access to market places with a Chi-square value of 12.846 and a
How do they get information Frequency Percent
Newspapers 12 6.7
Radio 6 3.3
Telephone 3 1.7
When purchasing at market place 57 31.7
Fellow traders and neighbours 102 56.7
Total 180 100.0

56
p-value of 0.012. These values imply that if the information on demand and supply
of goods is known then it increases access to the market place within the households.
That means the household members were able to participate more in marketing
activities at the market places provided that they knew what was demanded within
the market.
4.4.4.2 Information on prices of goods and services at a market place
The respondents were asked where they had the market information on prices of
goods and services. The results in Table 21 show that about 57% of the respondents
got the information from their fellow traders and neighbours, followed by 36.7%
who got information by visiting the market places, 1.7% got information from
newspapers and 5.0% got it from radio.
Table 21: Information on prices of goods and services (n = 180)
The results from Chi-square test analysis indicated that there was statistically
significant (p < 0.01) positive association between the information on prices of
goods and services and access to the market places with a Chi-square value of
42.123 and a p-value of 0.0001. These values imply that if the prices of goods and
services are known, this will increase the access to the market place within the
How do they get information Frequency Percent
News papers 3 1.7
Radio 9 5.0
Visit market places 66 36.7
Fellow traders and neighbours 102 56.7
Total 180 100.0

57
households to sell or to purchase different commodities. That means the household
members were able to participate fully in marketing activities at the market places
provided that they knew how much would be spent or earned from marketing
activities.
4.4.5 Rules and regulations at market places
These are guidelines on how to run daily activities at the market place. The results in
Table 22 show that 90% of respondents have been exercised with those rules and
regulations. Also 15% of the respondents were hindered their enthusiasm to
marketing activities while 55% were facilitated their enthusiasm to trade from these
rules and regulations.
Table 22: Rules and regulations found at market place (n = 180)
The results from Chi-square test analysis indicated that there was statistically
significant (p < 0.01) positive association between rules and regulations at the
Rules and regulation at market Frequency Percent
Rules and regulations encountered 162 90.0
No Rules and regulations encountered 18 10.0
Taxation on commodities 108 60.0
No Taxation on commodities 72 40.0
Use of middlemen 6 3.3
No use of middlemen 174 96.7
Time for entry and exit 135 0.0
No time for entry and exit 45 25.0
Contributions for cleaning and security
guarding 36 20.0
No contributions 144 80.0

58
market and access to the market places with a Chi-square value of 28.858 and a p-
value of 0.0001. This implies that the fairer the rule and regulations the more people
will access the market place. That means the household members were able to
participate fully in marketing activities at the market places from fairness of rules
and regulations.
4.4.6 Transaction costs
Transaction costs also include the costs resulting from imperfect information,
supervision and incentive costs. Smallholder farmers are often located in remote
areas; far away from service providers and major consumers of farm products incur
high transaction cost (Mthembu, 2008 and Makhura, 2001). The results in Table 23
signify that 93.3% of the respondents incur transaction cost of their participation to
marketing activities. Those costs are mobile phones costs, middlemen costs, hiring
storage facilities and transportation of goods. The majority of the respondents 68.3%
ranked these costs as reasonable as Table 24 assert.
Table 23: Transaction costs (n = 180)
Transaction cost encountered Frequency Percent
Transaction cost 168 93.3
No transaction cost 12 6.7
Mobile phones 102 56.7
No mobile phones costs 78 43.3
Middlemen cost 21 11.7
No middlemen cost 159 88.3
Hiring storage facilities 45 25.0
No hiring storage facilities costs 135 75.0
Transportation of goods 141 78.3
No transportation of goods costs 39 21.7

59
Table 24: Ranking Transaction Costs (n = 180)
The results from Chi-square test analysis indicated that there is statistically
significant (p < 0.05) positive association between transaction costs and access to the
market places with a Chi-square value of 10.889 and a p-value of 0.010. This implies
that low or reasonable costs will lead to the increase of the access to the market place
within the households. That means the household members were able to participate
fully in marketing activities at the market places because they were capable of
meeting the expenses.
4.5 Effects of Market Access on Households’ Livelihood Security
In this research households‘ livelihood security were measured by taking into
consideration three issues, which were values of assets possession within a
household, food security by looking at the number of meals and their costs, and
number of household members who were engaged in formal and informal groups.
4.5.1 Assets possession within households
Household assets are the components of the household physical capital and can be
used to measure livelihood improvement and its sustainability. Therefore, estimating
the value of household assets is fundamental in assessing livelihood improvement of
respondents and hence livelihood security. The respondents were asked to give the
Cost rank Frequency Percent
High 9 5.0
Low 48 26.7
Reasonable 123 68.3
Total 180 100.0
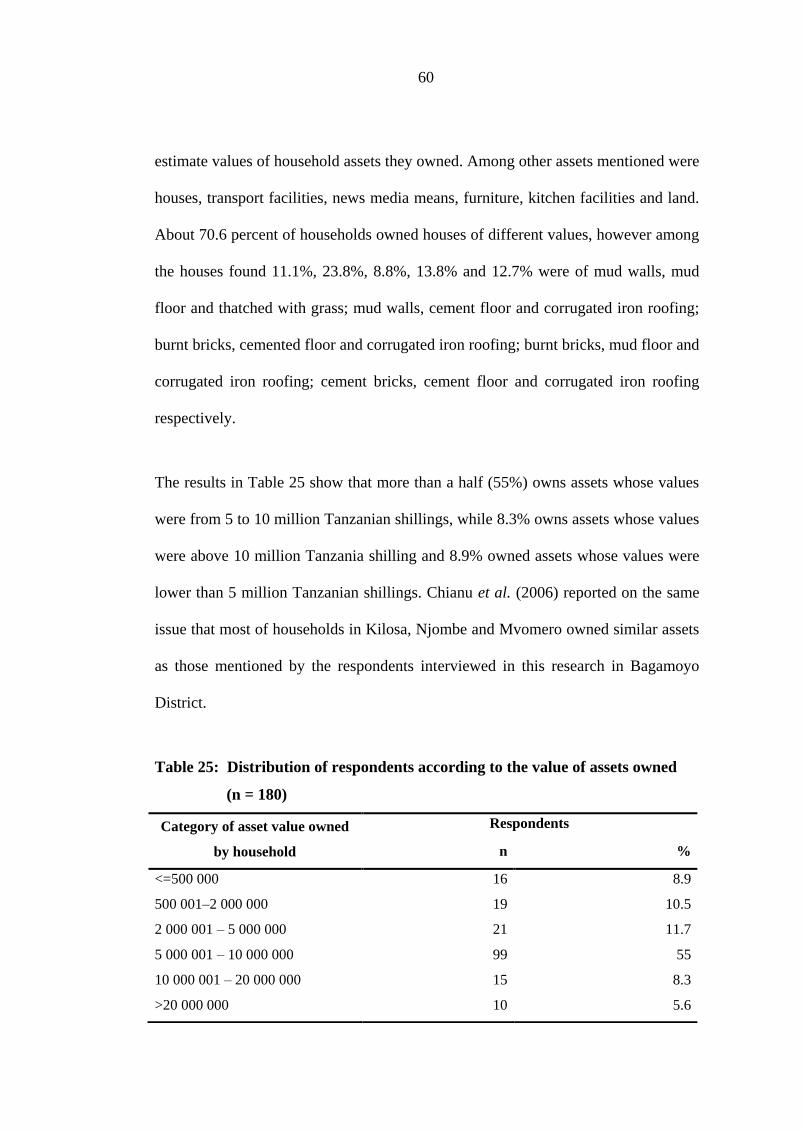
60
estimate values of household assets they owned. Among other assets mentioned were
houses, transport facilities, news media means, furniture, kitchen facilities and land.
About 70.6 percent of households owned houses of different values, however among
the houses found 11.1%, 23.8%, 8.8%, 13.8% and 12.7% were of mud walls, mud
floor and thatched with grass; mud walls, cement floor and corrugated iron roofing;
burnt bricks, cemented floor and corrugated iron roofing; burnt bricks, mud floor and
corrugated iron roofing; cement bricks, cement floor and corrugated iron roofing
respectively.
The results in Table 25 show that more than a half (55%) owns assets whose values
were from 5 to 10 million Tanzanian shillings, while 8.3% owns assets whose values
were above 10 million Tanzania shilling and 8.9% owned assets whose values were
lower than 5 million Tanzanian shillings. Chianu et al. (2006) reported on the same
issue that most of households in Kilosa, Njombe and Mvomero owned similar assets
as those mentioned by the respondents interviewed in this research in Bagamoyo
District.
Table 25: Distribution of respondents according to the value of assets owned
(n = 180)
Category of asset value owned
by household
Respondents
n %
<=500 000 16 8.9
500 001–2 000 000 19 10.5
2 000 001 – 5 000 000 21 11.7
5 000 001 – 10 000 000 99 55
10 000 001 – 20 000 000 15 8.3
>20 000 000 10 5.6
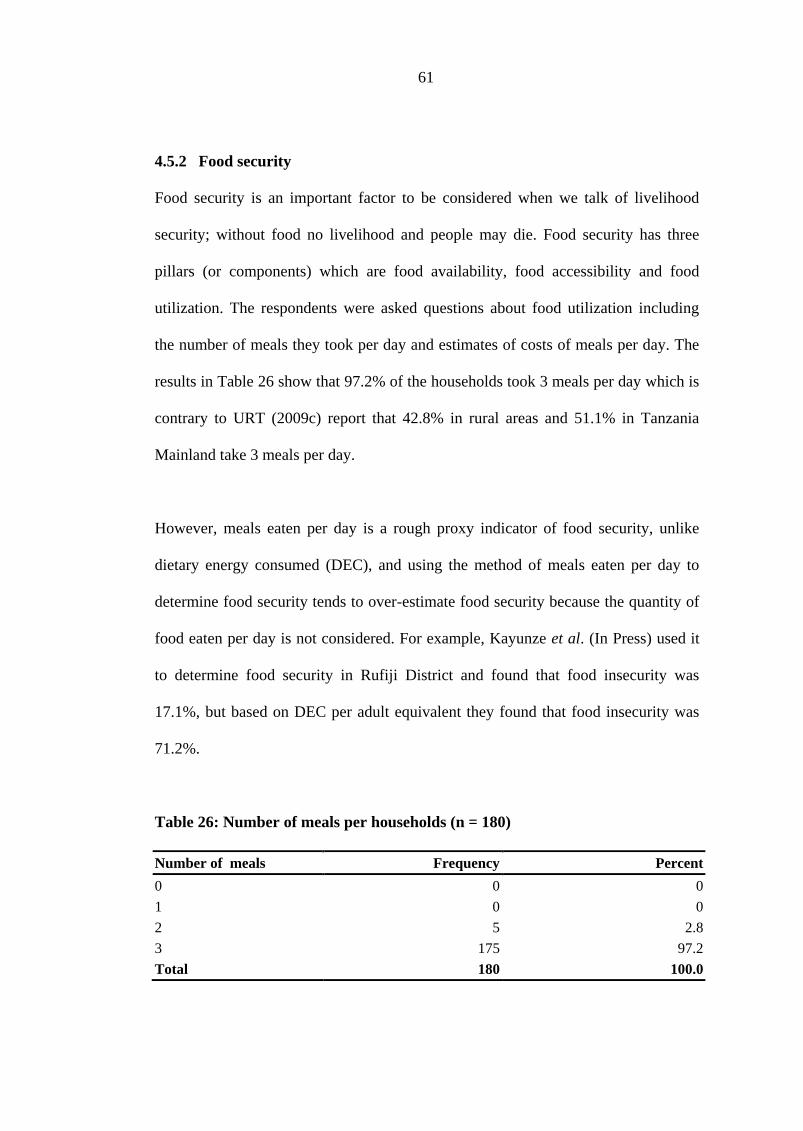
61
4.5.2 Food security
Food security is an important factor to be considered when we talk of livelihood
security; without food no livelihood and people may die. Food security has three
pillars (or components) which are food availability, food accessibility and food
utilization. The respondents were asked questions about food utilization including
the number of meals they took per day and estimates of costs of meals per day. The
results in Table 26 show that 97.2% of the households took 3 meals per day which is
contrary to URT (2009c) report that 42.8% in rural areas and 51.1% in Tanzania
Mainland take 3 meals per day.
However, meals eaten per day is a rough proxy indicator of food security, unlike
dietary energy consumed (DEC), and using the method of meals eaten per day to
determine food security tends to over-estimate food security because the quantity of
food eaten per day is not considered. For example, Kayunze et al. (In Press) used it
to determine food security in Rufiji District and found that food insecurity was
17.1%, but based on DEC per adult equivalent they found that food insecurity was
71.2%.
Table 26: Number of meals per households (n = 180)
Number of meals Frequency Percent
0 0 0
1 0 0
2 5 2.8
3 175 97.2
Total 180 100.0

62
Also Table 27 gives costs of meals eaten. These costs range from Tshs 1 000 to Tshs
10 000. The costs depended largely on the household size. Also, the majority of
households (80.6%) used 1 000 to 3 000 Tshs per each meal. Also these observations
are supported by the argument put forward during key informant interview where
one of the respondents said and complained that,
“Prices of food products nowadays are becoming highly expensive; even if
you have a small family size without having three to five thousand
Tanzanian shillings you will not be able to eat”
Table 27: Costs of meals in Tanzanian shillings in each household (n = 180)
4.5.3 Engagement in formal and informal groups
4.5.3.1 Formal and informal groups
The formal and informal groups are very important in determining social capital
within the household level. The results in Table 28 show that about 52% of the
respondents had the membership in either formal or informal or both groups. The
groups were VICOBA, SACCOSS, CVM, money chains groups, ethnic groups and
entrepreneur groups. This percent is very low compared to its importance in markets
and livelihood in general. Results by Mchomvu et al. (2002) support that
membership in formal and informal groups are low in Tanzania.
Categories of
meals cost
Breakfast Lunch Dinner
frequency % frequency % frequency %
0 – 1 000 15 8.3 6 3.3 2 1.1
1 001–3 000 153 85 114 63.4 145 80.6
3 001–5 000 12 6.7 52 28.9 33 18.3
5 001–10 000 0 0 8 4.4 0 0
Total 180 100 180 100 180 100.0

63
Table 28: Formal and Informal groups
4.5.3.2 Reasons for not joining formal and informal groups
The respondents were asked why most of community members were not members of
any group; the reasons they gave are given in Table 29. Some households said that
there were no such groups near their residence; others said they always observed not
only structural and organizational weaknesses but also a lot of financial quarrels. But
worse enough 15.0% dislike joining groups. Also these observations are supported
by the argument put forward during key informant interview, where one respondent
complained that:
“There is too much bureaucracy in the issues concerning money, so it is
better not to join any group and remain with poverty.‖
Group engaged Frequency Percent
Membership 93 51.7
No Membership 87 48.3
SACCOS member 21 11.7
Not SACCOS member 159 88.3
VICOBA 36 20.0
Not SACCOS member 144 80.0
CVM 9 5.0
Not CVM member 171 95.0
Money chains groups member 21 11.7
Not Money chains groups member 159 88.3
Tribe groups member 24 13.3
Not Tribe groups member 156 86.7
Entrepreneurship groups member 15 8.3
Not entrepreneurship groups member 165 91.7
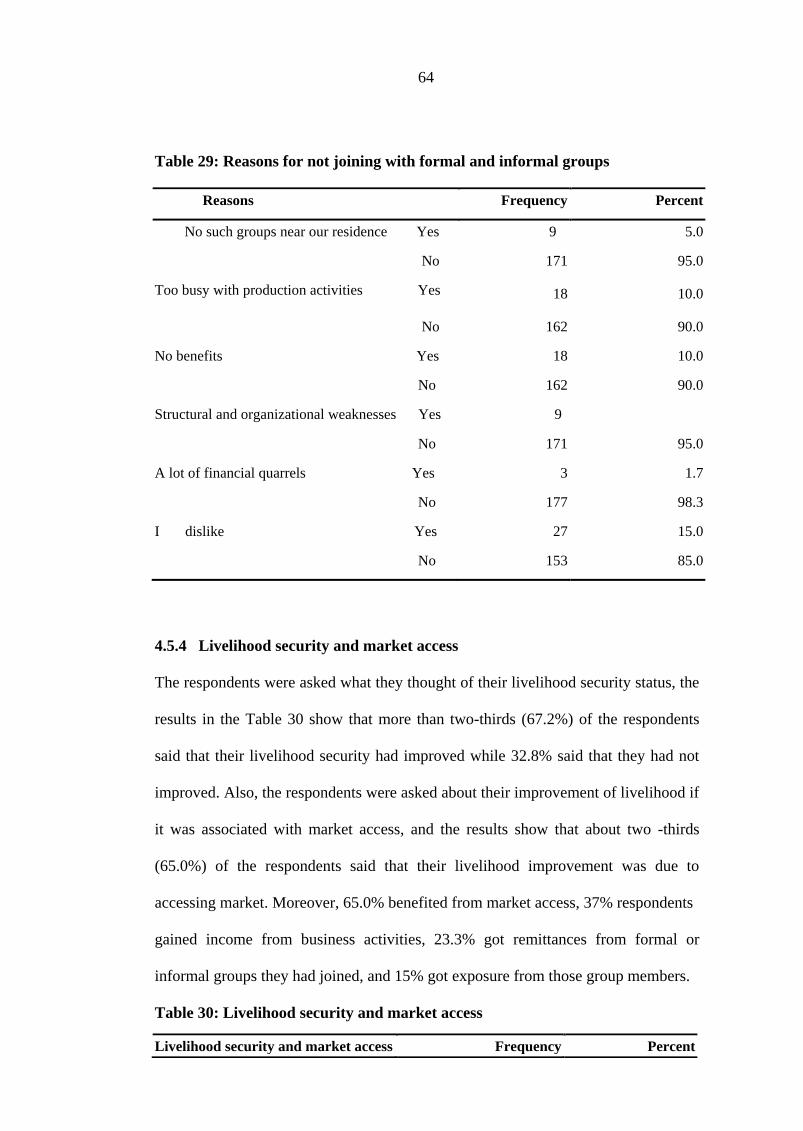
64
Table 29: Reasons for not joining with formal and informal groups
4.5.4 Livelihood security and market access
The respondents were asked what they thought of their livelihood security status, the
results in the Table 30 show that more than two-thirds (67.2%) of the respondents
said that their livelihood security had improved while 32.8% said that they had not
improved. Also, the respondents were asked about their improvement of livelihood if
it was associated with market access, and the results show that about two -thirds
(65.0%) of the respondents said that their livelihood improvement was due to
accessing market. Moreover, 65.0% benefited from market access, 37% respondents
gained income from business activities, 23.3% got remittances from formal or
informal groups they had joined, and 15% got exposure from those group members.
Table 30: Livelihood security and market access
Reasons Frequency Percent
No such groups near our residence Yes 9 5.0
No 171 95.0
Too busy with production activities Yes 18 10.0
No 162 90.0
No benefits Yes 18 10.0
No 162 90.0
Structural and organizational weaknesses Yes 9 5.0
No 171 95.0
A lot of financial quarrels Yes 3 1.7
No 177 98.3
I dislike Yes 27 15.0
No 153 85.0
Livelihood security and market access Frequency Percent
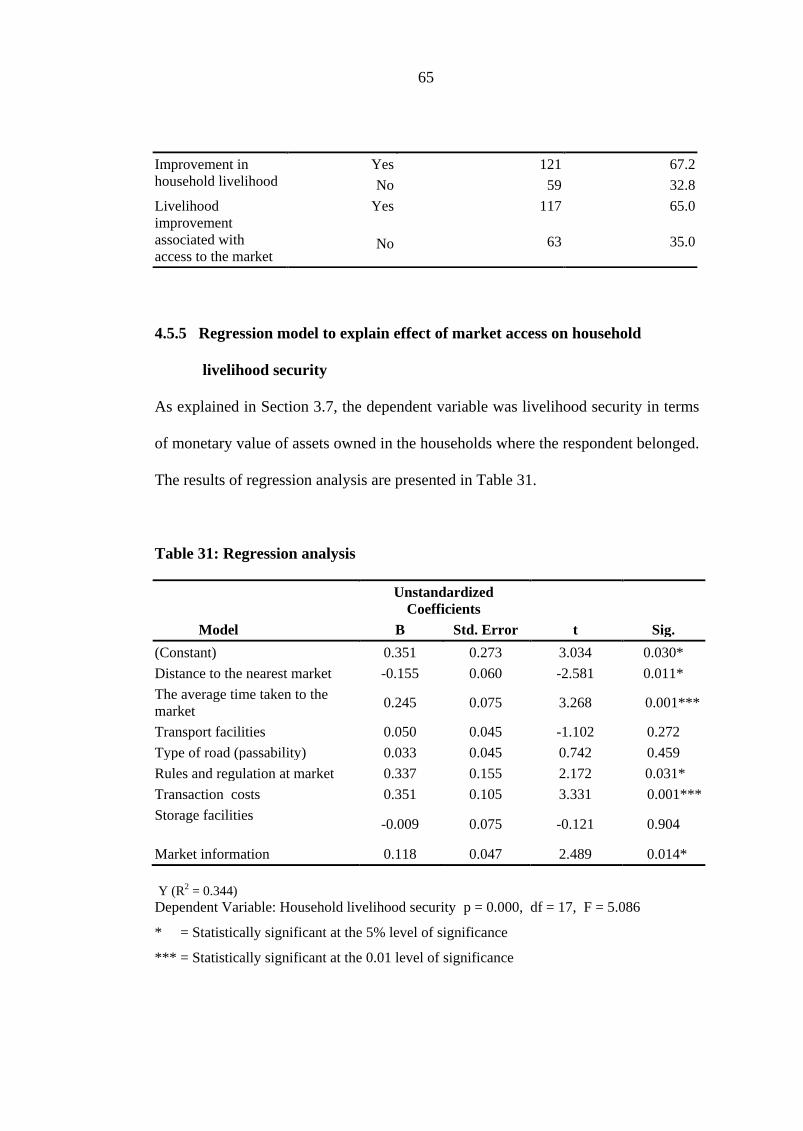
65
4.5.5 Regression model to explain effect of market access on household
livelihood security
As explained in Section 3.7, the dependent variable was livelihood security in terms
of monetary value of assets owned in the households where the respondent belonged.
The results of regression analysis are presented in Table 31.
Table 31: Regression analysis
Y (R2 = 0.344)
Dependent Variable: Household livelihood security p = 0.000, df = 17, F = 5.086
* = Statistically significant at the 5% level of significance
*** = Statistically significant at the 0.01 level of significance
Improvement in
household livelihood
Yes 121 67.2
No 59 32.8
Livelihood
improvement
associated with
access to the market
Yes 117 65.0
No 63 35.0
Model
Unstandardized
Coefficients
t Sig. B Std. Error
(Constant) 0.351 0.273 3.034 0.030*
Distance to the nearest market -0.155 0.060 -2.581 0.011*
The average time taken to the
market 0.245 0.075 3.268 0.001***
Transport facilities 0.050 0.045 -1.102 0.272
Type of road (passability) 0.033 0.045 0.742 0.459
Rules and regulation at market 0.337 0.155 2.172 0.031*
Transaction costs 0.351 0.105 3.331 0.001***
Storage facilities -0.009 0.075 -0.121 0.904
Market information 0.118 0.047 2.489 0.014*

66
The coefficient of determination R2 was 0.344, which implies that independent
variables were able to explain about 34% of variation in the dependent variable.
That means only 34% of the variation in the dependent variable was explained by the
variables in the equation. The rest 66% was explained by the variables not in the
equation and inherent errors in the model. This is a relatively small power for an
equation to explain variation. However, it is evident that some of the independent
variables had some influence on the household livelihood security.
These independent variables which had some influence on the household livelihood
security were distance from home to the nearest market (p = 0.011), the average time
taken to the market (p = 0.001), rules and regulations at market (p = 0.03), market
information (p = 0.014) and transaction costs (p = 0.001). The said independent
variables had statistically significant impact at (P < 0.05) on livelihood security as
Table 31 asserts. Other variables such as means of transport to the market, type of
roads from home to the nearest market and storage facilities had no statistically
significant impact.

67
CHAPTER FIVE
5.0 CONCLUSIONS AND RECOMMENDATIONS
5.1 Conclusions
Based on the empirical findings from the study, some major conclusions are drawn
with regard to the objectives of the study which were to determine market access,
identify goods and services accessed at the market places, explore factors affecting
market access, and determine the contribution of marketing to livelihood outcomes
which imply household‘s livelihood security. The results showed that within the six
villages of the study there were only two market places which were not planned and
well structured. This had a tremendous effect on trading activities and lower
livelihood security.
A lot of agricultural goods were available at the market place which comprised
grains, legumes, vegetables and varieties of fish. Also, off-farm produce like salt,
ceramic equipment and metal works equipments were accessible. Butcher and
transportation (bodaboda) was the leading service available at the market places.
Although the markets were not conducted in a well structured manner, these are
places where the daily consumption of all types/ classes of households depends for.
Turning to the factors affecting market access in the study area, eight elements were
considered namely distance to the nearest market, the average time taken to the
market place, transport facilities used, type of road (passability), rules and
regulations at market place, transaction costs, storage facilities and market
information.
68
Market information on prices of goods and services had the highest positive effects
on accessibility of households to the market place, followed by market information
on supply and demand of commodities. Though market information is the important
factor affecting market access at the household level the formal means of accessing
the market information were rarely used instead of being the most important factor
which affect the market access in the study area, and this hinders the degree of
accessing to the market and reduce trading activities.
The findings showed that access to the market of goods and services brought positive
changes in the livelihood security of households. This was confirmed by households
interviewed; 67.2% accepted that their livelihood security had improved and about
two-thirds (65.0 %) confirmed that participation to the market activities through
trading benefited them from the income earned which raised their livelihood
security. This was confirmed by the fact that 100 percent of households owned assets
but the asset types and values differed among households and almost all the
respondents took 3 meals per day. Only the rate of engagement with formal and
informal groups was very low. From these findings, it is concluded that market
access enhances better livelihoods of households.
5.2 Recommendations
In order to reach the maximum level of livelihood security by enhancing production
and exchange of goods and services for maximum income earning, the following
recommendations are made.
69
5.2.1 Policy level recommendations
(i) Market places are very few compared to the number of households in the study
area. Therefore the Ministry of Trade and Marketing is advised to look into the
possibilities of making an integrated plan of building market places with the
Ministry of Agriculture, Food and Cooperatives, not only in Bagamoyo District
but also in the whole country.
(ii) Since the market information was the main factor which determined marketing
activities at the household level, the Ministry of Trade and Marketing is
advised to look for better ways to release the market information on the price
of commodities; even if the market forces determine the prices but it is possible
to be known in advance.
(iii) Taking into consideration that, there are very few households whose members
had joined the formal and informal groups, and one of the goals from policies
of the Ministry of Community Development, Gender and Children is to create
more groups through its programme, planners are urged to make more efforts
on provision of groups formation education through mass media, and come up
with programmes for group formation and its advantages at the household
level.
5.2.2 Local government level recommendations
a) The study recommends that Bagamoyo District council should conduct training
sessions on importance of being a member of groups, either formal or informal.

70
People should be told the advantage and challenges of being group members
and its impacts on their livelihoods. They can take those who benefited from
groups as a catalyst for change to those who have not yet joined groups.
b) The District, through its Department of Agriculture, is advised to make sure
those scarce resources, like land are fully utilized by households, especially by
growing crops which can give better yields to farmers. It should make use of its
extension officers in advising the households when to cultivate, use of better
seeds and pesticides because about three-thirds of the interviewed households
did not participate in agriculture though they owned plots of land.
c) Through its department of trade, Bagamoyo District is urged to advise the full
council to include in the district development plans building a number of
market places within the district in order to reduce the distance from
households‘ residences to the nearest market places.
5.2.3 Household level recommendations
a) The people of Bagamoyo District should be educated that being in groups is a
source of various entrepreneurship knowledge and skills. It will ease the
process of getting remittances and loans from various financial institutions.
Therefore, they should be urged to join formal and informal groups available in
their home places.
71
b) Charcoal selling and local brew, especially brewing using grains, were among
the non-farm sources of income. The people of Bagamoyo should take into
consideration that cutting down trees is environment destruction which may
lead to a danger of remaining with a desert, while using grains in making local
brew will lead to a danger of lacking food which may lead to food insecurity.
A household which practices this habit should stop in order to avoid further
consequences.
5.2.4 Recommendations for further research
(a) After provision of groups‘ formations education among households, an
evaluative study should be conducted in Bagamoyo District to compare the
level of households‘ livelihood security before joining the groups and after
joining the groups. This will help to see whether there will be an improvement
in livelihood security between the two categories of households.
(b) Since the study concluded that the existence of land occupied by households
is not fully utilized for agriculture or any other production activities, there is
a need to find out how land is occupied among and within households in
Bagamoyo District and why this land is not fully utilized for production
purposes in order to maximize agricultural goods at market places.

72
REFERENCES
Amani, H. K. R. (2005). Making Agriculture Impact on Poverty in Tanzania: The
case on Non-Traditional Export Crops. In: Proceedings of a Paper
Presented at a Policy Dialogue for Accelerating Growth and Poverty
Reduction in Tanzania. 12 May 2005, ESRF, Dar es Salaam. 7 – 16pp.
Amani, H. K. R. (2006). Agricultural Development and Food Security in Sub
Saharan Africa (SSA), Rome. 72pp.
Arthur, S. and Sheffrin, S. M. (2003). Economics: Principles in action. Upper Saddle
River, New Jersey 07458: Pearson Prentice Hall. 592 pp.
Ashimogo, G. (1995). Peasant Grain Storage and Marketing in Tanzania: A Case
Study of Maize in Sumbawanga District. Thesis for Award of PhD
Degree at University of Berlin, Verlag Koester, Germany, 157pp.
Bagwell, K. and Staiger, R. W. (2001). The WTO as a Mechanism for Securing
Market Access Property Rights: Implications for Global Labour and
Environmental Issues. Journal of Economic Perspectives 15: 23-25.
Bailey, D. K. (1998). Methods of Social Research. The Press Collier McMillan
Publisher, London. 478 pp.

73
Bryceson, D. (2000). Rural Africa at the Crossroads: Livelihood Practices and
Policies, Netherlands. Journal of African Studies 52: 1 – 6.
Bryman, J. (2nd
Ed.)(2004). Social Research Methods. Oxford University, New
York. 592 pp.
CARE (2002). Household Livelihood Security Assessments: A Toolkit for
Practitioners. TANGO International Inc. Tucson, Arizona. 92pp.
Carney, D. (Ed.) (1999). Sustainable rural livelihoods: what contributions can we
make?. In: Proceedings of a Paper presented at DFID‟s Natural Resource
Advisors‟ Conference. July 1999, London.1- 64pp.
Chambers, R. and Conway, G. R. (1991). Sustainable Rural Livelihoods: Practical
Concepts for the 21st
Century. Institute of Development Studies, Sussex,
UK. 42 pp.
Charles, J. (2008). Institutional Economic Analysis of Small Holder Market access
in Tanzania: Experience from Vegetable Producers in Arumeru District.
Dissertation for Award of MSc Degree at Sokoine University of
Agriculture, Morogoro, Tanzania, 90pp.
Chartier, G. and Johnson, C. W. (2011). Markets Not Capitalism: Individualist
Anarchism against Bosses, Inequality, Corporate Power, and Structural
Poverty. Minor Compositions LTD, London. 442 pp.

74
Chema, S., Gilbert, E. and Roseboom, J. (2002). International Service for National
Agricultural Research (ISNAR): A Review of Key Issues and Recent
Experiences in Reforming Agricultural Research in Africa. Research
Report no.24, The Hague, ISNAR. 88pp.
Chianu, J. N., Vanlauwe, B., Mukalama, J., Adesina, A., and N. Sanginga. (2006).
Farmer evaluation of improved soybean varieties being screened in five
locations in Kenya: Implications for research and development. African
Journal of Agricultural Research 1 (5): 143–150.
Ciamarra, U. P., Tascitt, L., Otte, J. and Zezza, A. (2011). Livestock assets, livestock
income and rural households: Cross-country evidence from household
surveys, animal production and health division.
[http://www.fao.org/docrep/013/am72e00.pdf] site visited on 6/8/2012.
DFID, (2001). Making Markets Work better for the Poor: A framework paper.
Department for international development (DFID), London. 61 pp.
Dorward, A., Kydd, J. and Poulton, C. (eds.) (1998). Smallholder Cash Crop
Production under Market Liberalisation: A New Institutional economics
Perspective. CAB International. 288pp.
Dorward, A.,Poole, N., Morrison, J., Kydd, J. and Urey, I. (2002). Critical Linkages:
Livelihoods, Markets and Institutions. Imperial College Wye, Ashford,
United Kingdom. 25pp.

75
Elin, T., Kalangahe, B., Munubi, R., Mwanahija, S., and Crawford, B. (2007),
Integrated Coastal Management, Livelihood Development and Micro-
Loan Strategies: The Case of the TCMP-FINCA Partnership in the
Bagamoyo District of Tanzania. Coastal Resources Center, University of
Rhode, Island. 15pp .
Frankenberger, T .R., Drinkwater, M. and Maxwell, D. (2000). Operationalizing
household livelihood security: A holistic approach for addressing poverty
and vulnerability. In: Proceedings of a Paper presented at the Seminar on
„Supporting Institutions, Evolving Livelihoods‟ International, 29-30 May
2002, Bradford Centre for International Development, University of
Bradford. 1- 25 pp.
Freeman, H. A. and Silim, S. S. (2002). Commercialisation of Smallholder
Irrigation: The Case of Horticultural crops in Semi-arid Areas of Eastern
Kenya. Accra, Ghana. 191pp.
Geithner, T. and Nankani, G. (2002). Market Access for Developing Country
Exports–Selected Issues, Prepared by the Staffs of the IMF and the World
Bank. [http://www.imf.org/external/np/pdr/ma/2002/eng/.pdf] site visited
on 25/07/ 2011.

76
Hammouda, H .B., Karingi, S., Oulmane, N. and Jallab, M. S. ( 2007). How the
Doha Round could support the African Industry? United Nations
Economic Commission for Africa African Trade Policy Center. Addis
Ababa,Ethiopia.[http://www.hakimbenhammouda.com/Documents/Revision
_ODS-Accepted.pdf] site visited on 20/07/ 2011.
Heinemann, E. (2002). The Role and Limitations of Producer Associations.
European Forum for Rural Development Cooperation, Montpellier. 45pp.
Houston, C. (2002). Livelihood Strategies of the Poor in Cape Town. Development
Action Group. 43 pp.
Hyden, G. (1997). Livelihoods and Security in Africa: Contending Perspectives in
the New Global Order. Center for African Studies, University of Florida.
539 pp.
IFAD (2009). The annual report on results and impact of IFAD Operations on
market access. (ARRI) Rome, Italy. [http://www.be-
troplive.be/betroplive/pdf]. Site visited on 7/6/2011.
IFAD (2003). Promoting Market Access for the rural poor in order to achieve the
Millennium Development Goals. IFAD discussion paper. Rome, Italy.
[http://www.ageconsearch.umn.edu/bitstream/19077/1/cp03ma01.pdf]
site visited on 3/5/2011.
77
IFAD (2011). International Fund for Agricultural Development: Poverty Report.
Rome,Italy. [http://www.dspace.knust.edn.gh/dspace/handle/12345678
9/2123] site visited on 19/8/2011.
Ireland, C., Malleret, D and Baker, L. (2004). Alternative Sustainable Livelihoods
for Coastal Communities – A Review of and Guide to Best Practice
submitted to IUCN. Claire Ireland Contribution, Ireland. 75pp.
IRIN (2006). Humanitarian News and Analysis; A service of the UN office for the
coordination of Humanitarian Affairs.
[http://www.irinnews.org/Report/9648] site visited on 7/8/2012.
Kayunze, K. A., Mwageni, E. A., Mdoe, N. S. Y. S. (In Press). Do Various Methods
of Food Security Determination Give Similar Results? Evidence from
Rufiji District, Tanzania. Tanzania Journal of Agricultural Science. 22pp.
Kherallah, M. and Kirsten, J. F. (2002). The New Institutional Economics:
Applications for Agricultural Policy Research in Developing Countries.
Agrekon Journals 41(2): 7 – 17.
Kikula, I. S., Mnzava, E. Z. and Mung‘ong‘o, C. (2003). Shortcomings of Linkages
between Environmental Conservation Initiatives and Poverty Alleviation
in Tanzania. Research Report No. 032, Mkuki na Nyota Publishers Ltd,
Dar es salaam. 56 pp.

78
Koenig, T., Blatt, J., Brakel, J., Kloss, K., Nilges, T. and Woellert, F. (2008).
Market-driven development and poverty reduction: A value chain
analysis of fresh vegetables in Kenya and Tanzania. SLE Publication
Series, Nairobi and Berlin. 218 pp.
Laird S, (2002). A Handbook of Market Access Issues, Development, Trade and the
WTO. Washington Dc. 520pp.
Lightfoot, C., Gillman, H., Scheuermeier, U. and Nyimbo, V. ( 2008 ). First Mile
Project in Tanzania Linking Smallholder Farmers to Markets Using
Modern Communication Technology. [http://www
direct.bl.uk/research/27/5F/RN224822546.html] site visited on
19/08/2011.
Lindenberg, M. (2002). Measuring Household Livelihood Security at the Family and
Community Level in the Developing World. University of Washington,
Seattle., WA, USA. 18 pp.
Lucila, M. A. and Lapar, A. (2006). The Role of Collective Action in Overcoming
Barriers to Market Access by Smallholder Producers: Some empirical
Evidence from Northern Vietnam. Cali, Colombia. 452 pp.
79
Luoga, W.P. (2008). Performance of group based semi-formal credit on sustainable
livelihoods of micro entrepreneurs: A case study of Pride Tanzania:
Dissertation for Degree of Masters of Arts in Rural Development at
Sokoine University of Agriculture, Morogoro, Tanzania. 119pp.
Makhura, M. T. (2001). Overcoming Transaction Costs Barriers to Market
Participation of Small Holder Farmers in the Northern Province of South
Africa. Unpublished PhD Thesis University of Pretoria, Pretoria. 134 pp.
Masaiganah, M. (2010). Sustaining Women‘s and Community‘s Livelihoods in
Rural Tanzania: A case of Bagamoyo Women Development Network
(BAWODENE). Journal of the society for International Development
3(53):421- 424.
Matungul, M. P. M. (2002). Marketing constraints faced by communal farmers in
KwaZulu-Natal, South Africa: A case study of transaction costs.
Unpublished Phd Thesis, Discipline of Agricultural Economics, School
of Agricultural Sciences and Agribusiness, University of Natal,
Pietermaritzburg. [http://www.ageconsearch.umn.edu/bitstream/1/cp03
wy01.pd] site visited on 18/06/2011.
Mchomvu, A. S. T, Tungaraza, F. S. K and Maghimbi, S. (2002). Social Security
System in Tanzania: Tanzania Report. Journal of social development in
Africa 02(17): 3-17.
80
Minot, N. (2006). Market access and rural poverty in Tanzania: International Food
Policy Research Institute. In: Proceedings of a Contributed paper
prepared for presentation at the International Association of Agricultural
Economists Conference, August 12-18, 2006, Gold Coast, Australia,
Washington D.C., U.S.A. 1 - 20 pp.
Mthembu, N. (2008). Perceptions of barriers to market participation among three
farmer groups in rural KwaZulu-Natal: Submitted in partial fulfilment for
the Award of Masters. (MSc) Degree University of KwaZulu-Natal,
Pietermaritzburg. [http://www.researchspace.ukzn.ac.za/xmlui/bitstream/
Mthembu_N_2008.pdf.] site visited on 25/06/2011.
Muganda, A. (2004). Tanzania‘s Economic Reforms—and Lessons Learned in
Scaling Up Poverty Reduction: A Global Learning Process and
Conference, May 25–27, 2004, Shanghai.
[http://www.tanzaniagateway.org/.../tanzania_country_study] site visited
on 20/07/2012.
Mwaipopo, R., Mutagwaba, W., Nyange, D. and Fisher, E. (2004) 'Increasing the
contribution of artisanal and small-scale mining to poverty reduction in
Tanzania: Based on an analysis of mining livelihoods in Misungwi and
Geita Districts, Mwanza Region.‟ Report prepared for DFID, (UK). 74pp.

81
Ngonyani, E.T. (2008). Analysis of Access to Market Information Sources and Farm
level Productivity: The Case Study of Kilosa and Mvomero Districts.
Dissertation for Award of MSc Degree at Sokoine University of
Agriculture, Morogoro, Tanzania, 94pp.
Rutasitara, L. (2002). Economic Policy and Rural Poverty in Tanzania: A survey of
three Region. Research on Poverty alleviation, Research Report No.2.
Mkuki na Nyota Publishers Ltd., Dar es Salaam, Tanzania. 118pp.
Sesabo, J. K. and Tol, R. S. J. (2005). Factor affecting Income Strategies among
households in Tanzanian Coastal Villages: Implication for Development
Conservation Initiatives. International Max-Planck. 42pp.
Sumner D. A. (2003) Tariff and Non-Tariff Barriers to Trade. University of
California-Davis Vincent H. Smith, Montana State University.
[http://www.farmfoundation.org/news/.../816-sumner.pdf] site visited on
17/08/2013.
Taylor, J. E. (2010). Rural Poverty and Markets: Background Paper for the IFAD.
Rural Poverty Report 2010. Food and Agriculture Organization, Rome.
73pp.

82
Temu, A.E. and. Temu, A.A. (2005). High Value Agricultural Products for
Smallholder Markets in Sub-Saharan Africa: Trends, Opportunities and
Research Priorities. In: Proceedings of a Paper Prepared for An
International Workshop on How can the Poor Benefit from the Growing
Markets for High Value Agricultural Products, 3 – 5 October 2005,
International Center for Tropical Agriculture, Cali, Colombia. 1- 37 pp.
URT (1999). The Tanzania Development Vision 2025, the President's Office,
Planning Commission, Dar es Salaam. 42pp.
URT (2000). “Rural Development Strategy Report”, the President's Office,
Government printer, Dar es Salaam. 88pp.
URT (2003a). Population and Housing Census General Report. National Bureau of
statistics, President‘s Office, Planning and Privatization, Dar-es-Salaam.
137pp.
URT (2003b). Rural Development Policy, Government printer, Dar es Salaam. 74
pp.
URT (2006a). Ministry of Industry, Trade and Marketing: Analysis of the Services
Sector With a View to Making Commitments in the Context of Trade
Liberalization at Bilateral, Regional and Multilateral Trade
Negotiations: The case of Tanzania, Dar-es-Salaam.

83
[http://www.tzonline.org/pdf/analysisoftheservicessector.pdf ] site visited
on 08/07/2011.
URT (2006b). Tanzania Comprehensive Food Security and Vulnerability Analysis
(CFSVA): World Food Programme, Vulnerability Analysis and Mapping
Branch (ODAV), Dar es Salaam. 95pp.
URT (2007a). National Bureau of Standards; Coast Region Socio – economic
profile. Ministry Of Planning, Economy and Empowerment, Dar es
Salaam. 127pp.
URT (2007b). The opportunities and obstacles to Development – a community
participatory planning Methodology hand book. Prime Minister's Office,
Regional Administration and Local Government, Dodoma. 74 pp.
URT (2008). National Social Protection Policy. President‘s Office, Dar es Salaam.
59pp.
URT (2009a). National Strategy for Growth and Reduction of Poverty in Tanzania,
Vice President‘s Office, Dar es Salaam. 170 pp.
URT (2009b). Poverty and Human Development Report. Ministry of Finance and
Economic Affair, REPOA, Dar es Salaam. 220pp.

84
URT, (2009c). Household budget survey: Ministry of Finance and Economic Affair.
National Bureau of Statistics, Dar es Salaam. 94pp
VECO Tanzania (2006). Enhancing access to markets for smallholder farmers:
looking forward year 2015. Proceedings of Discussion Document for
VECO Tanzania national stakeholders‘ workshop on smallholder farmers
access to markets, Protea Hotel Courtyard, Dar es Salaam, Tanzania. 22-
23 March 2006. 19pp.
Wang, J., Huo, X., Hatab, A. A. and Kabir, S. (2012), Non-neutral technology,
farmer income and poverty reduction: Evidence from high value
agricultural household in China. Journal of Food, Agriculture and
Environment 10 (3-4): 582 - 589.
Weissman, R. (2005). Structural Adjustment Program (SAP) alert on IMF and World
Bank lending to Tanzania Executive Summary: By Globalization
Challenge Initiative, A Project of the Tides Center, USA and the
Integrated Social Development Programme, (ISODEC). Washington, DC
20036, USA. [http://www.hartford-hwp.com/archives/36/347.html] Site
visited on 16/06/2012.
World Trade Report (2012). Trade and public policies: A closer look at non-tariff
measures in the 21st century. 43-70pp
[http://www.wto.org/english/res_e/booksp_e/...e/world_trade_report12_e.
pdf] site visited on 21/08/2012.
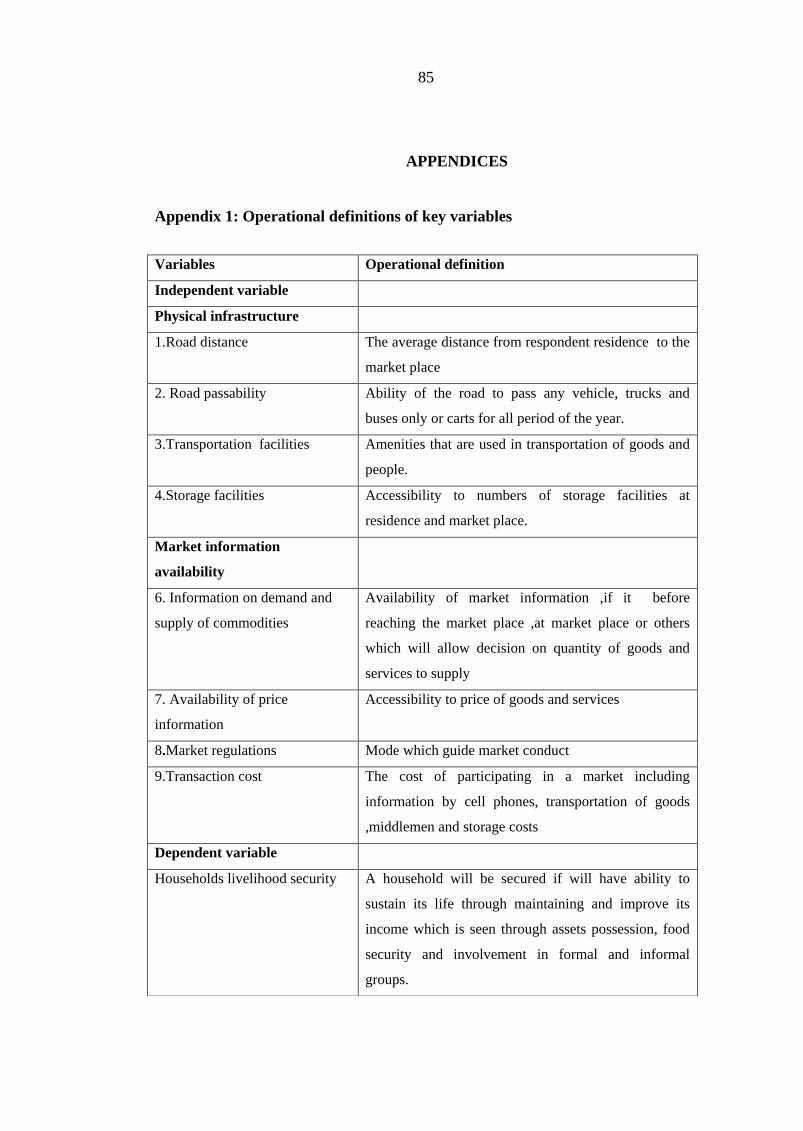
85
APPENDICES
Appendix 1: Operational definitions of key variables
Variables Operational definition
Independent variable
Physical infrastructure
1.Road distance The average distance from respondent residence to the
market place
2. Road passability Ability of the road to pass any vehicle, trucks and
buses only or carts for all period of the year.
3.Transportation facilities Amenities that are used in transportation of goods and
people.
4.Storage facilities Accessibility to numbers of storage facilities at
residence and market place.
Market information
availability
6. Information on demand and
supply of commodities
Availability of market information ,if it before
reaching the market place ,at market place or others
which will allow decision on quantity of goods and
services to supply
7. Availability of price
information
Accessibility to price of goods and services
8.Market regulations Mode which guide market conduct
9.Transaction cost The cost of participating in a market including
information by cell phones, transportation of goods
,middlemen and storage costs
Dependent variable
Households livelihood security A household will be secured if will have ability to
sustain its life through maintaining and improve its
income which is seen through assets possession, food
security and involvement in formal and informal
groups.

86
Appendix 2: Household questionnaires for the implications of market
access for households livelihood security
A. General Information
Ward__________________ Village_________ Questionnaire No __________
Date of Interview____________ Name of Respondent _____________
B. Household Characteristics
B1. Age of the respondent ……………
B2. Sex 1. Male ( )
2. Female
B3.Household head
1. Male
2. Female ( )
3. Child headed
B4. Marital Status
1. Single
2. Married
3. Widowed ( )
4. Divorced
5. Separated
B5. Education level
1. No education
2. Primary
3. Secondary ( )
4. Post secondary
5. Adult education
B6. Household size …………………………………. ( )
1. Below 2 2. 2-5
3. 6-9 4. Above 10

87
C. INCOME GENERATING ACTIVITIES IN THE HOUSEHOLD
C1 .What are the major source of income for your family
1. Salary
2.Farming
3.Small scale business ( )
4.Fishing
5. Livestock keeping
6.Others specify ……………………..
C2.If your activity is farming, what is the size of land you own?
1. Landless
2. Below 1 acre
3. 1 – 5 acres ( )
4. 5 – 10 acres
5. 10 and above
C3.What types of crops did you cultivate in last cropping season (fill the table
below).
Give a conversion of the unit used in metric systems (e.g. 1 bag of maize = 100
kgs).
Crop
Size
cultiv
ated
Output
(Unit
used)
Amount
of crops
sold
Price
per
Unit
Amount
of crops
consum
ed
Amou
nt of
crops
stored
Total
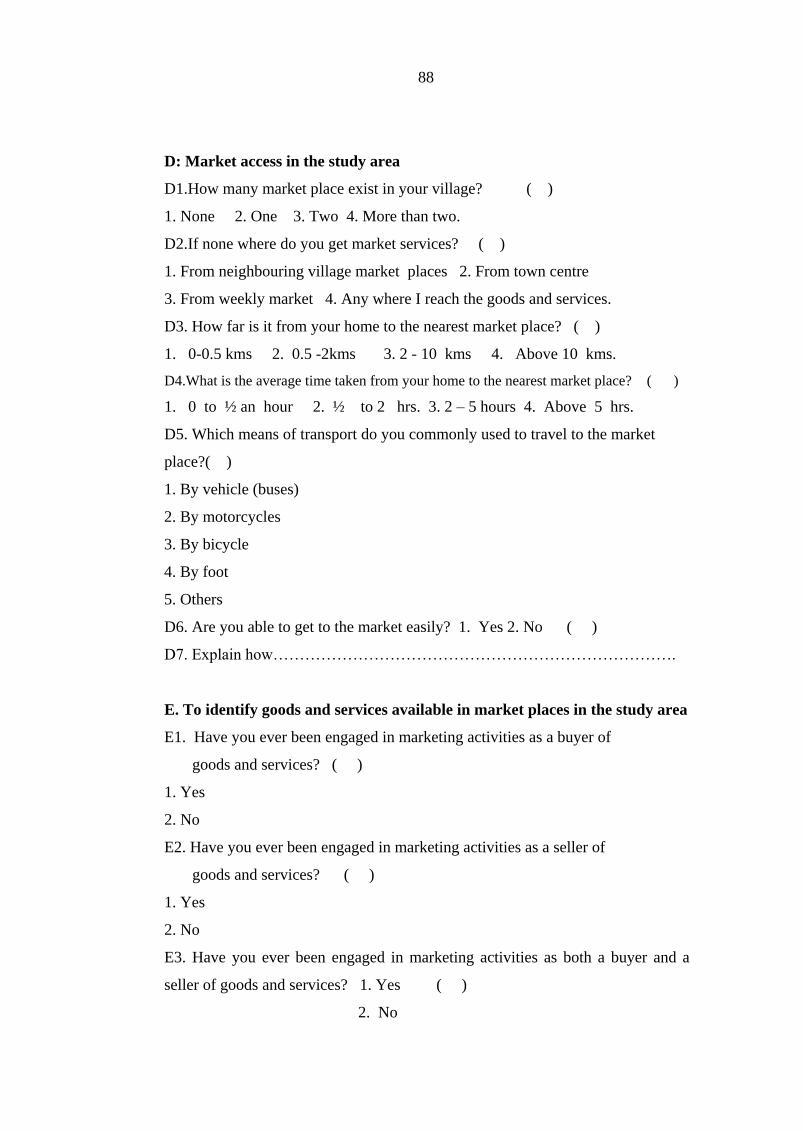
88
D: Market access in the study area
D1.How many market place exist in your village? ( )
1. None 2. One 3. Two 4. More than two.
D2.If none where do you get market services? ( )
1. From neighbouring village market places 2. From town centre
3. From weekly market 4. Any where I reach the goods and services.
D3. How far is it from your home to the nearest market place? ( )
1. 0-0.5 kms 2. 0.5 -2kms 3. 2 - 10 kms 4. Above 10 kms.
D4.What is the average time taken from your home to the nearest market place? ( )
1. 0 to ½ an hour 2. ½ to 2 hrs. 3. 2 – 5 hours 4. Above 5 hrs.
D5. Which means of transport do you commonly used to travel to the market
place?( )
1. By vehicle (buses)
2. By motorcycles
3. By bicycle
4. By foot
5. Others
D6. Are you able to get to the market easily? 1. Yes 2. No ( )
D7. Explain how………………………………………………………………….
E. To identify goods and services available in market places in the study area
E1. Have you ever been engaged in marketing activities as a buyer of
goods and services? ( )
1. Yes
2. No
E2. Have you ever been engaged in marketing activities as a seller of
goods and services? ( )
1. Yes
2. No
E3. Have you ever been engaged in marketing activities as both a buyer and a
seller of goods and services? 1. Yes ( )
2. No

89
E4.If you are a buyer or seller which agricultural products are you accessing in the
market?
No Type of products
available
Put a
tick if
available
( √)
No Type of
products
available
Put a tick
if
available
(√)
1 Maize 13 Sardines
2 Sorghum 14 Irish
potatoes
3 Finger millet(ulezi) 15 Vegetables
4 Rice 16 Oranges
5 Groundnuts 17 Mangoes
6 Beans 18 Pineapples
7 Coconuts 19 Spices
8 Cow pea( kunde) 20 Cassava
9 Bullrush millet(
uwele)
21 Sweet
potatoes
10 Onions 22 Honey
11 Tomatoes 23 Fish
12 24 Cooking oil
E5. What are the non farms produces accessible in the market?
No Type of products available Put a tick if available ( )
1. Salt
2. Sugar
3. Ceramics equipments
4. Metal works equipments
5. Plaiting equipments
6. Soda(magadi)
7. Sweeping brooms
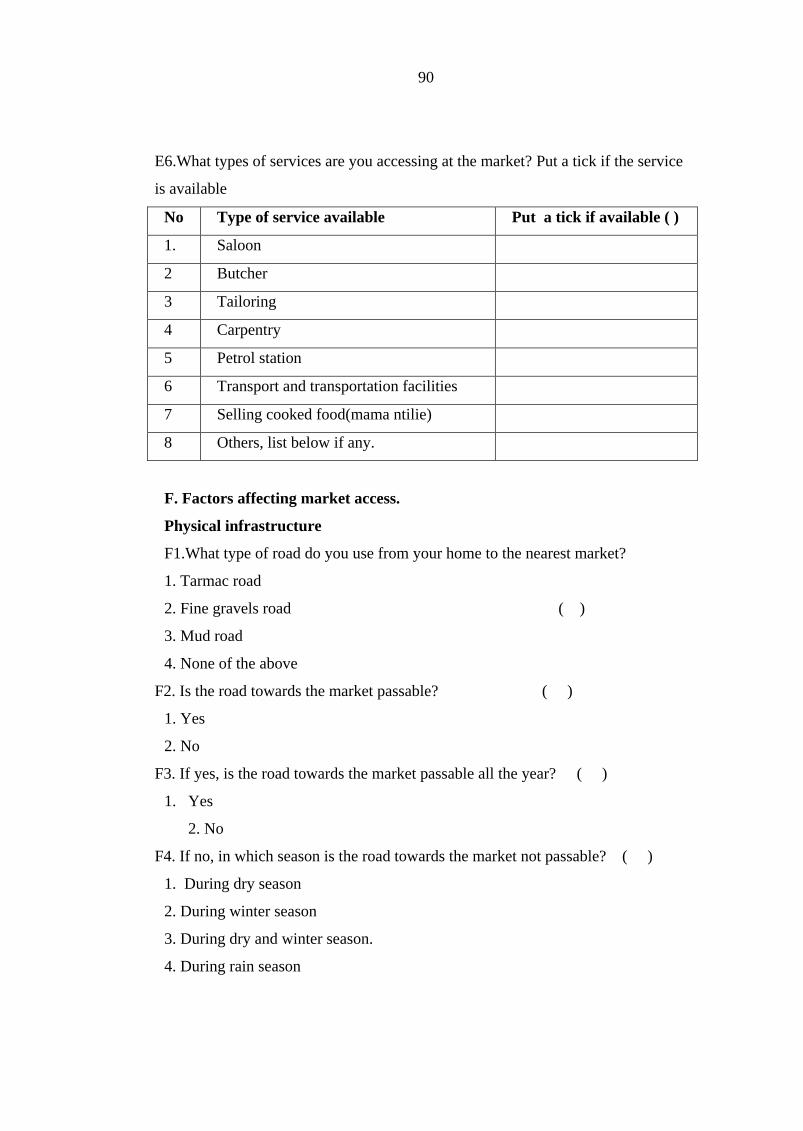
90
E6.What types of services are you accessing at the market? Put a tick if the service
is available
F. Factors affecting market access.
Physical infrastructure
F1.What type of road do you use from your home to the nearest market?
1. Tarmac road
2. Fine gravels road ( )
3. Mud road
4. None of the above
F2. Is the road towards the market passable? ( )
1. Yes
2. No
F3. If yes, is the road towards the market passable all the year? ( )
1. Yes
2. No
F4. If no, in which season is the road towards the market not passable? ( )
1. During dry season
2. During winter season
3. During dry and winter season.
4. During rain season
No Type of service available Put a tick if available ( )
1. Saloon
2 Butcher
3 Tailoring
4 Carpentry
5 Petrol station
6 Transport and transportation facilities
7 Selling cooked food(mama ntilie)
8 Others, list below if any.
91
F5. How did you transport your goods to/from the market? ( )
1. By vehicle 2. By motorcycles 3. By foot 4. By bicycle 5. Others
F6.Do you experience any problems in storing your agricultural products?
1. Yes
2. No ( )
F7.If yes where do you store the products? ( )
(1) Own rooms
(2) Hired rooms
3) Others (Specify)
F8.Did you use any storage equipments?
1.Yes ( )
2.No
F9.I f yes what type of storage equipments are you using at your home?
1. Fridge
2. Baskets and bags ( )
3. Tins and buckets
4. Others (specify)
F10.What types of storage equipments are you using at market place?
1. Fridge
2. Baskets and bags
3. Tins and buckets ( )
4. Others (specify)
F11.Where did you get information on the demand and supply of goods?
1. News papers
2. Radio

92
3. Telephone
4. Visit market places ( )
5. Fellow traders/ neighbours
6. Others (specify)
F12.Where did you get information on the prices of goods and services you
produced?
1. News papers
2. Radio
3. Telephone
4. Visit market places ( )
5. Fellow traders/ neighbours
6. Others (specify)
F13.Have you encountered any rules or regulations in the market as a seller/buyer
of goods and services?
(1) Yes
(2) No ( )
F14. If yes mention them
1………………………..............................................................
2………………………...............................................................
3………………………...............................................................
F15.Do these regulations hinder your enthusiasm on engaging with marketing
activities?
1.Yes
2.No
F16. If yes, how do they hinder enthusiasm ?
1…………………………….........................................................................
2…………………………….........................................................................
3…………………………...........................................…..............................

93
F17. Do these regulations facilitate your enthusiasm on engaging with marketing
activities?
1.Yes
2.No
F18. If Yes, how do they facilitate hindrances?
1…………………………….........................................................................
2……………………………...........................................................................
3…………………………..............................................................................
F19.Are you encountering any costs in enhancing your participation in marketing?
1. Yes
2. No
F20. If yes mention those costs
1……………………………………………………………………………
2……………………………………………………………………………
3…………………………………………………………………………..
F21. How do you rank these costs?
1. Low
2. High
3. Reasonable
G.THE EFFECTS OF MARKET ACCESS ON HOUSEHOLD’S
LIVELIHOOD SECURITY IN THE STUDY AREA
G1. How many meals do you take per day in your household?……………………
G2. How much do you spend for each type of meal per day? (typical day)
1.Breakfast…………………………………………………………………………
2.Lunch……………………………………………………………………
3. Dinner …………………………………………………………………………
G3.Are you or your household members ever engaged in groups whether formal or
informal in enhancing marketing activities?
1. Yes
2.No

94
G4.If Yes which formal /informal groups? Mention them.
1................................................................................................
2................................................................................................
3................................................................................................
G5. If No why?
1........................................................................................................
2.......................................................................................................
3........................................................................................................
G6.Are all needs satisfied by the income earned from marketing activities?
1. Yes ( )
2.No
G7.If the answer is no how do you supplement the income deficit?
...................................................................................................................................
...................................................................................................................................
G8. Please indicate assets you own in the table below:
Type of asset Number/unit Price/value
per unit
Total (Tshs)
Vehicle (type)
Bicycle
Tailoring machine
Radio
Spongy mattress
Hoe
Ox-plough
House (type)
Hurricane lamp
Charcoal stove
Kerosene stove
Torch
Panga
Axe
Ox-cart
Sofa seat
Chair
Table
Others (specify)
TOTAL COST

95
G9. Do you think your household livelihood is improving?
1. Yes
2. No ( )
G10. If yes, would you say the improvement is associated with access to the
market?
1. Yes
2. No ( )
G11.If yes, Explain how……………………………………………………….
G12. If No, what are the major constraints facing your household livelihood
1. ……………………..........................................................................................
2. …………………..............................................................................................
G13. On which issues or areas do you feel you need assistance in marketing
activities?
1……………………………………………………………………………………
2……………………………………………………………………………………
G14. In your opinion, which areas in marketing structure and regulations do you
think require improvement?
1……………………………………………………………………………………
2……………………………………………………………………………………
THANK YOU VERY MUCH FOR YOUR COOPERATION

96
Appendix 3: Interview for the key informants (Checklist)
G1. Location: Ward ……………….Village ………………. Position …………
G2. Age
G3. Sex
G4. Level of education
G5. Agricultural and nonfarm goods and services supplied in the markets.
G6. Rules and regulations for participating in marketing activities.
G7. Accessibility to the market, hindrances and ways to overcome them.
G8. Do you think those rules and regulations hinder or promote people‘s
participation in the market?
(a) Yes (b) No
How…………………………………………………………………………
G9.Where is the most customers of this market come from?
G10.How do you view the extent of government interventions on solving problems
in market access?
G11. In general, how do you comment on the extent to which market activities have
influence in household‘s livelihood security?
THANK YOU VERY MUCH FOR YOUR COOPERATION