Oana Lavinia Ciuca Etapele Ideologizarii Conceptului de Emancipare a Femeii

2/20/2017 e.Proofing
http://eproofing.springer.com/journals/printpage.php?token=RSgXV2fCXDFyGotu2fvsYldgiHRUJk3z94KfxPvF4DqxOeQmwiadYw 1/27
Implications of hepatitis C virus subtype1a migration patterns for virus geneticsequencing policies in ItalyOpen AccessThis article is distributed under the terms of the Creative Commons Attribution 4.0
International License ( http://creativecommons.org/licenses/by/4.0/ ), which permits unrestricted use,
distribution, and reproduction in any medium, provided you give appropriate credit to the original author(s)
and the source, provide a link to the Creative Commons license, and indicate if changes were made. The
Creative Commons Public Domain Dedication waiver ( http://creativecommons.org/publicdomain/zero/1.0/ )
applies to the data made available in this article, unless otherwise stated.
LizeAQ1
AQ2
Cuypers,
Phone +3216332161Email [email protected]
Bram Vrancken,
Lavinia Fabeni,
Nadia Marascio,
Valeria Cento,
Velia Chiara Di Maio,
Marianna Aragri,
Andrea Clemencia PinedaPeña,
Yoeri Schrooten,
Kristel Van Laethem,
Daniel Balog,
Alfredo Focà,
1,*
1
2
3,1
4
4
4
5,6
1
1
7
3
2/20/2017 e.Proofing
http://eproofing.springer.com/journals/printpage.php?token=RSgXV2fCXDFyGotu2fvsYldgiHRUJk3z94KfxPvF4DqxOeQmwiadYw 2/27
Carlo Torti,
Frederik Nevens,
Carlo Federico Perno,
AnneMieke Vandamme,
Francesca CeccheriniSilberstein,
KU Leuven – University of Leuven, Department of Microbiology and
Immunology, Rega Institute for Medical Research, Clinical and Epidemiological
Virology, Herestraat 49 – box 1040, 3000 Leuven, Belgium
National Institute for Infectious Diseases L. SpallanzaniIRCCS, Rome, Italy
Department of Health Sciences, Institute of Microbiology, School of
Medicine, University of “Magna Graecia”, Viale Europa,
Germaneto, 88100 Catanzaro, Italy
Department of Experimental Medicine and Surgery, University of Rome Tor
Vergata, Rome, Italy
Global Health and Tropical Medicine, GHTM, Institute for Hygiene and Tropical
Medicine, IHMT, University Nova de Lisboa, UNL, Rua da Junqueira 100, 1349
008 Lisbon, Portugal
Molecular Biology and Immunology Department, Fundación Instituto de
Immunología de Colombia (FIDIC), Basic Sciences Department, Universidad del
Rosario, Bogotá, Colombia
Luciad, Computer Software, Gaston Geenslaan 11, 3001 Heverlee, Belgium
Department of Medical and Surgical Sciences, Unit of Infectious and Tropical
Diseases, School of Medicine, University of “Magna Graecia”, Viale Europa,
Germaneto, 88100 Catanzaro, Italy
KU Leuven – University of Leuven, Department of Clinical and Experimental
Medicine, Hepatology, Leuven, Belgium
University Hospitals Leuven, Department of Gastroenterology and
Hepatology, Leuven, Belgium
8
9,10
4
1,5
4
1
2
3
4
5
6
7
8
9
10

2/20/2017 e.Proofing
http://eproofing.springer.com/journals/printpage.php?token=RSgXV2fCXDFyGotu2fvsYldgiHRUJk3z94KfxPvF4DqxOeQmwiadYw 3/27
Abstract
BackgroundIndepth phylogeographic analysis can reveal migration patterns relevant forpublic health planning. Here, as a model, we focused on the provenance, in thecurrent Italian HCV subtype 1a epidemic, of the NS3 resistanceassociatedvariant (RAV) Q80K, known to interfere with the action of NS3/4A proteaseinhibitor simeprevir. HCV1a migration patterns were analysed using Bayesianphylodynamic tools, capitalising on newly generated and publicly available timeand georeferenced NS3 encoding virus genetic sequence data.
ResultsOur results showed that both immigration and local circulation fuel the currentItalian HCV1a epidemic. The United States and European continental lineagesdominate import into Italy, with the latter taking the lead from the 1970sonwards. Since similar migration patterns were found for Q80K and otherlineages, no clear differentiation of the risk for failing simeprevir can be madebetween patients based on their migration and travel history. Importantly, sinceHCV only occasionally recombines, these results are readily transferable to thegenetic sequencing policy concerning NS5A RAVs.
Conclusions
The patient migration and travel history cannot be used to target only part of theHCV1a infected population for drug resistance testing before start of antiviraltherapy. Consequently, it may be costeffective to expand genotyping efforts to allHCV1a infected patients eligible for simeprevirbased therapies.
KeywordsHCVHCV1aQ80KItaly

2/20/2017 e.Proofing
http://eproofing.springer.com/journals/printpage.php?token=RSgXV2fCXDFyGotu2fvsYldgiHRUJk3z94KfxPvF4DqxOeQmwiadYw 4/27
USEuropePhylogeographyPublic health policy
Abbreviations
BEAGLE Broadplatform Evolutionary Analysis General Likelihood EvaluatorBEAST Bayesian Evolutionary Analysis Sampling TreesBF Bayes FactorBSSVS Bayesian stochastic search variable selectionCI Confidence intervalDAA Directacting antiviralGTR Generalized time reversible modelHCV Hepatitis C virusHIV Human immunodeficiency virusHKY HasegawaKishinoYanoHPD Highest posterior density intervalMCC Maximum clade credibilityMCMC Markov Chain Monte Carlon NumberPI Protease inhibitorRAV Resistanceassociated variantRAxML Randomized Axelerated MaximumLikelihoodUS United StatesWOII World War II
Electronic supplementary material
The online version of this article (doi: 10.1186/s1286201709133 ) containssupplementary material, which is available to authorized users.
BackgroundHepatitis C virus (HCV) infected patients are nowadays treated with interferonfreeregimens containing one or more antivirals that directly target virus proteins. Thesenew directacting antivirals (DAAs) have a superb efficacy and, when combined,

2/20/2017 e.Proofing
http://eproofing.springer.com/journals/printpage.php?token=RSgXV2fCXDFyGotu2fvsYldgiHRUJk3z94KfxPvF4DqxOeQmwiadYw 5/27
can clear the virus in more than 95% of the treated population, irrespective of the
HCV genotype [ 1 ]. For most DAAs no clear association of particular naturally
occurring resistanceassociated variants (RAVs) with clinical outcome has been
identified [ 2 ]. Because of this, baseline drug resistance testing is only
recommended in welldefined cases such as the combination of NS3/4A protease
inhibitor (PI) simeprevir with NS5B polymerase inhibitor sofosbuvir. This regimen
is associated with reduced viral cure rates in HCV subtype 1a (HCV1a) cirrhotic
patients who carry the naturally occurring, highly prevalent RAV Q80K [3, 4, 5, 6 ].
The potential clinical relevance of the processes that shape the distribution of
particular variants spurred an interest in the spatiotemporal aspects of the HCV1a
evolutionary history in general, and in particular that of NS3 variant Q80K. Given
the increased interest into the natural prevalence of several other RAVs, particularly
located in NS5A [4, 7 ], insights into the patterns of HCV1a spread may be
interesting for these variants as well.
Little over a decade after the discovery of the virus itself, it was revealed that there
was a burst in the number of HCV1a transmissions starting from the second half of
the 20 century, which is likely linked to the history of illicit drug use and
iatrogenic intervention rates [ 8, 9, 10, 11 ]. While in these earlier studies the
emphasis was on the temporal and spatial aspects of HCV1a in general, the medical
relevance of the Q80K polymorphism drew attention to the segregation of the
global HCV1a variability into two distinct clades, clade I and clade II
[ 12, 13, 14, 15 ], with the first clade further structured into three subclades [ 16 ]. In
particular, Q80K strains are concentrated in the socalled clade IA [16 ], and the
Q80K prevalence is largely accounted for by a single substitution event dating back
to 1940–1963 [17 ]. This ancestral lineage first arose in the United States (US) and
has been introduced multiple times into Europe [ 13, 14, 17 ]. Importantly, in these
studies the migration patterns of HCV1a were evaluated on the continental
geographical level, while a more finegrained resolution is required to provide
actionable information for national or regional public health programs.
Detailed phylogeographic analyses are particularly pertinent for clinically relevant
lineages. Due to the rapid evolution of HCV treatments that achieve high viral cure
rates, the regimen simeprevir with sofosbuvir, largely used as firstline treatment so
far in Europe and in Italy [ 18, 19 ], has recently been categorized as suboptimal for
HCV1a infected patients [ 20 ]. Nonetheless, secondline NS5A inhibitorbased
regimens can still be considered when the absence of relevant RAVs is confirmed
[21 ]. Despite this shift from NS3targeting DAAs to those that inhibit the NS5A
protein, a thorough analysis of the patterns of virus flow based on the NS3 region
th

2/20/2017 e.Proofing
http://eproofing.springer.com/journals/printpage.php?token=RSgXV2fCXDFyGotu2fvsYldgiHRUJk3z94KfxPvF4DqxOeQmwiadYw 6/27
remains valuable because HCV only rarely recombines [ 22 ], and migration patterns
inferred from small genomic regions hence have a genomewide representativeness.
Moreover, because drug resistance testing before treatment initiation has always
been recommended for HCV1a infected patients when simeprevir is part of the
planned regimen, NS3based phylogeographic reconstructions can capitalize on a
comparatively large number of publicly available NS3 sequence data to obtain the
most accurate insights as possible. However, the rapid evolution in preferred HCV
treatment schemes makes that phylogeographically informed public health decisions
are of temporal value, and need to be updated regularly.
Here, we reconstructed the historical spread of HCV1a using a withincountrylevel
resolution, and focused on the potential public health implications of the recovered
clustering patterns for Italy. To this end, new sequencing data of the NS3 gene from
Italy were combined with a selection of globally sampled publicly available
sequences to infer the plausible origins and frequencies of HCV1a migrations into
and out of Italy, and to explore the withincountry migration flows for Italy, with
statistical phylogeographic tools. In doing so, we provide a blueprint of how similar
studies with a focus on other genomic regions in the HCV genome like the NS5A
protein, or even other viruses can analyze patterns of virus flow by integrating
genetic, spatial and temporal information in a stateoftheart Bayesian phylogenetic
framework. Furthermore, the timing of the Q80K origins was refined and the
historical context of their spread from the US to Europe and Italy was discussed.
MethodsNewly generated Italian sequencesThis retrospective study includes 183 samples, collected between 2011–2015, from
mostly DAAnaïve (N = 163, 89.1%) Italian patients infected with HCV1a. The
Italian strains were collected in at least seven regions (Additional file 1 : Table S1).
The NS3 protease gene (181 amino acids) was sequenced as reported elsewhere
[23 ] in the context of routine clinical care at University of Rome Tor Vergata, Italy
(art. 6 and art. 9, leg. 211/2003 and 196/2003).
Sequence dataset compilationThe Italian sequence data were complemented with all publicly available HCV1a
NS3 sequences from Genbank (N = 3032, http://www.ncbi.nlm.nih.gov/nucleotideAQ3
2/20/2017 e.Proofing
http://eproofing.springer.com/journals/printpage.php?token=RSgXV2fCXDFyGotu2fvsYldgiHRUJk3z94KfxPvF4DqxOeQmwiadYw 7/27
) that fulfilled the following quality criteria. Only sequences that wereunambiguously subtyped as HCV1a with subtyping tools Oxford HCV version 2[24 ], COMET [25 ], and by phylogenetic analysis including a broad panel ofreference sequences, were retained. The latter phylogenies were estimated on 1000bootstrapped alignments with RAxML under a GTR + Γ substitution model, withsubtypes assigned to strains clustering with ≥70% bootstrap support. Clonalsequences and strains from nonhuman hosts, duplicate sequences and strainscovering <80% of the NS3 gene were removed. Remaining strains were alignedusing an in house pairwise codon aware alignment tool (http://regatools.med.kuleuven.be/sequencetool/sequencetool.wtAQ4
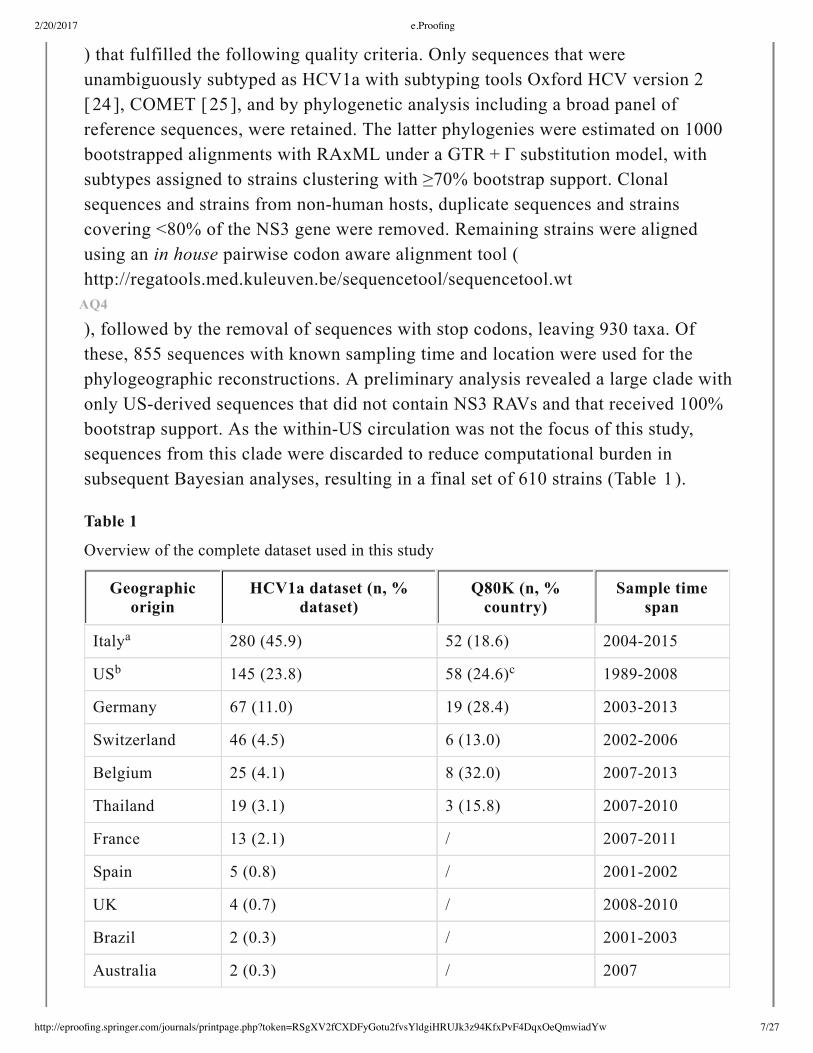
), followed by the removal of sequences with stop codons, leaving 930 taxa. Ofthese, 855 sequences with known sampling time and location were used for thephylogeographic reconstructions. A preliminary analysis revealed a large clade withonly USderived sequences that did not contain NS3 RAVs and that received 100%bootstrap support. As the withinUS circulation was not the focus of this study,sequences from this clade were discarded to reduce computational burden insubsequent Bayesian analyses, resulting in a final set of 610 strains (Table 1 ).
Table 1
Overview of the complete dataset used in this study
Geographic
origin
HCV1a dataset (n, %
dataset)
Q80K (n, %
country)
Sample time
span
Italy 280 (45.9) 52 (18.6) 20042015
US 145 (23.8) 58 (24.6) 19892008
Germany 67 (11.0) 19 (28.4) 20032013
Switzerland 46 (4.5) 6 (13.0) 20022006
Belgium 25 (4.1) 8 (32.0) 20072013
Thailand 19 (3.1) 3 (15.8) 20072010
France 13 (2.1) / 20072011
Spain 5 (0.8) / 20012002
UK 4 (0.7) / 20082010
Brazil 2 (0.3) / 20012003
Australia 2 (0.3) / 2007
a
b c

2/20/2017 e.Proofing
http://eproofing.springer.com/journals/printpage.php?token=RSgXV2fCXDFyGotu2fvsYldgiHRUJk3z94KfxPvF4DqxOeQmwiadYw 8/27
Geographic
origin
HCV1a dataset (n, %
dataset)
Q80K (n, %
country)
Sample time
span
China 1 (0.2) / 2009
Japan 1 (0.2) / 2009
Total 610 146 (23.9) 19892015
The absolute and relative contribution of each country, the number of Q80K variants andtheir share by country, and the time span of the samples included per country, aredetailed. 183 (63%) of the Italian sequences have not been published before. To assessthe proportion of Q80K strains, the 91 taxa from the removed cluster were taken intoaccount (see Methods ). Since the Q80K prevalence in the US was lower than expected,it was recalculated taking strains without sampling time information into account,resulting into a prevalence of 57.5%
To assess the robustness of the phylogeographic reconstructions against sampling
biases, three random downsamples with a maximum of 30 sequences per location
were created, resulting in three sets with a more balanced number of samples by
location. Additionally, a diverse subset of 83 sequences was selected from clade I
using the same procedure as in [ 26 ] to independently estimate the evolutionary rate
in the Q80K clade. Briefly, from each sampling year the five most divergent
sequences were selected with the Phylogenetic Diversity Algorithm [27 ], which
selects the subtree of n taxa connected by the largest sum of branch lengths.
Identification of Italian transmission networksTransmission clusters that represent the Italian transmission dynamics were
identified using a posterior root node support cutoff of ≥90% and were required to
consist at least for 90% of member taxa isolated in Italy.
Bayesian estimation of time-calibrated treesAll phylogenies were estimated using the Bayesian Evolutionary Analysis by
Sampling Trees software (BEAST, v.1.8.2.) [ 28 ] with BEAGLE [29 ] to improve
the computational performance. The skygrid or skyride model was used as a flexible
nonparametric prior for the coalescent process in all analyses. A check for
molecular clock signal [ 30 ] revealed that there was insufficient accumulation of
divergence over the sampling time span to reliably estimate evolutionary rates. A
first attempt to remedy this was specifying an informative prior distribution on the
mean clock rate parameter of the relaxed clock model [ 31 ] that is based on a
previously reported HCV1a dataset with strong temporal signal [ 32 ]. Exploratory
a b
c

2/20/2017 e.Proofing
http://eproofing.springer.com/journals/printpage.php?token=RSgXV2fCXDFyGotu2fvsYldgiHRUJk3z94KfxPvF4DqxOeQmwiadYw 9/27
runs with this model setup, however, indicated this still represented anoverparameterization, which is why the mean clock rate was fixed to the mean ofthe NS3 rate estimate from the Gray et al. (2011) data, but while still estimating thevariance of the evolutionary rate. A codon position partitioned HKY model wasfitted, allowing for Γdistributed among site rate heterogeneity at each position.Convergence and mixing properties of the Markov chain Monte Carlo (MCMC)chains were assessed with Tracer v1.6. Results of several MCMC chains werecombined after removal of the burnin. Maximum clade credibility (MCC) treeswere summarized using TreeAnnotator included in the BEAST package. Trees werevisualized with FigTree v 1.4.2 ( http://tree.bio.ed.ac.uk/software/figtree/AQ5
).
Phylogeographic reconstructions
Sourcesink relations were evaluated with a discrete diffusion model that allows fordifferent rates depending on the direction of movement [ 33 ]. The migrationpathways that are most relevant in the history of spread were identified with aBayesian stochastic search variable selection (BSSVS) approach [ 34 ]. Bayes factor(BF) support (with BF ≥3 assumed to be relevant [ 35 ]) for all possible types oflocation exchanges was calculated using SpreaD3 [36 ]. Posterior expectations ofthe number of transition events between all possible pairs of locations (Markovjumps) were estimated with efficient stochastic mapping techniques [ 37 ].
ResultsSequence dataset
The final alignment included 610 sequences and covered 181 amino acids of theNS3 gene. Italy is the bestrepresented country in this final dataset, followed by theUS (Table 1 ). Of the Western European strains, 36.4% was isolated in countriesother than Italy. The Q80K variant was detected in 23.9% of all strains, and asomewhat lower prevalence of 19.3% was observed for Western Europe. Theproportion of taxa carrying Q80K varied from 13.0% to 32.0% by country(Table 1 ).
Multiple independent introductions of HCV1a and Q80K in
Italy

2/20/2017 e.Proofing
http://eproofing.springer.com/journals/printpage.php?token=RSgXV2fCXDFyGotu2fvsYldgiHRUJk3z94KfxPvF4DqxOeQmwiadYw 10/27
Bayesian phylogeographic methods were used to determine when and from where
HCV1a strains were introduced into Italy. As only limited sequence data was
available for most European countries, all nonItalian isolates from Europe were
grouped as ‘Europe (not Italy)’. Similarly, isolates sampled outside the US and
Europe were grouped as ‘others’. To mitigate the potentially biasing effect of
sample sizes on ancestral reconstructions of the location states, three subsampled
datasets with more equal sample numbers by location state were analyzed (US,
Italy, Europe (not Italy) and others).
Independent of the sampling, similar migration patterns were observed in the two
major HCV1a clades as well as among the clade 1 subclades, including the clade
that comprises virtually all Q80K lineages, to which we from now on refer to as the
Q80K clade (Fig. 1ad ). The most clear reemerging pattern in the complete and in
the subsampled datasets is the seeding, but not receiving, role of the US in the
global spread of HCV1a. Specifically, the migration rates involving the US as origin
location always receive high support for being nonzero, while rates of migration
towards the US are indistinguishable from zero (Table 2 ). The remaining three
wellsupported migration links in the complete dataset received substantial Bayes
factor (BF) support in two out of three subsampled datasets. Two of these links
involve Italy, and lend support for Italy as a source and a sink for European
continental virus movements. An interactive webbased visualization and demo
video of the phylogeographic history of HCV1a in general and in particular of the
Q80K polymorphism is available at http://demo.luciad.com/rega/?hepa&2d
AQ6
(legend, see Additional file 2: Video).
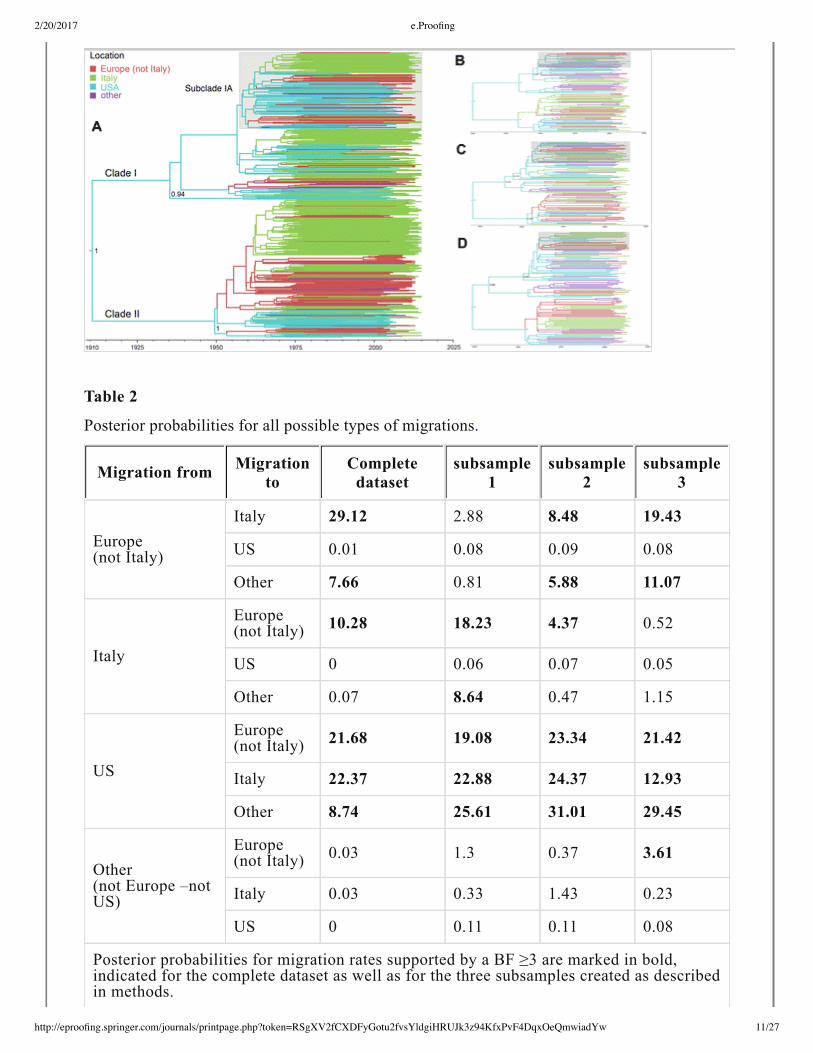
Fig. 1
The United States as the immediate origin of HCV1a spread to Europe and Italy.
The branches in the HCV1a maximum clade credibility (MCC) tree constructed from
the complete dataset are colored according to sampling country with strains grouped
into four locations (see legend). All but five Q80K strains are found in the same clade,
which is highlighted in grey. We refer to Fig. 3 for further details on the Q80K
history. Mixing of strains among the four locations can be observed in the entire tree.
HCV entered Italy via the US and continental migration in the two major clades of
HCV1a variability (Clade I and II) as well as in the Q80K clade. Posterior root node
support is visualized in a selection of deeper nodes. a: entire dataset. b: MCC tree
estimated from subsample 1 (see Methods ). c: MCC tree estimated from subsample 2.
d: MCC tree estimated from subsample 3.
2/20/2017 e.Proofing
http://eproofing.springer.com/journals/printpage.php?token=RSgXV2fCXDFyGotu2fvsYldgiHRUJk3z94KfxPvF4DqxOeQmwiadYw 11/27
Table 2
Posterior probabilities for all possible types of migrations.
Migration from Migrationto
Completedataset
subsample1
subsample2
subsample3
Europe
(not Italy)
Italy 29.12 2.88 8.48 19.43
US 0.01 0.08 0.09 0.08
Other 7.66 0.81 5.88 11.07
Italy
Europe
(not Italy)10.28 18.23 4.37 0.52
US 0 0.06 0.07 0.05
Other 0.07 8.64 0.47 1.15
US
Europe
(not Italy)21.68 19.08 23.34 21.42
Italy 22.37 22.88 24.37 12.93
Other 8.74 25.61 31.01 29.45
Other
(not Europe –not
US)
Europe
(not Italy)0.03 1.3 0.37 3.61
Italy 0.03 0.33 1.43 0.23
US 0 0.11 0.11 0.08
Posterior probabilities for migration rates supported by a BF ≥3 are marked in bold,
indicated for the complete dataset as well as for the three subsamples created as described
in methods.

2/20/2017 e.Proofing
http://eproofing.springer.com/journals/printpage.php?token=RSgXV2fCXDFyGotu2fvsYldgiHRUJk3z94KfxPvF4DqxOeQmwiadYw 12/27
Migration from Migrationto
Completedataset
subsample1
subsample2
subsample3AQ7
AQ8
In addition to the significance of migration rates, the expected proportion of allpossible migration events in the HCV1a history (Markov jumps) was also inferred(Table 2 ). Little over half of all expected migrations are virus movements from theUS, and a majority of these are directed towards Western Europe. The virus flowsinvolving Italy account for 83.4% of the remaining expected number of jumps, andItaly mostly acts as the destination location in this European continental spread(73.9%). Using the entire dataset, the first introduction of HCV1a into Italy wastimed around 1957.7 (95% HPD: 1949.01964.4) (Fig. 1 ), and the first appearanceof a Q80K lineage in Italy around 1961.5 (95% HPD: 1957.61965.7).
The picture painted by the Markov jumps analysis above is a static one and does notinform us on changes over time of the relative importance of the migration flows toand from Italy. A plot of the expected number of migration events from Italy revealsa stable pattern of seeding almost uniquely towards other Western Europeancountries throughout the history (Fig. 2 , left panel). In contrast, a similar plot forthe incoming migrations shows that the initial dominance of the US as originlocation has decreased in favor of European continental HCV1a circulation, startingfrom 1970 (Fig. 2 , right panel).
Fig. 2
Immigration and emigration rates of HCV1a strains from and to Italy, over time
period 1940–2015. Left panel: Over 99% of exportation events from Italy are directedtowards other European countries (in blue). Note that the rate decline in the mostrecent years reflects the loss of branches in the sampling time period, rather than thestart of an actual tendency. Right panel: The origin of virtually all strains enteringItaly can be traced back to the United States (US) and other European countries (seeTable 2 ). At the onset of the Italian HCV1a epidemic, immigration was most intensefrom the US (in blue). From 1970 onwards, introductions from the Europeancontinent started to dominate (in red). The introduction rate (yaxis) was defined asthe median posterior estimate of the expected number of migration events from thatparticular location per time unit.

2/20/2017 e.Proofing
http://eproofing.springer.com/journals/printpage.php?token=RSgXV2fCXDFyGotu2fvsYldgiHRUJk3z94KfxPvF4DqxOeQmwiadYw 13/27
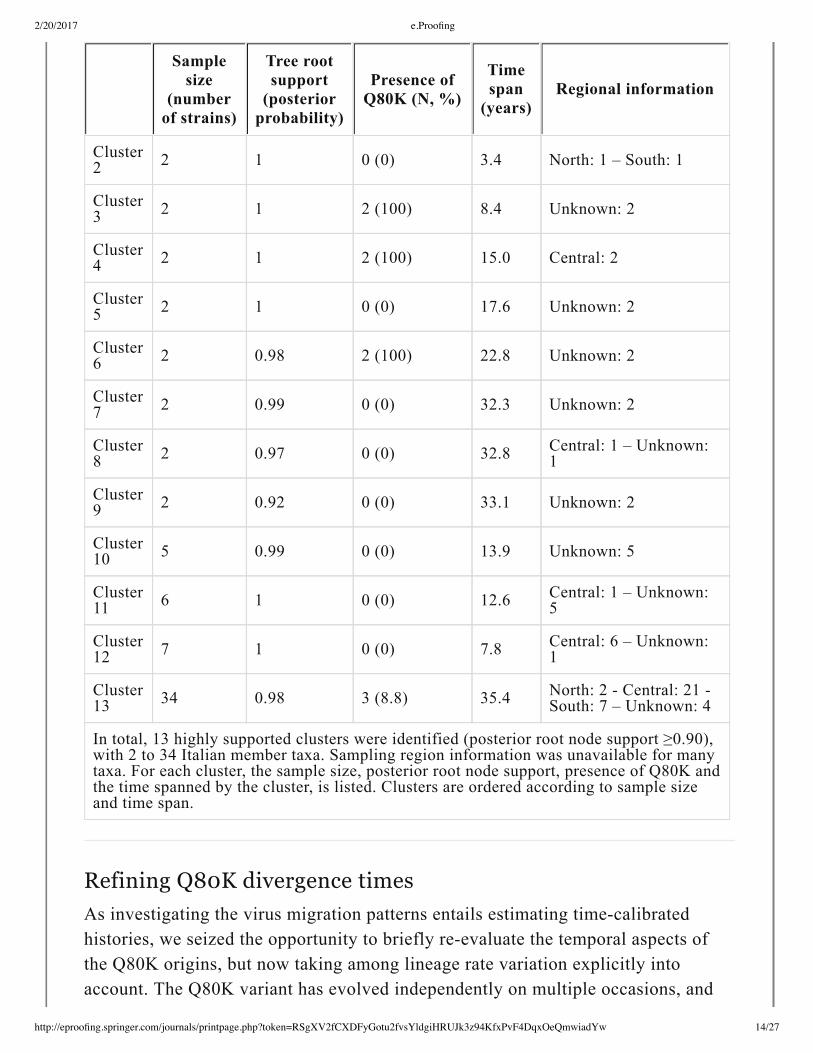
Migration patterns within ItalyTwelve highly supported small clusters with only Italian isolates (size range: 2–7)and one pure Italian large cluster (size 34, cluster 13 in Table 3 ) were identified inthe MCC summary tree of the time evolutionary histories (Additional file 3 : FigureS1). Information on the sampling region (North, Central, South) was available onlyfor a limited number of the members of the smaller clusters and for the majority ofsamples from the large cluster (Table 3 ). Both homogenous (n = 1, cluster 4) andmixedorigin (n = 1, cluster 2) small clusters were observed. Phylogeographicanalysis of cluster 13 with the same (asymmetric) model as before painted a pictureof migration by proximity where both North and South regions interact with theCentral region (BF support >3) and vice versa (BF support >20), but not with eachother (BF support for NorthtoSouth and SouthtoNorth migration rates <3). Thereis one larger Italian cluster in the Q80K clade (Fig. 1 ), but this has a posterior rootnode support of 81%, which is below the used cutoff. Nonetheless, the distributionof its lineages over at least five regions (Additional file 4 : Table S2) also points toan interregional mixing of strains within Italy.
Table 3
Highly supported Italian clusters identified in the MCC tree obtained from the complete
dataset.
Samplesize
(numberof strains)
Tree rootsupport(posteriorprobability)
Presence ofQ80K (N, %)
Timespan(years)
Regional information
Cluster
12 1 0 (0) 2.23 Unknown: 2
2/20/2017 e.Proofing
http://eproofing.springer.com/journals/printpage.php?token=RSgXV2fCXDFyGotu2fvsYldgiHRUJk3z94KfxPvF4DqxOeQmwiadYw 14/27
Samplesize
(numberof strains)
Tree rootsupport(posteriorprobability)
Presence ofQ80K (N, %)
Timespan(years)
Regional information
Cluster2 2 1 0 (0) 3.4 North: 1 – South: 1
Cluster3 2 1 2 (100) 8.4 Unknown: 2
Cluster4 2 1 2 (100) 15.0 Central: 2
Cluster5 2 1 0 (0) 17.6 Unknown: 2
Cluster6 2 0.98 2 (100) 22.8 Unknown: 2
Cluster7 2 0.99 0 (0) 32.3 Unknown: 2
Cluster8 2 0.97 0 (0) 32.8 Central: 1 – Unknown:
1
Cluster9 2 0.92 0 (0) 33.1 Unknown: 2
Cluster10 5 0.99 0 (0) 13.9 Unknown: 5
Cluster11 6 1 0 (0) 12.6 Central: 1 – Unknown:
5
Cluster12 7 1 0 (0) 7.8 Central: 6 – Unknown:
1
Cluster13 34 0.98 3 (8.8) 35.4 North: 2 Central: 21
South: 7 – Unknown: 4
In total, 13 highly supported clusters were identified (posterior root node support ≥0.90),with 2 to 34 Italian member taxa. Sampling region information was unavailable for manytaxa. For each cluster, the sample size, posterior root node support, presence of Q80K andthe time spanned by the cluster, is listed. Clusters are ordered according to sample sizeand time span.
Refining Q80K divergence timesAs investigating the virus migration patterns entails estimating timecalibratedhistories, we seized the opportunity to briefly reevaluate the temporal aspects ofthe Q80K origins, but now taking among lineage rate variation explicitly intoaccount. The Q80K variant has evolved independently on multiple occasions, and

2/20/2017 e.Proofing
http://eproofing.springer.com/journals/printpage.php?token=RSgXV2fCXDFyGotu2fvsYldgiHRUJk3z94KfxPvF4DqxOeQmwiadYw 15/27
one lineage was particularly successful and gave rise to almost all currently
circulating Q80K strains. This major Q80K clade had a low posterior support
(58.6%), but upon further inspection it became clear that this was due to one or a
few taxa that frequently clustered outside this dominant Q80K clade (see Fig. 3b
c ). The genesis of the most recent common ancestor of the most successful Q80K
clade was estimated around 1957 (95% highest posterior density (HPD): 1947.3
1958.6).
Fig. 3
a: A founder effect dominates the history of the Q80K clade. The branches in theHCV1a MCC tree are colored according to the inferred amino acid at NS3 position 80
(see legend). All except five Q80K variants descend from a common ancestor that is
inferred to have existed around 1957 (95% HPD: 1947–1959). Posterior root node
support is visualized in a selection of deeper nodes. Amino acids other than Q or K
were found in only 13 lineages. b: Histogram of the size of the (second) largest cladewith an independent origin of Q80K among the plausible trees. The size of the largest
clade remains more or less constant, and the limited size of the second largest clade
shows that most contemporaneous Q80K lineages reside in the major Q80K clade. c:Histogram of the number of independent origins of a Q80K lineage in the plausible
trees. This shows that in the most plausible trees three to four de novo appearances ofthe Q80K variant appear.
In this analysis the mean clock rate was fixed to the mean of the NS3 rate estimate
obtained from the Gray et al. (2011) HCV1a fullgenome data [ 32 ]. To verify

2/20/2017 e.Proofing
http://eproofing.springer.com/journals/printpage.php?token=RSgXV2fCXDFyGotu2fvsYldgiHRUJk3z94KfxPvF4DqxOeQmwiadYw 16/27
whether this did not bias our timing of the origin of the Q80K clade, a ‘Q80K clade
rate’ was estimated independently using a subset of this clade’s taxa selected in the
same way as in [ 26 ] (see Methods ). Reassuringly, the NS3 mean rate estimates in
both analyses were nearly identical to each other (1.02x10 substitutions/site/year
for the Q80K clade, and 1.00x10 for the HCV1a NS3 gene using the dataset of
[ 32 ]), showing that the latter was an appropriate external calibration.
DiscussionIn this work, we elucidated patterns in the HCV1a transmission dynamics that are
relevant for the Italian HCV sequencing policy, with a focus on the NS3 variant
Q80K, which can affect success of simeprevir containing drug regimens and serves
as a model for other clinically relevant RAVs. To this end, newly obtained Italian
NS3 sequences were combined with all publicly available sequences worldwide
obtained from isolates with known sampling time and location. Sequence evolution
was integrated with spatial diffusion at a countrylevel resolution to assess the
relative importance of local spread versus virus importation into Italy. The within
Italy migration dynamics were tentatively explored and the opportunity was taken to
concisely revisit the dating of the highly successful Q80K founder event.
The clustering patterns of Italian strains with globally sampled ones showed that
HCV1a, including Q80K strains, entered Italy on multiple occasions. The origin of
these lineages can be traced to both the US and Western Europe, and no significant
link with other locations was found (Table 2 ). Few samples were available from
other regions with a considerable HCV1a burden, such as the Andean Latin
American and Caribbean regions (Table 1 , [ 38 ]). While this may have affected the
inferred role of the US as the origin (but see [ 8 ]), it does not affect our findings
that HCV1a, including Q80K strains, has been introduced into Italy on multiple
occasions.
The plot of the expected number of migration events per year from the dominant
origin locations (e.g. the US and Western Europe) to Italy shows that in the
hypothetical situation of a 100% effective screening and treatment of immigrants
and shortterm travelers of these regions, approximately five to six lineages can be
prevented from initiating an ‘Italian’ transmission network each year. Note that,
because the sampling density impacts the extent of clustering, this estimate is a
lower bound. Temporally resolving the seeding intensity by origin region also
revealed a switch in the relative importance between both locations, initially mainly
−3
−3

2/20/2017 e.Proofing
http://eproofing.springer.com/journals/printpage.php?token=RSgXV2fCXDFyGotu2fvsYldgiHRUJk3z94KfxPvF4DqxOeQmwiadYw 17/27
from the US, with European continental spread dominating from the late 1960s,early 1970s onwards (Fig. 2a , left panel).
Importantly, the Italian lineages are dispersed among all clade 1 subclades and thereare no clear differences in migration pathways between clade I, which encompassesall but one of the Q80K strains, and clade II (Fig. 1 ). This has several potentialpublic health policy implications. Because both virus import and local spread shapethe Italian HCV1a, and thus also the Italian Q80K epidemic, immigrants and shortterm travelers or other (nontravelling) Italian citizens cannot be specificallytargeted or disregarded in a sequencing program. Moreover, since the origins ofimported lineages in the Q80K and other clades are shared, and the Italian epidemicis usually seeded from those locations that contribute most to the Q80K clade, alsoreferred to as clade 1A [16 ], this too cannot be used to distinguish populations intheir relative risk of failing with simeprevir.
The national patterns of virus movements were explored by coarsely dividing Italyin a North, Central and South region, not only because detailed geographical dataare only available for a subset of the Italian samples (see Additional file 1 : TableS1) but also because using a higherlevel resolution for this small dataset precludeswellinformed parameter estimations. Although it remains difficult to extractgeneral migration patterns from a limited sampling, the extensive mixing oflineages among different regions identified for both wildtype and Q80K lineagesshows that the Italian epidemic likely is quite uniform and does not evolve in wellsegregated local subepidemics. Of note, because of this it is likely that manyunsampled Italian HCV1a lineages are part of already detected Italian transmissionnetworks and thus represent the same introduction events (and origins) as those ofsampled lineages.
HCV is characterised by substantial amounts of among lineage rate variation [ 32 ].This cannot only interfere with divergence time estimation [ 39, 40 ] but also withphylogenetic inference [ 41, 42 ], and is to the best of our knowledge for the firsttime explicitly modelled in our timing of the Q80K origins. Moreover, unlike inearlier work, the phylogeny and divergence times were coestimated using anintegrated Bayesian approach that appropriately takes the shared ancestry intoaccount and also avoids the risk of error propagation typical for ratesmoothingprocedures that rely on a prespecified topology. Our dating places the origin of themost successful lineage in 1955 (95% HPD: 1947.31958.7). This is far more recentthan the penalised likelihood based point estimate by McCloskey et al. [ 17 ] anddemarcates a more narrow interval than their linear regression based estimate (1955,

2/20/2017 e.Proofing
http://eproofing.springer.com/journals/printpage.php?token=RSgXV2fCXDFyGotu2fvsYldgiHRUJk3z94KfxPvF4DqxOeQmwiadYw 18/27
95% CI: 1945–1963). This makes that the earliest Q80K origin no longer overlapswith the dates of World War II (WOII) and, in turn, renders the hypothesis that theQ80K lineage was introduced into Europe through largescale movements ofmilitary troops unlikely. Rather, this successful Q80K lineage found itself at theright time at the right place to profit from the postWOII increase in parenteraliatrogenic procedures and illicit drug use, both in the US and elsewhere, includingItaly [ 43, 44 ]. The majority of Italian Q80K strains for which sampling regioninformation was available (156/183) were isolated in Central to Southern andInsular areas, the regions from where most ItalytoUS emigrants originate [ 45 ]. Asmany of these emigrants eventually returned estimates range from 11% to 73% forthe first half of the 20 century [ 46, 47 ] the introduction of HCV1a viaremigration is an alternative hypothesis that deserves further exploration. OtherWestern European countries, in particular Germany and the UK, also have a historyof intense travel, migration and trade with the US, but large discrepancies in thereported numbers of immigrants arriving and leaving the US hamper a comparisonof the migration flow intensities (statistics US Homeland Security). In this respect itis noteworthy that the group of nonItalian European samples includes a reasonable67 German samples but only four UK isolates (Table 1 ). The inclusion of additionaldata, in particular from the UK, can therefore be expected to ‘break’ some of thedirect links between the US and Italy. Additionally, Latin America and SouthEastAsia, for which high HCV1a prevalence rates have been reported [ 38 ], wereunderrepresented in our dataset. This implies that a number of introductions intoWestern Europe (or Italy) from these locations likely were not detected. However,because Brockmann et al. [ 48 ] reported less intensive migration links betweenEurope and Latin America as compared to between Europe and North America, andvirus dispersal is usually linked to the degree of human connectivity [ 49 ], webelieve this did not heavily impact our results.
The rate at which new virus genetic data is generated is increasing as a result ofupscaled sequencing efforts in the context of DAA combination therapies. These arefrequently extensively annotated with sociodemographic and clinical metadata,which can be used for a finegrained identification of processes that fuel anepidemic (see [ 50 ] for a recent example for HCV). Unfortunately, such metadataare usually not deposited along with the virus genetic data in public databases forreasons of privacy. Here, it has been highlighted how scrutinizing the populationlevel transmission dynamics can still reveal information relevant for interventionstrategies provided basic annotations such as sampling time and space are available.
Conclusions
th
2/20/2017 e.Proofing
http://eproofing.springer.com/journals/printpage.php?token=RSgXV2fCXDFyGotu2fvsYldgiHRUJk3z94KfxPvF4DqxOeQmwiadYw 19/27
ConclusionsIndepth phylogeographical analyses revealed that the Italian HCV1a epidemic isshaped by complex patterns of virus importation and sustained local andinterregional transmission. Because this precludes a clear differentiation of Q80Kpresence/absence between subpopulations, it may be costeffective to test allHCV1a patients eligible for therapy with simeprevir for the absence of thispolymorphism. Furthermore, this study demonstrates the usefulness of a versatileanalysis strategy that can readily be applied in different regions or countries, toother genetic regions in the HCV genome such as the NS5A protein and to othermeasurably evolving pathogens.
AcknowledgementsThe authors wish to thank Philippe Lemey for his assistance and advise in thephylogeographic reconstructions.
Funding Lize Cuypers was supported by a PhD grant of the FWO (FondsWetenschappelijk Onderzoek – Vlaanderen, Asp/12). Part of this research wassponsored by two FWO grants G.A029.11 N and G.0E84.16 N, and by the ItalianMinistry of Instruction, University & Research (MIUR) (Accordi di Programma2011: RBAP11YS7K_001, Bandiera InterOmics Protocollo PB05 1°) and by theAviralia Foundation. The VIROGENESIS project receives funding from theEuropean Union’s Horizon 2020 research and innovation program under grantagreement No 634650. This work was made possible by funding of the BijzonderOnderzoeksfonds KU Leuven (BOF) No. OT/14/115. Nadia Marascio wassupported by a postdoctoral grant of QOR (Regional Operating Program)CALABRIA FSE (European Social Founding) 2007/2013. Lavinia Fabeni wassupported by the Italian Ministry of Health (Ricerca corrente 2015, linea n.2,progetto n.3). AndreaClemencia Pineda Peña was funded by the project BioMolecular and Epidemiological Surveillance of HIV Transmitted Drug Resistance,Hepatitis CoInfections and Ongoing Transmission Patterns in Europe (BESTHOPE) (funded through HIVERA: Harmonizing Integrating Vitalizing EuropeanResearch on HIV/AIDS, grant 249697); by L’Oréal Portugal Medals of Honor forWomen in Science 2012 (financed through L’Oréal Portugal, Comissão Nacional daUnesco and Fundação para a Ciência e Tecnologia FCT) and by funds to GHTM(UID/Multi/04413/2013). A part of the computational resources and services usedin this work were provided by the Hercules Foundation and the Flemish
Government – department EWIFWO Krediet aan Navorsers (Theys, KAN2012

2/20/2017 e.Proofing
http://eproofing.springer.com/journals/printpage.php?token=RSgXV2fCXDFyGotu2fvsYldgiHRUJk3z94KfxPvF4DqxOeQmwiadYw 20/27
Government – department EWIFWO Krediet aan Navorsers (Theys, KAN20121.2.249.12).
Availability of data and materials The datasets generated and analysed duringthe current study are available on the public database Genbank (https://www.ncbi.nlm.nih.gov/nucleotide ).
Authors’ contributions LC gathered the NS3 publicly available data, constructedthe final dataset, performed phylogeographic analyses and wrote subsequent draftsof the manuscript. BV performed all Bayesian phylogeographic analyses and wrotesubsequent drafts of the manuscript. LB participated in the compilation of the newItalian sequences, quality control of the dataset and assisted in writing themanuscript, supported by her supervisor CFP. NM participated in the study designand assisted in writing the manuscript, supported by her supervisors AF and CT.VC, VCDM and MA were responsible for the sequencing and collection of the newNS3 Italian sequence dataset. ACP participated in the study design and theconstruction of the final dataset, and assisted in writing the manuscript. YS, KVLand LC were responsible for the sequencing and processing of NS3 sequences fromBelgian patients, once FN gave permission for their use. DB was responsible for thewebbased interactive visualization of the obtained results. FCS and AMVsupervised the design of the study, and assisted in writing the manuscript. Allauthors read and approved the final manuscript.
Competing interests The authors declare that they have no other competinginterests.
Consent for publication Not applicable
Ethics approval and consent to participate In total, 183 samples from Italianpatients infected with HCV1a were collected between 2011–2015. The NS3protease gene was sequenced in the context of routine clinical care at University ofRome Tor Vergata in Italy. As only anonymized samples were used and researchwas not conducted within the context of a clinical trial, ethical approval was notrequired according to the Italian law (art. 6 and art. 9, leg. 211/2003 and 196/2003).The analysis of the combined dataset was approved by the Leuven ethicalcommittee (ML9219, ML10770 and ML8635).
Additional files
Additional file 1: Table S1.
2/20/2017 e.Proofing
http://eproofing.springer.com/journals/printpage.php?token=RSgXV2fCXDFyGotu2fvsYldgiHRUJk3z94KfxPvF4DqxOeQmwiadYw 21/27
The countrywide distribution of Italian samples. Overall, 183 sequences werenewly obtained from seven different regions. The publicly available data trace back tothe work by de Luca et al. [14 ] (n = 67) and Paolluci et al. [51 ] (n = 30). The formersamples have an unknown distribution among the Lazio, Lombardy, Touscaney andPugliaApulia region. For the latter, it is only known that the patients visited theFondazione IRCCS Policlinico San Matteo, Pavia, Lombardy. (DOC 31 kb)
Additional file 2: VideoVisualization An interactive webbased visualization ofthe phylogeographic history of HCV1a. Migration patterns of HCV1a in generaland in particular of the Q80K polymorphism are visualized in an interactive webapplication, available at http://demo.luciad.com/rega/?hepa&2d . A demomoviewith voiceover is accessible through a button implemented in the application,explaining the possibilities of the tool.TMore specifically, the world map isvisualized in the upper panel, with the countries sampled in this study highlighted ina color and labeled by their name. The moviemap shows how the virus isvirallineages are introduced/ and exported in/to different countries throughout time, withthe length of the trajectories depending on the time of the migrationjumprepresented by jumping lines on the upper panel. Viral lineages that circulatelocally are represented by circles on the world map, with their size proportional tothe number of branches. In the bar under the world map, the intensity of migrationevents is shown over time (19312016) for each of the sampled countries separately,with the color of each country in this plot being the same as their color on themap.The visualization is simulated over time, using a fixed window of time as afilter. The length of a jump on the map, is inversely proportionate to the length ofthe branch in the phylogenetic tree. That is, longer geographic jumps on the mapindicate branches that quickly traveled over large distances, while short jumpsindicate branches that slowly traveled over relatively small distances. The timing ofthese jumps is indicated in the lower panel, which represents a timeline that plotsnew viral lineages over time. For instance, we see that the plot of migration eventsfor the USA (in brown) starts to increase in the start of the movie, correspondingwith migration jumps on the world map from the USA to Europe and Italy (ingreen). Additionally, the phylogeographic history of the variant Q80K can bevisualized as well, by clicking the settings icon in the upper left corner of the screenand selecting ‘apply all selected filters’ in the tab called ‘outbreak’.The colors inthis timeline match the region of the same color on the geographic map. On themap, a darker color, indicates a larger viral lineage amount. Using the tool, we canapply a color filter on the branches of the tree, visualizing not only the

2/20/2017 e.Proofing
http://eproofing.springer.com/journals/printpage.php?token=RSgXV2fCXDFyGotu2fvsYldgiHRUJk3z94KfxPvF4DqxOeQmwiadYw 22/27
phylogeographic history of HCV1a in general, but also of variant Q80K. Byactivating these filters, the migration jumps will be colored in red, yellow or blue,respectively visualizing the spread of variant Q, K or any other amino acid presentat NS3 position 80 that is not Q or K, as indicated in the legend. When this filter isactive, you can replay the movie, and follow the specific migration patterns for thedifferent NS3 variants at amino acid position 80.Migration jumps will be colored byamino acid polymorphisms present at position 80 of the NS3 protein region, withamino acid Q indicated in red, and variant K in yellow. All other polymorphisms(being not Q or K) are colored blue, as indicated in the legend.
Additional file 3: Figure S1.
The thirteen highly supported Italian clusters indicated in the maximum cladecredibility summary tree. The highly supported Italianonly clusters are highlighted ingreen, and the cluster number corresponding to the numbering in Table 3 is alsodetailed. The red background marks the dominant Q80K clade. The evolutionarydistance bar at the bottom indicates the percentage of nucleotide substitutions per sitealong each lineage. (PDF 50 kb)
Additional file 4: Table S2.
Geographical distribution of Italian Q80K lineages. For each Italian strain withinthe large Q80K clade, more detailed regional information is listed. (DOC 29 kb)
References
1. Cuypers L, Ceccherini Silberstein F, Van Laethem K, et al. Impact of HCVgenotype on treatment regimens and drug resistance: a snapshot in time. RevMed Virol. 2016. doi: 10.1002/rmv.1895 .
2. Schneider MD, Sarrazin C. Antiviral therapy of hepatitis C in 2014: do weneed resistance testing? Antiviral Res. 2014;105:64–71. doi:10.1016/j.antiviral.2014.02.011 .
3. EASL recommendations on treatment of hepatitis C, 2015.http://www.easl.eu/medias/cpg/HEPC2015/Fullreport.pdfAQ9

2/20/2017 e.Proofing
http://eproofing.springer.com/journals/printpage.php?token=RSgXV2fCXDFyGotu2fvsYldgiHRUJk3z94KfxPvF4DqxOeQmwiadYw 23/27
4. Cuypers L, Li G, Libin P, et al. Genetic diversity and selective pressure inhepatitis C virus genotypes 1–6: significance for directacting antiviral treatmentand drug resistance. Viruses. 2015;7:5018–39. doi: 10.3390/v7092857 .
5. Lawitz E, Matusow G, DeJesus E, et al. Simeprevir plus sofosbuvir inpatients with chronic hepatitis C virus genotype 1 infection and cirrhosis: aphase 3 study (OPTIMIST2). Hepatology. 2016;64:360–9. doi:10.1002/hep.28422 .
6. Sarrazin C, Lathouwers E, Peeters M, et al. Prevalence of the hepatitis Cvirus NS3 polymorphism Q80K in genotype 1 patients in the European region.Antiviral Res. 2015;116:10–6. doi: 10.1016/j.antiviral.2015.01.003 .
7. Cuypers L, Li G, NeumannHaefelin C, et al. Mapping the genomic diversityof HCV subtypes 1a and 1b: implications of structural and immunologicalconstraints for vaccine and drug development. Virus Evolution. 2016;2. doi:10.1093/ve/vew024 .
8. Magiorkinis G, Magiorkinis E, Paraskevis D, et al. The global spread ofhepatitis C virus 1a and 1b: a phylodynamic and phylogeographic analysis. PLoSMed. 2009;6:e1000198. doi: 10.1371/journal.pmed.1000198 .
9. Nakano T, Lu L, Liu P, Pybus OG. Viral gene sequences reveal the variablehistory of hepatitis C virus infection among countries. J Infect Dis.2004;190:1098–108. doi: 10.1086/422606 .
10. Pybus OG, Charleston MA, Gupta S, et al. The epidemic behavior of thehepatitis C virus. Science. 2001;292:2323–5. doi: 10.1126/science.1058321 .
11. Tanaka Y, Hanada K, Mizokami M, et al. A comparison of the molecularclock of hepatitis C virus in the United States and Japan predicts thathepatocellular carcinoma incidence in the United Status will increase over thenext two decades. Proc Natl Acad Sci U S A. 2002;99:15584–9. doi:10.1073/pnas.242608099 .
12. Bagaglio S, UbertiFoppa C, Messina E, et al. Distribution of naturalresistance to NS3 protease inhibitors in hepatitis C genotype 1a separated intoclades 1 and 2 and in genotype 1b of HIVinfected patients. Clin MicrobiolInfect. 2016;22:386. doi: 10.1016/j.cmi.2015.12.007 .
2/20/2017 e.Proofing
http://eproofing.springer.com/journals/printpage.php?token=RSgXV2fCXDFyGotu2fvsYldgiHRUJk3z94KfxPvF4DqxOeQmwiadYw 24/27
13. Beloukas A, King S, Childs K, et al. Detection of the NS3 Q80Kpolymorphism by Sanger and deep sequencing in hepatitis C virus genotype 1astrains in the UK. Clin Microbiol Infect. 2015;21:1033–9. doi:10.1016/j.cmi.2015.07.017 .
14. De Luca A, Di Giambenedetto S, Lo Presti A, et al. Two distinct hepatitis Cvirus genotype 1a clades have different geographica distribution and associationwith natural resistance to NS3 protease inhibitors. Open Forum Infect Dis.2015;2:ofv043. doi: 10.1093/ofid/ofv043 .
15. Pickett BE, Striker R, Lefkowitz EJ. Evidence for separation of HCVsubtype 1a into two distinct clades. J Viral Hepat. 2011;9:608–18. doi:10.1111/j.13652893.2010.01342.x .
16. Santos AF, Bello G, Vidal LL, et al. Indepth phylogenetic analysis ofhepatitis C virus subtype 1a and occurrence of 80 K and associatedpolymorphisms in the NS3 protease. Sci Rep. 2016;6:31780. doi:10.1038/sreo31780 .
17. McCloskey RM, Liang RH, Joy JB, et al. Global origin and transmission ofhepatitis C virus nonstructural protein 3 Q80K polymorphism. J Infect Dis.2015;211:1288–95. doi: 10.1093/infdis/jiu613 .
18. Aghemo AM, Cologni G, Maggiolo F, et al. Safety and efficacy of directlyacting antivirals in 2432 HCV patients with advanced fibrosis: an interimanalysis of the Lombardia regional network for viral hepatitis. Barcelona, Spain:51st EASL; 2016. Abstract LBP500.
19. Mauss S, Buggisch P, Böker KHW, et al. Treatment outcomes for hepatitis Cgenotype 1 infection with direct acting antivirals: data from the German hepatitisCregistry. Barcelona, Spain: 51st EASL; 2016. Abstract SAT263.
20. EASL recommendations on treatment of hepatitis C, 2016.http://www.easl.eu/medias/cpg/HCV2016/Englishreport.pdfAQ11
AQ10
21. Craxì A, Perno CF, Viganò M, et al. From current status to optimization ofHCV treatment: Recommendations from an expert panel. Dig Liver Dis.

2/20/2017 e.Proofing
http://eproofing.springer.com/journals/printpage.php?token=RSgXV2fCXDFyGotu2fvsYldgiHRUJk3z94KfxPvF4DqxOeQmwiadYw 25/27
2016;48:995–1005. doi: 10.1016/j.did.2016.06.004 .
22. GonzálezCandelas F, LópezLabrador FX, Bracho MA. Recombination inhepatitis C virus. Viruses. 2011;3:2006–24. doi: 10.3390/v3102006 .
23. Cento V, Mirabelli C, Salpini R, et al. HCV genotypes are differently proneto the development of resistance to linear and macrocyclic protease inhibitors.PLoS One. 2012;7:e39652. doi: 10.1371/journal.pone.0039652 .
24. De Oliveira T, Deforche K, Cassol S, et al. An automated genotyping systemfor analysis of HIV1 and other microbial sequences. Bioinformatics.2005;21:3797–800. doi: 10.1093/bioinformatics/bti607 .
25. Struck D, Lawyer G, Ternes AM, et al. COMET: adaptive contextbasedmodeling for ultrafast HIV1 subtype identification. Nucleic Acids Res.2014;42:e144. doi: 10.1093/nar/gku739 .
26. Vrancken B, Rambaut A, Suchard MA, et al. The genealogical populationdynamics of HIV1 in a large transmission chain: bridging within and amonghost evolutionary rates. PLoS Comput Biol. 2014;10:e1003505. doi:10.1371/journal.pcbi.1003505 .
27. Chernomor O, Minh BQ, Forest F, et al. Split diversity in constrainedconservation prioritization using integer linear programming. Methods EcolEvol. 2015;6:83–91. doi: 10.1111/2041210X.12299 .
28. Drummond AJ, Suchard MA, Xie D, Rambaut A. Bayesian phylogeneticswith BEAUti and the BEAST 1.7. Mol Biol Evol. 2012;29:1969–73. doi:10.1093/molbev/mss075 .
29. Suchard MA, Rambaut A. Manycore algorithms for statistical phylogenies.Bioinformatics. 2009;25:1370–6. doi: 10.1093/bioinformatics/btp244 .
30. Rambaut A, Lam TT, Carvalho M, Pybus OG. Exploring the temporalstructure of heterochronous sequences using TempEst (formerly PathOGen).Virus Evolution. 2016;2. doi: 10.1093/ve/vew007 .
31. Drummond AJ, Ho SYW, Phillips MJ, Rambaut A. Relaxed phylogeneticsand dating with confidence. PLoS Biol. 2006;4:e88. doi:

2/20/2017 e.Proofing
http://eproofing.springer.com/journals/printpage.php?token=RSgXV2fCXDFyGotu2fvsYldgiHRUJk3z94KfxPvF4DqxOeQmwiadYw 26/27
10.1371/journal.pbio.0040088 .
32. Gray RR, Parker J, Lemey P, et al. The mode and tempo of hepatitis C virus
evolution within and among hosts. BMC Evol Biol. 2011;11:131. doi:
10.1186/1471214811131 .
33. Edwards CJ, Suchard MA, Lemey P, et al. Ancient hybridization and an Irish
origin for the modern polar bear matriline. Curr Biol. 2011;21:1251–8. doi:
10.1016/j.cub.2011.05.058 .
34. Lemey P, Rambaut A, Drummond AJ, Suchard MA. Bayesian
phylogeography finds its roots. PLoS Comput Biol. 2009;5:e1000520. doi:
10.1371/journal.pcbi.1000520 .
35. Kass RE, Raftery AE. Bayes factors. J Am Stat Assoc. 1995;90:773–95. doi:
10.1080/01621459.1995.10476572 .
36. Bielejec F, Baele G, Vrancken B, et al. SpreaD3 : interactive visualization of
spatiotemporal history and trait evolutionary processes. Mol Biol Evol. 2016.
doi: 10.1093/molbev/msw082 .
37. Minin VN, Suchard MA. Counting labeled transitions in continuoustime
Markov models of evolution. J Math Biol. 2008;56:391–412. doi:
10.1007/s0028500701208 .
38. Gower E, Estes C, Blach S, et al. Global epidemiology and genotype
distribution of the hepatitis C virus infection. J Hepatol. 2014;61:S45–57. doi:
10.1016/j.jhep.2014.07.027 .
39. Yoder AD, Yang Z. Estimation of primate speciation dates using local
molecular clocks. Mol Biol Evol. 2000;17:1081–90.
40. Drummond AJ, Suchard MA. Bayesian random local clocks, or one rate to
rule them all. BMC Biol. 2010;8:114. doi: 10.1186/174170078114 .
41. Felsenstein J. Cases in which parsimony or compatibility methods will be
positively misleading. Syst Biol. 1978;27:401–10. doi: 10.1093/sysbio/27.4.401 .

2/20/2017 e.Proofing
http://eproofing.springer.com/journals/printpage.php?token=RSgXV2fCXDFyGotu2fvsYldgiHRUJk3z94KfxPvF4DqxOeQmwiadYw 27/27
42. Worobey M, Han GZ, Rambaut A. A synchronized global sweep of theinternal genes of modern avian influenza virus. Nature. 2014;508:254–7. doi:10.1038/nature13016 .
43. Cochrane A, Searle B, Hardie A, et al. A genetic analysis of hepatitis Cvirus transmission between injection drug users. J Infect Dis. 2002;186:1212–21.doi: 10.1086/344314 .
44. Silini E, Bono F, Cividini A, et al. Molecular epidemiology of hepatitis Cvirus infection among intravenous drug users. J Hepatol. 1995;22:691–5. doi:10.1016/01688278(95)802258 .
45. Wepman D. Immigration. 2002;171.AQ12
46. Monticelli GL. Italian emigration: basic characteristic and trends withspecial reference to the last twenty years. International Migration Review.1967;1:10–24. doi: 10.2307/3002737 .
47. Cometti E. Trends in Italian Emigration. The Western Political Quarterly.1958;11:820–34. doi: 10.2307/443655 .
48. Brockmann D, Hufnagel L, Geisel T. The scaling laws of human travel.Nature. 2005;439:462–5. doi: 10.1038/nature04292 .
49. Pybus OG, Tatem AJ, Lemey P. Virus evolution and transmission in an evermore connected world. Proc Biol Sci. 2015;282:20142878. doi:10.1098/rspb.2014.2878 .
50. Jacka B, Applegate T, Poon AF, et al. Transmission of hepatitis C virusinfection among younger and older people who inject drugs in Vancouver.Canada J Hepatol. 2016;64:1247–55. doi: 10.1016/j.jhep.2016.02.031 .
51. Paolucci S, Fiorina A, Piralla R, et al. Naturally occurring mutations toHCV protease inhibitors in treatmentnaive patients. Virol J. 2012;9:245.