Spillover from FDI and market structure Reading Group in Int.l Economics

Implications of a Negative Market Spillover
Amir Fazli Michael G. Foster School of Business, University of Washington, Seattle, Washington 98195
Jeffrey D. Shulman Michael G. Foster School of Business, University of Washington, Seattle, Washington 98195
April 2016
Abstract
In recent years, several firms have decided to withdraw from profitable unhealthy good markets,
believing the move will be beneficial for their overall business. For instance, CVS dropped tobacco
products from its shelves in 2014, while Aldi dropped confectionery from its checkout lines in 2016.
Findings from consumers’ evaluation of such moves suggest there exists a negative market spillover from
selling in an unhealthy good market, such that a firm’s participation in an unhealthy good market reduces
consumers’ willingness to pay for the firm’s goods in other markets. We build an analytical model of two
competing firms to examine how firms react to a negative market spillover and find the conditions under
which different firms would exit an unhealthy good market. Our analysis of how firms’ profits are
affected by negative market spillovers identifies the consumers’ reservation value for the unhealthy good,
the size of the unhealthy good market, and the magnitude of the market spillover as key factors
determining which firms benefit from a negative market spillover. Interestingly, we find it is possible for
both firms to make more profit with a negative market spillover compared to when there is no market
spillover.
____________________________________________________________________________________
1. Introduction
In September 2014, all CVS pharmacy locations stopped selling tobacco (Martin and Esterl 2014).
While the move was estimated to cost CVS $2 billion from lost cigarette sales (Young 2014), CEO Larry
Merlo stated that removing tobacco products could benefit CVS’s overall business (Davis 2014). In

- 1 -
January 2016, Aldi announced plans to stop selling unhealthy snacks such as candy bars in their checkout
lines, while Target started testing the same policy in some of its stores in September 2015 (Trotter 2016).
Managers of these retailers and industry analysts have speculated that this move can increase profits
(Harrison 2014); Senior Vice President of Merchandising for Target, Christina Hennington, viewed the
move as “a huge business opportunity” (Stern 2015). This raises several interesting questions: when
should a firm withdraw from a profitable market and how would this decision affect competition and
profitability?
The examples of CVS, Aldi, and Target suggest that for some products, there is a negative market
spillover. In other words, by selling in markets like tobacco and unhealthy foods, a firm can damage its
ability to sell in other markets such as pharmaceuticals and groceries. Regarding CVS’s decision, many
industry experts and analysts have also viewed this move as financially beneficial for CVS; for example,
International Strategy and Investment Group has said in a message to investors “We believe the move will
be viewed as a positive long-term decision” (Wahba and Steenhuysen 2014). A comparison of CVS’s
revenue before and after the ban on tobacco shows a 9.7% increase in revenue as a result of higher
pharmacy sales after this move (Calia 2014). Based on this study, the increase in sales of pharmaceuticals
had offset the loss of cigarettes sales. A Gallup poll done on consumers’ reaction to CVS’s policy helps
explain the increase in revenue: The poll shows that 83% of consumers that stated this policy affected
their likelihood of shopping at CVS reported they would have been less likely to shop at this pharmacy if
it still sold tobacco (Dvorak and Yu 2014). The results of these consumer surveys and profit analyses,
coupled with opinions from industry experts, suggest the existence of a negative market spillover from the
tobacco market to the pharmacy market, such that selling in the tobacco market reduces consumers’
willingness to pay for goods in the pharmacy market.
Aldi and Target are not the only retailers responding to a negative market spillover effect of selling
unhealthy snacks. In Europe, major retailers such as Tesco and Lidl have removed unhealthy products
from checkout lines. Tesco, UK’s largest retailer, banned all sweets and chocolates from its checkouts in

- 2 -
2014 after a survey of its consumers showed 65% of shoppers supported the removal of confectionery
(Smithers 2014). Lidl’s decision came after a 10 week trial period, where some of its stores replaced
candy at checkout lines. The results of Lidl’s trial period suggested that despite the lost sales of
confectionery, their stores could benefit from removing these products, as sweet-selling checkouts
received 17% fewer customers and 70% of consumers stated they would pick a sweet-free checkout over
a sweet-selling one (Poulter 2014). The evidence from these surveys and trial results suggest the existence
of negative market spillover such that selling confectionery at checkout lines reduces consumers’
willingness to pay for other goods in the grocery market.
These examples raise a broader question on how companies should respond to shifts in consumer
preferences toward avoiding firms selling unhealthy goods. With consumers becoming more and more
health conscious, many are showing a willingness to avoid shopping from stores they perceive as
unhealthy (Olenski 2014). This would suggest that a negative market spillover could arise from products
beyond tobacco and unhealthy snacks. For instance, it can be expected that unhealthy products, such as
alcohol, or socially objectionable products, such as gambling, could also result in a negative market
spillover. If this trend continues, more and more firms who operate in multiple markets may need to
decide how to react to the emergence of negative market spillovers. Thus, it is important to understand the
effect such market spillovers can have on firms and their consumers.
This paper develops an analytical model to examine the implications of negative market spillovers.
We define the unhealthy good market as the market that creates the negative market spillover, and the
primary market as the market affected by the spillover, typically representing the firm’s main business.
This means the firm may profitably sell the unhealthy good (e.g. tobacco, confectionery), but at the cost
of reduced willingness to pay from consumers in its primary market (e.g. pharmaceuticals, groceries).
- 3 -
This is consistent with our findings from conjoint analyses of the effect of a firm’s participation in
unhealthy good markets.1
While we reported several firms which have exited unhealthy good markets due to this negative
market spillover, there are also several firms that continue to sell unhealthy goods, including pharmacies
such as Rite Aid that keep selling tobacco, and grocery stores such as Safeway that keep selling
confectionery at checkout lines. We aim to understand the drivers of this difference in different firms’
reaction to negative market spillovers.
We recognize that firms vary in terms of their quality in the primary market and as such the market
spillover may not have the same effect on all firms. For instance, one firm may have greater assortment or
better trained employees who offer quicker, friendlier and/or more knowledgeable service. Especially for
retailers, research shows the existence of considerable asymmetry among firms, evident from the
emergence of “dominant retailers” (Geylani et al. 2007). We incorporate this quality asymmetry in our
study to see how firms with different quality react to a negative market spillover. We refer to the firm
with the higher quality in the primary market as the superior firm and the firm with the lower quality as
the inferior firm. On the one hand, one might expect the superior firm to stay in the unhealthy good
market, since its advantage in the primary market can help buffer it from the cost of a negative market
spillover. On the other hand, one might expect the inferior firm to stay in the unhealthy good market,
since it has less to lose in the primary market. We formalize a model to resolve this issue and also
examine how a quality difference among firms in the penalized market affects firms’ profitability and
prices.
Specifically, this research addresses the following research questions:
1 A ratings-based conjoint (Schindler 2011) with 91 (101) subjects on Amazon Mechanical Turk showed consumers would pay an average of $4.41 ($0.61) less for travel immunization consulting (a healthy salad) from a pharmacy (grocery store) that sold tobacco (unhealthy snacks at checkouts). The estimates were statistically significant with 95% confidence.

- 4 -
1) When will it be optimal for the superior and/or inferior firm to withdraw from the unhealthy
good market in response to a negative market spillover?
2) How does a negative market spillover affect industry profits?
3) How do the superior and the inferior quality firms’ profits get affected differently by a
negative market spillover?
To address these research questions, we develop an analytical model of competing firms who can
choose whether or not to exit the unhealthy good market in the presence of a negative market spillover.
We consider firms that are both horizontally and vertically differentiated, model consumers with
heterogeneous taste for products in both markets, and solve for equilibrium strategies regarding selling in
the unhealthy good market in the presence of a negative market spillover.
We find that the negative market spillover can cause none, one, or both firms to exit the unhealthy
good market depending on the market conditions. We show that when the consumers’ reservation value
for the unhealthy good and the magnitude of the negative market spillover are high enough, the superior
firm will choose to withdraw from the unhealthy good market, while the inferior firm stays. Interestingly,
this result shows that although the inferior firm is losing the competition in the primary market to the
superior firm, it still prefers to sell in the unhealthy good market and incur the negative market spillover
that further weakens its position in the primary market. Also in this case, the superior firm decides to
withdraw from a profitable market to avoid the negative market spillover in competition with an inferior
firm weakened by the market spillover.
Regarding the strategic effects of a market spillover on profitability, it is not obvious how profits of
different firms will be affected, since avoiding the negative market spillover comes at the cost of losing a
profitable market. Also, participating in the unhealthy good market lowers consumers’ willingness to pay
in the firm’s primary market. Thus, it may appear that the emergence of negative market spillover should
always hurt firms’ profits. However, we identify conditions for which the negative market spillover hurts
both firms, hurts only one firm, or even allows both firms to make more profit than they would have made

- 5 -
without the market spillover due to strategic forces. Based on our findings, a negative market spillover is
not necessarily bad for participating firms, and managers may actually find it beneficial to encourage a
negative market spillover in a competitive setting.
Surprisingly, the inferior firm can even earn a higher profit than the superior firm due to the market
spillover, despite having no advantages in its offerings. This result occurs when the market spillover is
not too large relative to the reservation value a product in the unhealthy good market provides to
consumers. The model identifies the strategic mechanism behind this counterintuitive result. Our findings
help managers assess how much a negative market spillover benefits their firm based on its relative
quality compared to the competition.
The rest of this paper is organized in the following order. In §2, we relate our paper to the existing
literature. Section 3 presents the model setup and in §4 we analyze the model to present the results.
Finally, the results are discussed in §5.
2. Previous Literature
Our research considers firms selling in two distinct markets and examines their reaction to a negative
market spillover. There are two bodies of literature most closely related. Previous research has considered
competition among multiproduct firms, typically offering products with some level of substitutability.
Previous research has also considered multimarket competition, where firms face the same competitors in
separate markets. In this section, we describe how our paper contributes to each of these literatures.
First, we review related research on multiproduct firms. Margolis (1989) considers consumers of
firms that sell more than one product and argues for the existence of cross-product effects, such that a
firm’s promotional efforts for one product affects the values consumers place on the firm’s other
products. Anderson and de Palma (1992) use a nested logit model of demand to capture competition
among firms over the range of products produced. They show that in equilibrium, compared to socially
optimum levels, the market will include too many firms, each offering too few products. Cachon et al.
(2008) adds the assumption of costly product evaluations across firms and shows that it could lead to
- 6 -
more product variety. Kuksov and Villas-Boas (2010) consider within-firm evaluation costs and show
that monopolists offering too many products can cause consumers to avoid purchasing altogether. Liu and
Dukes (2013) study competing multi-product firms in the presence of evaluation costs across-firms and
within-firms. They show that less differentiation among firms can increase product variety offered by
each firm, which contrasts with the result from our setting that as vertical differentiation between
competing firms decreases, the range of market spillovers for which both firms participate in more than
one market expands. Grossmann (2005) builds an oligopoly model of multi-product firms and shows that
in equilibrium higher quality firms have larger product ranges. Our paper differs from previous multi-
product literature in both its model and its results. Unlike most previous multi-product models, which
assume substitutability among products of a firm such that one product’s price and quality affects the
other products’ demand, our model of a negative market spillover does not require the products from the
different markets to have any degree of substitutability. In other words, the mere existence of the
unhealthy good among a firm’s products is what causes the spillover to other products, and this spillover
does not depend on the price or quality of the unhealthy good. Our model also produces unique results
that differ from previous findings. For instance, we find that the higher quality firm will actually offer
fewer products by withdrawing from the unhealthy good market, unlike what Grossmann (2005) suggests.
Next, we describe related papers examining multimarket competition among firms. Multimarket
competition occurs when the same firms compete against each other in more than one market (Karnani
and Wernerfelt 1985). The extent of overlap between two firms is represented by their multimarket
contact which is defined as the aggregation of all contacts between the two firms in all markets (Gimeno
and Woo 1996). Multimarket competition has been widely studied by researchers across many fields (Yu
and Cannella 2013), and empirically examined in many industries such as the airline industry (Gimeno
1994), the telephone industry (Parker and Roller 1997), and the banking industry (Heggestad and Rhoades
1978).

- 7 -
Previous literature on multimarket competition has identified mutual forbearance as a form of tacit
collusion among firms involved in multimarket competition that causes firms to decrease competitive
attacks against each other because they fear that an attack in one market may be countered in another
market (Edwards 1955). Bernheim and Whinston (1990) offer a model of multimarket competition
showing that as long as the markets and the firms are considered to be identical, mutual forbearance will
not happen. However, if the firms are allowed to have competitive advantages in heterogeneous markets,
collusive agreements to avoid competition can be beneficial to both firms. Subsequent research shows
mutual forbearance requires observability of firm actions (Thomas and Willig 2006) and coordination
mechanisms (Jayachandran et al. 1999). Our research similarly finds that avoiding competition can be
beneficial to firms in multimarket competition, but interestingly we find that this may arise as an
unintended consequence of the market spillover and in the absence of collusive agreements. We also
show that asymmetry between firms is not a necessary condition for this benefit.
The multimarket competition literature has also studied the decisions of the competing firms
regarding exiting or entering certain markets and how these decisions affect competition. Baum and Korn
(1999) suggest that entry decisions in multimarket competition follow an inverted U-shaped curve in
relation to multimarket contact. Stephan et al. (2003) empirically support these theories using hospital
data, showing firms as less likely to exit a market when their multimarket competitors exist in that
market. Cai and Raju (2015) show that multimarket competition can cause competing firms to form
alliances when entering a new market to benefit from each other’s investment in the new market.
In summary, the literature on rivalry in multimarket competition suggests that mutual forbearance
decreases competitive intensity and increases prices. The findings from this literature are similar to our
results in that both predict competition can be dampened. However, the nature of this decrease is different
in our research. Mutual forbearance is a form of collusive agreement between the firms, and its existence
relies on such necessary conditions as observability of actions and coordination. But we find negative
market spillovers can dampen competition not through agreements, but by affecting the consumers’

- 8 -
willingness to pay for firms that participate in certain markets. From a modeling standpoint, the model for
mutual forbearance relies on repeated games and future profits, while our model works independent of
future periods.
3. Model
We consider a model where two firms, A and B, may compete in a primary market and an unhealthy good
market. We consider a situation in which the firms have an established presence in each market but may
react to the market spillover by costlessly exiting either market. Each firm can decide to continue
participating in the unhealthy good market, but selling in this market comes at the cost of a negative
market spillover to the primary market: A consumer’s valuation of a product in the primary market is
reduced by c when buying from a firm that also operates in the unhealthy good market. This assumption
is consistent with the anecdotal evidence from the cases of CVS, Aldi’s and Lidl’s. To further validate
this assumption, we also ran two ratings-based conjoint studies on Amazon Mechanical Turk that showed
participants had a lower willingness to pay for travel immunizations (a salad bar) at a pharmacy (grocery
store) that sold tobacco (unhealthy snacks at checkout). Procedure details and analysis are presented in the
Appendix.
Each market is represented with a Hotelling model, with the two firms located at opposite ends of the
unit lines. In the interest of parsimony, we assume sources of quality advantage can have high impact on
the firm’s primary market, while having no influence on its unhealthy good market. For instance, CVS is
creating a competitive advantage in health service by expanding its accessible clinical services and
providing unique health related loyalty programs such as the ExtraCare program (Schmalbruch 2015),
which have little impact on the value of tobacco products sold at CVS. As such, we allow the two firms to
offer products in the primary market with reservation values, denoted by Av for firm A and Bv for firm
- 9 -
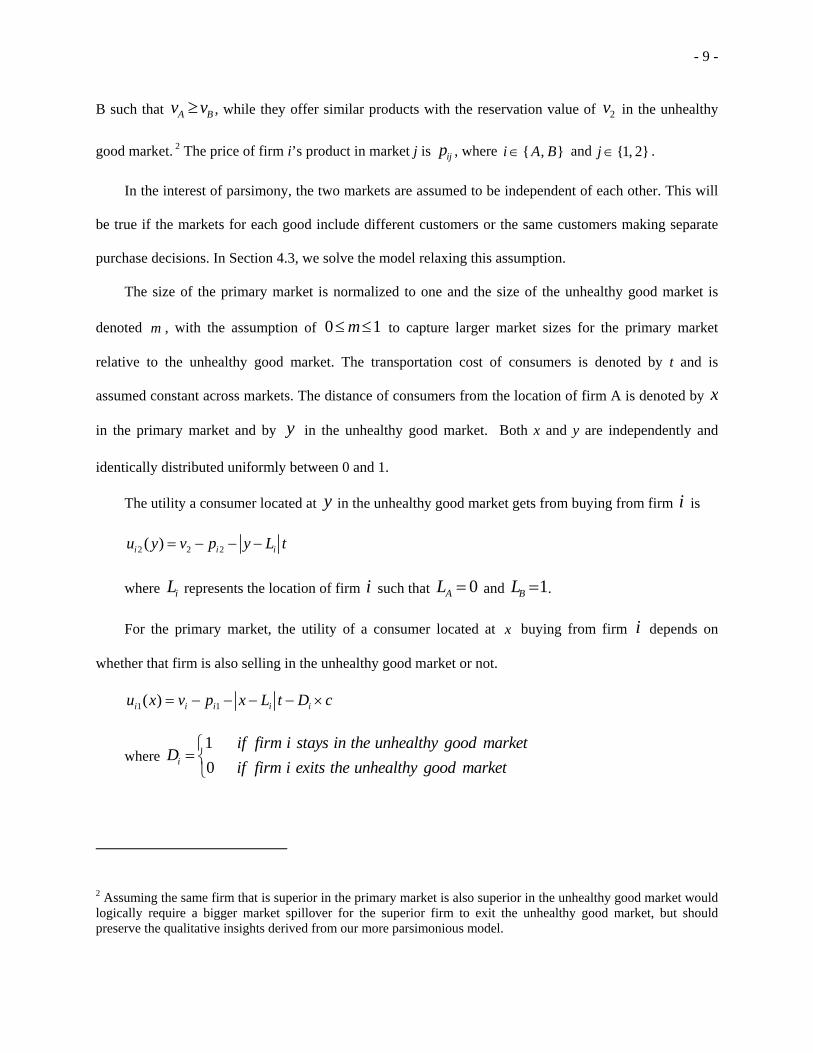
B such that A Bv v , while they offer similar products with the reservation value of 2v in the unhealthy
good market. 2 The price of firm i’s product in market j is ijp , where { , }i A B and {1, 2}j .
In the interest of parsimony, the two markets are assumed to be independent of each other. This will
be true if the markets for each good include different customers or the same customers making separate
purchase decisions. In Section 4.3, we solve the model relaxing this assumption.
The size of the primary market is normalized to one and the size of the unhealthy good market is
denoted m , with the assumption of 0 1m to capture larger market sizes for the primary market
relative to the unhealthy good market. The transportation cost of consumers is denoted by t and is
assumed constant across markets. The distance of consumers from the location of firm A is denoted by x
in the primary market and by y in the unhealthy good market. Both x and y are independently and
identically distributed uniformly between 0 and 1.
The utility a consumer located at y in the unhealthy good market gets from buying from firm i is
2 2 2( )i i iu y v p y L t
where iL represents the location of firm i such that 0AL and 1BL .
For the primary market, the utility of a consumer located at x buying from firm i depends on
whether that firm is also selling in the unhealthy good market or not.
1 1( )i i i i iu x v p x L t D c
where 1
0i
if firm i stays in the unhealthy good marketD
if firm i exits the unhealthy good market
2 Assuming the same firm that is superior in the primary market is also superior in the unhealthy good market would logically require a bigger market spillover for the superior firm to exit the unhealthy good market, but should preserve the qualitative insights derived from our more parsimonious model.

- 10 -
Each firm’s objective is to maximize the sum of its profits from the two markets. The marginal cost
of production is assumed zero for both firms in both markets. The firms’ profit in each market equals the
number of goods sold multiplied the price charged for each.
The game has three stages. In stage 1, each firm decides whether to exit the unhealthy good market.
In stage 2, market participation is common knowledge and the firms simultaneously set their prices for
their products in the markets in which they operate. In stage 3, consumers in each market decide from
which firm to buy, maximizing their utility. Consumers in stage 3 are assumed to be fully informed about
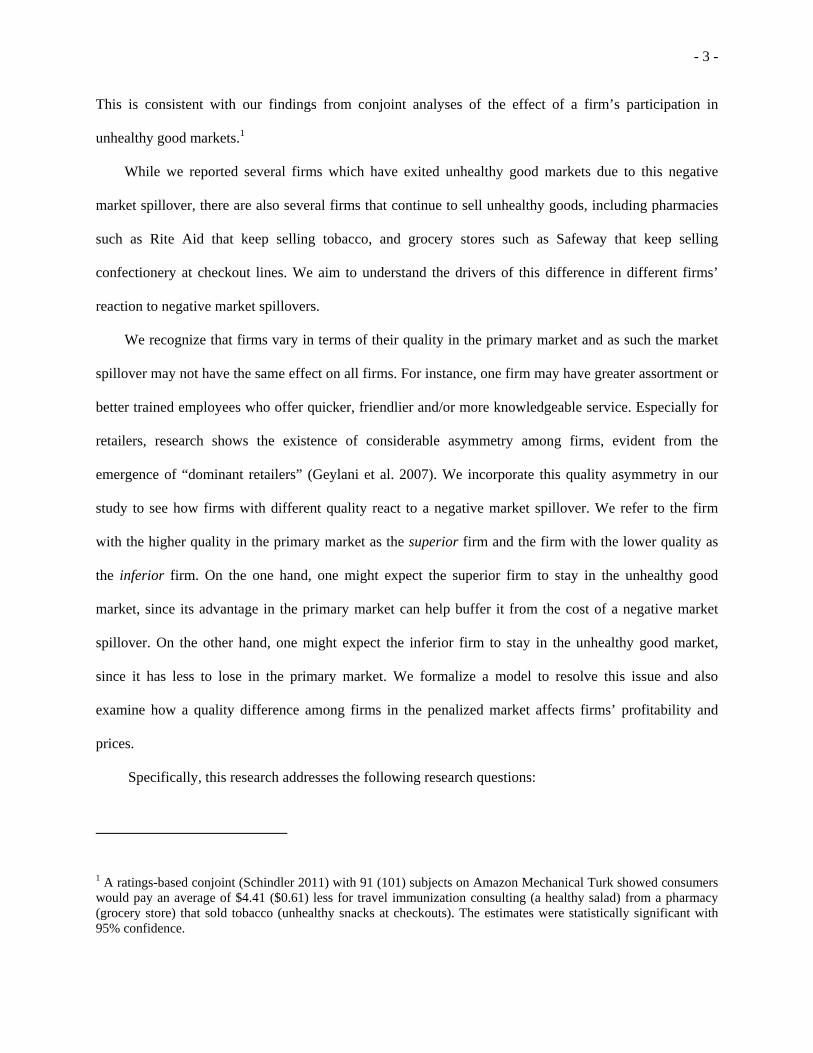
the firms’ decisions in stages 1 and 2. The timing of the model and decisions of players at each stage are
shown in figure 1. Table 1 summarizes the notations used in the model.
Table 1. Summary of Notations. Notation Definition
Firm A Superior firm Firm B Inferior firm Market 1 Primary market Market 2 Unhealthy good market c Negative Market spillover
ijp Price chosen by firm i in market j
ijq Quantity sold by firm i in market j
i Total profit of firm i
Av Consumer reservation value for firm A’s primary good
Bv Consumer reservation value for firm B’s primary good
2v Consumer reservation value for unhealthy good
m Size of the unhealthy good market t Consumers’ per unit transportation cost x Consumer’s location in the primary market y Consumer’s location in the unhealthy good market
Figure 1. The Timeline of the Model
Consumers Choose Products
Firms Set Prices
Firms Decide Market Participation
Stage 1 Stage 2 Stage 3

- 11 -
4. Analysis
In this section, we present the results of the model. We begin by finding the equilibrium strategies chosen
by asymmetric firms in the presence of a market spillover. In section 4.2, we analyze the effect of market
spillovers on firms’ profits. We compare firm profitability in the presence of a negative market spillover
to firm profitability in the absence of market spillovers. We also demonstrate how the results persist with
symmetric firms. In section 4.3, we present and analyze a model extension allowing for dependency in
demand across markets.
4.1. Equilibrium Strategies with a Negative Market Spillover
In this section, we study how firms with different levels of quality respond to market spillovers in order to
find which of the two firms, if any, stay in the unhealthy good market with the emergence of a market
spillover. We assume the quality advantage to be small enough such that there could still be a portion of
consumers in the primary market who prefer to buy from the inferior firm; 3A Bv v t .
This model has four subgames: (1) both firms sell the unhealthy good (2) only the superior firm (firm
A) sells the unhealthy good, (3) only the inferior firm (firm B) sells the unhealthy good, and (4) neither
firm sells the unhealthy good. We examine each of them below.
Both firms sell the unhealthy good. The marginal consumer in the unhealthy good market, who is
indifferent between buying from each of the two firms, is located at *y such that
* *2 2 2 2(1 )A Bv y t p v y t p . Similarly in the primary market the marginal consumer’s location
can be found at *x such that * *1 1(1 )A A B Bv x t p c v x t p c .
*2 2
*1 1
( ) / 2
( ) / 2
B A
A B B A
y p p t t
x v v p p t t
(1)

- 12 -
Given the size of the unhealthy good market is denoted by m, firm A maximizes the sum of its
profits, * *1 2A Ax p m y p , with respect to 1Ap and 2Ap , while firm B maximizes its profit,
* *1 2(1 ) (1 )B Bx p m y p , with respect to 1Bp and 2Bp , where *x and
*y are defined in equation (1).
Solving the first order conditions, we find the two firms set equal prices in the unhealthy good
market and equally share that market; 2 2SS SSA Bp p t , where the superscript SS denotes the subgame
equilibrium when both firms sell the unhealthy good. These prices will cover the whole unhealthy good
market if 2 3 / 2v t . Otherwise, for lower 2v , the marginal consumer gets negative utility at these prices
and the corresponding equilibrium prices and profits are presented in the appendix. In the primary market,
firm A chooses 1 ( ) / 3SSA A Bp v v t , and firm B chooses 1 ( ) / 3SS
B B Ap v v t . The equilibrium
profits in this subgame are
2
2
(( ) / 3 ) / 2 / 2
(( ) / 3 ) / 2 / 2
SSA A B
SSB B A
v v t t mt
v v t t mt
(2)
Neither firm sells the unhealthy good. Firm A maximizes *1Ax p with respect to 1Ap while firm B
maximizes *1(1 ) Bx p with respect to 1Bp , where *x is as defined in equation (1). The subgame
equilibrium prices are 1 ( ) / 3NNA A Bp v v t and 1 ( ) / 3NN
B B Ap v v t , where the NN superscript
denotes both firms not selling the unhealthy good. Subgame equilibrium profits are
2
2
(( ) / 3 ) / 2
(( ) / 3 ) / 2
NNA A B
NNB B A
v v t t
v v t t
(3)
Only firm B sells the unhealthy good. Since the market demands are assumed independent of one
another (an assumption relaxed in the extension of Section 4.3), we may separately analyze firm B’s
pricing decision in the unhealthy good market from the primary market. Consumers for whom
*2 2(1 ) 0Bv y t p will buy the unhealthy good from firm B and the remaining consumers in the

- 13 -
unhealthy good market will abstain from purchase. Thus, firm B chooses 2Bp to maximize
*2(1 ) Bm y p subject to the constraint that * 1y where *
2 21 ( ) /By v p t . Solving the KKT
conditions, firm B will choose 2 2 / 2NSBp v if 2 2v t , and 2 2
NSBp v t otherwise. The latter implies
that the unhealthy good market is fully covered. In the interest of parsimony, we assume high enough
transportation costs such that one firm alone cannot sell to the whole unhealthy good market, and make
assumption 2 2v t from here on.
In the primary market, the marginal consumer’s location can be found at *x such that
* *1 1(1 )A A B Bv x t p v x t p c .
*1 1( ) / 2A B B Ax v v p p c t t (4)
Using equation (4), firm A chooses 1Ap to maximize *1Ax p , while firm B chooses 1Bp to
maximize *1(1 ) Bx p . Taking the first order conditions we find that for 3 ( )A Bc t v v there is an
interior solution and both firms still sell in the primary market, but for 3 ( )A Bc t v v a corner
solution is reached and firm B effectively exits the primary market. For 3 ( )A Bc t v v , the primary
market prices of the firms are 1 ( ) / 3NSlowcA A Bp v v c t and 1 ( ) / 3NSlowc
B B Ap v v c t . The
corresponding total profits are
2
2 22
(( ) / 3 ) / 2
(( ) / 3 ) / 2 / 4
NSlowcA A B
NSlowcB B A
v v c t t
v v c t t mv t
(5)
For 3 ( )A Bc t v v , firm A sells exclusively to the primary market, setting the price at
1NShighcA A Bp v v c t . The corresponding total profits are
22 / 4
NShighcA A B
NShighcB
v v c t
mv t
(6)

- 14 -
Only firm A sells the unhealthy good. We may again examine these two markets independently. As
before, the only firm selling the unhealthy good (firm A in this case) will choose 2 2 / 2SNAp v . In the
primary market, the marginal consumer’s location can be found at *x such that
* *1 1(1 )A A B Bv x t p c v x t p .
Similar to the findings for the previous subgame, for 3 ( )A Bc t v v there exists an interior
solution and both firms still sell in the primary market, but for 3 ( )A Bc t v v there is a corner
solution in which firm A exits the primary market. For 3 ( )A Bc t v v , the primary market prices are
1 ( ) / 3SNlowcA A Bp v v c t and 1 ( ) / 3SNlowc
B B Ap v v c t . The corresponding total profits are
2 2
2
2
(( ) / 3 ) / 2 / 4
(( ) / 3 ) / 2
SNlowcA A B
SNlowcB B A
v v c t t mv t
v v c t t
(7)
For 3 ( )A Bc t v v , firm B sells exclusively to the primary market at 1B B Ap v v c t and
the corresponding total profits are as follows.
2
2 / 4SNhighcA
SNhighcB B A
mv t
v v c t
(8)
Examining the profits of the two firms in each subgame solution (see equations (2)-(8)), we solve the
game and find the equilibrium unhealthy good market participation of each firm. The proofs of all
lemmas and propositions are presented in the appendix.
LEMMA 1. A market spillover affects unhealthy good market participation as follows:
(a) When the market spillover is sufficiently large, it reduces participation of firms in the
unhealthy good market (i.e., . . { , }c s t c c sell sell is not an equilibrium).
- 15 -
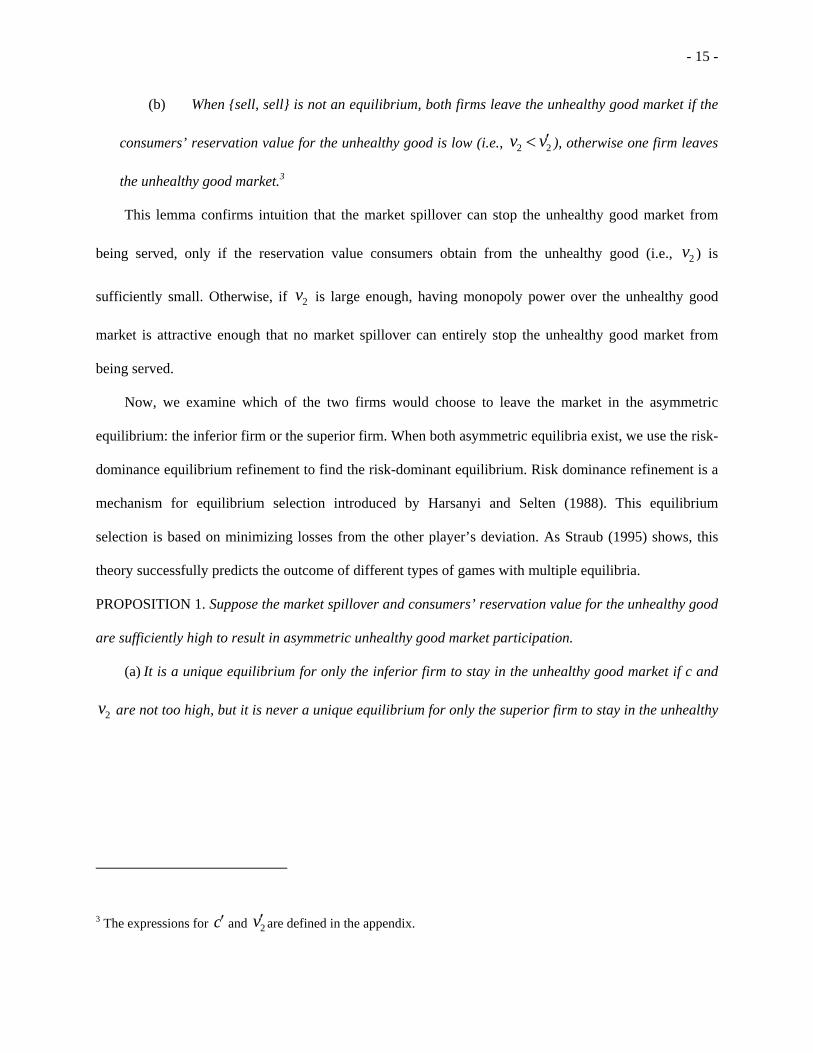
(b) When {sell, sell} is not an equilibrium, both firms leave the unhealthy good market if the
consumers’ reservation value for the unhealthy good is low (i.e., 2 2v v ), otherwise one firm leaves
the unhealthy good market.3
This lemma confirms intuition that the market spillover can stop the unhealthy good market from
being served, only if the reservation value consumers obtain from the unhealthy good (i.e., 2v ) is
sufficiently small. Otherwise, if 2v is large enough, having monopoly power over the unhealthy good
market is attractive enough that no market spillover can entirely stop the unhealthy good market from
being served.
Now, we examine which of the two firms would choose to leave the market in the asymmetric
equilibrium: the inferior firm or the superior firm. When both asymmetric equilibria exist, we use the risk-
dominance equilibrium refinement to find the risk-dominant equilibrium. Risk dominance refinement is a
mechanism for equilibrium selection introduced by Harsanyi and Selten (1988). This equilibrium
selection is based on minimizing losses from the other player’s deviation. As Straub (1995) shows, this
theory successfully predicts the outcome of different types of games with multiple equilibria.
PROPOSITION 1. Suppose the market spillover and consumers’ reservation value for the unhealthy good
are sufficiently high to result in asymmetric unhealthy good market participation.
(a) It is a unique equilibrium for only the inferior firm to stay in the unhealthy good market if c and
2v are not too high, but it is never a unique equilibrium for only the superior firm to stay in the unhealthy
3 The expressions for c and 2v are defined in the appendix.

- 16 -
good market (i.e., 2 2 2 2. . { , }c and v s t forc c c and v v v not sell sell is the unique
equilibrium). 4
(b) The risk-dominant equilibrium involves only the inferior firm staying in the unhealthy good
market when both asymmetric equilibria exist (i.e., only the inferior firm stays in the unhealthy good
market in the risk-dominant equilibrium if 2 2c c and v v ).
Proposition 1 provides insight into which firm will react to the market spillover by withdrawing from
the unhealthy good market. For moderate market spillovers and moderate reservation values in the
unhealthy good market, the unique equilibrium calls for only the inferior firm staying in the unhealthy
good market, with the superior firm withdrawing. For larger market spillovers and reservation values,
either asymmetric equilibrium is possible, but only the inferior firm staying in the unhealthy good market
is the risk-dominant equilibrium.
The intuition for why the inferior firm will be the only firm selling in the unhealthy good market is
that the inferior firm has less profit to lose in the primary market from the market spillover. If the
potential profit of the unhealthy good market is high enough, it exceeds the loss incurred in the primary
market. The superior firm experiences higher losses in the primary market from the market spillover and
thus is more inclined to exit the unhealthy good market. This amplifies the inferior firm’s incentive to stay
in the unhealthy good market because this firm gains monopoly power over the unhealthy good market.
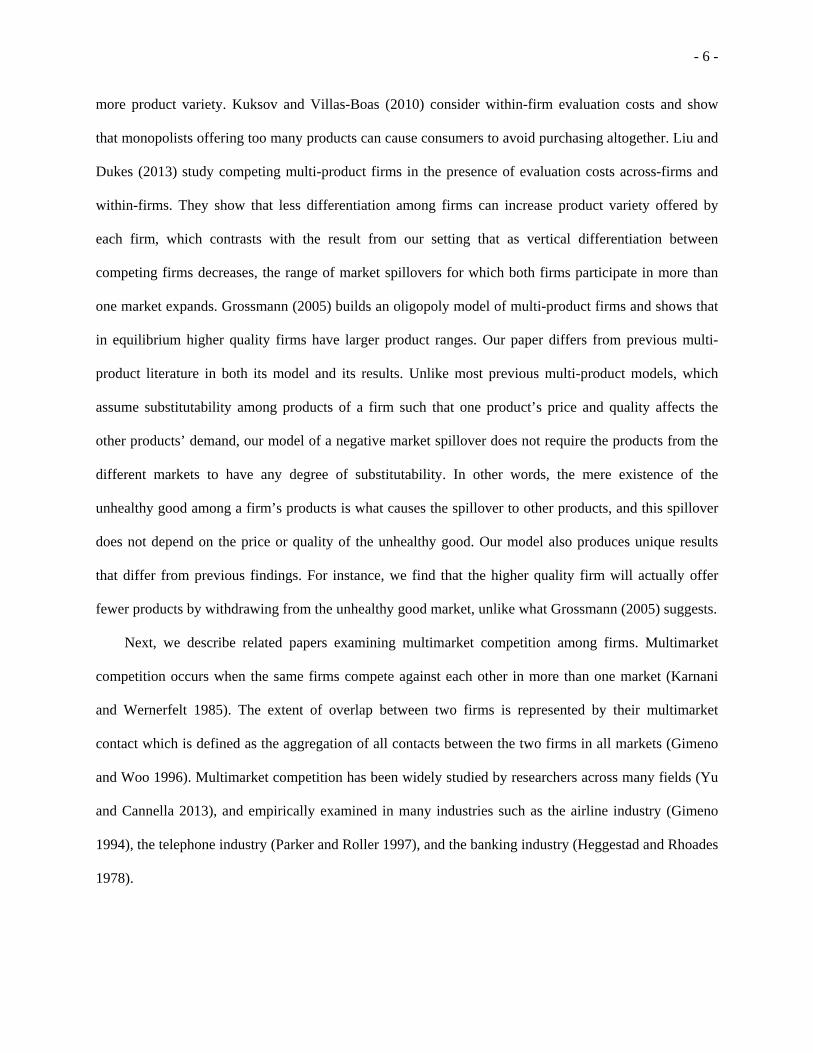
The predictions of the model are depicted in Figure 2. The figure illustrates when both firms will opt
to sell in the unhealthy good market, when both firms will opt not to sell in the unhealthy good market,
and when only one firm will stay in the unhealthy good market. In the area northwest of the O y curve,
there exists an equilibrium where neither firm sells in the unhealthy good market. In the area constrained
4 The expressions for c and 2v are from Lemma 1. The expressions for cand 2vare defined in the appendix,
where we also prove that c c and 2 2v v .

- 17 -
below the Ox curve, both firms sell in the unhealthy good market. The area northeast of xOy ,
representing high enough market spillovers and reservation values for the unhealthy good, is where the
equilibrium with only the inferior firm selling the unhealthy good exists. Finally, in the area northeast of
'z 'x y there also exists an equilibrium where the superior firm is the only one staying in the unhealthy
good market. This last equilibrium is never unique, and is risk-dominated by the equilibrium with the
inferior firm staying in the unhealthy good market. Figure 2 is generated for 1m , which means the two
markets have equal size. As m decreases and the unhealthy good market becomes smaller relative to the
primary market, the Ox curve shifts down and the O y curve shifts to the right, expanding the region
where neither firm sells in the unhealthy good market and shrinking the region where both firms sell in
the unhealthy good market.
Figure 2. Equilibrium Strategies of {Superior, Inferior} Firms Selling the Unhealthy Good
(WLOG, parameter values 1A B
v v , 1m , and 1t used for generating figure)
As we summarized the firms’ equilibrium response to a negative market spillover, our next question
is how the negative market spillover will affect firm profitability.
4.2. Firm Profitability under a Negative Market Spillover
In this section we study how the market spillover affects firm profitability. This analysis provides insights
on whether or not firms and the industry as a whole are hurt by the emergence of a negative market
O

- 18 -
spillover. We start by comparing equilibrium profits made by the firms under a negative market spillover
with the profits they would have made in the absence of any market spillover. In the main text, we focus
on the interior solutions in which both firms still sell in the primary market in the {not sell, sell}
equilibrium and their profits are represented by equation 5. The conditions for the corner solutions in
which the inferior firm exits the primary market in the {not sell, sell} equilibrium, with profits
represented by equation 6, provide similar insights and are presented in the appendix.
PROPOSITION 2. Suppose c c such that the negative market spillover affects market participation.
Defining 2 22
2 2ˆ { 9 6 2 ( ), (6 2( ))}
3 3A B A Bv Min mt ct c c v v t c t c v v
m m 5, then:,
(a) If the consumers’ reservation value for the unhealthy good and the size of the unhealthy good
market are sufficiently high (i.e., 2 2ˆv v and 2
(6 2( ) )
9A Bc t v v c
mt
), both firms make more
profit in the presence of a market spillover compared to when there is no market spillover.
(b) When only the inferior firm participates in the unhealthy good market, if the consumers’
reservation value for the unhealthy good or the size of the unhealthy good market is sufficiently
low, (i.e., 2 2 2ˆv v v or 2
(6 2( ) )
9A Bc t v v c
mt
), the inferior firm makes less profit (and the
superior firm makes greater profit) in the presence of a negative market spillover compared to
when there is no market spillover.
(c) If neither firm participates in the unhealthy good market (i.e., 2 2v v ), then both firms make
less profit in the presence of a negative market spillover compared to when there is no market
spillover.
5 Note that 2v̂ always has real values for 3 ( )A Bc t v v , which is assumed for the interior solution of the {not
sell, sell} equilibrium. The conditions on 2v for the corner solution, where 3 ( )A Bc t v v , are presented in the
appendix.

- 19 -
This proposition shows conditions such that each firm could make more or less profit as a result of
the negative market spillover. In fact, consumers’ reservation value for the unhealthy good and the size of
the unhealthy good market are critical factors in determining how the profits of the firms will be affected
by the negative market spillover. Figure 3 demonstrates the findings of proposition 2. The area northeast
of the zwx curve shows the region described in proposition 2(a), in which both firms benefit from the
emergence of a market spillover. The area bounded by the yOwz curve shows the region for proposition
2(b), in which only the superior firm benefits from a market spillover. Finally, the area northwest of the
O y curve shows the region described in proposition 2(c), in which both firms become worse off with the
market spillover.
Figure 3. The Effect of a Negative Market Spillover on Equilibrium Profits For the {Superior, Inferior} Firms
(WLOG, parameter values 1A B
v v , 1m , and 1t used for generating figure)
Proposition 2 shows the market spillover can function as a competition dampening mechanism,
resulting in firms becoming better off as a result of the negative spillover. Interestingly, in the {not sell,
sell} equilibrium, the superior firm always earns greater profit than without a market spillover even
though it loses sales in the unhealthy good market as it exits from that market. Due to the inferior firm’s
participation in the unhealthy good market, the inferior firm’s value in the primary market lowers and the
superior firm gains an even greater advantage in the primary market. Thus, the superior firm gets a bigger

- 20 -
portion of the primary market in comparison to when there was no negative market spillover and this
increased profit outweighs the loss associated with exiting the unhealthy good market.
Surprisingly, the inferior firm can also earn greater profit than without a market spillover when 2v
and m are high enough, even though it incurs a reservation value reduction in its primary market due to
the spillover. The intuition for the market spillover leaving both firms better off is as follows. The inferior
firm gets the unhealthy good market to itself due to the competitor choosing to respond to the spillover by
exiting the unhealthy good market. Earning monopoly profit in the unhealthy good market can offset the
diminished profitability in the primary market, but only if the consumers’ reservation value for the
unhealthy good and the size of the unhealthy good market are high enough.
Finally, proposition 2 shows when 2v is low enough such that both firms exit the unhealthy good
market, both firms make less profit as a result of the market spillover. This result was expected, as the
market spillover causes both firms to lose a profitable unhealthy good market while gaining no additional
advantage over the competition in the primary market.
The fact that the negative market spillover can increase the profits of all firms in the industry can be
considered the opposite of what would be intuitively expected from a negative spillover effect. Though
consumers may avoid buying primary goods from sellers of unhealthy goods with the possible intention
of punishing them, this avoidance can have the reverse effect and increase the profit of the unhealthy
good seller. On the other hand, the firm that exits the unhealthy good market can get rewarded with more
profit despite entirely losing a market. Therefore, industries in which a negative market spillover emerges
could become better off as a whole.
Next, we compare the profits of the two firms in the existence of the market spillover to find which
of the two firms can benefit more from a negative market spillover.

- 21 -
PROPOSITION 3. When only the inferior firm stays in the unhealthy good market, for a low negative
market spillover (i.e., 3 / 2 ( )A Bc mt v v ) and a high reservation value for the unhealthy good (i.e.,
2 2 2 / (3 ) ( )A Bv t m c v v ), the inferior firm’s profit is higher than the superior firm’s profit.
This result shows the firm that is inferior in the primary market may actually earn greater profit than
the superior firm. Although the market spillover imposes identical penalties on both firms and both firms
face the same set of choices, the inferior firm benefits more from the market spillover even in cases where
it is the only firm directly penalized by it. This effect takes place in the equilibrium where only the
inferior firm stays in the unhealthy good market. This result is especially interesting because it holds for
high 2v , meaning even when the unhealthy good market becomes highly lucrative for the inferior firm,
the superior firm may still prefer to exit that market, leaving all the profits to the inferior firm. There are
two interesting implications of this finding. First, if quality decisions are fixed prior to the emergence of
the market spillover, a market spillover can actually reverse the advantage held by the superior firm.
Second, if future market spillovers are predicted prior to quality investment decisions, it may cause
diminished quality investment in the primary market since a quality advantage will actually reduce
profitability by diminishing the marginal incentive to participate in a lucrative unhealthy good market.
To understand this result, first consider the market outcome. In equilibrium, the firm that is inferior
in the primary market loses a competitor in the unhealthy good market, while it may or may not stay in
the primary market depending on the magnitude of the market spillover. Though this turns out to be quite
lucrative for the inferior firm, this strategy cannot be profitably replicated by the superior firm. Foremost,
since the superior firm serves a greater number of consumers in the primary market, it has much to lose in
the primary market by staying in the unhealthy good market. Secondly, the superior firm, on the margin,
has less to gain from staying in the unhealthy good market because it can at best share the market with its
competitor, which makes deviation to selling the unhealthy good not profitable for the superior firm even
for high 2v . Thus, the superior firm’s advantage in the primary market actually serves as a disadvantage

- 22 -
with a negative market spillover because, on the margin, it prevents the firm from participating in the
profitable unhealthy good market.
The results presented so far have analyzed a vertically differentiated competition with one superior
and one inferior firm. Next, we study symmetric firms to see the extent to which our findings rely upon
quality asymmetry.
COROLLARY 1. Suppose the firms are vertically undifferentiated such that A Bv v . For high enough
market spillover and consumers’ reservation value for the unhealthy good, one firm sells in the unhealthy
good market in equilibrium while the other firm exits the market.
Corollary 1 shows that the existence of asymmetric equilibria, where only one firm exits the
unhealthy good market, is not driven by vertical asymmetry between the firms. Instead, the driver of
asymmetric strategies by firms is competition among firms which causes staying in the unhealthy good
market to be highly profitable when the other firm has exited the market, and also causes exiting the
unhealthy good market to be a profitable move for one firm due to the negative market spillover.
Therefore, even when both firms have the same quality in both markets, it is possible for the firms to
choose different strategies with respect to selling in the unhealthy good market. Either firm may choose to
exit the unhealthy good market and thus there exists two asymmetric equilibria for high enough 2v and c.
As quality asymmetry, A Bv v , decreases, the regions in Figure 2 for both symmetric equilibria, {sell,
sell} and {not sell, not sell}, expand and the asymmetric equilibrium region shrinks. However, as
Corollary 1 shows, the asymmetric equilibrium region depicted in Figure 2 never disappears even as
A Bv v approaches zero.
COROLLARY 2. Suppose the firms are vertically undifferentiated such that A Bv v . In an asymmetric
equilibrium, for high enough consumers’ reservation value for the unhealthy good and high enough size
of the unhealthy good market, both firms make more profit in the presence of a negative market spillover
compared to when there is no market spillover.

- 23 -
With regard to firms’ profits, Corollary 2 shows that the findings of Proposition 2, which shows
firms can both be better off as a result of a negative market spillover, are preserved with the assumption
of symmetric firms. In fact, what drives the increase in both firms’ profit is the competition dampening
effect of a market spillover, not vertical differentiation among firms. As argued in Corollary 1, even
symmetric firms can choose asymmetric strategies in equilibrium. Once this equilibrium occurs, each firm
will receive high profits from one market, while allowing the other firm to dominate the other market.
This in turn can greatly reduce competition intensity in the primary market for high enough market
spillovers and create a lucrative monopoly in the unhealthy good market for high enough 2v and m ,
thereby increasing both firms’ profits. Thus, while firms may have symmetric quality, they can still gain a
competitive advantage in different markets due to the market spillover.
The results summarized in Propositions 1-3 have been established in a parsimonious model in which
the primary and unhealthy good markets are independent of one another. Such a model fits well in
instances for which the customers in each market are drawn from distinct populations or if the customers
make separate purchase decisions across markets. We recognize, however, that certain markets may be
complementary in the sense that a consumer can save a store trip by purchasing both a primary and an
unhealthy good during a single purchase occasion. The following extension explores such a possibility.
4.3. A Model of Dependency across Primary and Unhealthy Good Markets
In this section, we examine an extension in which we relax the assumption that the primary and unhealthy
good markets are independent of one another. We first describe the difference in assumptions. We then
outline how the analysis changes with these assumptions and summarize the impact of the assumptions on
the results.
In this model, there is a single population of consumers whose locations are uniformly distributed on
the unit line. The firms are again located at 0AL and 1BL . A consumer’s choice set includes
whether or not to buy for each product (i.e., primary and unhealthy) and from which firm to buy each
product. Whereas the main model considered the primary market serving different consumers than the

- 24 -
unhealthy good market, this extension allows consumers to visit one firm (incurring a single
transportation cost) or visit both firms (incurring a transportation cost for each visit).
The utility of the consumer located at x buying the primary good from firm i and the unhealthy
good from firm k depends on whether firm i sells the unhealthy good, as shown below:
1 2 2( ) (9)ik i i i i k ik ku x v p x L t D c v p Z x L t
where 1
0ik
if i kZ
if i k
and 1
0i
if firm i stays in the unhealthy good marketD
if firm i exits the unhealthy good market
A consumer’s outside option of not buying either product is assumed to be zero.
As in the main model, the utility maximizing behavior depends on the participation in the unhealthy
good market by the superior and inferior firm. Consider first the case in which the inferior firm stays in
the unhealthy good market and the superior firm exits the market. A similar process is followed for the
remaining subcases.
Let x be defined such that the utility of buying the primary good from firm A is equal to the utility
of buying the primary good from firm A and the unhealthy good from firm B:
1 1 2 2 (1 )A A A A Bv p x t v p x t v p x t . Let x be defined such that the utility of buying the
primary good from firm A is equal to the utility of buying both the primary and unhealthy goods from
firm B: 1 1 2 2 (1 )A A B B Bv p x t v p v p x t c . Finally, let x be defined such that the utility
of buying the primary good from firm A and the unhealthy good from firm B is equal to the utility of
buying both the primary and unhealthy goods from firm B: 1 2 2 (1 )A A Bv p x t v p x t
1 2 2 (1 )B B Bv p v p x t c .
Comparing these locations, simple algebra shows that if and only if
1 1 2 2A B B A Bc p p p t v v v then x x x ; otherwise x x x . The former implies
that there are some customers who buy from both firms and the latter implies all consumers buy from at

- 25 -
most one firm. These two possibilities are depicted in Figure 4a and 4b. Letting ilq denote the quantity of
product l sold by firm i, 1 1 2 2A B B A Bc p p p t v v v implies 1 ( ) /A BA A Bc p p vq tx v ,
1 1Bq x , and 2 22 (1 ) ( ) /B Bvq x p t . If 1 1 2 2A B B A Bc p p p t v v v , then
2 21 ( ) / (2 )A B B BA Ac p p p t v v v tq x and 1 2 1B Bq q x .
Figure 4a: Depiction of Demand for High Market Spillovers When Only Firm B Sells Unhealthy Good;
1 1 2 2A B B A Bc p p p t v v v
Figure 4b: Depiction of Demand for Low Market Spillovers When Only Firm B Sells Unhealthy Good;
1 1 2 2A B B A Bc p p p t v v v
Demand for each of the remaining subgames is derived in similar fashion. The following table gives
demand for each subgame considering interior solutions where one firm alone selling the unhealthy good
does not cover the market fully but if both firms sell the good, together they sell to the whole market. It is
also assumed that both firms sell the primary good to a non-zero number of consumers.

- 26 -
Table 2. Demand Expressions for Each Subgame Inferior Firm Stays in Unhealthy Good Market Inferior Firm Leaves Unhealthy Good Market
Sup
erio
r F
irm
Sta
ys in
U
nhea
lthy
Goo
d M
arke
t
If 1 2 1 2A A B B A Bp p p p v vt :
1 1 1
2 2 2
1 1 2 2
( ) /
( ) /
1 , 1
A B A A B
A B A
B A B A
q p p v v t
q p p t t
q q q q
If 1 2 1 2A A B B A Bp p p p v vt :
1 2 11 2
2 1
2
1
(
1
) / 2A A
B B
A A B B A B
A
p p p p tq q
q q q
v v t
If 1 2 1 2A A B A Bc p p p t v v v :
1
2
1 1
1 1
2 2
2
( )
( ) /
/
1 , 0
B A A B
A
A
A
B A B
p p c t vq
q t
q q
v p
q
v t
If 1 2 1 2A A B A Bc p p p t v v v :
1 11
1
22
1 2
2(
0
/
1
) 2
,B AA
B B
A A BA
A
p p p c t v v v tq q
q q q
Supe
rior
Fir
m L
eave
s
Unh
ealt
hy G
ood
Mar
ket If 1 1 2 2A B B A Bc p p p t v v v :
1 2
1
1 1
21 2 2
( ) / 2 0
1 , ( ) /
,A B A B
B
A A
B A B
c p p v v t
v p
q q
q q q t
If 1 1 2 2A B B A Bc p p p t v v v :
1 2 21
2
1 2 1
( ) / 2
0
1
A B B A BA
A
B B A
q
q
q q
c p p p t v v v
q
t
1 2
1 1
1 1
2
( ) / , 0
1 , 0B A A BA A
B A B
q q
q q
p p t t
q
v v
For each subgame, we solve for the pricing equilibrium using the demand expressions of Table 2.
We first suppose a given constraint holds (e.g., 1 1 2 2A B B A Bc p p p t v v v ) and then check
whether the prices derived from the corresponding demand expressions satisfy the constraint. The
corresponding conditions such that the equilibrium prices satisfy the constraints under which they are
derived are reported along with profits in Table 3.
Note that when consumers purchase from at most one firm, it is the sum of primary and unhealthy
goods prices that factors into the decision rather than either price individually. As such, multiple prices
can arise in equilibrium and whether consumers purchase from at most one firm (versus some consumers
splitting their firm choice across products) depends on the price of the unhealthy good.

- 27 -
Table 3. Subgame Profit Outcomes Inferior Firm Stays in Unhealthy Good Market Inferior Firm Leaves Unhealthy Good Market
Sup
erio
r F
irm
Sta
ys in
U
nhea
lthy
Goo
d M
arke
t If A Bv v t : 2 2
2 2
(5 2 ( ) ( ) ) / 9 t
(5 ( ) ( )4 ) / 9 t
SSA
S
A B A B
A BS
B A B
t t v v v v
t t v v v v
If 2 2 (3 ) / 6A B A Bp p t v v :
2
2
/18
/
(3 )
(3 ) 18
SSA
SS
A B
AB B
t v v
t v v
t
t
If 22 4 3 2 2 0A Bc t v v v :
2 22
2
/ 9 / 4( 2 )
( ) / 9
SNA
S
A B
B AN
B
c t v v v
c t v
t
v
t
t
If 2 2( 3 5 ) / 6A A Bp c t v v v : 2
2
22
( 3 )
(
/
183 /)
18SN
S
A A B
B AN
B
c t v v v
c t v
t
v v t
Sup
erio
r F
irm
Lea
ves
Unh
ealt
hy G
ood
Mar
ket If 22 4 3 2 2 0A Bc t v v v :
2
2 22
( )
( 2
/ 9
9 / 4) /
NSA A B
BBNS
A
c t v v
c
t
tt v tv v
If 2 2( 3 5 ) / 6B A Bp c t v v v :
22
22
( 3 )
( 3 )
/18
/18
NSA A B
NSB A B
c t v v v
c t v v v
t
t
2
2
(3 )
(3 )
/18
/18
NNA B
NB
A
BN
A
t v v
t v v
t
t
Table 3 includes seven possible profit outcomes. We compare these outcomes and identify the
equilibrium unhealthy good market participation by examining whether either firm can unilaterally
profitably deviate from each of the candidate equilibria. The results show that similar to our findings from
the main model, for high enough values of 2v and c, there exists an equilibrium where only the inferior
firm stays in the unhealthy good market, and this is the only unique asymmetric equilibrium. Profit
analysis for this equilibrium shows similar results as those in the main model; for high enough 2v , both
firms make more profit in the {not sell, sell} equilibrium compared to when no market spillover exists.
Also, for high 2v and low c, the inferior firm makes higher profit than the superior firm in the {not sell,
sell} equilibrium.
In conclusion, this extension demonstrates that the main model’s assumption regarding the
independence of the primary and unhealthy good market allowed for parsimony without sacrificing
robustness.

- 28 -
5. Discussion
In this paper we looked at negative market spillovers that may occur if the firm decides to participate in
an unhealthy good market and can lower consumers’ willingness to pay for the firm’s products in its
primary market. Such negative market spillovers, examples of which can be observed in pharmacy and
grocery industries, are becoming more prevalent as consumers become more health and socially
conscious. As a result, firms active in industries with market spillovers face an interesting dilemma:
should they withdraw from their profitable unhealthy good market to avoid lowering their value in the
primary market or should they collect profits from the unhealthy good market and let their primary market
value decrease? We modeled this phenomenon by considering two competing firms which can decide
whether or not to participate in the unhealthy good market at the cost of a negative spillover to their
primary market.
Analyzing the equilibrium strategies of competing firms and their profitability under a negative
market spillover, we found multiple interesting results from the model. First, we found that for
sufficiently large market spillovers and consumers’ reservation value for unhealthy goods, there is an
equilibrium where the inferior firm stays in the unhealthy good market while the superior firm exits this
market. Interestingly, we show that in this equilibrium both the inferior and the superior firm can be better
off with the market spillover compared to before its emergence, when the consumers’ reservation value
for the unhealthy good and the size of the unhealthy good market are high enough. Otherwise, when only
the superior firm exits the market and consumers’ reservation value for the unhealthy good or the size of
the unhealthy good market is not too high, only the superior firm makes more profit with market spillover
than without it. Also, when consumers’ reservation value for the unhealthy good is low enough such that
both firms exit the unhealthy good market, both firms become worse off as a result of the market
spillover. Finally, we find that when the inferior firm is the only one selling the unhealthy good, it can
even make more profit than the superior firm.

- 29 -
These results show the opposite effect of what may be expected from a negative market spillover;
even though firms get penalized through the market spillover, there are conditions for which they can still
end up making more profit. The superior firm may exit the unhealthy good market and, in spite of entirely
losing one market, become better off since it earns more profit in the primary market as a consequence of
negative market spillover for the inferior firm for staying in the unhealthy good market. On the other
hand, the inferior firm can also be better off when consumers’ reservation value for the unhealthy good
and the size of the unhealthy good market are high enough, despite getting penalized in the primary
market, because it now has monopoly power in the lucrative unhealthy good market. The market spillover
thus can work as a competition dampening mechanism resulting in higher profits for firms. As we
mentioned, even more surprisingly the inferior firm can earn higher profit than the superior firm in this
equilibrium if the consumers’ reservation value for the unhealthy good is high enough. The inferior firm
enjoys monopoly power over the unhealthy good market, but the superior firm has no incentive, on the
margin, to participate in this market since that market won’t be as lucrative with two participants and it
would lose its advantage in the primary market.
Our analysis has clear implications for managers involved in industries with market spillovers. Our
research shows when a manager for a superior firm should react to a negative market spillover by
withdrawing from the unhealthy market. Managers should also consider the effect that the emergence of
negative market spillover can have on the firms’ profits, by evaluating the critical factors of consumers’
reservation value for the unhealthy good, size of the unhealthy good market, and the magnitude of market
spillover. Based on our findings, it may actually be counterproductive for managers to try to resist and
fight negative market spillovers, as they can increase the profits of all competing firms through lowered
competition. We also provide managers insights on which of the high quality or low quality firms receive
more profit from a market spillover. This result suggests that when investing in quality, managers should
consider whether market spillovers are to be expected and decide accordingly.

- 30 -
The insights from our analysis of negative market spillovers from unhealthy good markets may be
considered more broadly when examining how a firm’s participation in one market causes the value in
other markets to decrease. Another common example of such market spillovers is for online
intermediaries and their liability for fighting internet piracy. In the recent years, the entertainment
industry has increased its efforts to encourage online intermediaries, such as search engines, to limit
consumers’ access to pirated content (Kravets 2013). In October 2014, Google announced it has redefined
its search algorithm to lower the ranking of those sites with high numbers of copyright removal notices in
its search results (Dredge 2014). By avoiding engagement in the pirated market, Google is not only
building better partnerships with the entertainment industry, but also providing better value for those
consumers who are afraid of falling victim to copyright infringement. As Google mentions in its
announcement “Only copyright holders know if something is authorized, and only courts can decide if a
copyright has been infringed… This ranking change should help users find legitimate, quality sources of
content more easily.” Therefore, users looking for pirated content may start looking for search engines
that do not lower the rankings of such content, while users looking for legitimate content would welcome
Google’s move and get more value from this search engine. Again this means that the decision to
participate in one market can affect the value offered in another market. Future research can investigate
whether the findings of the current model are replicated or moderated when incorporating the
complexities of piracy enforcement.
In summary, this paper studied the concept of negative market spillovers. We developed an
analytical model that identified when the superior firm or both the superior and inferior firm will exit the
unhealthy market. Our comparison between firms’ profits before and after the introduction of the market
spillover shows that under some conditions both firms can benefit from the market spillover. The results
provide implications for managers considering participation in unhealthy good markets as their
participation in these markets begins to affect consumer preferences for the company’s other lines of
business.

- 31 -
References
Anderson, S. P. and De Palma, A. 1992. Multiproduct Firms: A Nested Logit Approach. The Journal of
Industrial Economics, 40(3), 261-276.
Baum, J. and Korn, H. 1999. Dynamics of Dyadic Competitive Interaction. Strategic Management
Journal, 20(3), 251-278.
Bernheim, B. and M. Whinston. 1990. Multimarket Contact and Collusive Behavior. The RAND Journal
of Economics, 21(1), 1-26.
Cachon, G. P., Terwiesch, C., and Xu, Y. 2008. On the Effects of Consumer Search and Firm Entry in a
Multiproduct Competitive Market. Marketing Science, 27(3), 461-473.
Cai, C. J. and Raju, J. S. (2015). Keeping Your Enemies Closer: When Market Entry as an Alliance with
Your Competitor Makes Sense. (Working Paper)
Calia, M. 2014. CVS Revenue Rises on Strength at Pharmacy. The Wall Street Journal, 4, Nov.
Davis, S. 2014. CVS CEO: It’s a "Contradiction" to Help People Be Healthier and Sell Tobacco Products.
CBS News, 5, Feb.
Dredge, S. 2014. Google Says Latest Search Changes Will 'Visibly Affect' Piracy Site Rankings. The
Guardian, 20, Oct.
Dvorak, N. and Yu, D. 2014. Why CVS May Not Get Burned by Its Tobacco Decision. Gallup.com, 18,
Mar.
Edwards, C. 1955. Conglomerate Bigness as a Source of Power. Business Concentration and Price Policy.
Princeton University Press, 331-359.
Geylani, T., Dukes, A., and Srinivasan, K. 2007. Strategic Manufacturer Response to a Dominant
Retailer. Marketing Science, 26(2), 164-178.
Gimeno, J. 1994. Multipoint Competition, Market Rivalry and Firm Performance: A Test of the Mutual
Forbearance Hypothesis in the US Airline Industry, 1984-1988. (Doctoral dissertation), Retrieved
from ProQuest Dissertations Publishing.
Gimeno, J. and Woo, C. 1996. Hypercompetition in a Multimarket Environment: The Role of Strategic
Similarity and Multimarket Contact in Competitive De-Escalation. Organization Science, 7(3), 322-
341.
Grossmann, V. 2007. Firm Size and Diversification: Multiproduct Firms in Asymmetric Oligopoly.
International Journal of Industrial Organization, 25(1), 51-67.
Harrison, A. 2014. Checkout Bans Could Kick Confectionery While It's Down: Euromonitor.
confectionerynews.com, 2, Jun.

- 32 -
Harsanyi, J. C., and Selten, R. 1988. A General Theory of Equilibrium Selection in Games. MIT Press
Books, 1.
Heggestad, A. and S. Rhoades. 1978. Multi-market Interdependence and Local Market Competition in
Banking. The Review of Economics and Statistics, 60(4), 523-532.
Jayachandran, S., J. Gimeno, and P. Varadarajan. 1999. The Theory of Multimarket Competition: A
Synthesis and Implications for Marketing Strategy. The Journal of Marketing, 63(3), 49-66.
Karnani, A. and B. Wernerfelt. 1985. Multiple Point Competition. Strategic Management Journal, 6(1),
87-96.
Kravets, D. 2013. MPAA Says Google Foster Piracy, Because Why Wouldn’t It. Wired, 18, Sep.
Kuksov, D. and Villas-Boas, J. M. 2010. When More Alternatives Lead to Less Choice. Marketing
Science, 29(3), 507-524.
Liu, L. and Dukes, A. 2013. Consideration Set Formation with Multiproduct Firms: The Case of Within-
Firm and Across-Firm Evaluation Costs. Management Science, 59(8), 1871-1886.
Margolis, S. E. 1989. Monopolistic Competition and Multiproduct Brand Names. Journal of Business,
62(2), 199-209.
Martin, T. and M. Esterl. 2014. CVS to Stop Selling Cigarettes. The Wall Street Journal, 5, Feb.
Olenski, S. 2014. Healthy Is The New Green: Businesses And Brands Tapping Into The Healthy Food
Market. Forbes, 23, May.
Parker, P. and L. Röller. 1997. Collusive Conduct in Duopolies: Multimarket Contact and Cross-
Ownership in the Mobile Telephone Industry. The RAND Journal of Economics, 28(2), 304-322.
Poulter, S. 2014. Lidl Leads the Way With Sweet and Crisps Ban at Checkout. dailymail.co.uk, 13, Jan.
Schindler, R. M. 2011. Pricing Strategies: A Marketing Approach. Sage, 11, Oct.
Schmalbruch, S. 2015. Why I Love the CVS Rewards Program. Business Insider, 4, Feb.
Smithers, R. 2014. Tesco Bans Sweets From Checkouts In All Stores. The Guardian, 21, May.
Stephan, J., Murmann, J. P., Boeker, W., and Goodstein, J. 2003. Bringing Managers into Theories of
Multimarket Competition: CEOs and the Determinants of Market Entry. Organization Science, 14(4),
403-421.
Stern, M. 2015. Is Target Becoming A Wellness Dictator? Forbes, 27, Sep.
Straub, P. G. 1996. Risk Dominance and Coordination Failures in Static Games. The Quarterly Review of
Economics and Finance, 35(4), 339-363.
Thomas, C. and R. Willig. 2006. The Risk of Contagion from Multimarket Contact. International Journal
of Industrial Organization, 24(6), 1157-1184.

- 33 -
Trotter, G. 2016. Aldi Putting More Granola, Less Chocolate in Checkout Lanes. Chicago Tribune, 12,
Jan.
Wahba, P. and Steenhuysen, J. CVS Becomes First Big U.S. Drugstore Chain to Drop Tobacco. Reuters,
5, Feb.
Young, J. 2014. Why Is CVS Walking Away From $2 BILLION A Year? The Huffington Post, 12, Sep.
Yu, T., and A. Cannella. 2013. A Comprehensive Review of Multimarket Competition Research. Journal
of Management, 39(1), 76-109.

- 34 -
APPENDIX
I) Proof of Lemma 1:
The subgame equilibrium prices for 23 / 2 2t v t are derived in the main text, with profits defined by
equations (2)-(8). With these prices, unhealthy good market is fully covered if 2 3 / 2v t .
CLAIM: For 2 3 / 2t v t , in the {sell, sell} subgame, each firm charges the highest price possible
in the unhealthy good market that will cover half of the market, which is 2 / 2v t . PROOF: No firm can
deviate to higher or lower prices profitably. The profit of charging 2 / 2v t is 2( / 2) / 2m v t for both
firms. If firm A increases its price, demand becomes 2 2( ) /Am v p t . The profit function becomes
22 2 2( ) / tA Am v p p , which is decreasing in 2Ap for 2 2 / 2Ap v t . If firm A decreases its price, the
demand will be derived from 2 2 2 2(1 ) ( / 2)Av yt p v y t v t and profit would be
2 2 2( / 2 ) /A Am t v p p t , which is diminished by decreasing 2Ap from 2v / 2.t Thus,
2 2 / 2Ap v t is the equilibrium price. Similar analysis can be used to show 2 2 / 2Bp v t . □
If 2v t , both firms are local monopolies and set prices of 2 / 2v , earning profits of 22 / 4mv t .
We summarize the payoffs from each possibility in Tables A1, A2, and A3. If 3 ( )A Bc t v v ,
then all subgames have interior solutions and the equilibrium is found from Table A1. If
3 ( ) 3 ( )A B A Bt v v c t v v , then the {not sell, sell} subgame reaches a corner solution, resulting
in Table A2. Finally if 3 ( )A Bc t v v , then both subgames with asymmetric strategies have corner
solutions, shown in Table A3.

- 35 -
Table A1. Profit Outcomes if 3 ( )A Bc t v v
B: Sell Unhealthy Good B: Not Sell Unhealthy Good
A: S
ell U
nhea
lthy
Goo
d
2
2
2
2
2
2
2 2
22
2 22
2
(( ) / 3 ) / 2 / 232 :
2 (( ) / 3 ) / 2 / 2
(( ) / 3 ) / 2 ( / 2) / 23:
2 (( ) / 3 ) / 2 ( / 2) / 2
((0 :
SShighvA A B
SShighvB B A
SSmedvA A B
SSmedvB B A
SSlowvA A
v v t t mttif v t
v v t t mt
v v t t m v ttif t v
v v t t m v t
vif v t
2
2 22
2 22
) / 3 ) / 2 / 4
(( ) / 3 ) / 2 / 4
B
SSlowvB B A
v t t mv t
v v t t mv t
2 2
2
2
(( ) / 3 ) / 2 / 4
(( ) / 3 ) / 2
SNlowcA B A
SNlowcB B A
v v c t t mv t
v v c t t
A: N
ot S
ell
Unh
ealt
hy
Goo
d
2
2 22
(( ) / 3 ) / 2
(( ) / 3 ) / 2 / 4
NSlowcA A B
NSlowcB A B
v v c t t
v v c t t mv t
2
2
(( ) / 3 ) / 2
(( ) / 3 ) / 2
N NA A B
N NB B A
v v t t
v v t t
Table A2. Profit Outcomes if 3 ( ) 3 ( )A B A Bt v v c t v v
B: Sell Unhealthy Good B: Not Sell Unhealthy Good
A: S
ell U
nhea
lthy
Goo
d
2
2
2
2
2
2
2 2
22
2 22
2
(( ) / 3 ) / 2 / 232 :
2 (( ) / 3 ) / 2 / 2
(( ) / 3 ) / 2 ( / 2) / 23:
2 (( ) / 3 ) / 2 ( / 2) / 2
((0 :
SShighvA A B
SShighvB B A
SSmedvA A B
SSmedvB B A
SSlowvA A
v v t t mttif v t
v v t t mt
v v t t m v ttif t v
v v t t m v t
vif v t
2
2 22
2 22
) / 3 ) / 2 / 4
(( ) / 3 ) / 2 / 4
B
SSlowvB B A
v t t mv t
v v t t mv t
2 2
2
2
(( ) / 3 ) / 2 / 4
(( ) / 3 ) / 2
SNlowcA B A
SNlowcB B A
v v c t t mv t
v v c t t
A: N
ot S
ell
Unh
ealt
hy
Goo
d
2
2 / 4
NShighcA A B
NShighcB
v v c t
mv t
2
2
(( ) / 3 ) / 2
(( ) / 3 ) / 2
N NA A B
N NB B A
v v t t
v v t t
Table A3. Profit Outcomes if 3 ( )A Bc t v v
B: Sell Unhealthy Good B: Not Sell Unhealthy Good
A: S
ell U
nhea
lthy
Goo
d
2
2
2
2
2
2
2 2
22
2 22
2
(( ) / 3 ) / 2 / 232 :
2 (( ) / 3 ) / 2 / 2
(( ) / 3 ) / 2 ( / 2) / 23:
2 (( ) / 3 ) / 2 ( / 2) / 2
((0 :
SShighvA A B
SShighvB B A
SSmedvA A B
SSmedvB B A
SSlowvA A
v v t t mttif v t
v v t t mt
v v t t m v ttif t v
v v t t m v t
vif v t
2
2 22
2 22
) / 3 ) / 2 / 4
(( ) / 3 ) / 2 / 4
B
SSlowvB B A
v t t mv t
v v t t mv t
2
2 / 4SNhighcA
SNhighcB B A
mv t
v v c t

- 36 -
A: N
ot S
ell
Unh
ealt
hy
Goo
d
22 / 4
NShighcA A B
NShighcB
v v c t
mv t
2
2
(( ) / 3 ) / 2
(( ) / 3 ) / 2
N NA A B
N NB B A
v v t t
v v t t
We start by analyzing the profits in Table A1 when 23 / 2 2t v t (high 2v ), denoting
A BK v v . Comparing profits, 2SShighv NSlowcA A at 2 23 9 ( 3 )c K t mt K t and
2 23 9 ( 3 )c K t mt K t . The second root is negative and 2SShighvNSlowcA A is increasing in
c for all 3c K t . Thus, 2SShighv NSlowcA A if 2 2
/ ~ 3 9 ( 3 )NS SS Hc c K t mt K t .
Recall our bound on c for Table A1 and note that / ~ 3NS SS Hc t K iff 3 ( 4 1)K t m . Therefore
in Table A1, 2SShighv NSlowcA A if 3 ( 4 1)K t m and / ~NS SS Hc c ; otherwise 2SShighv NSlowc
A A
. Using similar logic we find the cutoffs for each range of 2v , by choosing the profits corresponding to
2 3 / 2t v t (medium 2v ) or 2v t (low 2v ). Thus we find that for 2 3 / 2t v t , 2SSmedv NSlowcA A
if 23 3 ((8 ) / 2 )K t t m t mv and 2/ ~ 23 (9 ( / 2) (3 ) )NS SS Mc c t K mt v t t K ; otherwise
2SSmedv NSlowcA A . Similarly for 2v t , 2SSlowv NSlowc
A A if 2 223 3 4 / 2K t t mv and
2 2/ ~ 23 9 / 2 (3 )NS SS Lc c t K mv t K ; otherwise 2SSlowv NSlowc
A A .
Also in Table A1, 2SShighv SNlowcB B if 2 2
/ ~ 3 9 (3 )SN SS Hc c t K mt t K . Note that
/ ~ 3SN SS Hc t K iff (3 3 )K t m . Thus in Table A1, 2SShighvSNlowcB B if (3 3 )K t m and
/ ~SN SS Hc c ; otherwise 2SShighv SNlowcB B . Similarly for
2 3 / 2t v t , 2SSmedvSNlowcB B if
23 3 ( / 2)K t mt v t and 2/ ~ 23 9 ( / 2) (3 )SN SS Mc c t K mt v t t K ; otherwise
2SSmedv SNlowcB B . Similarly for 2v t , 2SSlowvSNlowc
B B if 23 ( 3 / 2)K t m v and
2 2/ ~ 23 9 / 2 (3 )SN SS Lc c t K mv t K ; otherwise 2SSlowv SNlowc
B B .

- 37 -
Also, in Table A1, SNlowc NNA A for 2 2 /
2(6 2 )
3SN NNv v c t K c
m . Finally,
NSlowc NNB B for 2 2 /
2(6 2 )
3NS NNv v c t K c
m . Note that both 2 /SN NNv and 2 /NS NNv have real
values in Table A1, where 3c t K .
Next we analyze profits in Table A2, when 3 3t K c t K . For high 2v , 2SShighv NShighcA A
if 3 ( 4 1)K t m and / 2~3 (3 ) / 2 ( 12 ) /18NS SS Ht K c c m t K K t t ; otherwise
2SShighv NShighcA A . For medium 2v , 2SSmedv NShighc
A A if 23 3 ((8 ) / 2 )K t t m t mv and
/ 2~ 23 (6 ) / 4 / 2 ( 12 ) /18NS SS Mt K c c m t mv K K t t ; otherwise 2SSmedv NShighcA A .
Similarly, for low 2v , we have 2SSlowv NShighcA A if 2 2
23 3 4 / 2K t t mv and
2/ 2~ 23 / 4 (3 )(1/ 2 /18 )NS SS Lt K c c mv t t K K t ; otherwise 2SSlowv NShighc
A A . The
comparison between firm B’s profit in the {sell, sell} and {sell, not sell} subgames is the same as the one
in Table A1, but with different conditions on K : / ~3 3SN SS Ht K c t K if (3 3 )K t m ,
/ ~M3 3SN SSt K c t K if 23 3 ( / 2)K t mt v t , and / ~L3 3SN SSt K c t K if
23 3 / 2K t m v . SNlowc NNA A iff 2 2 /
2(6 2 )
3SN NNv v c t K c
m . NShighc NN
B B iff
2 2 / (3 ) / 3v m t K .
Finally, we analyze Table A3 when 3c t K . For all 0 3K t , we know that
3 2SNhighc SNhighcB B c t K t and 2 2 2 2
0, , ( 1) / 2SSlowv SSmedv SShighv SShighvB B B B K m t t , which
means in this Table we always have SNhighc SSB B , where SS
B could be any of the three profits
2SSlowvB , 2SSmedv
B , or 2SShighvB . Also for 0 3K t , we know / ~ / ~ / ~, , 3NS SS H NS SS M NS SS Lc c c t K ,

- 38 -
which means in Table 3 we always have NShighc SSA A . The inequality SNhighc NN
A A holds if
2 2 / (3 ) / 3v m t K , and NShighc NNB B holds if 2 2 / (3 ) / 3v m t K .
To find the condition for the {sell, sell} equilibrium, we compare the condition for firm A not
deviating from {sell, sell} with the condition for firm B not deviating to see which condition is stricter.
Starting with high 2v , we show that for 0K , / ~ / ~NS SS H SN SS Hc c ; taking the derivatives of / ~NS SS Hc
and / ~SN SS Hc with respect to K , we find
/ ~
2 2
/ ~
2 2
31 0
( 3 ) 9
31 0
( 3 ) 9
NS SS H
SN SS H
c K t
K K t mt
c K t
K K t mt
Also note that 0 0/ ~ / ~K KNS SS H SN SS Hc c
. Therefore, / ~NS SS Hc and / ~SN SS Hc have the same value
at 0K , but / ~NS SS Hc is decreasing in K , while / ~SN SS Hc is increasing. Thus for all 0K ,
/ ~ / ~NS SS H SN SS Hc c . As K becomes bigger than 3 ( 4 1)t m , the condition for 2SShighv NShighcA A
becomes / 2~NS SS Hc c . For 3 ( 4 1)K t m , we have / 2~ / ~NS SS H NS SS Hc c which also implies
/ 2~ / ~NS SS H SN SS Hc c . Using similar logic for other ranges of 2v , we show that / ~ / ~NS SS M SN SS Mc c since
/ ~M / ~MNS SS SN SSc c
K K
and
0 0/ ~ / ~K KNS SS M SN SS Mc c . Also in this range, for
23 3 ((8 ) / 2 )K t t m t mv we have / 2~ / ~ / ~NS SS M NS SS M SN SS Mc c c . Finally, / ~ / ~NS SS L SN SS Lc c
since / ~ / ~NS SS L SN SS Lc c
K K
and
0 0/ ~ / ~K KNS SS L SN SS Lc c . Also for 2 2
23 3 4 / 2K t t mv we
have / 2~ / ~ / ~NS SS L NS SS L SN SS Lc c c . Thus, if the condition for firm A not switching from {sell, sell} to
{not sell, sell} is satisfied, then firm B would also not switch from {sell, sell} to {sell, not sell}.

- 39 -
This proves that the {sell, sell} equilibrium exists only for c c . Let { , , }r L M H represent the
region to which 2v belongs, such that r L requires 20 v t , r M requires 2 3 / 2t v t , and
r H requires 23 / 2 2t v t . The definition of c is such that for 2v belonging to the region
{ , , }r L M H , / ~rNS SSc c if *rK K , and / 2~rNS SSc c if *
rK K , where
* 2 223 3 4 / 2LK t t mv ,
*23 3 ((8 ) / 2 )MK t t m t mv , and * 3 ( 4 1)HK t m .
Thus, proof of Lemma 1(a) is completed.
Similarly, to find the condition for the {not sell, not sell} equilibrium, we compare the conditions for
NN SNA A and NN NS
B B . For 3c t K , we have 2 / 2 /NS NN SN NNv v . For 3 3t K c t K ,
the minimum of 2 /SN NNv occurs at 3c t K and is equal to 2
(3 )(3 3 )3
t K t Km
which is greater
than 2
(3 )3
t Km
. Thus, for 3 3t K c t K we have 2 /
2(3 )
3SN NNv t K
m . Finally, for
3c t K we know the threshold for NN NSB B , 2 2 / (3 ) / 3v m t K , is less than the threshold
for NN SNA A , 2 2 / (3 ) / 3v m t K .
Thus the upper bound condition on 2v for NN NSB B is always stricter than that for
NN SNA A for the {not sell, not sell} equilibrium. This proves that the {not sell, not sell} equilibrium
exists if and if 2 2v v , where 2 2 /NS NNv v for 3c t K and 2 2 / (3 ) / 3v m t K for 3c t K ,
proving Lemma 1(b). Q.E.D.
II) Proof of Proposition 1:
Putting together the results of the analysis in the proof of Lemma 1, we find the {not sell, sell}
equilibrium exists for c c and 2 2v v . We also find the conditions for the {sell, not sell} equilibrium.

- 40 -
This equilibrium exists for c c and 2 2v v . Let 2v belong to the region { , , }r L M H . We define
/ ~rSN SSc c . We define 2 2 /SN NNv v for 3c t K , and 2 2 / (3 ) / 3v m t K for 3c t K .
In the proof of Lemma 1 we showed that NN NSB B guarantees NN SN
A A . Thus the region
for SN NNA A is a subset of the region for NS NN
B B and 2 2v v . We also showed that
SS NSA A guarantees SS SN
B B . Thus the region for SN SSB B is a subset of the region for
NS SSA A and c c . This means the region where the {sell, not sell} equilibrium exists is a subset of
the region where the {not sell, sell} equilibrium exists, and the {not sell, sell} equilibrium is unique in the
region for c c c and 2 2 2v v v . This proves Proposition 1(a).
Next we prove the risk-dominance of the {not sell, sell} equilibrium over the {sell, not sell}
equilibrium. The condition for the risk-dominance of the {not sell, sell} equilibrium is
( )( ) ( )( ) 0NS SS NS NN SN NN SN SSA A B B A A B BRD . We begin with low 2v , and use
similar logic for higher values of 2v .
For low 2v , there are three Tables to consider. For Table A1, 3 22 / 81 0RD c K t .
For low 2v and Table A2, 2 2( ) / ( 3 ) / 6RD v mv c t K t is positive for Table A2, meaning
RD is minimized with respect to 2v at 2 0v . We show that this minimum of RD is positive, thus
proving RD is positive. 2 0( ) /vRD K is continuous in K and never zero for 0 3K t , which
means 2 0vRD is monotonic for 0 3K t . Thus, the minimum of
2 0vRD with respect to K is at
one of the corners of the region 0 3K t . Since 2 0, 0 0v KRD and
2 0, 3 0v K tRD , the minimum
of 2 0vRD is positive, thus
2 0 0vRD and 0RD .

- 41 -
For low 2v and Table A3, 2 22(6(2 5 ) 3 2 ) /18RD c t t mv K K t , which is positive for
2 2 22( 3 30 2 ) /12c mv t K t . Also, 2 2 2
2( 3 30 2 ) /12 3mv t K t t K for all 3K t . Thus, in
Table A3, 0RD . Using the same logic, it is straight forward to show that for medium and high values
of 2v , RD is still positive. Q.E.D.
III) Proof of Proposition 2:
If no negative market spillover exists, then the two markets are independent from each other. The firms’
profits would be the same as when a negative market spillover existed and both firms stayed in the
unhealthy good market. We denote these profits ZA and Z
B . For instance for 23 / 2 2t v t , we have
2 2(( ) / 3 ) / 2 / 2ZhighvA A Bv v t t mt and 2 2(( ) / 3 ) / 2 / 2Zhighv
B B Av v t t mt . We compare
these profits with profits under a market spillover in the {not sell, sell} equilibrium, starting from high 2v
. Note that 2 2Zhighv SShighvA A . Therefore, since in the {not sell, sell} equilibrium we must have
2SShighv NSA A , we also know 2Zhighv NS
A A .
We start with comparing ZB with NS
B in Table A1. For 23 / 2 2t v t , we have 2Zhighv NSlowcB B
if 2 22
29 6 2
3v mt ct c cK
m . For 2 3 / 2t v t , we have 2Zmedv NSlowc
B B if
2
2(6 2 )
3v t c t c K
m . For 20 v t , 2Zlowv NSlowc
B B never holds. Considering these
thresholds of 2v , we find 2 22
29 6 2 2
3v mt ct c cK t
m holds only for
2
(6 2 )
9
c t K cm
t
.
Also, 2 22
29 6 2 3 / 2
3v mt ct c cK t
m requires
2
8 (6 2 )
9
c t K cm
t
, which results in
2 22 29 6 2 (6 2 )
3 3mt ct c cK t c t c K
m m . Also, 2
2(6 2 ) 3 / 2
3v t c t c K t
m

- 42 -
requires 2
8 (6 2 )
9
c t K cm
t
, which results in 2 22 2
9 6 2 (6 2 )3 3
mt ct c cK t c t c Km m
.
Thus, Z NSB B requires 2 2
2
2 2{ 9 6 2 , (6 2 )}3 3
v Min mt ct c cK t c t c Km m
and
2
(6 2 )
9
c t K cm
t
.
Using similar logic in Tables A2 and A3 we find in the {not sell, sell} equilibrium, when 3c t K ,
Z NSB B and Z NS
A A if 22
2 2{ 9(1 ) (6 ), (3 )}3 3
v Min m t K t K t t Km m
and
2
2
(3 )
9
t Km
t
. Q.E.D.
IV) Proof of Proposition 3:
Consider the {not sell, sell} equilibrium in Table A1. The inequality NS NSA B holds true if
2 2 2 / 3v m ct Kt . Comparing this condition with 2 2 /NS NNv v , required for the {not sell, sell}
equilibrium, we find that 2 2 2 / 3v m ct Kt guarantees 2 2 /NS NNv v in Table A1 and thus satisfies
the equilibrium condition. Considering the condition 2 2v t , the threshold 2 2/3m ct Kt is below
2 2v t if 3 / 2c mt K , which can be satisfied in Table A1, since 3 / 2mt K is bigger than
/ ~NS SS Hc for 3( 4 1)K m t . Thus the region where NS NSA B can satisfy the conditions c c
and 2 2v v required for the {not sell, sell} equilibrium in Table A1. Considering Tables A2 and A3,
NS NSA B requires 2 2 /v t m c t K . The threshold 2 /t m c t K is larger than 2 2v t
for all 3c t K . Thus, only Table A1 can result in NS NSA B . Q.E.D.

- 43 -
V) Proof of Corollary 1:
Similar to our proof for Lemma 1, we analyze firm profits for 0K . If 3c t , there’s an interior
solution for the firms’ profits when one firm leaves the unhealthy market, and if 3c t , we get a corner
solution in both asymmetric subgames. The resulting profits are shown in Tables A4 and A5.
Table A4. Profit Outcomes if 0K and 3c t
B: Sell Unhealthy Good B: Not Sell Unhealthy Good
A: S
ell U
nhea
lthy
Goo
d
2
2
2
2
2
2
2
22
2
22
2 22
/ 2 / 232 :
2 / 2 / 2
/ 2 ( / 2) / 23:
2 / 2 ( / 2) / 2
/ 2 / 40 :
/ 2 / 4
SShighvA
SShighvB
SSmedvA
SSmedvB
SSlowvA
SSlowvB
t mttif v t
t mt
t m v ttif t v
t m v t
t mv tif v t
t mv t
2 2
2
2
( / 3 ) / 2 / 4
( / 3 ) / 2
SNlowcA
SNlowcB
c t t mv t
c t t
A: N
ot S
ell
Unh
ealt
hy
Goo
d
2
2 22
( / 3 ) / 2
( / 3 ) / 2 / 4
NSlowcA
NSlowcB
c t t
c t t mv t
/ 2
/ 2
NNA
NNB
t
t
Table A5. Profit Outcomes if 0K and 3c t
B: Sell Unhealthy Good B: Not Sell Unhealthy Good
A: S
ell U
nhea
lthy
Goo
d
2
2
2
2
2
2
2
22
2
22
2 22
/ 2 / 232 :
2 / 2 / 2
/ 2 ( / 2) / 23:
2 / 2 ( / 2) / 2
/ 2 / 40 :
/ 2 / 4
SShighvA
SShighvB
SSmedvA
SSmedvB
SSlowvA
SSlowvB
t mttif v t
t mt
t m v ttif t v
t m v t
t mv tif v t
t mv t
2
2 / 4SNhighcA
SNhighcB
mv t
c t
A: N
ot S
ell
Unh
ealt
hy
Goo
d
2
2 / 4
NShighcA
NShighcB
c t
mv t
/ 2
/ 2
NNA
NNB
t
t
Using the same steps as in the proofs of Lemma 1 and Proposition 1, we can find the conditions for
asymmetric equilibria. When 0K , we find that 2 0 2 0K Kv v and 0 0K Kc c . Thus, {not
sell, sell} equilibrium and {sell, not sell} equilibrium both exist for 2 2 0Kv v and 0Kc c . Q.E.D.

- 44 -
VI) Proof of Corollary 2:
We use steps similar to those in the proof of proposition 2, but for tables A4 and A5. We assume the {not
sell, sell} equilibrium for this proof. The conditions for the other asymmetric equilibrium are derived
similarly. In Table A4, we have Z NSB B if 2 2
2
2 2{ 9 6 , (6 )}3 3
v Min mt ct c t c t cm m
and 2
(6 )
9
c t cm
t
. In Table A5, for all 0 1m we have Z NS
B B . Also, we know that in the {not
sell, sell} equilibrium, we always have Z NSA A . Thus, both firms make more profit in the {not sell,
sell} equilibrium if 2 22
2 2{ 9 6 , (6 )}3 3
v Min mt ct c t c t cm m
and 2
(6 )
9
c t cm
t
. Q.E.D.
VII) Proof for the Model of Dependency across the Markets:
We show the proof of analysis for high 2v such that 2 3 / 2v t . The analysis for medium and low values
of 2v follows the same process.
Tables 2 and 3 show the demands and profits for each subgame, assuming both firms sell the
primary good to some consumers in asymmetric subgames, 1 0Aq and 1 0Bq , which is satisfied if
2c t K .
For 2c t K , if the inferior firm is the only firm selling the unhealthy good, it will not sell the
primary good to any consumers. In this case, each firm sells a different product and the markets for the
two goods become independent, which means the model is similar to the main model and the profits for
the {not sell, sell}subgame are similar to those in Table A2. Similarly for 2c t K , if only the superior
firm is selling the unhealthy good, the markets for the two goods are not dependent, resulting in profits
for the {sell, not sell} subgame similar to those in Table A3. We show the analysis for 2c t K , the
proof for other cases follows the same steps.

- 45 -
For {not sell, sell} strategies, when 2c t K , we find the conditions required for neither firm to
unilaterally deviate, considering alternative strategies that result in consumers buying from both firms or
only one firm. Comparing subgame profits, we find that for 22
2 222 4 (2 ) 2
3t tK c t K Kv c
and 22 2{ 2 }/ 25 , 3c Max K t K Kt t K t K t the {not sell, sell} equilibrium where
some consumers buy from both firms exists. A {not sell, sell} equilibrium where consumers buy from at
most one firm never exists. Similarly for {sell, not sell} strategies, we find that for
22
2 222 4 (2 ) 2
3t tK c t K Kv c and 22 2 / 2{ 4 5 , 3 }c Max K t K Kt t K t K t
the {sell, not sell} equilibrium where some consumers buy from both firms exists. A {sell, not sell}
equilibrium where consumers buy from at most one firm never exists.
Next we analyze the uniqueness of the two asymmetric equilibria. We find that for 2c t K ,
2 22 2 2 2{ 2 5 , 3 } {/ 2 / 24 5 , 3 }Max K t K Kt t K t K t Max K t K Kt t K t K t .
Also we have 2 2 2 2 2 22 22 4 (2 ) 2 2 4 (2 ) 2
3 3t tK c t K K c t tK c t K K c for all
22 2 / 2{ 4 5 , 3 }c Max K t K Kt t K t K t , where the {sell, not sell} equilibrium is
possible. Thus the region for {sell, not sell} is a subset of the region for {not sell, sell}.
Next, we compare the profits from the {not sell, sell} equilibrium with profits when no market
spillover exists. To make the comparison for 2c t K , we compare the profits shown in the {not sell,
sell} subgame of Table 3 with 2 25 2( ) / 9ZA t tK K t and 2 24 9(5 ) /Z
B t tK K t . Since
Z SSA A and NS SS
A A in the {not sell, sell} equilibrium, we know that NS ZA A holds.
Comparing firm B’s profit under the market spillover with 2 24 9(5 ) /ZB t tK K t shows that if
2 22 2 4 2 / 3v t ct cK c then NS SS
B B .

- 46 -
Finally, we find the condition for the inferior firm making more profit than the superior firm in the
{not sell, sell} equilibrium. We compare the profits in the {not sell, sell} subgame of Table 3 and find
NS NSB A for 2 2 2 2 / 3c tv K t which is less than 2t for all 2c t K . Q.E.D.
VIII) Ratings-Based Conjoint Studies:
We designed two ratings-based conjoint studies (see Schindler (2011), pp. 56-62) where we varied prices
and whether the seller also sold unhealthy goods.
In study 1, we studied the effect of a pharmacy selling tobacco on the subjects’ willingness to pay for
unrelated products from that pharmacy. We recruited 91 participants who were compensated for their
participation on Amazon Mechanical Turk. Subjects were told that “Pharmacy A sells cigarettes and other
tobacco products in addition to medical drugs” and “Pharmacy B sells medical drugs, but does NOT sell
tobacco products.” They were then asked to state their likelihood of purchasing travel immunization
consulting from each of the pharmacies at the prices of $10 and $12 on a scale of 0 to 10.
We regressed the ratings of likelihood to purchase on price and a dummy variable for the presence of
tobacco. The results are presented in Table A6.
Table A6. Regression Results for Study 1 Coefficients Standard Error
Price -0.59* 0.14
Tobacco Sale (dummy)
-2.62* 0.29
Intercept 14.05* 1.59
* p-value < 0.001
As described in Schindler (2011), the negative value of selling tobacco can be calculated by
|coefficientofthedummyvariable|
|coefficient of price|. This gives the estimate of a negative market spillover of $4.41.
Study 2 analyzed the effect of a grocery store selling confectionery at checkout lines on subjects’
willingness to pay for unrelated products at that store. In this study, 101 Amazon Mechanical Turk
participants were told that “Grocery store A sells candy, chocolates, and other sugar-filled treats at their

- 47 -
checkout lines” and “Grocery store B has removed candy, chocolates, and other sugar-filled treats from
their checkout lines, replacing them instead with nuts, dried fruit, trail mixes, water, and other healthy
snacks.” Then, they were asked to state their likelihood of purchasing a healthy salad from each store’s
salad bar at the prices of $3, $4, and $5 on a scale of 0 to 10. The results of the regression are shown in
Table A7. The estimated negative value of selling confectionery is $0.61.
Table A7. Regression Results for Study 2 Coefficients Standard Error
Price -1.84* 0.12
Confectionery Sale (dummy)
-1.11* 0.20
Intercept 13.73* 0.51
* p-value < 0.001