Implications for Integrated Prevention African Adolescents ...
44
Page 1/44 A high prevalence of NCD multimorbidity in South African Adolescents and Youth Living with HIV: Implications for Integrated Prevention Monika Kamkuemah ( [email protected] ) University of Cape Town School of Public Health and Family Medicine https://orcid.org/0000-0002- 7603-2792 Blessings Gausi Tolu Oni Research Keywords: Adolescents, HIV, Non-communicable diseases, Mental health, Risk factors, Prevention, Epidemiology, Multimorbidity Posted Date: February 11th, 2021 DOI: https://doi.org/10.21203/rs.3.rs-75447/v2 License: This work is licensed under a Creative Commons Attribution 4.0 International License. Read Full License
Transcript of Implications for Integrated Prevention African Adolescents ...
Page 1/44
A high prevalence of NCD multimorbidity in SouthAfrican Adolescents and Youth Living with HIV:Implications for Integrated PreventionMonika Kamkuemah ( [email protected] )
University of Cape Town School of Public Health and Family Medicine https://orcid.org/0000-0002-7603-2792Blessings Gausi Tolu Oni
Research
Keywords: Adolescents, HIV, Non-communicable diseases, Mental health, Risk factors, Prevention,Epidemiology, Multimorbidity
Posted Date: February 11th, 2021
DOI: https://doi.org/10.21203/rs.3.rs-75447/v2
License: This work is licensed under a Creative Commons Attribution 4.0 International License. Read Full License
Page 2/44
AbstractBackground: Adolescents and youth living with HIV (AYLHIV) face an elevated NCD risk resulting fromHIV, psychosocial challenges and the complications of antiretroviral therapy (ART).
Methods: We conducted a cross-sectional study in six primary care facilities to investigate the prevalenceof common NCDs and risk factors among AYLHIV in Cape Town, South Africa between March 2019 andJanuary 2020. We collected socio-demographic information, ascertained behaviours and knowledge andscreened for pre-existent and previously unidenti�ed NCDs and risk factors in adolescents and youthenrolled for primary HIV care. Characteristics between sexes and age groups were compared usingparametric or non-parametric statistical tests.
Results: Three out of four participants were female, and the median age was 20.5 years (IQR 18.9- 22.9).More than a quarter were not in education, employment or training (NEET) and 44% weremultidimensionally poor. Our results show an existent burden of hypertension (5%) and central obesity(37%) as well as high levels of depression (43%) and psychological distress symptoms (44%). AYLHIVfurther self-reported high levels of household food insecurity (70%), low fruit and vegetable consumption,high fast-food and sugar-sweetened beverage intake, low nutritional knowledge and insu�cient physicalactivity. Beyond the NCD risk attributable to HIV and ART, these multiple risk factors further increase NCDrisk.
Conclusions: Our �ndings highlight the importance of integrated prevention with NCD risk screening aspart of HIV care for AYLHIV and the need for early intervention on social, environmental and economicdeterminants of NCDs targeting adolescents and youth.
BackgroundGlobally, non-communicable diseases (NCDs) are the leading cause of disability and premature mortalityaccounting for 71% of deaths worldwide and 80.6% of years lived with disability (YLD) in 2016 [1,2].NCDs are rising globally and affect low- and middle-income countries (LMICs) disproportionately, withmore than three-quarters of NCD deaths occurring in LMICs [3]. Of note, unhealthy diets and physicalinactivity which are signi�cantly associated with obesity, diabetes, cardiovascular disease and cancersare rising globally, particularly in LMICs [2,4,5]. ()()()
In 2017, the burden of NCDs in sub-Saharan Africa (SSA) was higher than the global average, almostequivalent to the total burden associated with communicable, maternal, neonatal, and nutritional (CMNN)diseases [6], with rapid urbanization contributing to unhealthy diets and sedentary behaviour, especiallyamongst the poor residing in urban settings [7]. Epidemiological analyses from 1980–2014 show thatage-standardized average body mass index (BMI) and diabetes prevalence have increased steadilyacross Africa, at least as steeply as the global average [8].
Page 3/44
In South Africa, an upper-middle-income country, the prevalence of NCDs and NCD risk factors hasincreased over the last two decades. South Africa is said to be undergoing rapid epidemiologicaltransition with a quadruple burden of disease [9]. To illustrate, the prevalence of overweight and obesityamong adult South African women increased from 56% to 68% between 1998 and 2016 [10] and 51% ofdeaths were attributable to NCDs in 2016 [11]. One in three South African adults has hypertension, 16.2%smoke daily [12], 18.3% engage in heavy episodic drinking [13] and more than 30% of females and aquarter of males reported experiencing psychological distress [12].
Importantly, this rising NCD risk is also occurring in children and adolescents [14]. Adolescence is acritical period of both opportunity and risk accompanied by rapid physical and psychologicaldevelopment that sets the foundation for adult health [15,16]. Many NCD-related risk factors are initiatedor reinforced during adolescence, which makes it a critical period for intervention to prevent futuredisease. Despite knowledge that many of these diseases and risk factors start in adolescence, there hasbeen little focus on NCD prevention in this age group. South Africa has the highest prevalence ofchildhood and adolescent overweight and obesity in sub-Saharan Africa (19% of boys and 26% of girlsunder 20 years) rivalling that of many high-income countries [17]. Overweight and obesity rates haveincreased steadily especially amongst adolescents residing in urban settings [18] with over 40% of youngpeople reporting insu�cient levels of physical activity, and 30% spent more than three hours per daysedentary [14].
NCDs in LMICs are occurring in the context of persisting high infectious disease prevalence [19]. In SouthAfrica, this is occurring alongside a persisting high burden of HIV/AIDS and tuberculosis [20]. SouthAfrica has the largest HIV epidemic and antiretroviral treatment (ART) programme in the world, with 7.5million people documented to be living with HIV in 2019 and 5.2 million on ART [21]. Of note, this includesadolescents and youth, with South Africa reporting the highest burden of adolescent HIV globally [22]. Ofthe 1.6 million adolescents reported to be living with HIV worldwide in 2018, 19% are South African [22].
HIV and ART are associated with several NCDs. Evidence on increased prevalence of NCD comorbiditieshas been documented in adults living with HIV (PLHIV) [23], with an excess burden of NCD risk factors inPLHIV compared to the general population [24]: 49% are insu�ciently physically active [25], 40–70% arecurrent smokers [26,27] and 37-66% are current drinkers [28,29]. In South Africa, almost half of adultpatients attending HIV clinics in Cape Town engaged in hazardous alcohol use, and 15% had problematicdrug use [30].
Adolescents and Youth living with HIV (AYLHIV) face elevated health risks [31,32] with similarcomorbidity patterns to adults identi�ed in paediatric and adolescent cohorts worldwide as aconsequence of HIV and long term ART but not necessarily in the context of rapid epidemiologicaltransition Of note, given that AYLHIV routinely access care, and are potentially additionally vulnerable toNCDs, there is an opportunity for early intervention to identify risk factors and prevent othercomorbidities. Where these services have been integrated with HIV care among adolescents and youth,such services have largely focused on reproductive health [33,34] with little to no focus on NCDs.
Page 4/44
A previous study explored this missed opportunity in Cape Town reviewing clinical folders of AYLHIV toidentify the extent to which NCD risk factor screening is routinely implemented. This study demonstratedthat despite evidence of existing NCD comorbidity and risk factors in AYLHIV, there was limitedintegration of NCD screening and health promotion in adolescent and youth HIV healthcare services [35].This raises questions about the true prevalence of NCD multimorbidity in this population group needed toinform service delivery.
Of note, while previous studies of AYLHIV in SSA have described risks associated with sexual behaviour[36,37] tobacco and substance use [38,39], there is overall data paucity on the breadth of NCDs andassociated risk factors in this population group in SSA. With the �rst cohorts of AYLHIV now enteringadulthood and the move towards more comprehensive health services aimed at improving the quality oflife of PLHIV, questions remain on the prevalence of NCD comorbidity and NCD risk factors in AYLHIV andthe best way to ensure holistic adolescent health and well-being.
We thus aimed to assess the prevalence of the most commonly occurring NCDs and risk factors thatcould bene�t from early intervention, with a focus on cardiometabolic, respiratory and mental healthconditions and risk factors in AYLHIV accessing primary health care in urban Cape Town.
MethodsStudy Setting and Population
We conducted a cross-sectional study of AYLHIV aged 15 - 24 years attending primary care healthfacilities in Cape Town. Cape Town is the second biggest metropolitan city in South Africa with anestimated population of 4.2 million people [40]. In 2016, adolescents and youth aged 15 - 24 yearscomprised 16.3% of the population in the Western Cape province, within which Cape Town is located [10]. NCDs and HIV are ranked amongst the top causes of premature deaths in the City of Cape Town [41],with the top �ve causes of death in 2016 ranked as diabetes mellitus, HIV, ischaemic heart diseases,cerebrovascular diseases and TB [42].
The City of Cape Town delivers primary health care through four legislated substructures: Khayelitsha /Eastern, Mitchells Plain / Klipfontein, Western / Southern and Northern / Tygerberg [41]. Recruitment anddata collection took place at six public sector HIV clinics, with 1 - 3 clinics selected within each of the foursub-structures (Figure 1). These facilities serve patients living in peri-urban, high-density, low-incometownships, collectively known as the Cape Flats
Study Design and Sampling
The sample size was determined using prevalence estimates for obesity (for which data are readilyavailable) from the South African National Health and Nutrition Examination Survey 2012 for the 15 - 24years age group [12]. The con�dence level was set at 95%, with a 5% degree of precision, and an obesityprevalence of 5.6%, yielding a minimum required sample size of 86, adjusted for a 5% non-response rate.
Page 5/44
Prior to data collection, we conducted stakeholder engagement, liaising with facility managers and youthhealthcare providers to optimise recruitment strategies for each clinic. We previously described themethod used to estimate the number of AYLHIV accessing care at each facility [35]. Details of the studywere shared at each AYLHIV clinic and a convenience sampling approach was used. Participantrecruitment commenced in March 2019 after ethical clearance was obtained from the University of CapeTown Faculty of Health Sciences Human Research Ethics Committee (HREC ref no: 520/2017) andapproval from Provincial and Local Government Departments of Health. Parents or legal guardians gavepermission for their children to participate in the study, and participants provided informed assent (orconsent if 18 years or older). Recruitment and study procedures were then conducted after gaining writteninformed consent and assent at six facilities until January 2020 (Figure 1). Participants receivedreimbursement for transport costs.
Figure 1: Participant Recruitment and enrolment at respective facilities
Study Procedures
Socio-demographic characteristics
Adolescence: can be categorized into three primary developmental stages; early adolescence (10 - 14years), middle adolescence (15 - 17 years), and late adolescence / young adulthood (18 - 24 years) [43].For the purposes of this study, we categorized participants into four age groups in line with these stages,further sub-dividing the oldest age group as follows: 15 - 17, 18 - 19, 20 - 21 and 22 - 24 years.
Deprivation: Questions on socioeconomic status were derived from the 2011 South African Census [44]and deprivation assessed using the Youth Multidimensional Poverty Index (YMPI) comprising elevenweighted indicators in �ve dimensions: educational attainment, general health and functioning, livingenvironment, household assets and employment [45]. An individual was de�ned as beingmultidimensionally poor – MPI poor– if they were deprived in a third or more of the weighted indicators,with a composite score ≥ 33.3% [45].
Food insecurity: was measured using the Household Food Insecurity Access Scale (HFIAS) score [46].Participants were categorized as living in food secure, mildly–, moderately–, or severely food insecurehouseholds according to the HFIAS protocol [47].
Behaviour and Knowledge
Physical activity: was assessed using the International Physical Activity Questionnaire (IPAQ) [48],validated in youth and adults in South Africa [49]. We used the Ainsworth et al. scoring algorithms toderive an average metabolic equivalent of task (MET) intensity level score for each type of physicalactivity: vigorous, moderate, walking and cycling [50]. Physical activity levels were further categorizedaccording to the IPAQ scoring protocol into low, moderate and high [51]. Insu�cient physical activity wasde�ned as a score below 600 MET minutes/week [52]. The presence or absence of sedentary behaviour
Page 6/44
was dichotomized as spending three or more hours per day watching television, playing computer games,talking with friends or other sitting activities [53].
Dietary intake: was assessed using a 23-item food frequency questionnaire (FFQ) adapted from theHealth Behaviour in School-aged Children Survey [54] validated for use in adolescents [55]. We estimatedthe proportion who ate fresh fruits and vegetables daily (once or more than once a day in the previousweek) and frequently (on four or more days in the previous week) and the proportion of respondents whoreported daily consumption of sugar-sweetened beverages (SSB), deep-fried foods, fast foods, saltysnacks, and processed meats. Skipping breakfast was de�ned as eating breakfast on 0 - 2 days/week;semi-skipping, 3 - 4 days/week and not skipping, 5 - 7 days/week.
Nutritional knowledge: was assessed using a revised General Nutrition Knowledge Questionnaire (GNKQ-R), validated for use in young people [56]. A nutritional knowledge score was generated by totallingcorrect answers in four nutrition domains. The maximum possible score was 88; 18 for questions on“dietary recommendations”, 36 for questions on food groups, 13 for “healthy food choices” and 21 for“associations between diet and disease”. No norms exist to determine an adequate nutrition knowledgescore [57]. Hence we computed the average nutrition knowledge score and compared the mean scores foreach of the nutrition domains by gender and age groups comparable to a previous study of South Africanadults [58]. The percentage of respondents who answered the questions correctly in each domain wascalculated.
Comorbidities
Respiratory disease: was de�ned as self-reported pre-existing diagnosis of asthma, tuberculosis,bronchitis, or other lung disease. Experiencing any of the following symptoms in the preceding threemonths was characterized as presence of respiratory symptoms: prolonged cough with sputum for morethan two weeks, chest tightness, shortness of breath, di�culty breathing; or having an abnormal peak�ow reading (using a hand-held peak �ow meter in accordance with standard guidelines [59]).
Diabetes: was de�ned either as i) a pre-existing self-reported diagnosis; ii) a random blood glucosereading of > 7 mmol/l (using a point-of-care (POC) glucometer with reactive test-strips (GlucocheckEvolve ® Homemed Pty) and having a family history of diabetes; or iii) a random blood glucose readingof > 7 mmol/l and experiencing diabetes-related symptoms over the past three months: frequenturination, increased thirst, unexplained weight loss of more than 1.5 kg in the last month, unexplainedfatigue, blurry vision.
Blood pressure: Sitting blood pressure (BP) was measured using a Rossmax automatic blood pressuremonitor (Rossmax (Shanghai) Incorporation Ltd) using the South African hypertension practiceguidelines [60].
Depression and psychological distress: were de�ned using symptom screening questions from the 10-item Centre for Epidemiological Studies Short Depression Scale (CESD-10) [61,62] and the Kessler
Page 7/44
Psychological Distress Scale (K10) [63]. Both tools have been validated in South African PLHIV [64,65]and in adolescents and young adults [66]. Depression was de�ned as a binary indicator using a cut-offscore of 10 or more on the CESD-10 scale [61] and the likelihood of psychological distress wascategorized according to the K10 score: K10 < 20: mentally well; K10 20 – 24: likely to have mildpsychological distress; K10 25 – 29: likely to have moderate psychological distress; K10 30 – 50: likely tohave severe psychological distress [67].
Overweight and obesity: Height, weight and waist circumference (WC) were measured according to theWHO STEPS Protocol [68]. The abdominal obesity cut-off point for a high WC was ≥ 102 cm in malesand ≥ 88 cm in females and a waist-hip ratio (WHR) > 0.85 for females and > 0.90 for males [68]. Waist-to-hip ratio was calculated by dividing the WC by the hip circumference in centimeters rounded to twodecimal places. A threshold value of 0.5 for the waist-to-height ratio (WHtR) was used as a measure ofcentral obesity, calculated by dividing the WC by the height in cm [69].
Statistical Analysis
Graphical data exploration and Shapiro-Wilk’s tests were used to test for normality of variables. All datawere analysed and strati�ed by sex and age. Demographic and socioeconomic variables were describedusing summary statistics (frequencies, percentages, median and interquartile range (IQR)).Characteristics between sexes and age groups were compared using Pearson’s χ2 and Fisher’s exact testsfor categorical measures. The Wilcoxon-Mann-Whitney test was used to compare medians betweengroups and the Kruskal-Wallis test was used for comparing continuous measures in more than twogroups. All tests of signi�cance were two-tailed and performed at the 5% signi�cance level. Data analysiswas conducted using Stata version 14.0 (StataCorp, College Station, Texas, USA).
ResultsSocio-demographic baseline characteristics
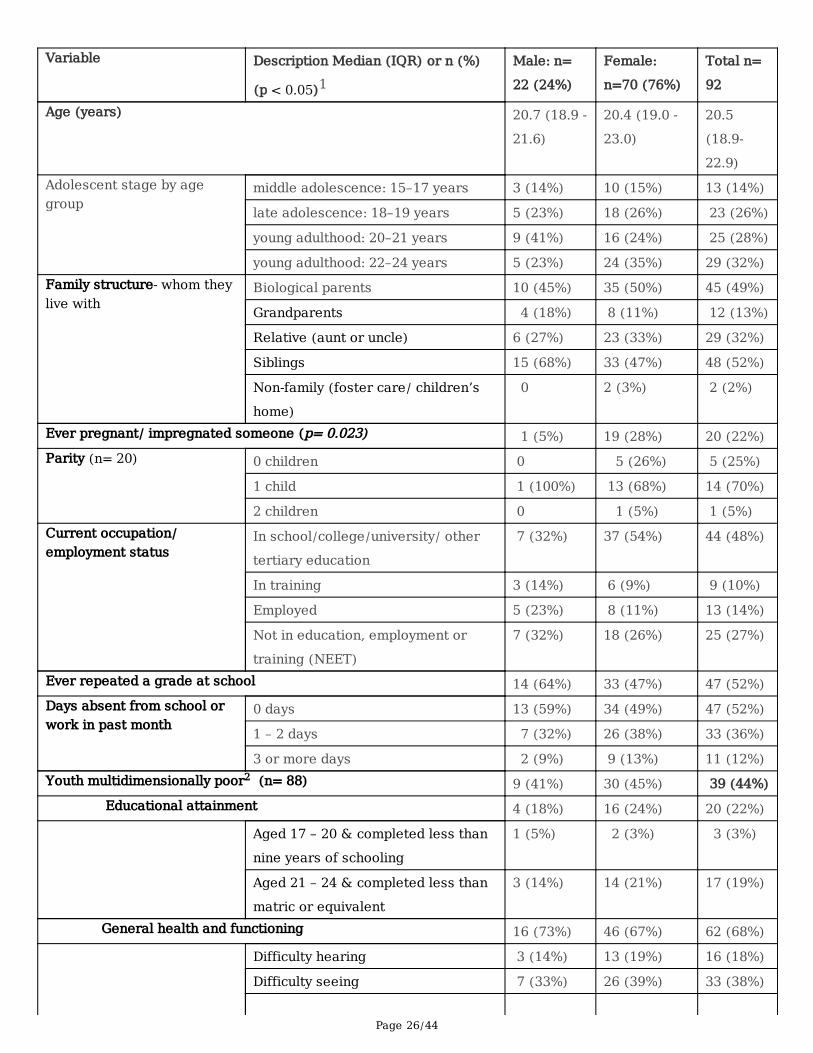
A total of 176 adolescents and youth were recruited and invited to participate, of which 92 weresuccessfully interviewed. The majority (76%) were female and the median age was 20.5 years (IQR 18.9–22.9)(See Table 1). The majority lived with a biological parent or a relative. More than a quarter of femalerespondents reported ever being pregnant. Overall, 44% of participants can be considered multi-dimensionally poor as they were deprived in a third or more of the �ve dimensions of MPI indicators(Table 1). More than half were living-environment deprived with over a third living in informal housing,28% living in households that do not use electricity, gas or solar power for heating and 17% living inhouseholds without piped water available on site. Almost a quarter of respondents were deprived ineducational attainment and 39% were economically deprived: 27% were neither in education,employment or training (NEET) , while 15% were living in households with no employed adults of workingage and 3% were deprived in both economic indicators. The majority of participants were living in foodinsecure households with 38% considered as severely food insecure: either having to cut back on mealsize, number of meals or going a whole day and night without eating in the last month.
Page 8/44
Behaviour and Knowledge
Physical activity
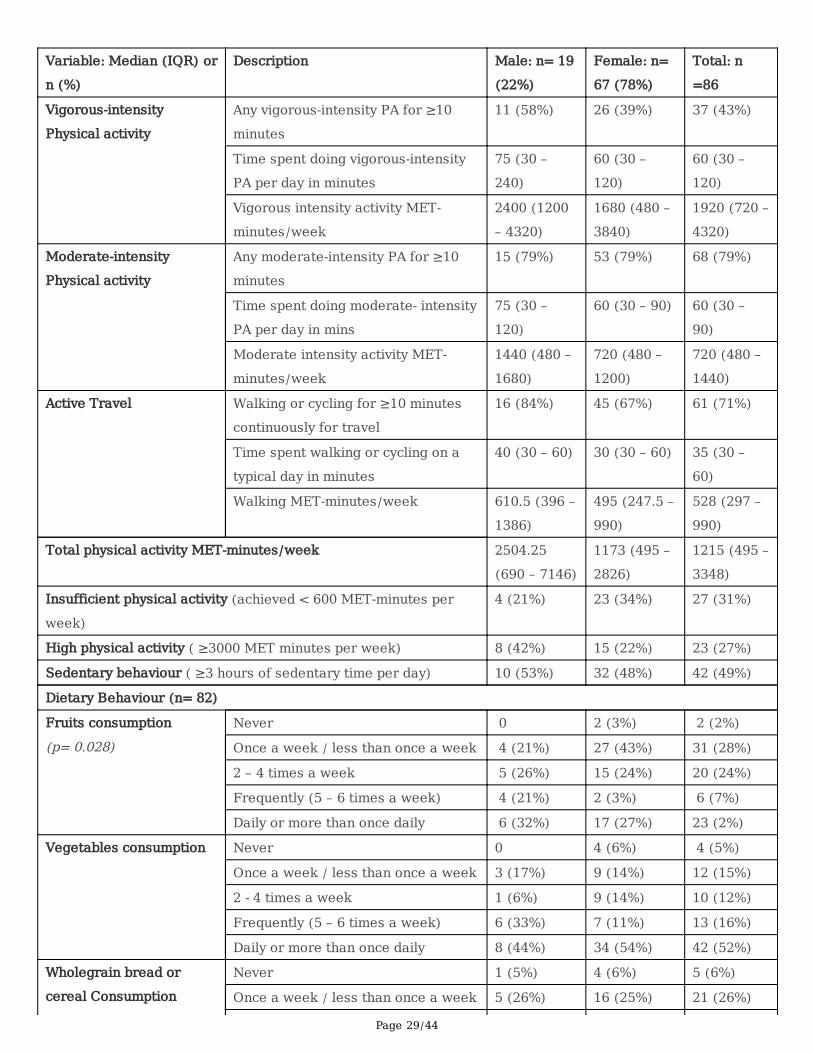
Overall, a third of respondents had insu�cient levels of weekly physical activity, 41% had moderate levelsand 27% had high levels of physical activity. A greater proportion of males had high levels of physicalactivity compared to females (44% vs 22% respectively). The total median MET-minutes of physicalactivity a week including active transport) was higher for males compared to females, but this was notstatistically signi�cant (Table 2). The youngest age group reported the highest rates of vigorous-intensityphysical activity (Table 3). Over two-thirds of all participants (84% males; 67% females) reported usingactive transport in the preceding week (mostly walking to school/work for at least ten minutescontinuously). Almost half of respondents spent more than three hours sedentary during a typical day,with no difference in sedentary behaviour by gender.
Dietary intake
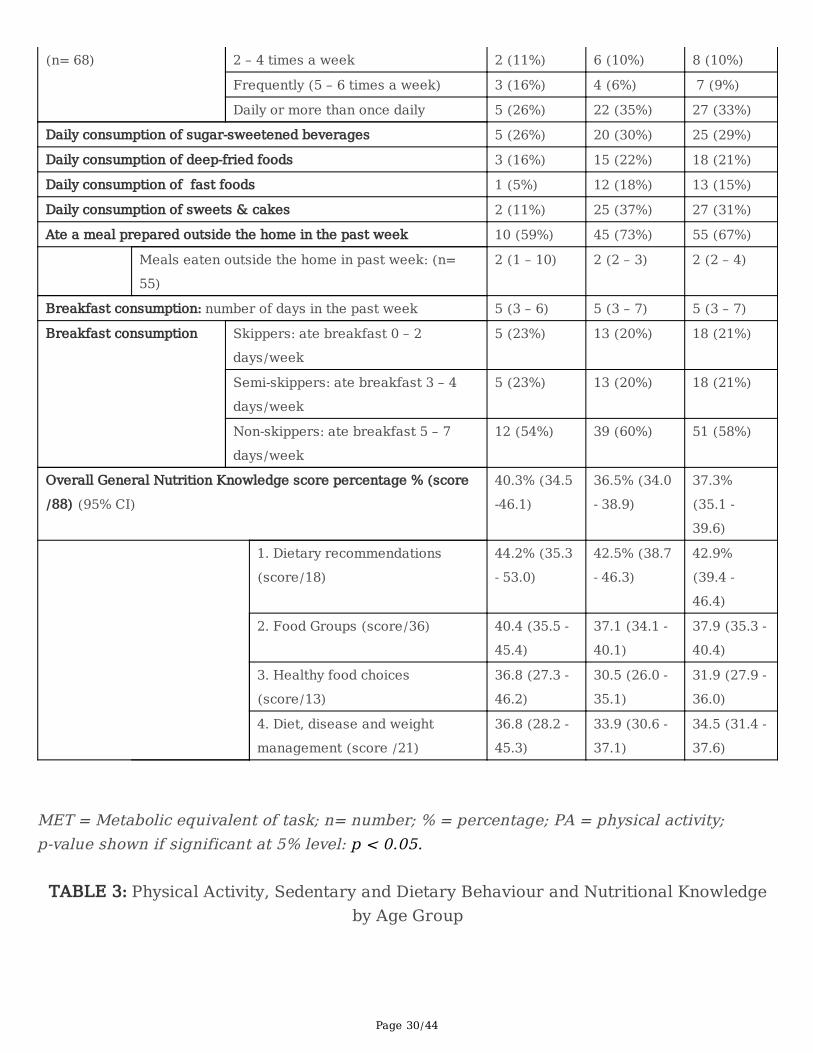
Overall, less than a third of respondents ate fruits and wholegrains daily (Table 2) with signi�cantly moremales reporting eating fruit frequently compared to females. More than half ate vegetables daily (eitherdark green, orange or other vegetables) and younger adolescents had the lowest daily consumption offruits, vegetables and wholegrains compared to older age groups. A third of respondents had a highdietary intake of sugar; either reporting drinking SSB daily or eating sweets and cakes daily. SSBconsumption was similar across gender and age groups. Older adolescents aged 18–19 years had thehighest daily consumption of deep-fried and fast foods compared to other age groups (Table 3).
Meals eaten outside the home
Two-thirds of respondents ate at least one meal that was prepared outside the home in the previousweek. Those who ate food prepared outside the home, ate a median of two take-away or sit-down mealsin the past week (IQR 2–4 meals). Males had a larger variability in meals consumed that were preparedoutside the home compared to females.
Breakfast
Over half of participants reported eating breakfast on at least �ve days in the previous week, one in �veparticipants ate breakfast on 3–4 days in the week and one in �ve reported skipping breakfast or eatingbreakfast on less than two days in the previous week. Skipping breakfast did not differ signi�cantly bygender or age.
Nutrition Knowledge
Overall, the mean GNKQ-R score achieved by adolescents was 33 out of a total of 88 points (37.5%).Knowledge of dietary recommendations was the highest-scoring domain with an average of 44% while
Page 9/44
knowledge of healthy food choices was the lowest-scoring domain at 32% average score.There were nosigni�cant differences in nutrition knowledge amongst adolescents by sex and age group (Figure 2).
Comorbidities and symptom screening
Respiratory diseases and symptoms
TB was the most common pre-existing comorbidity reported by 23% of participants. Less than 5% had aprevious diagnosis of asthma (Table 4). Eleven participants (12%; 95% CI: 6.3–21%) reportedexperiencing one or more respiratory symptoms over the past three months. Peak �ow measurement wasperformed for �ve participants who reported respiratory symptoms but had no known asthma diagnosis.All the measurements were within the normal –green– peak �ow zone.
Diabetes
Only one participant (who also reported diabetes symptoms) reported a previous diabetes diagnosis. Aquarter of participants (95% CI: 16–35%) reported experiencing one or more diabetes-related symptomsover the past three months (Table 4). Younger age groups (15–17 years and 18–19 years) reported morediabetes-related symptoms compared to older age groups (Table 5). Overall, 27% reported a familyhistory of diabetes (95% CI: 18–37%). Of those with reported symptoms or a reported family history ofdiabetes who had their blood glucose measured (n = 31), none had a measured random blood glucose ofmore than 7 mmol/L.
Blood Pressure
Overall, 20% had an elevated blood pressure and 5% had hypertension. Figure 4 shows that theprevalence of elevated blood pressure and hypertension was higher in males compared to females (p=0.0367). Systolic and diastolic blood pressure showed an increasing trend with age (Table 7). Themedian age of those with elevated blood pressure or hypertension was 21.2 (IQR 18.8 – 22.7) years,similar to those with normal blood pressure (median 20.2, IQR: 19.0 – 22.8 years). Of those with elevatedblood pressure or hypertension,11 (35%) were overweight or had obesity and 2 (6%) reported a previousdiagnosis of hypertension (data not shown in tables).
Depression and psychological distress
More than two-�fths of participants reported experiencing signi�cant depression in the past week (95%CI: 32–54%). Female participants were signi�cantly more likely to report depressive symptoms comparedto males (Table 4 and Figure 3). Of those with signi�cant depression, 6/35 (17%) reported a previousdiagnosis of depression or anxiety. There were no signi�cant differences in depression scores by age.Almost half the participants reported some level of psychological distress over the past month. Only 11%of those with mild to severe psychological distress reported previously being diagnosed with depressionor anxiety. The prevalence of psychological distress symptoms was comparable across age groups(Table 5).
Page 10/44
Overweight and obesity
A quarter of participants were overweight and 11% had obesity, with signi�cant differences by gender(Figure 5). The median BMI for males was signi�cantly lower than for females. A greater proportion ofparticipants aged 18–19 years were overweight or obese compared to the other age groups (Table 5).
Abdominal obesity
There was a markedly signi�cant difference in the waist-hip ratio (WHR) of males and females, with morethan a quarter of females and no males with central obesity (Table 4). Using the WHtR, 44% of femaleshad central obesity compared to 14% of males. WC increased with age, with those aged 22–24 yearshaving the highest WC, but WHR did not differ by age. It is important to note that a quarter of participantswith normal BMI had abnormal WHR and/or WHtR and could be classi�ed as having central obesity.
DiscussionThis study describes the prevalence of NCDs and NCD risk factors among South African AYLHIV in anurban setting. Previous studies in SSA have described NCD comorbidities in adults living with HIV [23].Few studies have assessed the prevalence of NCDs and particularly NCD risk factors in AYLHIV in SSA.Risk behaviour research on AYLHIV in SSA has predominantly focused on sexual risk behaviour [70]. Wetherefore set out to investigate NCD multimorbidity and risk factors in this population group given theemerging NCD epidemic in SSA occurring against a background of a high HIV burden and increasedcomorbidity risk in PLHIV.
We highlight several key �ndings. Almost half of our participants experienced signi�cant symptoms ofdepression and psychological distress. More than a third were overweight or obese, a third hadinsu�cient levels of weekly physical activity and the majority did not meet dietary guidelines for fruit andvegetable intake. There was low nutritional knowledge, particularly on healthy food choices and diet-disease relationships. A detailed interpretation of these �ndings, comparisons to the general populationand previous �ndings in PLHIV as well as implications for integrated prevention are discussed below.
More than two-thirds of our respondents were female which re�ects the gendered nature of the HIVepidemic in South Africa [71], and much higher rates of health care-seeking among young womencompared to young men [72]. A greater proportion of AYLHIV in this study were multidimensionally poorcompared to national estimates which indicate that 33.4% of young people aged 15 - 24 years are MPIpoor [73]. Although the proportion of NEETs in this study was lower than the national average of 34% [74],they experienced other dimensions of deprivation which may interact to exacerbate vulnerability to NCDs.
Previous studies in South Africa corroborate the �ndings that HIV/AIDS-affected and infected youth facemultiple deprivations of poverty [75,76], and food insecurity [77], which are commonly cited challengesfor adolescents receiving HIV treatment and care in SSA. This is concerning because socioeconomic
Page 11/44
factors impact adherence to ART and retention in HIV care, which has implications for viral suppressionand chronic disease pathways [78,79]. Addressing this challenge requires a multi-sectoral approach forNCD prevention with appropriate social protection systems to meet the needs of AYLHIV.
With respect to NCD risk factors associated with behaviour and knowledge, we found that almost three-quarters of AYLHIV did not meet recommended dietary guidelines of eating at least �ve portions of fruitand vegetables daily necessary to reduce the risk of NCDs [80]. Compared to provincial estimates foryouth in the Western Cape, more respondents, particularly females, consumed deep-fried foods and fast-foods daily, while the proportion who consumed SSB daily was lower than the provincial average (42%)[10] and estimates from 44 other LMICs (44%) [81]. A meta-analysis on SSB intake found that individualswho consumed 1–2 servings per day had a 26% greater risk of developing type 2 diabetes mellitus(T2DM), and a 20% greater risk of metabolic syndrome compared to those who did not consume SSB orhad less than one serving/month [82]. Although the South African government has made strides inpromoting healthier food environments by implementing mandatory legislation for salt reduction inprocessed foods [83] and a tax on SSB [84], our �ndings suggest that greater efforts are needed totranslate these measures into action at a community and household level, especially amongst young girlswho have higher prevalence of obesity which is likely to persist until adulthood without intervention.
Our results support �ndings of gender differences in physical activity levels among South Africanadolescents similar to global reports [85,86]. More than two-thirds of our respondents used activetransport; either walking to and from school or work. This is notable and important that futureinterventions to increase physical activity consider strategies to retain this healthy behaviour. However,fewer than one-third had su�cient levels of physical activity necessary to promote health and preventchronic diseases. This is similar to physical inactivity levels reported in urban-based South Africanstudents [85]. The proportion who spent more than three hours per day sedentary was higher than generalpopulation estimates of 30% [14] and higher than estimates from other LMICs of 27% [81].
Our results are consistent with those from a study conducted in Botswana which found that youth livingwith HIV had signi�cantly lower levels of daily physical activity compared to HIV negative controls [87].Similarly, a study in Brazil in 10–15-year-old perinatally-infected adolescents found that participantsliving with HIV had lower physical activity scores compared to healthy peers [88]. Additional research isneeded in this setting to explore the relationship between physical activity and HIV in adolescents. Astudy with an age-and sex-matched HIV-negative control group from the same community would help toelucidate whether this relationship exists in South Africa.
Participants scored low on general nutrition knowledge questions and particularly had poor knowledge ofhealthy food choices and associations between diet and diseases. To our knowledge, this is the �rststudy to assess nutrition knowledge in AYLHIV in Africa. A South African study in school-goingadolescents aged 15–18 years found that 77.5% scored below average on diet and nutrition knowledgequestions [89]. The poor knowledge on nutrition-related NCDs amongst AYLHIV in our study is concerningin a country undergoing nutritional transition [90]. Nutrition knowledge is strongly correlated with dietary
Page 12/44
intake and is needed for better dietary habits [57]. Although adolescents may lack autonomy innavigating their food environment, this life stage is characterised by increasing independencehighlighting the importance of good dietary knowledge including how diet affects their current and futurehealth [89] to support making healthier food choices.
Our blood pressure �ndings are consistent with �ndings from studies in adolescents in the generalpopulation of urban South Africa which have reported hypertension prevalence rates ranging from 8–16%[91] and elevated BP prevalence of 35% [92]. A study in the United States reported a signi�cantly higherprevalence of elevated blood pressure in a cohort of HIV-infected, predominantly African-Americanadolescents and young adults compared to healthy children [93]. Globally, studies involving HIV-infectedadults have demonstrated higher hypertension prevalence than the general population [94] andhypertension has been found to be associated with ART [95,96]. One in �ve young adults (18–35 years)attending an HIV clinic in the same setting in Khayelitsha were found to have comorbid hypertension [97].There are con�icting data on the link between HIV infection and elevated BP in paediatric populations.Nevertheless, our �ndings support the need for routine monitoring of BP in HIV care, even in youngerpopulations, in settings like South African with a high background prevalence of hypertension, in order toavert future disease.
None of those with self-reported diabetes symptoms had an abnormal random blood glucose. In a cohortstudy of South African youth living with perinatally-acquired HIV, the authors found a high prevalence ofinsulin resistance but this did not differ from that in HIV-negative age-matched adolescents [98]. Asystematic review and meta-analysis of African studies recently reported that there was no statisticallysigni�cant association between HIV infection or ART exposure and T2DM in adults [99]. This is incontrast to �ndings from European and North American studies that have shown a higher prevalence ofT2DM in HIV-positive adults particularly those on ART [100-102]. The International Diabetes Federation(IDF) estimates that 60% of people with diabetes in Africa are undiagnosed [103] suggesting that T2DMmight be a major, underdiagnosed public health problem in African populations in general, warrantingfurther attention.
We found high levels of depression and psychological distress in our study compared to less than aquarter of young people nationally [12]. Concerningly, only 11% of those with mild to severe psychologicaldistress reported previously being diagnosed with a mental health condition highlighting a signi�cant gapin care. Mental health conditions are prevalent in AYLHIV in both high-income and resource-limitedsettings [104]. Our results are generally consistent with prevalence rates of depression among childrenand adolescents living with HIV from other African countries ranging from 18.9% in Malawi [105] to51.2% prevalence of psychological distress in Uganda [106].
Notably, signi�cantly more female participants reported depressive symptoms compared to males whichis in line with global statistics on depression [107]. Our �ndings show that only 17% of those identi�ed ashaving signi�cant depression reported being previously diagnosed with anxiety or depression. In aprevious retrospective review in the same population, mental health conditions were documented in less
Page 13/44
than 5% of clinic records reviewed [35]. In a recent study conducted in South Africa, the authors foundsimilar rates of mental illness in perinatally-infected and uninfected adolescents, suggesting that otherprevalent social factors in the community may override the effect of HIV, especially in the ART era [108].Nevertheless, these �ndings highlight that there is a signi�cant missed opportunity for identifying youthwith mental health problems in our setting.
More than a third of our respondents were overweight or had obesity, with signi�cantly more overweightand centrally obese females compared to males. Although our rates of overweight and obesity areslightly lower than prevalence rates for youth in the Western Cape (31.5% overweight and 11.3% obese)[14], our rates appear similar to obesity trends in the general population. A previous study in adultpatients attending primary health care HIV-clinics in South Africa found that more than half of femalepatients were overweight or had obesity compared to 16% of male patients [109]. Obesity in PLHIV is welldocumented in high-income countries and is emerging as a major challenge in Africa [24] with several studies showing increased rates of obesity in PLHIV [109,110]. But few studies in Africa have reported onoverweight and obesity levels in AYLHIV other than in the context of ART-associated dyslipidaemia[87,111,112]. One study conducted among South African university students living with HIV (the majorityaged 20–25 years) found that 21% were overweight and 30% had obesity [113]. Our results are consistentwith these �ndings and con�rm results from a folder review conducted in this same population thatreported similar levels of overweight and obesity [35].
In addition to BMI, we assessed central obesity using waist and hip circumference indicators and foundthat 26% of our respondents with normal BMI had high WHR or WHtR, meeting criteria for central obesity.Another South African study in adults attending three HIV-clinics reported a high prevalence of centralobesity, primarily in women – 45% (4% in men) [113].
Implications for integrated care
Our �ndings underscore the importance of anthropometry beyond BMI, especially in females. In acomparison of anthropometric measures in HIV patients in Cameroon, Dimala et al found that markers ofadiposity like WC, WHR and WHtR are better than BMI at identifying HIV/AIDS patients with increasedcardiometabolic risk [114]. In our study, obesity co-occurred with hypertension – 35% of those withelevated BP or hypertension were also overweight or obese (data not shown). By screening for obesity,other related conditions which tend to cluster with obesity can also be detected. Given thatanthropometric measurements and calculations are non-invasive, low-cost and easy-to-use interventions,our �ndings support the need to integrate this screening into routine care to identify AYLHIV who are atincreased cardiometabolic risk and intervene early as they transition into adulthood, especially withprolonged exposure to ART regimens which are linked to obesity, altered glucose metabolism anddyslipidaemia [115]. This is supported by the WHO and the IDF who recommend monitoring changes inWC in addition to measuring BMI, particularly in HIV-positive populations on ART and in female patientswho have a higher prevalence of obesity [68,116].
Page 14/44
Recommendations calling for integration of mental health services into HIV care have been made foradults [117] given the multiple psychological vulnerabilities associated with living with HIV and high ratesof suicide in PLHIV [118,119]. Our �ndings further support the need for integration of mental healthscreening in HIV care for AYLHIV. A study conducted in Johannesburg found that a simple way ofidentifying youth struggling with mental health problems at primary care level is by asking them abouttheir future aspirations. Those who do not feel like they have control of their future or do not have adream for the future were found to be more likely to have symptoms of depression, anxiety or PTSDrequiring further support [120].
The recently introduced integrated chronic disease management (ICDM) model in South Africarecognises the importance of monitoring both chronic communicable and NCDs in order to achieveoptimal clinical outcomes [121]. Our �ndings underscore the importance of applying an evidence-basedintegrated approach to the healthcare services for AYLHIV. In the context of resource limitations, furtherresearch exploring the multilevel determinants of these NCDs and their risk factors would be useful toinform tailored strategies to identify those at highest risk.
Strengths and Limitations
Our study adds to the limited evidence base on NCD prevalence and risk factors in AYLHIV in SSA. To ourknowledge, only four other studies in SSA have investigated modi�able NCD risk factors besides alcoholand substance use in AYLHIV [87,113,122,123]. While our study provides novel �ndings for the sub-Saharan African context, we note some limitations.
The low response rate and lack of random sampling may limit the generalizability of our �ndings,however sampling from six different facilities across all substructures in the City of Cape Town mitigatedunmeasured facility-speci�c effects. Although we recruited younger adolescents, requiring parentalconsent may have led to participant bias as the majority enrolled were older adolescents and youngadults who could provide independent consent to participate.
We utilised subjective recall methods to asses physical activity which may be prone to over-reporting,recall bias and cultural misinterpretation. However, self-report methods like the IPAQ have acceptablevalidity and have been widely used to measure physical activity in PLHIV in similar contexts allowing forsome comparability [25]. The use of POC random blood glucose testing may have underestimateddiabetes risk, however, POC methods are better suited for community screening of diabetes, have highspeci�city and provide reliable and immediate results [124]. Similarly, the mental health tools used arescreening and not diagnostic tools. But they are appropriate for case-�nding in primary care and havebeen validated in HIV-positive populations in South Africa [64,65]. Despite these limitations, this studyrepresents an important contribution to the limited literature on HIV / NCD multimorbidity in adolescentsand youth in SSA.
Conclusions
Page 15/44
This paper contributes to a key gap in the literature on NCD risk in AYLHIV in SSA. The �ndings highlightthe existence of cardiometabolic risk factors (obesity, abdominal obesity, hypertension, physical inactivity,unhealthy diet) and mental ill-health in this vulnerable population, highlighting the need for integratedcomprehensive care for AYLHIV with NCD screening and integrated primary and secondary prevention.
NCDs and their ensuing burden of disability and premature mortality are costly to health systems and towider societal development. Beyond primary care, the complex and interlinked social, economic andenvironmental factors that in�uence these behaviours highlight the importance of intersectoral action fordisease prevention. Addressing these root causes will therefore necessitate intervention beyond thehealthcare sector to address the social, economic and environmental exposures that increase the risk ofNCDs and ill-health, and to support equitable access to the necessary physical and social infrastructurerequired to make the healthy choice the easy choice. More studies are needed to assess risk factors at abroader socio-ecological level and explore inter-relationships between HIV / NCD comorbidity and themultilevel determinants of multimorbidity.
List Of AbbreviationsAYLHIV: Adolescents and youth living with HIV;
BMI: Body mass index;
BP: Blood pressure;
CESD-10: Centre for Epidemiological Studies Short Depression Scale;
CMNN: Communicable, Maternal, Neonatal, and Nutritional;
FFQ: Food frequency questionnaire;
GNKQ: General Nutrition Knowledge Questionnaire;
HFIAS: Household Food Insecurity Access Scale;
IDF: International Diabetes Federation;
IPAQ: International Physical Activity Questionnaire;
K10: Kessler Psychological Distress Scale;
LMIC: Low- and middle-income countries;
MET: Metabolic equivalent of task;
NCD: Non-communicable disease;
Page 16/44
NEET: Neither in education, employment or training;
PA: Physical activity;
PLHIV: People living with HIV;
PTSD: Post-traumatic stress disorder
SSA: Sub-Saharan Africa;
SSB: Sugar-sweetened beverages;
T2DM: Type 2 diabetes mellitus
WHO: World Health Organization;
WC: Waist circumference;
WHR: Waist-hip ratio;
WHtR: Waist-to-height ratio;
YMPI: Youth Multidimensional Poverty Index.
DeclarationsEthics approval and consent to participate: This study was performed in line with the principles of theDeclaration of Helsinki. Approval was granted by the Human Research Ethics Committee in the Faculty ofHealth Sciences at the University of Cape Town (HREC ref.no 520/2017), and the Health Research EthicsCommittees of the City of Cape Town and the Western Cape provincial government. Written informedconsent was obtained from all individual participants included in the study. Parental or caregiver writtenconsent and participant assent were obtained for participants younger than 18 years old.
Consent for publication: Not applicable.
Availability of data and materials: The data that support the �ndings of this study are not publiclyavailable due to the sensitive nature of information that could compromise minor research participants’privacy/consent but are available from the corresponding author MK on reasonable request.
Competing interests: The authors declare that they have no competing interests.
Funding: This work was supported by a Bristol-Myers Squibb Foundation grant awarded to TO (grantnumber 430960). MK was supported by the South African National Research Foundation (NRF) underjoint funding with the German Academic Exchange Service (DAAD) for her PhD. TO is also supported bythe National Institute for Health Research (NIHR) (Global Health Research Units and Groups Programme)
Page 17/44
for a Global Health Research Group and Network on Diet and Activity. The views expressed in thispublication are those of the authors and not necessarily those of the National Health Service (NHS), theNIHR or the Department of Health and Social Care. Funding from NIHR (16/137/34) is gratefullyacknowledged. The funding bodies had no role in the design of the study, data collection, analysis,interpretation of data or in writing the manuscript.
Authors’ contributions: MK and TO conceptualized the study. MK and BG conducted data collection. MKconducted data analysis and interpretation and wrote the �rst draft of the manuscript. TO contributed todata interpretation and manuscript preparation. All authors read and approved the �nal manuscript.
Acknowledgments: We appreciate the assistance from the City of Cape Town and Western CapeDepartments of Health who made access to the facilities and participants possible. We would like toacknowledge and thank the adolescents and youth who agreed to make themselves available to take partin this research and share their insights and experiences with us.
Authors’ information: See Title page.
References1. Naghavi M. Global, regional, and national burden of suicide mortality 1990 to 2016: systematic
analysis for the Global Burden of Disease Study 2016. BMJ. 2019:l94.
2. Vos T, Abajobir AA, Abate KH, et al. Global, regional, and national incidence, prevalence, and yearslived with disability for 328 diseases and injuries for 195 countries, 1990–2016: a systematicanalysis for the Global Burden of Disease Study 2016. The Lancet. 2017;390(10100):1211-1259.
3. World Health Organization. Noncommunicable diseases. 2018; Media centre, Fact sheet Available at:https://www.who.int/news-room/fact-sheets/detail/noncommunicable-diseases. Accessed 21 April2020, 2020.
4. Lee IM, Shiroma EJ, Lobelo F, Puska P, Blair SN, Katzmarzyk PT. Effect of physical inactivity on majornon-communicable diseases worldwide: an analysis of burden of disease and life expectancy. TheLancet. 2012;380(9838):219-229.
5. Forouzanfar MH, Afshin A, Alexander LT, et al. Global, regional, and national comparative riskassessment of 79 behavioural, environmental and occupational, and metabolic risks or clusters ofrisks, 1990–2015: a systematic analysis for the Global Burden of Disease Study 2015. The Lancet.2016;388(10053):1659-1724.
�. Gouda HN, Charlson F, Sorsdahl K, et al. Burden of non-communicable diseases in sub-SaharanAfrica, 1990–2017: results from the Global Burden of Disease Study 2017. The Lancet Global Health.2019;7(10):e1375-e1387.
7. Remais JV, Zeng G, Li G, Tian L, Engelgau MM. Convergence of non-communicable and infectiousdiseases in low-and middle-income countries. International journal of epidemiology. 2013;42(1):221-227.
Page 18/44
�. Kengne AP. Trends in obesity and diabetes across Africa from 1980 to 2014: an analysis of pooledpopulation-based studies. Int J Epidemiol. Oct 1 2017;46(5):1421-1432.
9. Mayosi BM, Flisher AJ, Lalloo UG, Sitas F, Tollman SM, Bradshaw D. The burden of non-communicable diseases in South Africa. The Lancet. 2009;374(9693):934-947.
10. National Department of Health (NDoH), Statistics South Africa (Stats SA), South African MedicalResearch Council (SAMRC), and ICF. South Africa demographic and health survey 2016. NDoH, StatsSA, SAMRC, & ICF. 2019.
11. World Health Organization. Noncommunicable diseases progress monitor 2020. Geneva: WorldHealth Organization; 10 February 2020 2020. 978-92-4-000049-0.
12. Shisana O. The South African National Health and Nutrition Examination Survey: SANHANES-1:HSRC press; 2013.
13. World Health Organization. Global status report on alcohol and health 2018: World HealthOrganization; 2019.
14. Reddy S, James S, Sewpaul R, et al. Umthente uhlaba usamila: the 3rd South African national youthrisk behaviour survey 2011. 2013.
15. Sawyer SM, A�� RA, Bearinger LH, et al. Adolescence: a foundation for future health. Lancet. Apr 282012;379(9826):1630-1640.
1�. Azzopardi P. Adolescent health comes of age. The Lancet. 2012;379(9826):1583-1584.
17. Ng M, Fleming T, Robinson M, Thomson B, Graetz N, Margono C et al. Global, regional, and nationalprevalence of overweight and obesity in children and adults during 1980–2013: a systematicanalysis for the Global Burden of Disease Study 2013. Lancet (London, England). 05/292014;384(9945):766-781.
1�. Rossouw HA, Grant CC, Viljoen M. Overweight and obesity in children and adolescents: The SouthAfrican problem. South African Journal of Science. 2012;108(5-6):31-37.
19. Dagadu HE, Patterson EJ. Placing a Health Equity Lens on Non-communicable Diseases in sub-Saharan Africa. J Health Care Poor Underserved. Aug 2015;26(3):967-989.
20. Pillay-Van Wyk V, Msemburi W, Laubscher R, et al. Mortality trends and differentials in South Africafrom 1997 to 2012: second National Burden of Disease Study. The Lancet Global Health.2016;4(9):e642-e653.
21. UNAIDS. Country factsheets: South Africa 2019. 2019;Available at:https://www.unaids.org/en/regionscountries/countries/southafrica. Accessed 17 January 2021,2021.
22. UNAIDS. Key HIV epidemiology indicators for children and adolescents aged 0-19, 2000-2018. 2019;Available at: http://aidsinfo.unaids.org/. Accessed 28 April 2020, 2020.
23. Patel P, Rose CE, Collins PY, et al. Noncommunicable diseases among HIV-infected persons in low-income and middle-income countries: a systematic review and meta-analysis. AIDS (London,England). 2018;32(Suppl 1):S5.
Page 19/44
24. Deeks SG, Lewin SR, Havlir DV. The End of AIDS: HIV Infection as a Chronic Disease. Lancet. 10/232013;382(9903):1525-1533.
25. Vancampfort D, Mugisha J, De Hert M, et al. Global physical activity levels among people living withHIV: a systematic review and meta-analysis. Disability and Rehabilitation. 2018;40(4):388-397.
2�. Reynolds NR. Cigarette smoking and HIV: more evidence for action. AIDS Educ Prev. Jun 2009;21(3Suppl):106-121.
27. Petrosillo N, Cicalini S. Smoking and HIV: time for a change? BMC medicine. 2013;11(1):16.
2�. Scott-Sheldon LAJ, Walstrom P, Carey KB, Johnson BT, Carey MP. Alcohol Use and Sexual RiskBehaviors among Individuals Infected with HIV: A Systematic Review and Meta-Analysis 2012 toEarly 2013. Current HIV/AIDS Reports. 2013;10(4):314-323.
29. Kalichman S, Mathews C, Banas E, Kalichman M. Alcohol-related intentional nonadherence toantiretroviral therapy among people living with HIV, Cape Town, South Africa. AIDS Care.2019;31(8):951-957.
30. Kader R, Govender R, Seedat S, Koch JR, Parry C. Understanding the Impact of Hazardous andHarmful Use of Alcohol and/or Other Drugs on ARV Adherence and Disease Progression. PLoS One.2015;10(5):e0125088.
31. Battles HB, Wiener LS. From adolescence through young adulthood: psychosocial adjustmentassociated with long-term survival of HIV. Journal of adolescent health. 2002;30(3):161-168.
32. Achwoka D, Waruru A, Chen TH, et al. Noncommunicable disease burden among HIV patients in care:a national retrospective longitudinal analysis of HIV-treatment outcomes in Kenya, 2003-2013. BMCpublic health. Apr 3 2019;19(1):372.
33. Beksinska ME, Pillay L, Milford C, Smit JA. The sexual and reproductive health needs of youth inSouth Africa–history in context. South African Medical Journal. 2014;104(10):676-678.
34. Nagata JM, Hathi S, Ferguson BJ, Hindin MJ, Yoshida S, Ross DA. Research priorities for adolescenthealth in low- and middle-income countries: A mixed-methods synthesis of two separate exercises. JGlob Health. Jun 2018;8(1):010501.
35. Kamkuemah M, Gausi B, Oni T. Missed opportunities for NCD multimorbidity prevention inadolescents and youth living with HIV in urban South Africa. BMC public health. 2020;20(821).
3�. Okawa S, Mwanza-Kabaghe S, Mwiya M, et al. Sexual and reproductive health behavior and unmetneeds among a sample of adolescents living with HIV in Zambia: a cross-sectional study. ReprodHealth. Mar 27 2018;15(1):55.
37. Toska E, Pantelic M, Meinck F, Keck K, Haghighat R, Cluver L. Sex in the shadow of HIV: A systematicreview of prevalence, risk factors, and interventions to reduce sexual risk-taking among HIV-positiveadolescents and youth in sub-Saharan Africa. PLOS ONE. 2017;12(6):e0178106.
3�. Jewkes R, Dunkle K, Nduna M, et al. Factors associated with HIV sero-status in young rural SouthAfrican women: connections between intimate partner violence and HIV. International Journal ofEpidemiology. 2006;35(6):1461-1468.
Page 20/44
39. Mbalinda SN, Kiwanuka N, Kaye DK, Eriksson LE. Reproductive health and lifestyle factorsassociated with health-related quality of life among perinatally HIV-infected adolescents in Uganda.Health and Quality of Life Outcomes. 2015;13(1).
40. Western Cape Government. 2017 Socio-economic Pro�le: City of Cape Town. In: Department ofSocial Development, ed. Cape Town2017.
41. Cape Metro Health Department. CAPE METRO DISTRICT HEALTH PLAN 2018/19 - 2020/21. In: DM T,ed. Cape Town2018.
42. Statistics South Africa. P0309.3 Mortality and causes of death in South Africa, 2015: Findings fromdeath noti�cation. Available at: http://www.statssa.gov.za/publications/P03093/P030932015.pdf.Accessed 15 June 2020.
43. Klein H. Adolescence, youth, and young adulthood: Rethinking current conceptualizations of lifestage. Youth & society. 1990;21(4):446-471.
44. Statistics South Africa. Census Questionnaire. 2011; Available at: http://www.statssa.gov.za/?page_id=3852. Accessed 29 April, 2020.
45. Alkire S, Santos ME. Acute multidimensional poverty: A new index for developing countries. 2010.
4�. Ballard T, Coates J, Swindale A, Deitchler M. Household hunger scale: indicator de�nition andmeasurement guide. Food and Nutrition Technical Assistance II Project, FHI. 2011;360.
47. Coates J, Swindale A, Bilinsky P. Household Food Insecurity Access Scale (HFIAS) for measurementof food access: indicator guide: version 3. 2007.
4�. Craig C, Marshall A, Sjostrom M, et al. International Physical Activity Questionnaire-Short Form. 2017.
49. Craig CL, Marshall AL, Sjöström M, et al. International physical activity questionnaire: 12-countryreliability and validity. Medicine & science in sports & exercise. 2003;35(8):1381-1395.
50. Ainsworth BE, Haskell WL, Whitt MC, et al. Compendium of physical activities: an update of activitycodes and MET intensities. Medicine & science in sports & exercise. 2000;32(9):S498-S516.
51. IPAQ Research Committee. Guidelines for data processing and analysis of the International PhysicalActivity Questionnaire (IPAQ)-short and long forms. Available at: http://www. ipaq. ki. se/scoring.pdf. 2005. Accessed August 2020.
52. World Health Organization. WHO Global recommendations on physical activity for health. Geneva:World Health Organization; 2011. Geneva, Switzerland: World Health Organization; 2011.
53. Guthold R, Cowan MJ, Autenrieth CS, Kann L, Riley LM. Physical activity and sedentary behavioramong schoolchildren: a 34-country comparison. The Journal of pediatrics. 2010;157(1):43-49. e41.
54. Katzmarzyk PT, Barreira TV, Broyles ST, et al. The international study of childhood obesity, lifestyleand the environment (ISCOLE): design and methods. BMC public health. 2013;13(1):900.
55. Saloheimo T, González SA, Erkkola M, et al. The reliability and validity of a short food frequencyquestionnaire among 9–11-year olds: a multinational study on three middle-income and high-incomecountries. International Journal of Obesity Supplements. 2015;5(S2):S22-S28.
Page 21/44
5�. Kliemann N, Wardle J, Johnson F, Croker H. Reliability and validity of a revised version of the GeneralNutrition Knowledge Questionnaire. European journal of clinical nutrition. 2016;70(10):1174-1180.
57. Wardle J, Parmenter K, Waller J. Nutrition knowledge and food intake. Appetite. 2000;34(3):269-275.
5�. Karl Peltzer K-N. Nutrition knowledge among a sample of urban black and white South Africans.South African Journal of Clinical Nutrition. 2004;17(1):24-31.
59. Miller MR, Hankinson J, Brusasco V, et al. Standardisation of spirometry. European respiratoryjournal. 2005;26(2):319-338.
�0. Seedat Y, Rayner B, Veriava Y. South African hypertension practice guideline 2014. Cardiovascularjournal of Africa. 2014;25(6):288.
�1. Andresen EM, Malmgren JA, Carter WB, Patrick DL. Screening for depression in well older adults:Evaluation of a short form of the CES-D. American journal of preventive medicine. 1994;10(2):77-84.
�2. Radloff LS. The CES-D scale: A self-report depression scale for research in the general population.Applied psychological measurement. 1977;1(3):385-401.
�3. Kessler RC, Barker PR, Colpe LJ, et al. Screening for serious mental illness in the general population.Archives of general psychiatry. 2003;60(2):184-189.
�4. Myer L, Smit J, Roux LL, Parker S, Stein DJ, Seedat S. Common mental disorders among HIV-infectedindividuals in South Africa: prevalence, predictors, and validation of brief psychiatric rating scales.AIDS patient care and STDs. 2008;22(2):147-158.
�5. Spies G, Kader K, Kidd M, et al. Validity of the K-10 in detecting DSM-IV-de�ned depression andanxiety disorders among HIV-infected individuals. AIDS care. 2009;21(9):1163-1168.
��. Radloff LS. The use of the Center for Epidemiologic Studies Depression Scale in adolescents andyoung adults. Journal of youth and adolescence. 1991;20(2):149-166.
�7. Andrews G, Slade T. Interpreting scores on the Kessler psychological distress scale (K10). Australianand New Zealand journal of public health. 2001;25(6):494-497.
��. World Health Organization. Waist circumference and waist-hip ratio: report of a WHO expertconsultation, Geneva, 8-11 December 2008. 2011.
�9. Browning LM, Hsieh SD, Ashwell M. A systematic review of waist-to-height ratio as a screening toolfor the prediction of cardiovascular disease and diabetes: 0·5 could be a suitable global boundaryvalue. Nutrition Research Reviews. 2010;23(2):247-269.
70. Ssewanyana D, Mwangala PN, Van Baar A, Newton CR, Abubakar A. Health risk behaviour amongadolescents living with HIV in sub-Saharan Africa: a systematic review and meta-analysis. BioMedresearch international. 2018;2018.
71. Shisana O, Rehle T, Simbayi LC, et al. South African national HIV prevalence, incidence and behavioursurvey, 2012. 2014.
72. Dellar RC, Dlamini S, Karim QA. Adolescent girls and young women: key populations for HIVepidemic control. Journal of the International AIDS Society. 2015;18(2(Suppl 1)):19408.
Page 22/44
73. Statistics South Africa. Living Conditions of Households in South Africa. An analysis of householdexpenditure and income data using the Living Conditions Survey LCS 2014/2015..
74. Statistics South Africa. Quarterly Labour Force Survey, Quarter 1: 2019. Pretoria: Statistics SouthAfrica. Retrieved August. 2019; 22:2019..
75. Sherr L, Cluver LD, Toska E, He E. Differing psychological vulnerabilities among behaviourally andperinatally HIV infected adolescents in South Africa - implications for targeted health serviceprovision. AIDS Care. Jun 2018;30(sup2):92-101.
7�. Cluver L, Gardner F, Operario D. Poverty and psychological health among AIDS-orphaned children inCape Town, South Africa. AIDS care. 2009;21(6):732-741.
77. Young S, Wheeler AC, McCoy SI, Weiser SD. A review of the role of food insecurity in adherence tocare and treatment among adult and pediatric populations living with HIV and AIDS. AIDS andBehavior. 2014;18(5):505-515.
7�. Agu CE, Uchendu IK, Nsonwu AC, Okwuosa CN, Achukwu PU. Prevalence and associated risk factorsof peripheral artery disease in virologically suppressed HIV-infected individuals on antiretroviraltherapy in Kwara state, Nigeria: a cross sectional study. BMC public health. Aug 20 2019;19(1):1143.
79. Innes S, Patel K. Noncommunicable diseases in adolescents with perinatally acquired HIV-1 infectionin high-income and low-income settings. Curr Opin HIV AIDS. May 2018;13(3):187-195.
�0. World Health Organization. Healthy diet: World Health Organization. Regional O�ce for the EasternMediterranean;2019.
�1. Ashdown-Franks G, Vancampfort D, Firth J, et al. Association of leisure-time sedentary behavior withfast food and carbonated soft drink consumption among 133,555 adolescents aged 12–15 years in44 low- and middle-income countries. International Journal of Behavioral Nutrition and PhysicalActivity. 2019;16(1).
�2. Malik VS, Popkin BM, Bray GA, Despres JP, Willett WC, Hu FB. Sugar-Sweetened Beverages and Riskof Metabolic Syndrome and Type 2 Diabetes: A meta-analysis. Diabetes Care. 2010;33(11):2477-2483.
�3. National Assembly Republic of South Africa. South Africa. Foodstuffs, Cosmetics and DisinfectantsAct of 1972. Regulations: Reduction of sodium in certain foodstuffs and related matters. In: AfricaGoS, ed. R. 533/2012: Government Gazette; 2012.
�4. Arthur R. South Africa introduces sugar tax. Beverage Daily,2018 Available at: www. beveragedaily.com/Article/2018/04/03/South-Africa-introduces-sugar-tax Accessed 30 January 2019.
�5. Van Biljon A, McKune AJ, Dubose KD, Kolanisi U, Semple SJ. Physical activity levels in urban-basedSouth African learners: A cross-sectional study of 7 348 participants. South African Medical Journal.2018;108(2):126.
��. McVeigh J, Meiring R. Physical activity and sedentary behavior in an ethnically diverse group ofSouth African school children. Journal of sports science & medicine. 2014;13(2):371.
�7. Malete L, Tladi DM, Etnier JL, Makhanda J, Anabwani GM. Examining psychosocial correlates ofphysical activity and sedentary behavior in youth with and without HIV. PLoS One.
Page 23/44
2019;14(12):e0225890.
��. Martins PC, Lima LRA, Teixeira DM, Carvalho AP, Petroski EL. PHYSICAL ACTIVITY AND BODY FAT INADOLESCENTS LIVING WITH HIV: A COMPARATIVE STUDY. Rev Paul Pediatr. Jan-Mar2017;35(1):69-77.
�9. Letlape SV, Mokwena K, Oguntibeju O. Knowledge of students attending a high school in pretoria,South Africa, on diet, nutrition and exercise. West Indian Medical Journal. 2010;59(6):633-640.
90. Bourne LT, Lambert EV, Steyn K. Where does the black population of South Africa stand on thenutrition transition? Public health nutrition. Feb 2002;5(1a):157-162.
91. Kagura J, Adair LS, Musa MG, Pettifor JM, Norris SA. Blood pressure tracking in urban black SouthAfrican children: birth to twenty cohort. BMC pediatrics. 2015;15(1):78.
92. Naidoo S, Kagura J, Fabian J, Norris SA. Early Life Factors and Longitudinal Blood PressureTrajectories Are Associated With Elevated Blood Pressure in Early Adulthood. Hypertension.2019;73(2):301-309.
93. Chatterton-Kirchmeier S, Camacho-Gonzalez AF, McCracken CE, Chakraborty R, Batisky DL. Increasedprevalence of elevated blood pressures in HIV-infected children, adolescents and young adults. ThePediatric infectious disease journal. Jun 2015;34(6):610-614.
94. Fahme SA, Bloom�eld GS, Peck R. Hypertension in HIV-Infected Adults. Hypertension. 2018;72(1):44-55.
95. Nduka C, Stranges S, Sarki A, Kimani P, Uthman O. Evidence of increased blood pressure andhypertension risk among people living with HIV on antiretroviral therapy: a systematic review withmeta-analysis. Journal of Human Hypertension. 2016;30(6):355-362.
9�. Pangmekeh PJ, Awolu MM, Gustave S, Gladys T, Cumber SN. Association between highly activeantiretroviral therapy (HAART) and hypertension in persons living with HIV/AIDS at the Bamendaregional hospital, Cameroon. Pan Afr Med J. 2019;33:87.
97. Oni T, Youngblood E, Boulle A, McGrath N, Wilkinson RJ, Levitt NS. Patterns of HIV, TB, and non-communicable disease multi-morbidity in peri-urban South Africa- a cross sectional study. BMCinfectious diseases. 2015;15:20.
9�. Frigati LJ, Jao J, Mahtab S, et al. Insulin Resistance in South African Youth Living with PerinatallyAcquired HIV Receiving Antiretroviral Therapy. AIDS Research and Human Retroviruses.2019;35(1):56-62.
99. Prioreschi A, Munthali RJ, Soepnel L, et al. Incidence and prevalence of type 2 diabetes mellitus withHIV infection in Africa: a systematic review and meta-analysis. BMJ open. Mar 292017;7(3):e013953.
100. Brown TT, Cole SR, Li X, et al. Antiretroviral therapy and the prevalence and incidence of diabetesmellitus in the multicenter AIDS cohort study. Archives of internal medicine. 2005;165(10):1179-1184.
101. De Wit S, Sabin CA, Weber R, et al. Incidence and risk factors for new-onset diabetes in HIV-infectedpatients the data collection on adverse events of anti-HIV drugs (D: A: D) study. Diabetes care.

Page 24/44
2008;31(6):1224-1229.
102. Tripathi A, Liese AD, Jerrell JM, et al. Incidence of diabetes mellitus in a population-based cohort ofHIV-infected and non-HIV-infected persons: the impact of clinical and therapeutic factors over time.Diabet Med. Oct 2014;31(10):1185-1193.
103. Saeedi P, Petersohn I, Salpea P, Malanda B, Karuranga S, Unwin N, et al. Global and regional diabetesprevalence estimates for 2019 and projections for 2030 and 2045: Results from the InternationalDiabetes Federation Diabetes Atlas. Diabetes research and clinical practice. 2019 Nov 1;157:107843.
104. Vreeman RC, McCoy BM, Lee S. Mental health challenges among adolescents living with HIV. J IntAIDS Soc. May 16 2017;20(Suppl 3):21497.
105. Kim MH, Mazenga AC, Yu X, et al. Factors associated with depression among adolescents living withHIV in Malawi. BMC Psychiatry. Oct 26 2015;15:264.
10�. Musisi S, Kinyanda E. Emotional and behavioural disorders in HIV seropositive adolescents in urbanUganda. East African medical journal. 2009;86(1).
107. Nolen-Hoeksema S, Girgus JS. The emergence of gender differences in depression duringadolescence. Psychological bulletin. 1994;115(3):424.
10�. Buckley J, Otwombe K, Joyce C, et al. Mental Health of Adolescents in the Era of AntiretroviralTherapy: Is There a Difference Between HIV-Infected and Uninfected Youth in South Africa? TheJournal of adolescent health : o�cial publication of the Society for Adolescent Medicine. Apr 5 2020.
109. Huis In ’T Veld D, Pengpid S, Colebunders R, Peltzer K. Body Mass Index and Waist Circumference inPatients with HIV in South Africa and Associated Socio-demographic, Health Related andPsychosocial Factors. AIDS and Behavior. 2018;22(6):1972-1986.
110. Castro ADCO, Silveira EA, Falco MDO, Nery MW, Turchi MD. Overweight and abdominal obesity inadults living with HIV/AIDS. Revista da Associação Médica Brasileira. 2016;62(4):353-360.
111. Okechukwu A, Lawson J, Dalilo M. Dyslipidemia in HIV Infected Children and Adolescents on HighlyActive Antiretroviral Therapy in Abuja, Nigeria. Journal of Advances in Medicine and MedicalResearch. 2017:1-11.
112. Innes S, Abdullah KL, Haubrich R, Cotton MF, Browne SH. High prevalence of dyslipidemia and insulinresistance in HIV-infected pre-pubertal African children on antiretroviral therapy. The Pediatricinfectious disease journal. 2016;35(1):e1.
113. Steenkamp L, Truter I, Williams M, et al. Nutritional status and metabolic risk in HIV-infecteduniversity students: challenges in their monitoring and management. South African Family Practice.2017;59(1):9-13.
114. Dimala CA, Ngu RC, Kadia BM, Tianyi FL, Choukem SP. Markers of adiposity in HIV/AIDS patients:Agreement between waist circumference, waist-to-hip ratio, waist-to-height ratio and body massindex. PLoS One. 2018;13(3):e0194653.
115. Bakal DR, Coelho LE, Luz PM, et al. Obesity following ART initiation is common and in�uenced byboth traditional and HIV-/ART-speci�c risk factors. J Antimicrob Chemother. Aug 1 2018;73(8):2177-2185.
Page 25/44
11�. Zimmet P, Alberti KGM, Kaufman F, et al. The metabolic syndrome in children and adolescents ? anIDF consensus report. Pediatric Diabetes. 2007;8(5):299-306.
117. Petersen I, Hancock JH, Bhana A, Govender K, Mental Health Care MOPFI. Closing the treatment gapfor depression co-morbid with HIV in South Africa: Voices of a�icted women. Health.2013;05(03):557-566.
11�. Kinyanda E, Nakasujja N, Levin J, et al. Major depressive disorder and suicidality in early HIVinfection and its association with risk factors and negative outcomes as seen in semi-urban andrural Uganda. J Affect Disord. Apr 1 2017;212:117-127.
119. Casale M, Boyes M, Pantelic M, Toska E, Cluver L. Suicidal thoughts and behaviour among SouthAfrican adolescents living with HIV: Can social support buffer the impact of stigma? J Affect Disord.Feb 15 2019;245:82-90.
120. Woollett N, Cluver L, Bandeira M, Brahmbhatt H. Identifying risks for mental health problems in HIVpositive adolescents accessing HIV treatment in Johannesburg. J Child Adolesc Ment Health. May2017;29(1):11-26.
121. Asmall S, Mahomed O. Integrated chronic disease management manual. Pretoria: Department ofHealth. 2013.
122. Jemmott JB, 3rd, Jemmott LS, O'Leary A, et al. Cognitive-behavioural health-promotion interventionincreases fruit and vegetable consumption and physical activity among South African adolescents: acluster-randomised controlled trial. Psychol Health. Feb 2011;26(2):167-185.
123. Ssewanyana D, Newton CR, van Baar A, et al. Beyond Their HIV Status: the Occurrence of MultipleHealth Risk Behavior Among Adolescents from a Rural Setting of Sub-Saharan Africa. Int J BehavMed. Mar 25 2020.
124. Engelgau MM, Narayan KM, Herman WH. Screening for type 2 diabetes. Diabetes Care.2000;23(10):1563-1580.
TablesTABLE 1: Participant Socio-demographic, baseline characteristics by Gender
Page 26/44
Variable Description Median (IQR) or n (%)
(p < 0.05)1Male: n=
22 (24%)
Female:
n=70 (76%)
Total n=
92
Age (years) 20.7 (18.9 -
21.6)
20.4 (19.0 -
23.0)
20.5
(18.9-
22.9)Adolescent stage by agegroup
middle adolescence: 15–17 years 3 (14%) 10 (15%) 13 (14%)
late adolescence: 18–19 years 5 (23%) 18 (26%) 23 (26%)
young adulthood: 20–21 years 9 (41%) 16 (24%) 25 (28%)
young adulthood: 22–24 years 5 (23%) 24 (35%) 29 (32%)Family structure- whom theylive with
Biological parents 10 (45%) 35 (50%) 45 (49%)
Grandparents 4 (18%) 8 (11%) 12 (13%)
Relative (aunt or uncle) 6 (27%) 23 (33%) 29 (32%)
Siblings 15 (68%) 33 (47%) 48 (52%)
Non-family (foster care/ children’s
home)
0 2 (3%) 2 (2%)
Ever pregnant/ impregnated someone (p= 0.023) 1 (5%) 19 (28%) 20 (22%)Parity (n= 20) 0 children 0 5 (26%) 5 (25%)
1 child 1 (100%) 13 (68%) 14 (70%)
2 children 0 1 (5%) 1 (5%) Current occupation/employment status
In school/college/university/ other
tertiary education
7 (32%) 37 (54%) 44 (48%)
In training 3 (14%) 6 (9%) 9 (10%)
Employed 5 (23%) 8 (11%) 13 (14%)
Not in education, employment or
training (NEET)
7 (32%) 18 (26%) 25 (27%)
Ever repeated a grade at school 14 (64%) 33 (47%) 47 (52%)Days absent from school orwork in past month
0 days 13 (59%) 34 (49%) 47 (52%)
1 – 2 days 7 (32%) 26 (38%) 33 (36%)
3 or more days 2 (9%) 9 (13%) 11 (12%)Youth multidimensionally poor2 (n= 88) 9 (41%) 30 (45%) 39 (44%) Educational attainment 4 (18%) 16 (24%) 20 (22%) Aged 17 – 20 & completed less than
nine years of schooling
1 (5%) 2 (3%) 3 (3%)
Aged 21 – 24 & completed less than
matric or equivalent
3 (14%) 14 (21%) 17 (19%)
General health and functioning 16 (73%) 46 (67%) 62 (68%) Difficulty hearing 3 (14%) 13 (19%) 16 (18%)
Difficulty seeing 7 (33%) 26 (39%) 33 (38%)

Page 27/44
Difficulty moving around 2 (10%) 15 (22%) 17 (20%)
Difficulty concentrating 12 (57%) 32 (48%) 44 (50%)
Difficulty with self-care 0 14 (21%) 14 (16%) Living environment 0 (0 -
0.036)
0.036 (0 -
0.071)
0.036 (0 -
0.071) Fuel for lighting other than
electricity, gas/ solar power
0 1 (1%) 1 (1%)
Fuel for heating other than
electricity, gas/ solar power
5 (23%) 21 (30%) 26 (28%)
Fuel for cooking other than
electricity or gas
0 1 (1%) 1 (1%)
Sanitation: Household without a
flush toilet
3 (14%) 5 (7%) 8 (9%)
Water: Household without piped
water on site
1 (5%) 15 (21%) 16 (17%)
Dwelling that is an informal shack
/caravan/ tent/ other
4 (18%) 28 (41%) 32 (35%)
Household assets3: Household with ≤ two assets below &no motor vehicle
3 (14%) 20 (29%) 23 (25%)
no radio 9 (41%) 32 (46%) 41 (45%)
no television 2 (9%) 6 (9%) 8 (9%)
no landline 22 (100%) 67 (96%) 89 (97%)
no cell phone 1 (5%) 14 (20%) 15 (16%)
no refrigerator 6 (27%) 24 (34%) 30 (33%)
no motor vehicle (p= 0.003) 10 (45%) 55 (79%) 65 (71%) Household adult unemployment: no employed adults (18– 64 years)
1 (5%) 13 (19%) 14 (15%)
Household Food Insecurity Access Score 2.5 (1 – 5) 3 (0 – 7) 3 (0 – 7) food secure 4 (19%) 24 (34%) 28 (30%)
mildly food insecure 7 (32%) 11 (16%) 18 (20%)
moderately food insecure 4 (19%) 7 (10%) 11 (12%)
severely food insecure 7 (32%) 28 (40%) 35 (38%)
1 P-value shown if significant at 5% level: p < 0.05; 2 Youth MPI poor: those with composite score > 33.3%; 3 Individual living in a household that does not own more than two of: radio, TV, landline,mobile phone, bike, motorbike or refrigerator AND does not own a motor car or truck
Page 28/44
TABLE 2: Physical Activity, Sedentary and Dietary Behaviour and Nutritional Knowledge ofAYLHIV by Gender
Page 29/44
Variable: Median (IQR) or
n (%)
Description Male: n= 19
(22%)
Female: n=
67 (78%)
Total: n
=86
Vigorous-intensity
Physical activity
Any vigorous-intensity PA for ≥10
minutes
11 (58%) 26 (39%) 37 (43%)
Time spent doing vigorous-intensity
PA per day in minutes
75 (30 –
240)
60 (30 –
120)
60 (30 –
120)
Vigorous intensity activity MET-
minutes/week
2400 (1200
– 4320)
1680 (480 –
3840)
1920 (720 –
4320)
Moderate-intensity
Physical activity
Any moderate-intensity PA for ≥10
minutes
15 (79%) 53 (79%) 68 (79%)
Time spent doing moderate- intensity
PA per day in mins
75 (30 –
120)
60 (30 – 90) 60 (30 –
90)
Moderate intensity activity MET-
minutes/week
1440 (480 –
1680)
720 (480 –
1200)
720 (480 –
1440)
Active Travel Walking or cycling for ≥10 minutes
continuously for travel
16 (84%) 45 (67%) 61 (71%)
Time spent walking or cycling on a
typical day in minutes
40 (30 – 60) 30 (30 – 60) 35 (30 –
60)
Walking MET-minutes/week 610.5 (396 –
1386)
495 (247.5 –
990)
528 (297 –
990)
Total physical activity MET-minutes/week 2504.25
(690 – 7146)
1173 (495 –
2826)
1215 (495 –
3348)
Insufficient physical activity (achieved < 600 MET-minutes per
week)
4 (21%) 23 (34%) 27 (31%)
High physical activity ( ≥3000 MET minutes per week) 8 (42%) 15 (22%) 23 (27%)
Sedentary behaviour ( ≥3 hours of sedentary time per day) 10 (53%) 32 (48%) 42 (49%)
Dietary Behaviour (n= 82)
Fruits consumption
(p= 0.028)Never 0 2 (3%) 2 (2%)
Once a week / less than once a week 4 (21%) 27 (43%) 31 (28%)
2 – 4 times a week 5 (26%) 15 (24%) 20 (24%)
Frequently (5 – 6 times a week) 4 (21%) 2 (3%) 6 (7%)
Daily or more than once daily 6 (32%) 17 (27%) 23 (2%)
Vegetables consumption Never 0 4 (6%) 4 (5%)
Once a week / less than once a week 3 (17%) 9 (14%) 12 (15%)
2 - 4 times a week 1 (6%) 9 (14%) 10 (12%)
Frequently (5 – 6 times a week) 6 (33%) 7 (11%) 13 (16%)
Daily or more than once daily 8 (44%) 34 (54%) 42 (52%)
Wholegrain bread or
cereal Consumption
Never 1 (5%) 4 (6%) 5 (6%)
Once a week / less than once a week 5 (26%) 16 (25%) 21 (26%)
Page 30/44
(n= 68) 2 – 4 times a week 2 (11%) 6 (10%) 8 (10%)
Frequently (5 – 6 times a week) 3 (16%) 4 (6%) 7 (9%)
Daily or more than once daily 5 (26%) 22 (35%) 27 (33%)
Daily consumption of sugar-sweetened beverages 5 (26%) 20 (30%) 25 (29%)
Daily consumption of deep-fried foods 3 (16%) 15 (22%) 18 (21%)
Daily consumption of fast foods 1 (5%) 12 (18%) 13 (15%)
Daily consumption of sweets & cakes 2 (11%) 25 (37%) 27 (31%)
Ate a meal prepared outside the home in the past week 10 (59%) 45 (73%) 55 (67%)
Meals eaten outside the home in past week: (n=
55)
2 (1 – 10) 2 (2 – 3) 2 (2 – 4)
Breakfast consumption: number of days in the past week 5 (3 – 6) 5 (3 – 7) 5 (3 – 7)
Breakfast consumption Skippers: ate breakfast 0 – 2
days/week
5 (23%) 13 (20%) 18 (21%)
Semi-skippers: ate breakfast 3 – 4
days/week
5 (23%) 13 (20%) 18 (21%)
Non-skippers: ate breakfast 5 – 7
days/week
12 (54%) 39 (60%) 51 (58%)
Overall General Nutrition Knowledge score percentage % (score
/88) (95% CI)
40.3% (34.5
-46.1)
36.5% (34.0
- 38.9)
37.3%
(35.1 -
39.6)
1. Dietary recommendations
(score/18)
44.2% (35.3
- 53.0)
42.5% (38.7
- 46.3)
42.9%
(39.4 -
46.4)
2. Food Groups (score/36) 40.4 (35.5 -
45.4)
37.1 (34.1 -
40.1)
37.9 (35.3 -
40.4)
3. Healthy food choices
(score/13)
36.8 (27.3 -
46.2)
30.5 (26.0 -
35.1)
31.9 (27.9 -
36.0)
4. Diet, disease and weight
management (score /21)
36.8 (28.2 -
45.3)
33.9 (30.6 -
37.1)
34.5 (31.4 -
37.6)
MET = Metabolic equivalent of task; n= number; % = percentage; PA = physical activity; p-value shown if significant at 5% level: p < 0.05.
TABLE 3: Physical Activity, Sedentary and Dietary Behaviour and Nutritional Knowledgeby Age Group
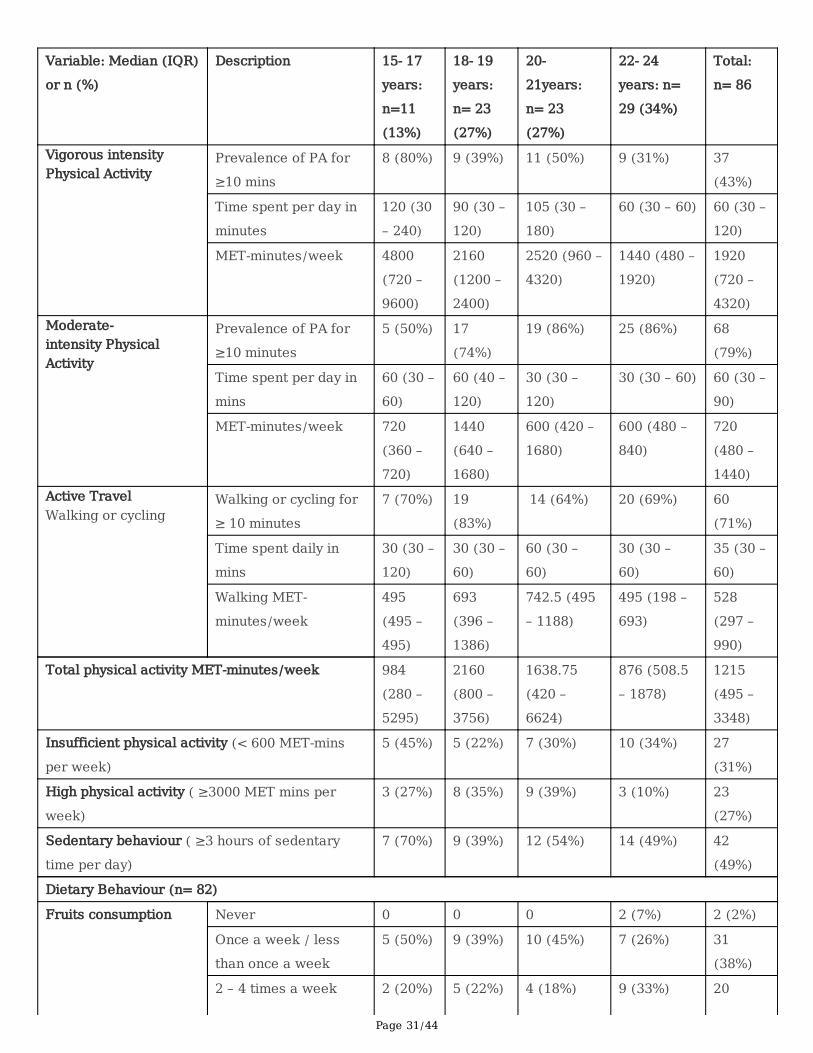
Page 31/44
Variable: Median (IQR)
or n (%)
Description 15- 17
years:
n=11
(13%)
18- 19
years:
n= 23
(27%)
20-
21years:
n= 23
(27%)
22- 24
years: n=
29 (34%)
Total:
n= 86
Vigorous intensityPhysical Activity
Prevalence of PA for
≥10 mins
8 (80%) 9 (39%) 11 (50%) 9 (31%) 37
(43%)
Time spent per day in
minutes
120 (30
– 240)
90 (30 –
120)
105 (30 –
180)
60 (30 – 60) 60 (30 –
120)
MET-minutes/week 4800
(720 –
9600)
2160
(1200 –
2400)
2520 (960 –
4320)
1440 (480 –
1920)
1920
(720 –
4320)Moderate-intensity PhysicalActivity
Prevalence of PA for
≥10 minutes
5 (50%) 17
(74%)
19 (86%) 25 (86%) 68
(79%)
Time spent per day in
mins
60 (30 –
60)
60 (40 –
120)
30 (30 –
120)
30 (30 – 60) 60 (30 –
90)
MET-minutes/week 720
(360 –
720)
1440
(640 –
1680)
600 (420 –
1680)
600 (480 –
840)
720
(480 –
1440)Active TravelWalking or cycling
Walking or cycling for
≥ 10 minutes
7 (70%) 19
(83%)
14 (64%) 20 (69%) 60
(71%)
Time spent daily in
mins
30 (30 –
120)
30 (30 –
60)
60 (30 –
60)
30 (30 –
60)
35 (30 –
60)
Walking MET-
minutes/week
495
(495 –
495)
693
(396 –
1386)
742.5 (495
– 1188)
495 (198 –
693)
528
(297 –
990)
Total physical activity MET-minutes/week 984
(280 –
5295)
2160
(800 –
3756)
1638.75
(420 –
6624)
876 (508.5
– 1878)
1215
(495 –
3348)
Insufficient physical activity (< 600 MET-mins
per week)
5 (45%) 5 (22%) 7 (30%) 10 (34%) 27
(31%)
High physical activity ( ≥3000 MET mins per
week)
3 (27%) 8 (35%) 9 (39%) 3 (10%) 23
(27%)
Sedentary behaviour ( ≥3 hours of sedentary
time per day)
7 (70%) 9 (39%) 12 (54%) 14 (49%) 42
(49%)
Dietary Behaviour (n= 82)
Fruits consumption Never 0 0 0 2 (7%) 2 (2%)
Once a week / less
than once a week
5 (50%) 9 (39%) 10 (45%) 7 (26%) 31
(38%)
2 – 4 times a week 2 (20%) 5 (22%) 4 (18%) 9 (33%) 20
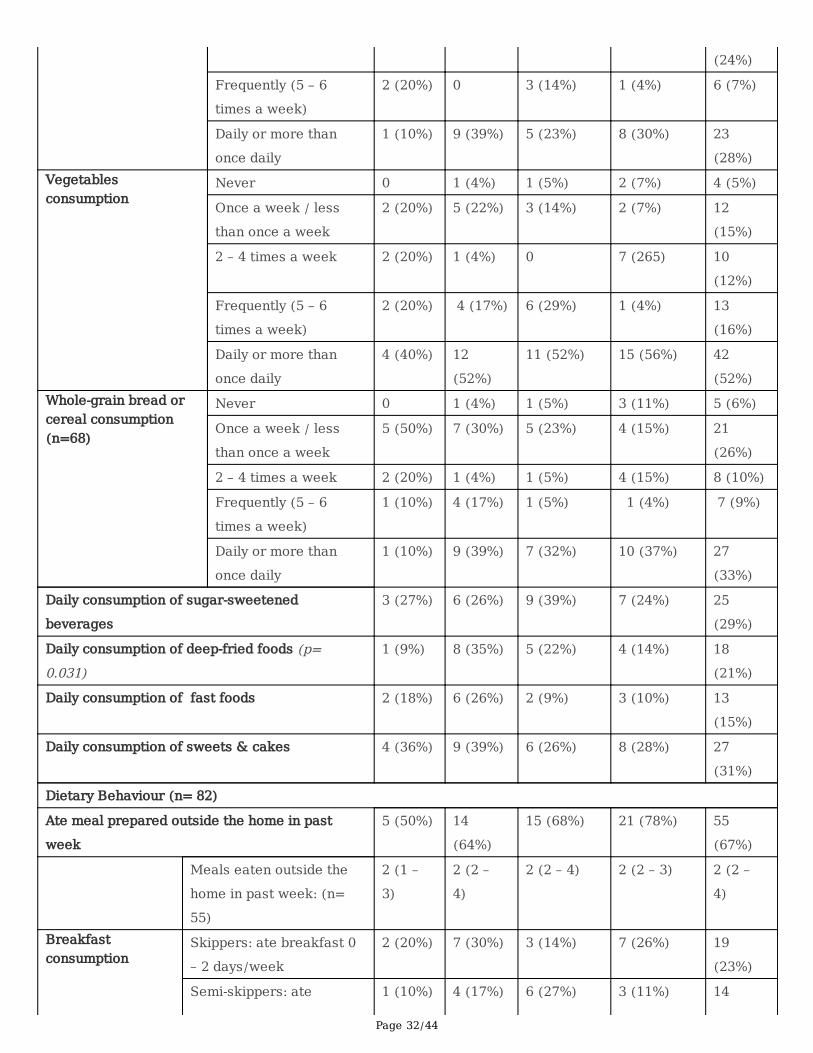
Page 32/44
(24%)
Frequently (5 – 6
times a week)
2 (20%) 0 3 (14%) 1 (4%) 6 (7%)
Daily or more than
once daily
1 (10%) 9 (39%) 5 (23%) 8 (30%) 23
(28%)Vegetablesconsumption
Never 0 1 (4%) 1 (5%) 2 (7%) 4 (5%)
Once a week / less
than once a week
2 (20%) 5 (22%) 3 (14%) 2 (7%) 12
(15%)
2 – 4 times a week 2 (20%) 1 (4%) 0 7 (265) 10
(12%)
Frequently (5 – 6
times a week)
2 (20%) 4 (17%) 6 (29%) 1 (4%) 13
(16%)
Daily or more than
once daily
4 (40%) 12
(52%)
11 (52%) 15 (56%) 42
(52%)Whole-grain bread orcereal consumption(n=68)
Never 0 1 (4%) 1 (5%) 3 (11%) 5 (6%)
Once a week / less
than once a week
5 (50%) 7 (30%) 5 (23%) 4 (15%) 21
(26%)
2 – 4 times a week 2 (20%) 1 (4%) 1 (5%) 4 (15%) 8 (10%)
Frequently (5 – 6
times a week)
1 (10%) 4 (17%) 1 (5%) 1 (4%) 7 (9%)
Daily or more than
once daily
1 (10%) 9 (39%) 7 (32%) 10 (37%) 27
(33%)
Daily consumption of sugar-sweetened
beverages
3 (27%) 6 (26%) 9 (39%) 7 (24%) 25
(29%)
Daily consumption of deep-fried foods (p=0.031)
1 (9%) 8 (35%) 5 (22%) 4 (14%) 18
(21%)
Daily consumption of fast foods 2 (18%) 6 (26%) 2 (9%) 3 (10%) 13
(15%)
Daily consumption of sweets & cakes 4 (36%) 9 (39%) 6 (26%) 8 (28%) 27
(31%)
Dietary Behaviour (n= 82)
Ate meal prepared outside the home in past
week
5 (50%) 14
(64%)
15 (68%) 21 (78%) 55
(67%)
Meals eaten outside the
home in past week: (n=
55)
2 (1 –
3)
2 (2 –
4)
2 (2 – 4) 2 (2 – 3) 2 (2 –
4)
Breakfastconsumption
Skippers: ate breakfast 0
– 2 days/week
2 (20%) 7 (30%) 3 (14%) 7 (26%) 19
(23%)
Semi-skippers: ate 1 (10%) 4 (17%) 6 (27%) 3 (11%) 14
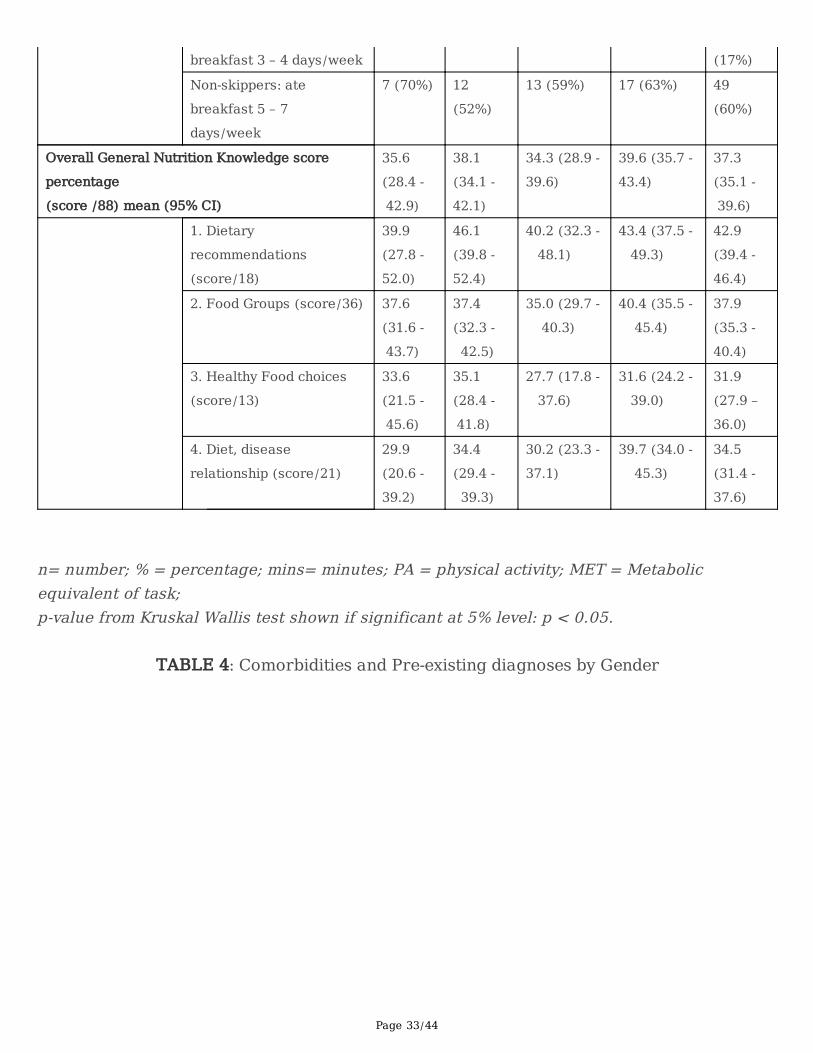
Page 33/44
breakfast 3 – 4 days/week (17%)
Non-skippers: ate
breakfast 5 – 7
days/week
7 (70%) 12
(52%)
13 (59%) 17 (63%) 49
(60%)
Overall General Nutrition Knowledge score
percentage
(score /88) mean (95% CI)
35.6
(28.4 -
42.9)
38.1
(34.1 -
42.1)
34.3 (28.9 -
39.6)
39.6 (35.7 -
43.4)
37.3
(35.1 -
39.6)
1. Dietary
recommendations
(score/18)
39.9
(27.8 -
52.0)
46.1
(39.8 -
52.4)
40.2 (32.3 -
48.1)
43.4 (37.5 -
49.3)
42.9
(39.4 -
46.4)
2. Food Groups (score/36) 37.6
(31.6 -
43.7)
37.4
(32.3 -
42.5)
35.0 (29.7 -
40.3)
40.4 (35.5 -
45.4)
37.9
(35.3 -
40.4)
3. Healthy Food choices
(score/13)
33.6
(21.5 -
45.6)
35.1
(28.4 -
41.8)
27.7 (17.8 -
37.6)
31.6 (24.2 -
39.0)
31.9
(27.9 –
36.0)
4. Diet, disease
relationship (score/21)
29.9
(20.6 -
39.2)
34.4
(29.4 -
39.3)
30.2 (23.3 -
37.1)
39.7 (34.0 -
45.3)
34.5
(31.4 -
37.6)
n= number; % = percentage; mins= minutes; PA = physical activity; MET = Metabolicequivalent of task; p-value from Kruskal Wallis test shown if significant at 5% level: p < 0.05.
TABLE 4: Comorbidities and Pre-existing diagnoses by Gender
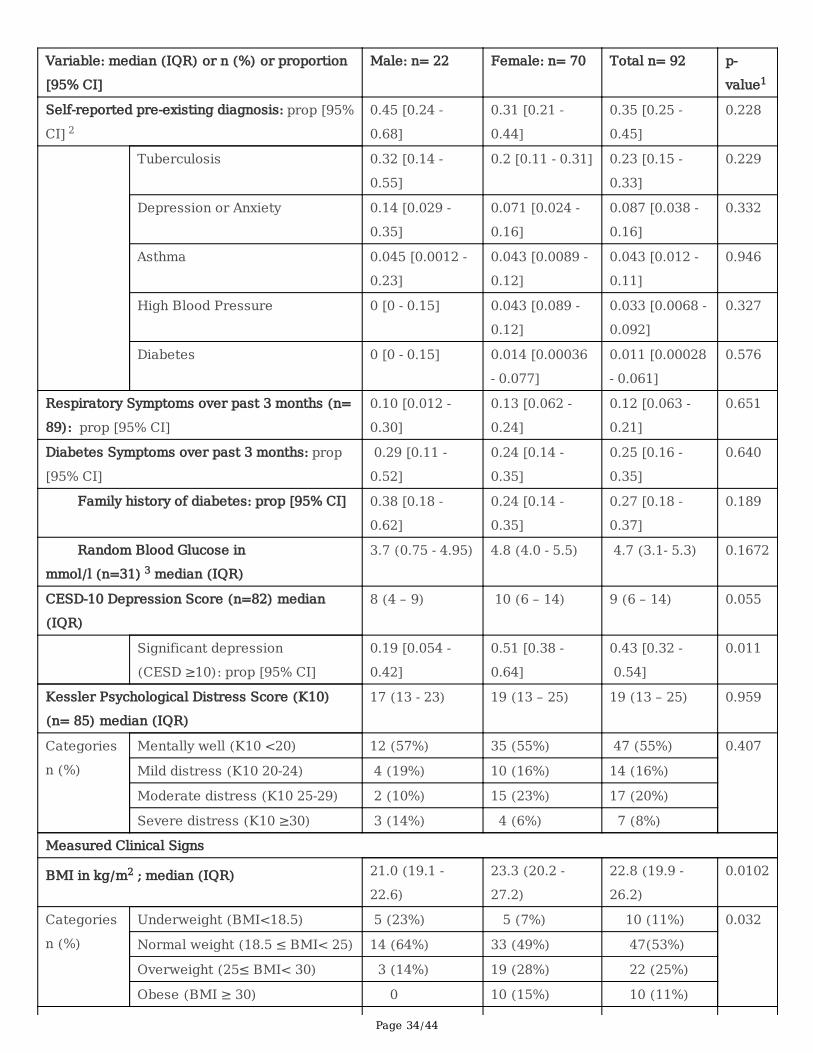
Page 34/44
Variable: median (IQR) or n (%) or proportion
[95% CI]
Male: n= 22 Female: n= 70 Total n= 92 p-
value1
Self-reported pre-existing diagnosis: prop [95%
CI] 2
0.45 [0.24 -
0.68]
0.31 [0.21 -
0.44]
0.35 [0.25 -
0.45]
0.228
Tuberculosis 0.32 [0.14 -
0.55]
0.2 [0.11 - 0.31] 0.23 [0.15 -
0.33]
0.229
Depression or Anxiety 0.14 [0.029 -
0.35]
0.071 [0.024 -
0.16]
0.087 [0.038 -
0.16]
0.332
Asthma 0.045 [0.0012 -
0.23]
0.043 [0.0089 -
0.12]
0.043 [0.012 -
0.11]
0.946
High Blood Pressure 0 [0 - 0.15] 0.043 [0.089 -
0.12]
0.033 [0.0068 -
0.092]
0.327
Diabetes 0 [0 - 0.15] 0.014 [0.00036
- 0.077]
0.011 [0.00028
- 0.061]
0.576
Respiratory Symptoms over past 3 months (n=
89): prop [95% CI]
0.10 [0.012 -
0.30]
0.13 [0.062 -
0.24]
0.12 [0.063 -
0.21]
0.651
Diabetes Symptoms over past 3 months: prop
[95% CI]
0.29 [0.11 -
0.52]
0.24 [0.14 -
0.35]
0.25 [0.16 -
0.35]
0.640
Family history of diabetes: prop [95% CI] 0.38 [0.18 -
0.62]
0.24 [0.14 -
0.35]
0.27 [0.18 -
0.37]
0.189
Random Blood Glucose in
mmol/l (n=31) 3 median (IQR)
3.7 (0.75 - 4.95) 4.8 (4.0 - 5.5) 4.7 (3.1- 5.3) 0.1672
CESD-10 Depression Score (n=82) median
(IQR)
8 (4 – 9) 10 (6 – 14) 9 (6 – 14) 0.055
Significant depression
(CESD ≥10): prop [95% CI]
0.19 [0.054 -
0.42]
0.51 [0.38 -
0.64]
0.43 [0.32 -
0.54]
0.011
Kessler Psychological Distress Score (K10)
(n= 85) median (IQR)
17 (13 - 23) 19 (13 – 25) 19 (13 – 25) 0.959
Categories
n (%)
Mentally well (K10 <20) 12 (57%) 35 (55%) 47 (55%) 0.407
Mild distress (K10 20-24) 4 (19%) 10 (16%) 14 (16%)
Moderate distress (K10 25-29) 2 (10%) 15 (23%) 17 (20%)
Severe distress (K10 ≥30) 3 (14%) 4 (6%) 7 (8%)
Measured Clinical Signs
BMI in kg/m2 ; median (IQR) 21.0 (19.1 -
22.6)
23.3 (20.2 -
27.2)
22.8 (19.9 -
26.2)
0.0102
Categories
n (%)
Underweight (BMI<18.5) 5 (23%) 5 (7%) 10 (11%) 0.032
Normal weight (18.5 ≤ BMI< 25) 14 (64%) 33 (49%) 47(53%)
Overweight (25≤ BMI< 30) 3 (14%) 19 (28%) 22 (25%)
Obese (BMI ≥ 30) 0 10 (15%) 10 (11%)
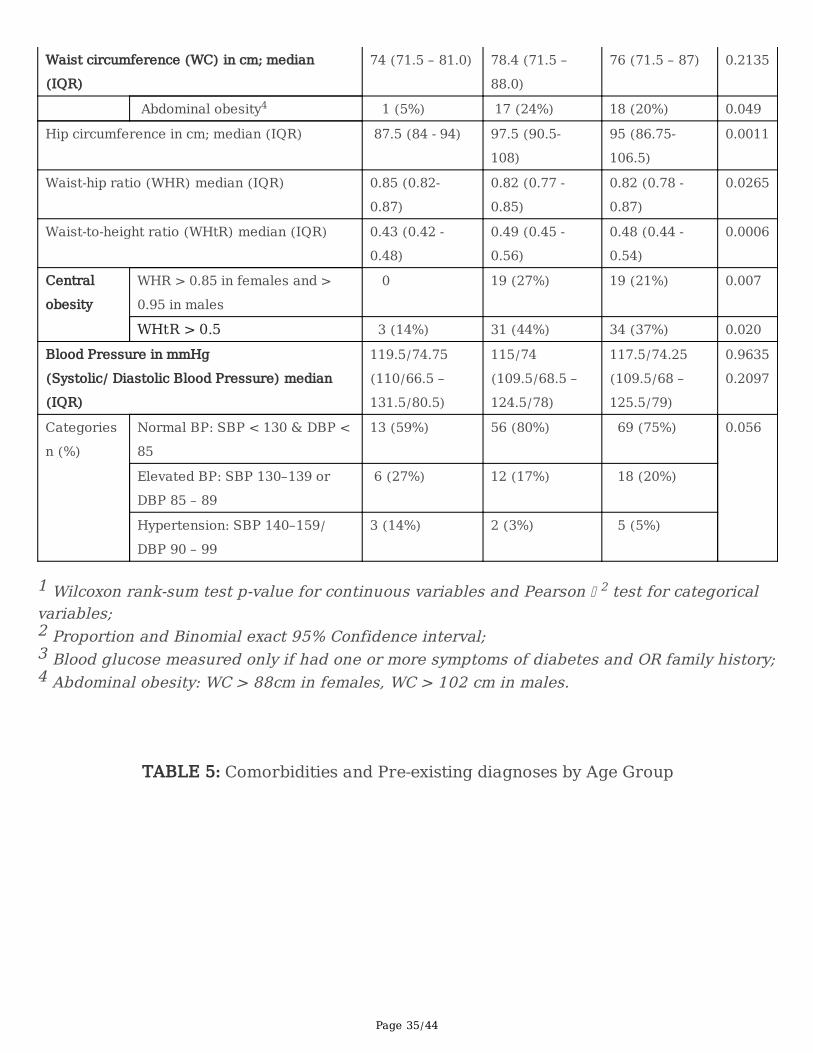
Page 35/44
Waist circumference (WC) in cm; median
(IQR)
74 (71.5 – 81.0) 78.4 (71.5 –
88.0)
76 (71.5 – 87) 0.2135
Abdominal obesity4 1 (5%) 17 (24%) 18 (20%) 0.049
Hip circumference in cm; median (IQR) 87.5 (84 - 94) 97.5 (90.5-
108)
95 (86.75-
106.5)
0.0011
Waist-hip ratio (WHR) median (IQR) 0.85 (0.82-
0.87)
0.82 (0.77 -
0.85)
0.82 (0.78 -
0.87)
0.0265
Waist-to-height ratio (WHtR) median (IQR) 0.43 (0.42 -
0.48)
0.49 (0.45 -
0.56)
0.48 (0.44 -
0.54)
0.0006
Central
obesity
WHR > 0.85 in females and >
0.95 in males
0 19 (27%) 19 (21%) 0.007
WHtR > 0.5 3 (14%) 31 (44%) 34 (37%) 0.020
Blood Pressure in mmHg
(Systolic/ Diastolic Blood Pressure) median
(IQR)
119.5/74.75
(110/66.5 –
131.5/80.5)
115/74
(109.5/68.5 –
124.5/78)
117.5/74.25
(109.5/68 –
125.5/79)
0.9635
0.2097
Categories
n (%)
Normal BP: SBP < 130 & DBP <
85
13 (59%) 56 (80%) 69 (75%) 0.056
Elevated BP: SBP 130–139 or
DBP 85 – 89
6 (27%) 12 (17%) 18 (20%)
Hypertension: SBP 140–159/
DBP 90 – 99
3 (14%) 2 (3%) 5 (5%)
1 Wilcoxon rank-sum test p-value for continuous variables and Pearson 2 test for categoricalvariables; 2 Proportion and Binomial exact 95% Confidence interval; 3 Blood glucose measured only if had one or more symptoms of diabetes and OR family history;4 Abdominal obesity: WC > 88cm in females, WC > 102 cm in males.
TABLE 5: Comorbidities and Pre-existing diagnoses by Age Group
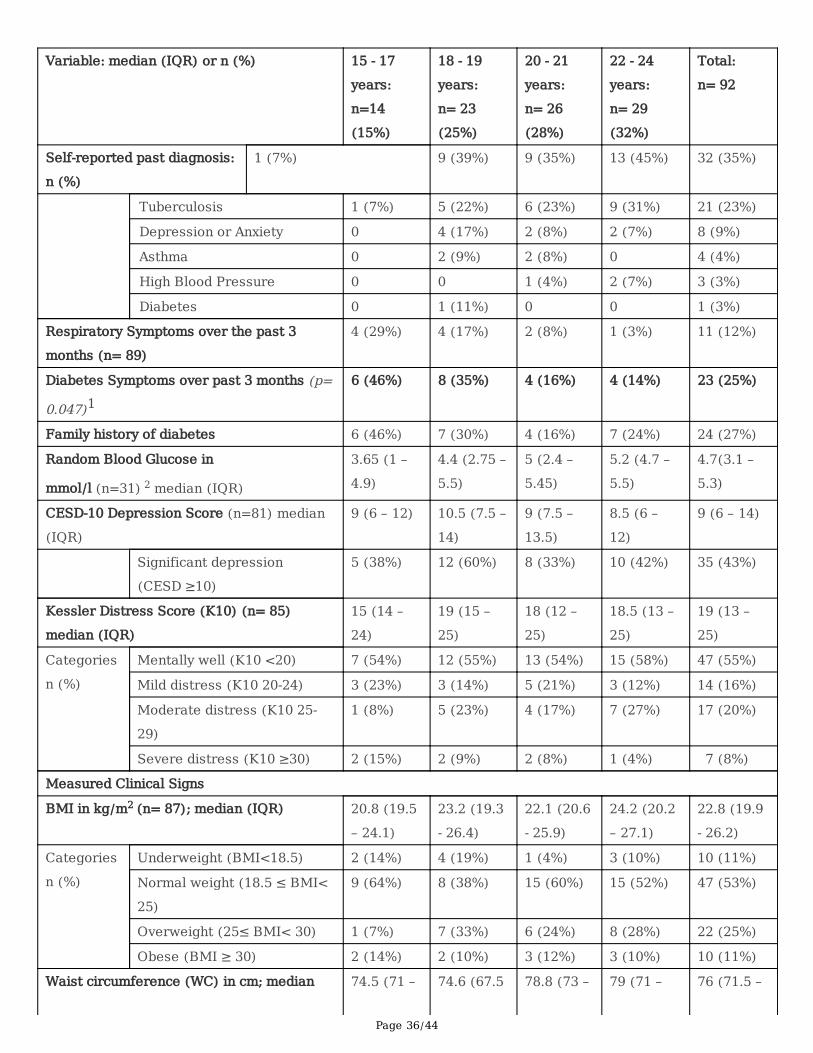
Page 36/44
Variable: median (IQR) or n (%) 15 - 17
years:
n=14
(15%)
18 - 19
years:
n= 23
(25%)
20 - 21
years:
n= 26
(28%)
22 - 24
years:
n= 29
(32%)
Total:
n= 92
Self-reported past diagnosis:
n (%)
1 (7%) 9 (39%) 9 (35%) 13 (45%) 32 (35%)
Tuberculosis 1 (7%) 5 (22%) 6 (23%) 9 (31%) 21 (23%)
Depression or Anxiety 0 4 (17%) 2 (8%) 2 (7%) 8 (9%)
Asthma 0 2 (9%) 2 (8%) 0 4 (4%)
High Blood Pressure 0 0 1 (4%) 2 (7%) 3 (3%)
Diabetes 0 1 (11%) 0 0 1 (3%)
Respiratory Symptoms over the past 3
months (n= 89)
4 (29%) 4 (17%) 2 (8%) 1 (3%) 11 (12%)
Diabetes Symptoms over past 3 months (p=
0.047)1 6 (46%) 8 (35%) 4 (16%) 4 (14%) 23 (25%)
Family history of diabetes 6 (46%) 7 (30%) 4 (16%) 7 (24%) 24 (27%)
Random Blood Glucose in
mmol/l (n=31) 2 median (IQR)
3.65 (1 –
4.9)
4.4 (2.75 –
5.5)
5 (2.4 –
5.45)
5.2 (4.7 –
5.5)
4.7(3.1 –
5.3)
CESD-10 Depression Score (n=81) median
(IQR)
9 (6 – 12) 10.5 (7.5 –
14)
9 (7.5 –
13.5)
8.5 (6 –
12)
9 (6 – 14)
Significant depression
(CESD ≥10)
5 (38%) 12 (60%) 8 (33%) 10 (42%) 35 (43%)
Kessler Distress Score (K10) (n= 85)
median (IQR)
15 (14 –
24)
19 (15 –
25)
18 (12 –
25)
18.5 (13 –
25)
19 (13 –
25)
Categories
n (%)
Mentally well (K10 <20) 7 (54%) 12 (55%) 13 (54%) 15 (58%) 47 (55%)
Mild distress (K10 20-24) 3 (23%) 3 (14%) 5 (21%) 3 (12%) 14 (16%)
Moderate distress (K10 25-
29)
1 (8%) 5 (23%) 4 (17%) 7 (27%) 17 (20%)
Severe distress (K10 ≥30) 2 (15%) 2 (9%) 2 (8%) 1 (4%) 7 (8%)
Measured Clinical Signs
BMI in kg/m2 (n= 87); median (IQR) 20.8 (19.5
– 24.1)
23.2 (19.3
- 26.4)
22.1 (20.6
- 25.9)
24.2 (20.2
– 27.1)
22.8 (19.9
- 26.2)
Categories
n (%)
Underweight (BMI<18.5) 2 (14%) 4 (19%) 1 (4%) 3 (10%) 10 (11%)
Normal weight (18.5 ≤ BMI<
25)
9 (64%) 8 (38%) 15 (60%) 15 (52%) 47 (53%)
Overweight (25≤ BMI< 30) 1 (7%) 7 (33%) 6 (24%) 8 (28%) 22 (25%)
Obese (BMI ≥ 30) 2 (14%) 2 (10%) 3 (12%) 3 (10%) 10 (11%)
Waist circumference (WC) in cm; median 74.5 (71 – 74.6 (67.5 78.8 (73 – 79 (71 – 76 (71.5 –
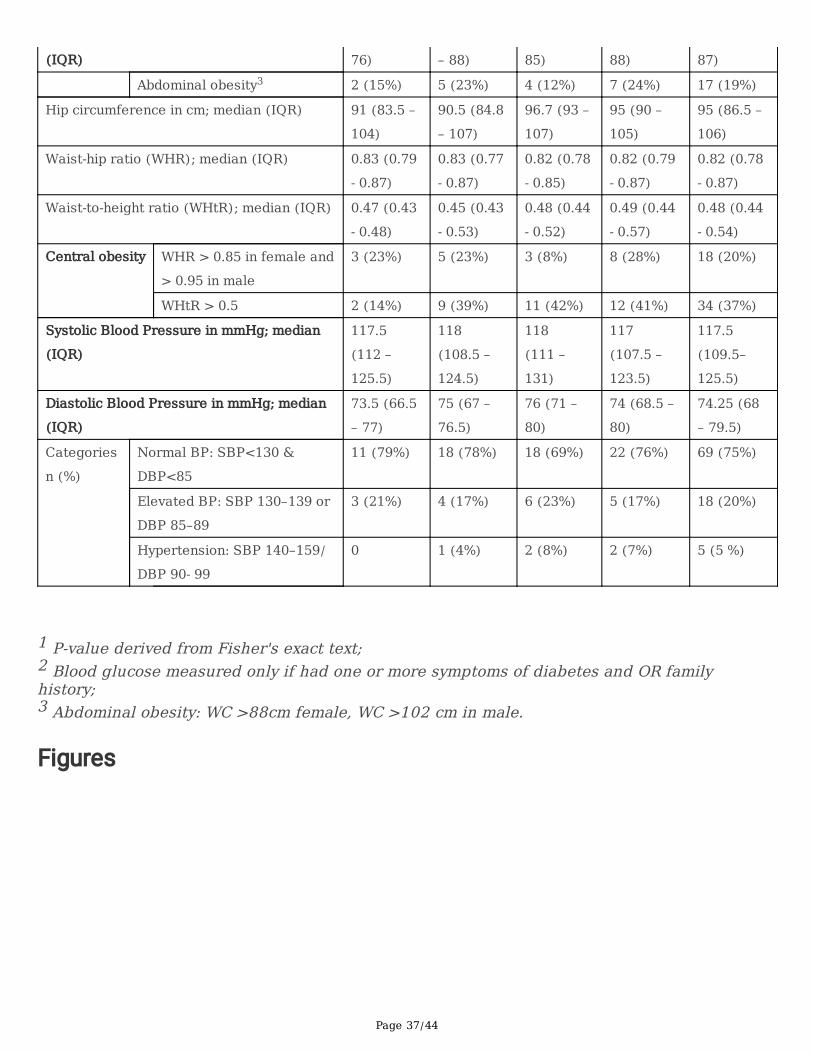
Page 37/44
(IQR) 76) – 88) 85) 88) 87) Abdominal obesity3 2 (15%) 5 (23%) 4 (12%) 7 (24%) 17 (19%)
Hip circumference in cm; median (IQR) 91 (83.5 –
104)
90.5 (84.8
– 107)
96.7 (93 –
107)
95 (90 –
105)
95 (86.5 –
106)
Waist-hip ratio (WHR); median (IQR) 0.83 (0.79
- 0.87)
0.83 (0.77
- 0.87)
0.82 (0.78
- 0.85)
0.82 (0.79
- 0.87)
0.82 (0.78
- 0.87)
Waist-to-height ratio (WHtR); median (IQR) 0.47 (0.43
- 0.48)
0.45 (0.43
- 0.53)
0.48 (0.44
- 0.52)
0.49 (0.44
- 0.57)
0.48 (0.44
- 0.54)
Central obesity WHR > 0.85 in female and
> 0.95 in male
3 (23%) 5 (23%) 3 (8%) 8 (28%) 18 (20%)
WHtR > 0.5 2 (14%) 9 (39%) 11 (42%) 12 (41%) 34 (37%)
Systolic Blood Pressure in mmHg; median
(IQR)
117.5
(112 –
125.5)
118
(108.5 –
124.5)
118
(111 –
131)
117
(107.5 –
123.5)
117.5
(109.5–
125.5)
Diastolic Blood Pressure in mmHg; median
(IQR)
73.5 (66.5
– 77)
75 (67 –
76.5)
76 (71 –
80)
74 (68.5 –
80)
74.25 (68
– 79.5)
Categories
n (%)
Normal BP: SBP<130 &
DBP<85
11 (79%) 18 (78%) 18 (69%) 22 (76%) 69 (75%)
Elevated BP: SBP 130–139 or
DBP 85–89
3 (21%) 4 (17%) 6 (23%) 5 (17%) 18 (20%)
Hypertension: SBP 140–159/
DBP 90‐ 99
0 1 (4%) 2 (8%) 2 (7%) 5 (5 %)
1 P-value derived from Fisher's exact text;2 Blood glucose measured only if had one or more symptoms of diabetes and OR familyhistory; 3 Abdominal obesity: WC >88cm female, WC >102 cm in male.
Figures
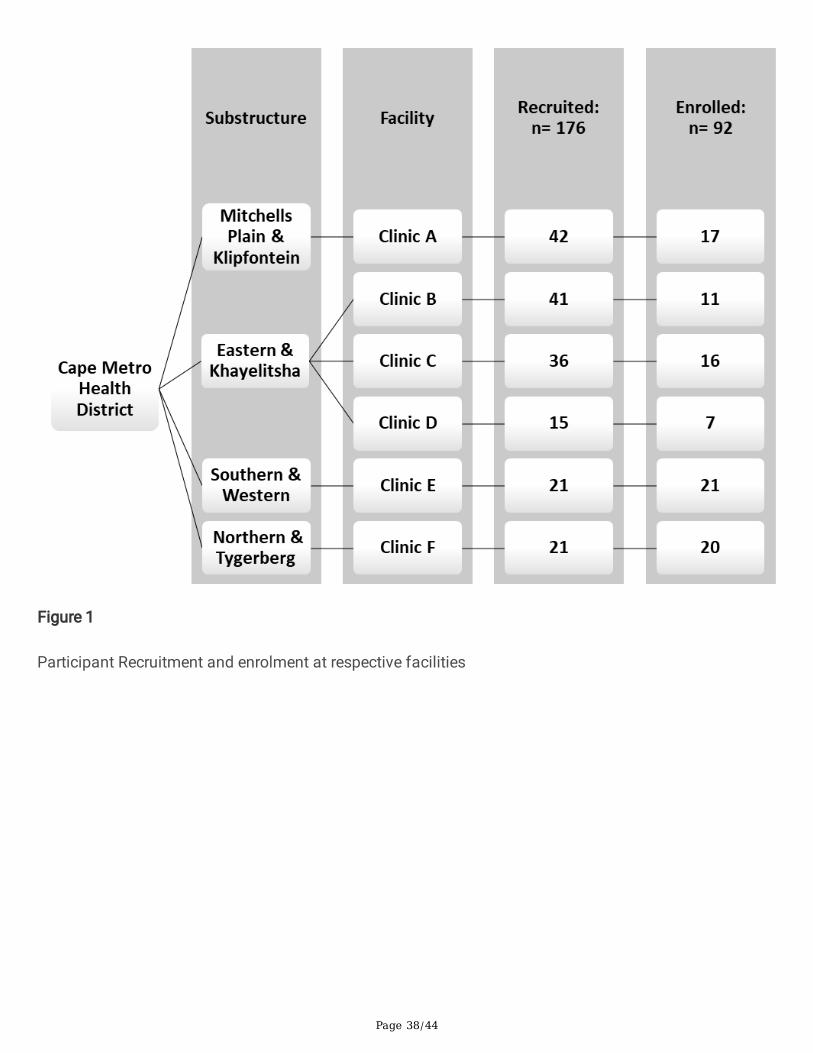
Page 38/44
Figure 1
Participant Recruitment and enrolment at respective facilities
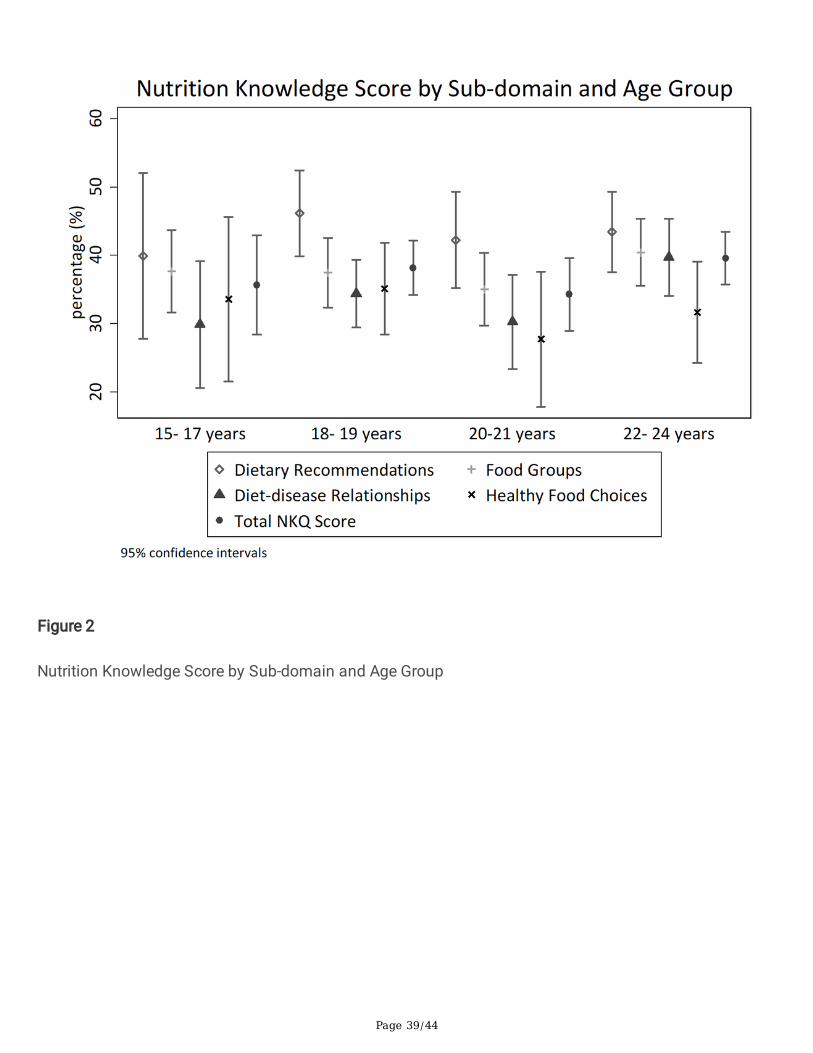
Page 39/44
Figure 2
Nutrition Knowledge Score by Sub-domain and Age Group
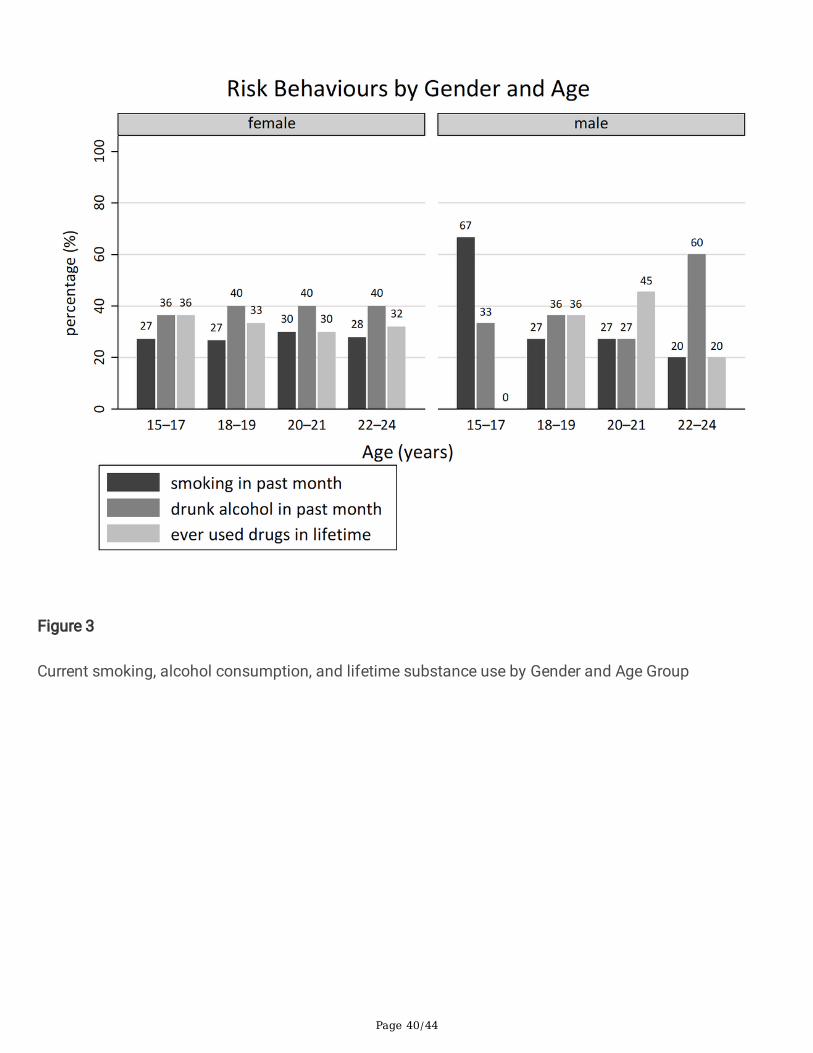
Page 40/44
Figure 3
Current smoking, alcohol consumption, and lifetime substance use by Gender and Age Group

Page 41/44
Figure 4
Mental Health Status by Gender and Age Group Bar represents proportion (%) with signi�cant depression(CESD score ≥10) by gender in each age group.
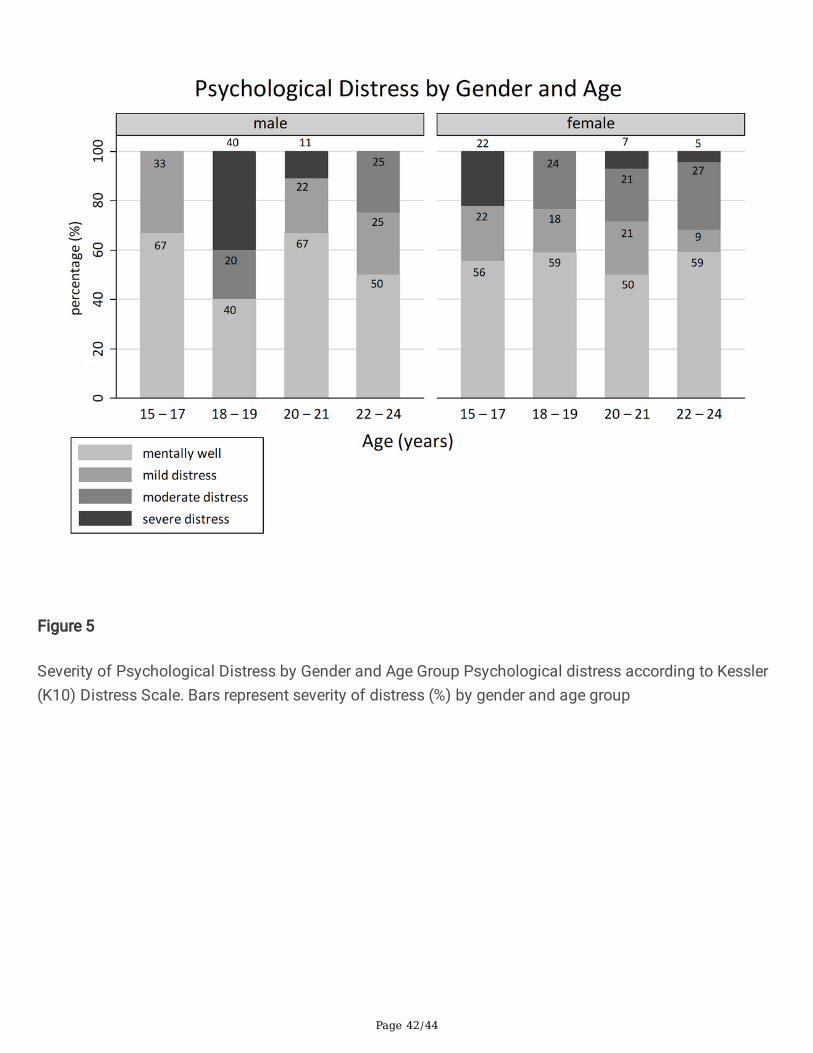
Page 42/44
Figure 5
Severity of Psychological Distress by Gender and Age Group Psychological distress according to Kessler(K10) Distress Scale. Bars represent severity of distress (%) by gender and age group
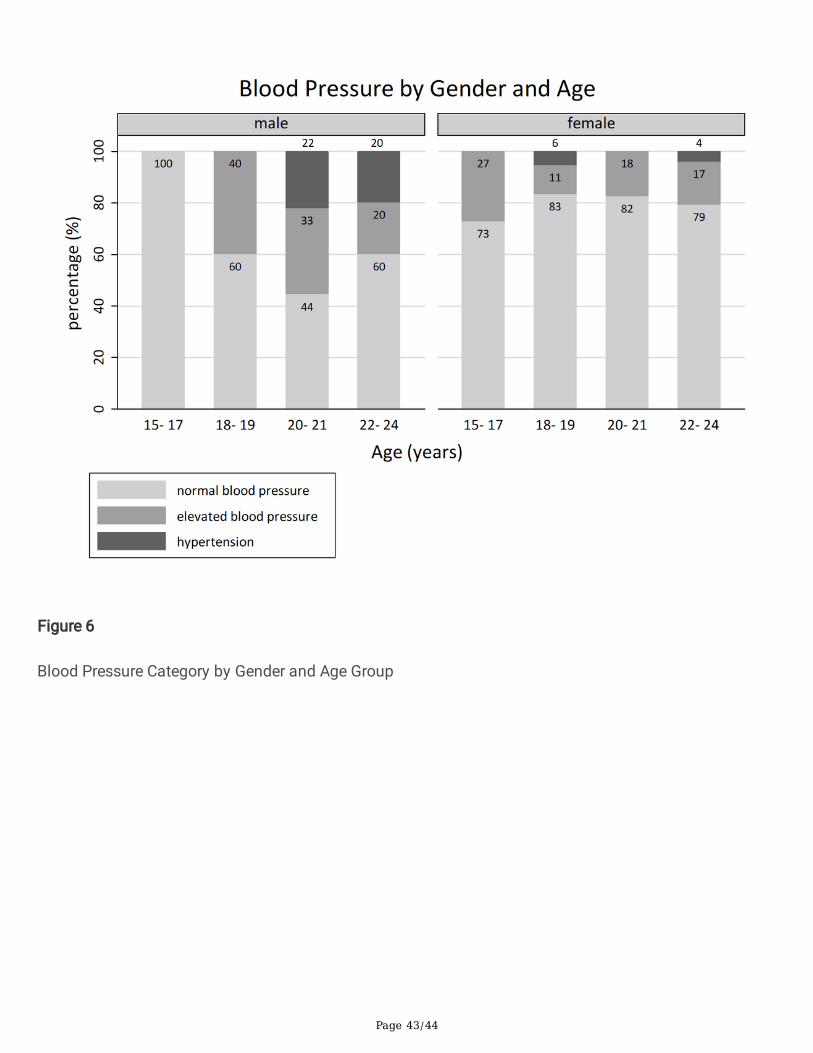
Page 43/44
Figure 6
Blood Pressure Category by Gender and Age Group
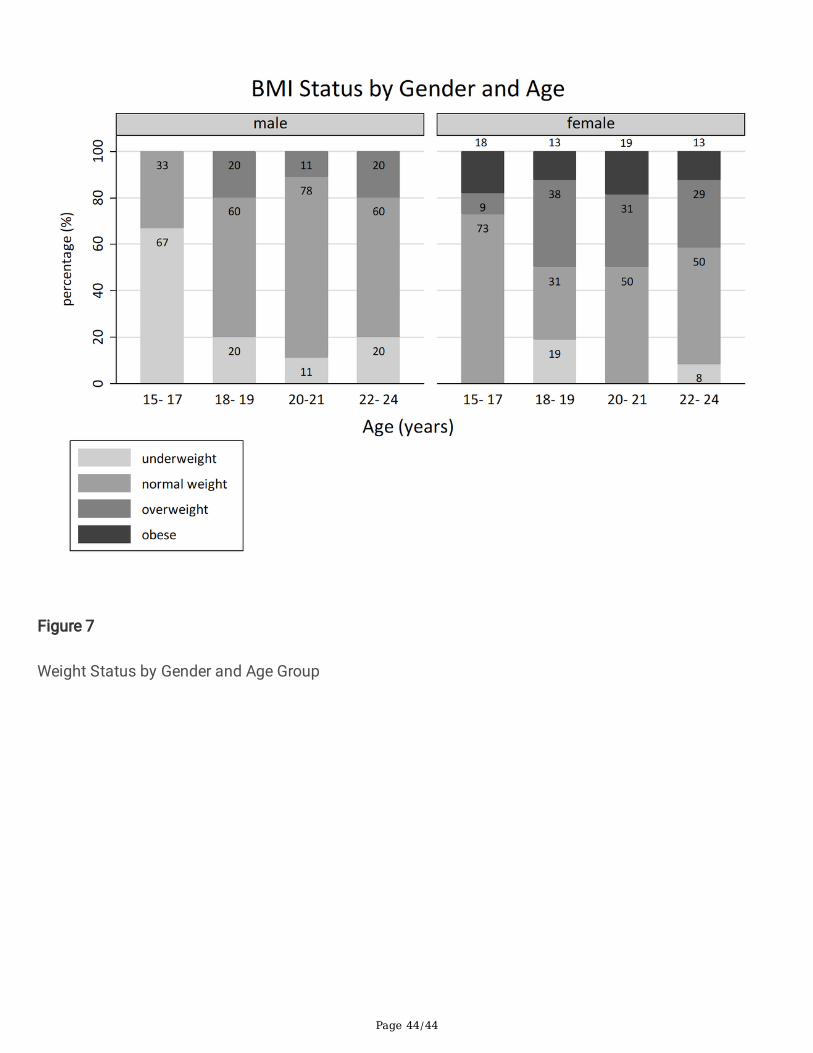
Page 44/44
Figure 7
Weight Status by Gender and Age Group

![Shale Gas and its Implications for Africa and the African ... · Shale gas and its implications for Africa and the African Development Bank;OL ]PL^Z L_WYLZZLK PU [OPZ W\ISPJH[PVU](https://static.fdocuments.us/doc/165x107/5f0640ca7e708231d4171054/shale-gas-and-its-implications-for-africa-and-the-african-shale-gas-and-its.jpg)