
Implications for Economic Development_How Stakeholder Perceptions Influence Entrepreneurism
174
IMPLICATIONS FOR ECONOMIC DEVELOPMENT: HOW STAKEHOLDER PERCEPTIONS INFLUENCE ENTREPRENEURISM A Dissertation Submitted to the Faculty of Argosy University, Sarasota College of Business In Partial Fulfillment of the Requirements for the Degree of Doctor of Business Administration by Richard J. Ferner, Jr. July, 2013
-
Upload
richard-j-ferner-jr-dba-mba -
Category
Documents
-
view
158 -
download
0
Transcript of Implications for Economic Development_How Stakeholder Perceptions Influence Entrepreneurism

IMPLICATIONS FOR ECONOMIC DEVELOPMENT: HOW STAKEHOLDER
PERCEPTIONS INFLUENCE ENTREPRENEURISM
A Dissertation
Submitted to the Faculty of Argosy University, Sarasota
College of Business
In Partial Fulfillment of the Requirements for the Degree of
Doctor of Business Administration
by
Richard J. Ferner, Jr.
July, 2013

All rights reserved
INFORMATION TO ALL USERSThe quality of this reproduction is dependent upon the quality of the copy submitted.
In the unlikely event that the author did not send a complete manuscriptand there are missing pages, these will be noted. Also, if material had to be removed,
a note will indicate the deletion.
Microform Edition © ProQuest LLC.All rights reserved. This work is protected against
unauthorized copying under Title 17, United States Code
ProQuest LLC.789 East Eisenhower Parkway
P.O. Box 1346Ann Arbor, MI 48106 - 1346
UMI 3574825
Published by ProQuest LLC (2013). Copyright in the Dissertation held by the Author.
UMI Number: 3574825

ii
IMPLICATIONS FOR ECONOMIC DEVELOPMENT: HOW STAKEHOLDER PERCEPTIONS INFLUENCE ENTREPRENEURISM
Copyright @ 2013
Richard J. Ferner, Jr.
All rights reserved

iv
IMPLICATIONS FOR ECONOMIC DEVELOPMENT: HOW STAKEHOLDER PERCEPTIONS INFLUENCE ENTREPRENEURISM
Abstract of Dissertation
Submitted to the Faculty of Argosy University, Sarasota
College of Business
In Partial Fulfillment of the Requirements for the Degree of
Doctor of Business Administration
by
Richard J. Ferner, Jr.
Argosy University
July, 2013
Dr. Pender Noriega
Dr. Kathleen Cornett
Department: College of Business

v
ABSTRACT
To address the challenges associated with a local economy encumbered by the
aftershocks of the Great Recession, this research study was designed to analyze the roles
of stakeholders, resources, and economic development strategies in promoting a healthy
regional economy to set the stage for developing a methodology for conducting primary
research. To establish clarity, the author initially conducted a review of the supporting
academic literature to assess how stakeholder perceptions influence entrepreneurism in
St. Petersburg, Florida. The author relied on qualitative research methods that
incorporated a purposive proportional quota sample of business owners and managers in
the City of St. Petersburg, Florida, and used one-to-one interviews and a focus group.
After synthesizing primary and secondary research findings, a subsequent analysis
demonstrated the importance of: (a) connections and alliances; (b) knowledge spillovers;
(c) grass roots support; (d) avoiding public policy contradictions; (e) properly aligned
business assistance programs; (f) university support in the formation of human capital;
(g) adequate supply of highly specialized human capital; (h) maintaining sufficient
financial reserves; (i) establishing a niche in the local marketplace ; and (j) an inclusive
approach to economic development planning.

vi
TABLE OF CONTENTS
Page
TABLE OF APPENDICES ............................................................................................. viii
CHAPTER ONE: THE PROBLEM ....................................................................................1 The Problem .........................................................................................................................1 Research Question .............................................................................................................10 Purpose of the Study ..........................................................................................................10 Definition of Terms............................................................................................................11 Significance of the Study ...................................................................................................15
CHAPTER TWO: REVIEW OF THE LITERATURE .....................................................16 Uncertainty .........................................................................................................................17 Intellectual Capital .............................................................................................................20 Entrepreneurs .....................................................................................................................21 Government........................................................................................................................24 Business Assistance Programs ...........................................................................................27 Universities ........................................................................................................................32 Human Capital ...................................................................................................................36 Financial Capital ................................................................................................................39 Brand Promotion ................................................................................................................48 Economic Development Planning ......................................................................................52 Summary ............................................................................................................................73
CHAPTER THREE: METHODOLOGY ..........................................................................75 Research Design .................................................................................................................75
Population and Sampling Procedures ..........................................................................75 Instrumentation ............................................................................................................77 Procedures ....................................................................................................................79 Methodological Assumptions ......................................................................................84
Data Processing and Analysis ............................................................................................85 Limitations .........................................................................................................................85 Delimitations ......................................................................................................................86
CHAPTER FOUR: DATA ANALYSIS AND RESULTS ................................................87 One-to-One Interview Participation ...................................................................................87 One-to-One Interview Coding ...........................................................................................88 One-to-One Interview Data Analysis and Results .............................................................89
Frequency Analysis ......................................................................................................89 Uncertainty .............................................................................................................89 Intellectual capital ..................................................................................................89 Entrepreneurs .........................................................................................................90 Government............................................................................................................91 Business assistance programs. ...............................................................................92 Universities ............................................................................................................93

vii
Human capital ........................................................................................................93 Financial capital .....................................................................................................94 Brand promotion ....................................................................................................94 Economic development planning ...........................................................................95
Co-Occurrence Analysis ..............................................................................................96 Focus Group Participation ...............................................................................................100 Focus Group Coding ........................................................................................................101 Focus Group Data Analysis and Results ..........................................................................102
Frequency Analysis ....................................................................................................102 Uncertainty ...........................................................................................................102 Intellectual capital ................................................................................................102 Entrepreneurs .......................................................................................................104 Government..........................................................................................................104 Business assistance programs ..............................................................................105 Universities ..........................................................................................................106 Human capital ......................................................................................................106 Financial capital ...................................................................................................107 Brand promotion ..................................................................................................107 Economic development planning .........................................................................108
Co-Occurrence Analysis ............................................................................................109 Recent Local Econometric Trends and Research Results ................................................110
CHAPTER FIVE: DISCUSSION, CONCLUSIONS, AND RECOMMENDATIONS .112 Discussion ........................................................................................................................112
Uncertainty .................................................................................................................112 Intellectual Capital .....................................................................................................113 Entrepreneurs .............................................................................................................114 Government................................................................................................................115 Business Assistance Programs ...................................................................................115 Universities ................................................................................................................116 Human Capital ...........................................................................................................117 Financial Capital ........................................................................................................118 Brand Promotion ........................................................................................................119 Economic Development Planning ..............................................................................121
Conclusion .......................................................................................................................124 Research Question .....................................................................................................124 Research Goals ...........................................................................................................126
Recommendations ............................................................................................................127 Conclusion .......................................................................................................................129
REFERENCES ................................................................................................................131

viii
TABLE OF APPENDICES
Appendix Page
A. Vacancy Rate Figures ................................................................................................142
B. Establishments by NAICS Code ................................................................................144
C. One-to-One Interview Informed Consent Form ........................................................147
D. Focus Group Discussion Guide .................................................................................149
E. Focus Group Informed Consent Form .......................................................................152
F. One-on-One Interview Codes ....................................................................................154
G. One-to-One Interview Co-occurrence Model ............................................................157
H. Focus Group Codes ....................................................................................................159
I. Focus Group Co-occurrence Model ...........................................................................164

1
CHAPTER ONE: THE PROBLEM
The Problem
The 2012 3rd Quarter Florida Small Business Index Survey, incorporating the
responses from 807 participants, revealed 64% of small business owners worry they will
be adversely impacted by regulations, restrictions, and taxes (Florida Chamber of
Commerce Small Business Council, 2012). In the context of willingness to engage in
hiring employees, 31% of respondents planned to do so in the next 6 months. In addition,
41% of respondents identified economic uncertainty as an impediment discouraging them
from hiring new employees, while 37% stipulated a lack of sales revenue to be an
inhibitor. In the context of access to capital, 73% of respondents reported they were not
able to secure financing over the last 6 months, which was a significant increase from the
41% reported in March of 2012. In the context of confidence in lending institutions, 52%
felt it would be harder to secure financing in the next 6 months. In the context of the top
five important issues facing Florida small businesses, 33% selected economic
uncertainty, 26% access to capital, 9% growth management process, 8% government
regulations, and 5% taxes (Florida Chamber of Commerce Small Business Council,
2012). Three years prior to this survey, DeLisle (2009) predicted this sentiment by
stipulating the nation had shifted from a market-based economy to a political economy
and indicating uncertainty would prevail until a bipartisan solution could be
implemented. To illustrate the nature of this concern, DeLisle stated:
The result of all this negativity has been a collapse in business confidence levels, which has placed many businesses on the defensive. In order to turn the corner in this downward cycle, credit flows and business confidence will have to be restored and bear close monitoring. (p. 11)
2
Colvin (2012) corroborated the findings reported by the Florida Chamber of
Commerce Small Business Council (2012) and DeLisle (2009) by stating economists had
detected significantly higher levels in the index of policy uncertainty (developed by
Stanford University and the University of Chicago). Colvin concluded heightened
uncertainty over tax and regulatory issues had instilled a lack of confidence in the
stability of economic policies, causing investors and business leaders to postpone capital
investment and hiring. DuBois (2012) stipulated the lack of bipartisanship in
Washington had instilled a sense of paralysis among business leaders and it was unlikely
abatement in the current state of affairs would occur until certainty had been restored. To
illustrate the impact of business uncertainty about Washington, MacDonald (2012)
posited the impasse had increased the nation’s unemployment rate by at least one
percentage point since early 2008. To overcome such concerns, Koba (2012) contended
all levels of government could improve the confidence of the business community by
being more supportive of entrepreneurs and innovators through the provision of the right
mix of incentives and fewer barriers to market entry. In the event that government cannot
and will not play a supportive role, DuBois recommended business leaders diversify their
portfolios and focus on medium- and long-term business opportunities to promote
growth.
This author’s assessment of the level of support provided to entrepreneurs in the
St. Petersburg area revealed a loose agglomeration of business assistance programs, some
of which fall under the auspices of the St. Petersburg Business Alliance (SPBA).
Noteworthy business assistance programs within the City of St. Petersburg include
City of St. Petersburg Business Assistance Center,
3
St. Petersburg Area Chamber of Commerce;
SCORE (national non-profit organization);
Florida Small Business Development Center (SBDC) at the University of
South Florida; and
SBDC at Pinellas County Economic Development.
Each program provides a range of services, to include: (a) entrepreneur training,
(b) start-up resources, (c) financing assistance, (d) business planning assistance, (e)
accounting and tax guidance, and (f) mentorship (SBDC, 2012). Despite the leadership
provided by the SPBA and the resource integration of business assistance programs,
redundancies are prevalent and a unified strategy for building sustainable business
clusters remains elusive (Trigaux, 2011a). In contrast, Hamilton (2008) stipulated
effective economic development programs are reflected in the convergence of economic
and political stakeholders engaged in coordinated strategic initiatives intended to change
the institutional environment for innovation.
A National Association of Manufacturers and the Council of Competitiveness
(NAMCC) survey focused on determining the best states for conducting business
revealed the State of Florida had dropped from an overall 18th place in 2011 to 29th
place in 2012 (Cohn, 2012; Trigaux, 2012). From 2011 to 2012, in the context of access
to capital, education, and infrastructure and transportation, Florida dropped from 9th to
24th place, 35th to 42nd place, and 8th to 11th place, respectively (Cohn, 2012; Trigaux,
2012). In addition, Trigaux (2012) reported Florida ranked comparatively low in the cost
of doing business (39th) and in quality-of-life (30th), but performed well in terms of its
workforce (3rd; e.g., education level, availability of workers, etc.). Despite Florida’s

4
high ranking for the desirability of its workforce, a qualitative examination conducted by
the Florida Center for Research and Science, Technology, Engineering and Mathematics
revealed
Nearly half of high school graduates entering Florida’s community colleges
required remediation in mathematics.
Less than 25% of bachelor’s degrees awarded through Florida state
universities were in science, technology, engineering, and mathematics
(STEM) fields of study.
Industry leaders consistently reported a shortage of qualified professionals to
fill STEM positions (Trigaux, 2011b).
Relying on a report from the Brookings Institution, Harrington (2012) reported
the Tampa Bay area ranked 88th out of the top 100 largest metropolitan areas for
matching education levels with the education requirements of employers. To illustrate
how a lack of qualified human capital can adversely affect a community’s potential for
achieving economic growth, Rothwell (2012) stated, “Less educated regional labor
markets may lack entrepreneurs who start or expand businesses, leading to fewer overall
openings and fewer openings for less educated workers” (p. 1). Rothwell noted higher-
educated employees in high-tech and exporting business sectors have consistently
stimulated the demand for local service jobs that require fewer academic credentials and
employers with a college education were found to be more likely to hire others to help
operate their businesses. In addition, Dewey (2012) and Harrington (2012) stipulated that
narrowing the education gap serves as an essential component for rejuvenating the health
of a metropolitan economy, which is often evidenced by sustained lower unemployment

5
and more robust job creation. Ultimately, Rothwell reported unemployment rates are
often two percentage points higher in large metropolitan areas with a shortage of
educated workers relative to demand and have been higher since the onset of the Great
Recession.
In the context of meeting the demand to fill highly-skilled jobs, Mizuno,
Mizutani, and Nakayama (2006) suggested structural unemployment can be exacerbated
by a shortage in qualified human capital. To demonstrate the value of a highly-skilled
workforce, Mizuno et al. reported an increase in highly-educated people by 10%
contributes to a 1% decrease in the unemployment rate. This situation is further
complicated by Florida’s historical dependence on construction and tourism, which are
highly susceptible to market forces that contribute to cyclical and seasonal
unemployment (Mizuno et al., 2006). As a potential remedy, Mizuno et al. suggested a
higher ratio of manufacturing sectors to service sectors can contribute to a lower
unemployment rate by insulating a region from market forces that contribute to higher
cyclical and seasonal unemployment. This remedy, however, is no panacea as structural
unemployment can be exacerbated by insufficient job-training programs and high
mobility costs (e.g., costs associated with changing occupations, financial transactions
associated with the sale of a home, etc.; Mizuno et al., 2006). To demonstrate the long-
term impact of Florida’s structural unemployment challenges, Denslow and Dewey
(2008) reported the State of Florida had a disproportionate share of relatively low-skilled
jobs (e.g., serving retirees, sales, food preparation, etc.) and the only high-skill
occupation groups in which Florida had a greater employment share than the nation were
in the fields of healthcare and law.
6
Adams (2012) disputed concerns over structural unemployment by contending the
skills shortage was a myth fostered by employers who were reluctant to invest in
employees by offering in-house training (e.g., apprenticeships, etc.) or who had
established unrealistic expectations for identifying perfectly qualified employees. Such
circumstances were evidenced by a Society for Human Resource Management (SHRM)
study that revealed only 38% of companies cross-train their employees to develop skills
not directly related to their jobs, which was a significant decline from the 43% in 2011
and 55% in 2008 (as cited in Adams, 2012). Adams posited that companies are taking
advantage of their dominance in the workplace to keep wages low and are cutting training
budgets to promote short-term gains that will likely prove to be unsustainable. To
overcome the skills disconnect, Pofeldt (2012) recommended human resources
professionals help their employers identify their long-term hiring needs and recruit
employees who represent a teachable fit. An employee classified as a teachable fit may
lack certain skills essential for the job, though through partnerships with local community
colleges and technical schools, flexible individuals could overcome such shortcomings
and emerge as a valuable resource.
Unemployment throughout the United States, the State of Florida, and the Tampa-
St. Petersburg-Clearwater Metropolitan Statistical Area (MSA) remains a contentious
issue. For example, the U.S. Department of Labor (2012) reported the average monthly
unemployment rate from January 2012 to June 2012 for the nation, State of Florida, and
the Tampa-St. Petersburg-Clearwater MSA remained elevated at 8.2%, 9.0%, and 9.1%,
respectively. Furthermore, an analysis of monthly unemployment rates from 2007 to
2012 revealed the Tampa-St. Petersburg-Clearwater MSA’s average monthly

7
unemployment rate of 8.9% has trailed behind the nation’s 7.7% and State of Florida’s
8.5% average monthly unemployment rates. Prior to the Great Recession, the U.S.
Department of Labor reported the 2002 to 2006 Tampa-St. Petersburg-Clearwater MSA’s
average monthly unemployment rate of 4.5% outperformed the nation’s 5.4% and state’s
4.6% average monthly unemployment rates. In addition, Weidner and Williams (2011)
contended that prior to the Great Recession, the normal unemployment rate was 4.8%.
Following the Great Recession, the Congressional Budget Office (CBO) adjusted that
statistic to 5.2%, attributing this phenomenon to: (a) the extension of unemployment
benefits and the reduced incentive of the unemployed to seek less desirable jobs, (b) the
skills mismatch between job seekers and employers, and (c) the sizable increase in long-
term unemployed exacerbated by deteriorating skills and a weakening labor market
(Weidner & Williams, 2011).
In the context of the best cities for young professionals, the Tampa Bay region
was rated last (40th) among metropolitan areas by Forbes in 2008. This low ranking was
attributed to the service-oriented nature of the local economy, diminished tourism, the
prevalence of individuals living on a fixed income, and a lack of innovation (Woolsey,
2008a). In addition, Woolsey (2008b) reported employment opportunities for 25- to 35-
year-olds lagged due to an ongoing vicious cycle that was inhibiting the region’s ability
to attract top performing firms and the nation’s best young talent, which is best described
as a simultaneity problem. Woolsey posited the region had been put at a disadvantage in
terms of the research capabilities and reputation of local universities. Furthermore,
Woolsey stipulated it requires a critical mass of research universities on the level of
Stanford or Harvard to promote innovative companies and attract world-class
8
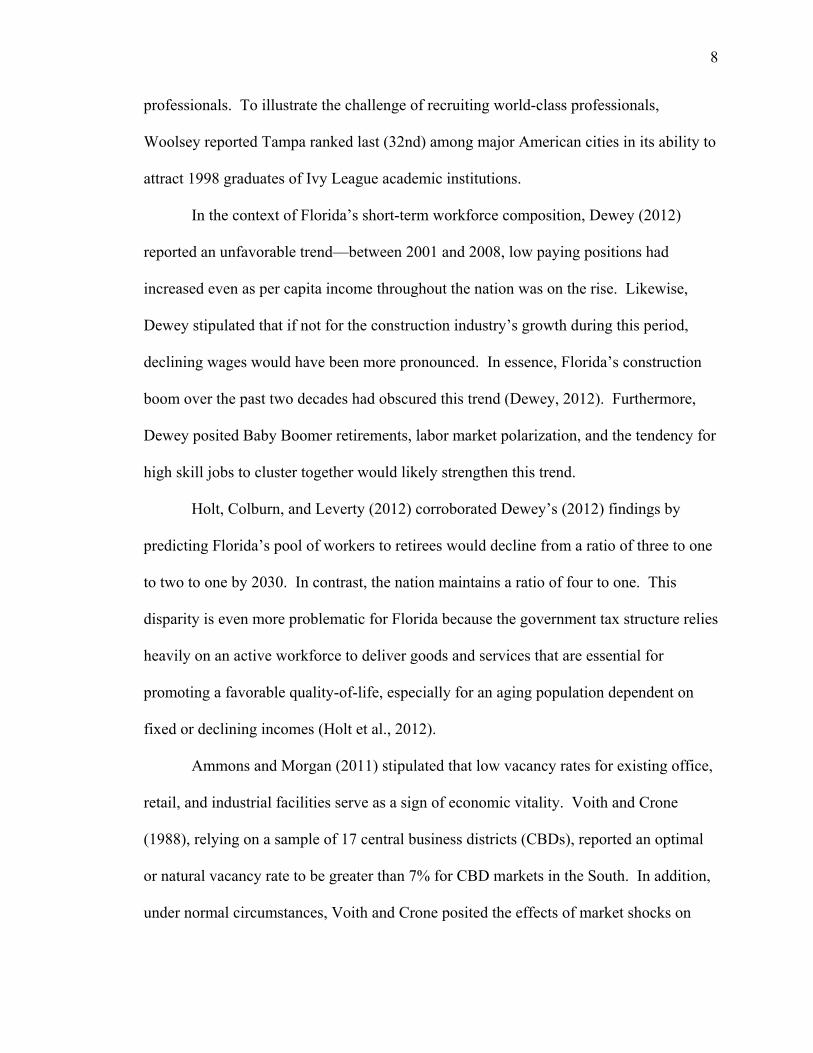
professionals. To illustrate the challenge of recruiting world-class professionals,
Woolsey reported Tampa ranked last (32nd) among major American cities in its ability to
attract 1998 graduates of Ivy League academic institutions.
In the context of Florida’s short-term workforce composition, Dewey (2012)
reported an unfavorable trend––between 2001 and 2008, low paying positions had
increased even as per capita income throughout the nation was on the rise. Likewise,
Dewey stipulated that if not for the construction industry’s growth during this period,
declining wages would have been more pronounced. In essence, Florida’s construction
boom over the past two decades had obscured this trend (Dewey, 2012). Furthermore,
Dewey posited Baby Boomer retirements, labor market polarization, and the tendency for
high skill jobs to cluster together would likely strengthen this trend.
Holt, Colburn, and Leverty (2012) corroborated Dewey’s (2012) findings by
predicting Florida’s pool of workers to retirees would decline from a ratio of three to one
to two to one by 2030. In contrast, the nation maintains a ratio of four to one. This
disparity is even more problematic for Florida because the government tax structure relies
heavily on an active workforce to deliver goods and services that are essential for
promoting a favorable quality-of-life, especially for an aging population dependent on
fixed or declining incomes (Holt et al., 2012).
Ammons and Morgan (2011) stipulated that low vacancy rates for existing office,
retail, and industrial facilities serve as a sign of economic vitality. Voith and Crone
(1988), relying on a sample of 17 central business districts (CBDs), reported an optimal
or natural vacancy rate to be greater than 7% for CBD markets in the South. In addition,
under normal circumstances, Voith and Crone posited the effects of market shocks on

9
vacancy rates dissipate rapidly in most markets. This does not appear to be the case for
the Tampa Bay region (Tampa-St. Petersburg-Clearwater MSA). Albright (2012)
reported that while the Tampa Bay region’s average retail vacancy rate had improved
from 11.5% in 2011 to 10.3% in 2012, it had been diminished by poorly performing
downtown areas in Tampa and St. Petersburg, overbuilt areas in Pasco County, and
neighborhoods laden with outdated strip centers. Despite this overall improvement,
Yeates and Montgomery (1999) warned this phenomenon could be more reflective of the
removal of commercial stock due to redevelopment or land-use adjustments as opposed
to improving economic conditions. Likewise, Yeates and Montgomery contended the
growth of big-box retailers and shopping centers can contribute to a declining
commercial vacancy rate. Similarly, from 2007 to 2012, St. Petersburg construction
permits increased 8% while paid business tax receipts declined 8.2%.
To demonstrate the local econometric performance of St. Petersburg, the City of
St. Petersburg (2012a) reported:
Downtown area office space vacancy rates increased from 11.9% in 2007 to
13.7% in 2012 (15.1% increase; See Appendix A).
Downtown area retail vacancy rates increased from 1.4% in 2007 to 11.9% in
2012 (750% increase).
Gateway area office vacancy rates increased from 12.4% in 2007 to 13.4% in
2012 (8.1% increase; See Appendix A).
Gateway area and Mid-Pinellas industrial and flex space vacancy rates
increased from 5.5% in 2007 to 9.6% in 2012 (74.5% increase).
10
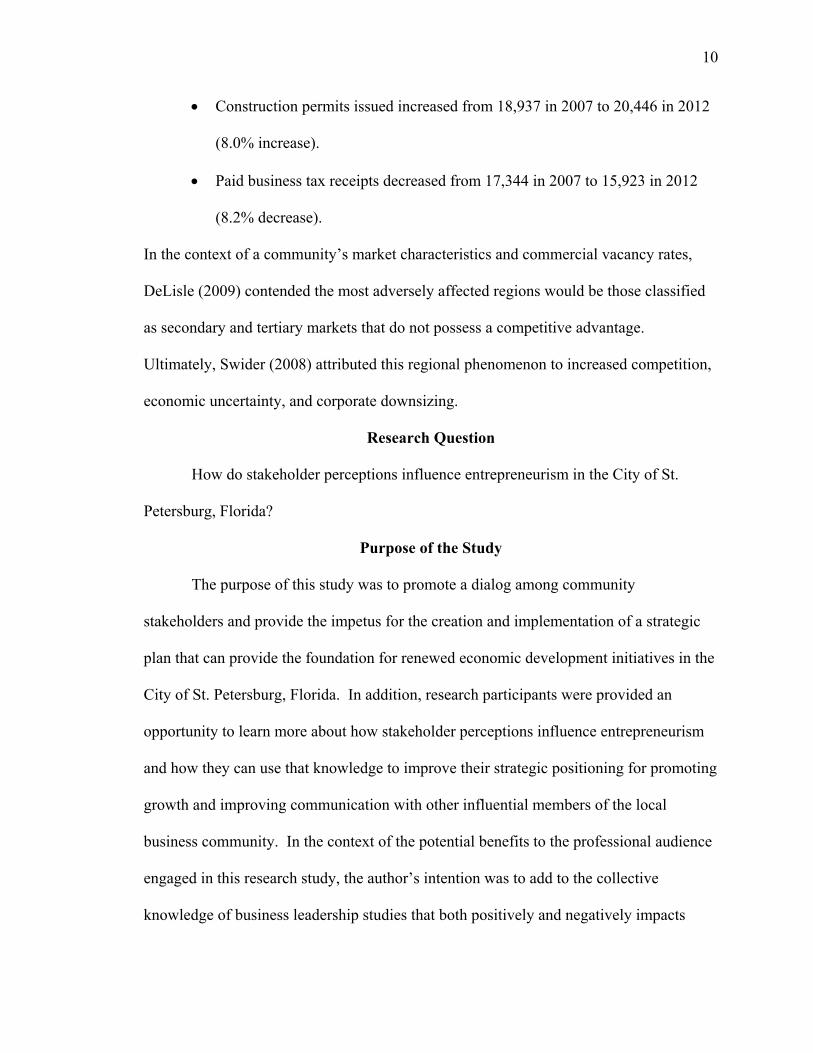
Construction permits issued increased from 18,937 in 2007 to 20,446 in 2012
(8.0% increase).
Paid business tax receipts decreased from 17,344 in 2007 to 15,923 in 2012
(8.2% decrease).
In the context of a community’s market characteristics and commercial vacancy rates,
DeLisle (2009) contended the most adversely affected regions would be those classified
as secondary and tertiary markets that do not possess a competitive advantage.
Ultimately, Swider (2008) attributed this regional phenomenon to increased competition,
economic uncertainty, and corporate downsizing.
Research Question
How do stakeholder perceptions influence entrepreneurism in the City of St.
Petersburg, Florida?
Purpose of the Study
The purpose of this study was to promote a dialog among community
stakeholders and provide the impetus for the creation and implementation of a strategic
plan that can provide the foundation for renewed economic development initiatives in the
City of St. Petersburg, Florida. In addition, research participants were provided an
opportunity to learn more about how stakeholder perceptions influence entrepreneurism
and how they can use that knowledge to improve their strategic positioning for promoting
growth and improving communication with other influential members of the local
business community. In the context of the potential benefits to the professional audience
engaged in this research study, the author’s intention was to add to the collective
knowledge of business leadership studies that both positively and negatively impacts

11
entrepreneurism and economic development and therefore contributes to overall
leadership effectiveness. The goals for this research study were to
determine how economic, social, and environmental factors inspire or inhibit
entrepreneurism;
determine how stakeholder perceptions influence entrepreneurism; and
determine how the interactions of economic, social, and environmental
factors, as well as the perceptions of stakeholders, inspire or inhibit
entrepreneurism.
Definition of Terms
Angel investor. An investor who provides the financial backing for small start-
ups or entrepreneurs. Angel investors are usually found among an entrepreneur’s family
and friends. The capital they provide can be a one-time injection of seed money or
ongoing support to carry the company through difficult times. Angel investors give more
favorable terms than other lenders, as they are usually investing in the person rather than
the viability of the business. They are focused on helping the business succeed rather
than reaping a huge profit from their investment. Angel investors are essentially the
exact opposite of a venture capitalist (Investopedia, 2012a).
Business incubator. A firm engaged in fostering early-stage companies through
the developmental phases until such time as the company has sufficient financial, human,
and physical resources to sustain functional independence. The business incubator can be
either a non-profit or for-profit entity and can provide assistance through: (a) access to
financial capital through relationships with financial partners, (b) access to experienced
business consultants and management-level executives, (c) access to physical location

12
space and business hardware and software, and (d) access to informational and research
resources through relationships with local universities and government entities
(Investopedia, 2013).
Creative class. A fast growing, highly educated, and well compensated segment
of the workforce on whose efforts corporate profits and economic growth are increasingly
dependent. Members of the creative class perform a wide variety of tasks in a wide
variety of industries, from technology to entertainment, journalism to finance, and high-
end manufacturing to the arts. These individuals do not consciously think of themselves
as members of this class; however, they share a common ethos that holds creativity,
individuality, difference and merit in high regard (Florida, 2002).
Creative destroyer. Entrepreneurs who create new wealth through innovation
that, in turn, destroys existing market structures used by incumbents to promote
competitive advantage (“Creative destroyer,” 2004).
Cyclical unemployment. A factor of overall unemployment that relates to the
cyclical trends in growth and production that occur within the business cycle. When
business cycles are at their peak, cyclical unemployment will be low because total
economic output is being maximized. When economic output falls, as measured by the
gross domestic product (GDP), the business cycle is low and cyclical unemployment will
rise. Economists describe cyclical unemployment as the result of businesses not having
enough demand for labor to employ all those who are looking for work. The lack of
employer demand comes from a lack of spending and consumption in the overall
economy (Investopedia, 2012b).

13
Great Recession. A buzz word that describes the recession that started in
December of 2007 in terms of the Great Depression of the 1930s. Generally, the Great
Recession lasted longer and was more severe than prior recessions. However, the
severity of economic decline has not eclipsed the levels reached by the Great Depression
(Investopedia, 2012c).
Industrial recruitment. A competitive strategy employed by communities to
attract new business firms from other markets by relying principally on financial
incentives that can serve to lower production costs and increase competitive advantage
(Renski, 2009).
Normal employment rate. The unemployment rate that occurs in even a healthy
economy because workers are always coming and going, looking for a better job, and
often they are unemployed until they find that better job. The only way an economy
could have a 0% unemployment rate is if it was severely overheated. Even then, wages
would probably rise before there could actually be no unemployment (Amadeo, 2012).
North American Industry Classification System (NAICS). The standard relied
upon by federal statistical agencies in classifying business establishments for the purpose
of collecting, analyzing, and publishing data associated with the U.S. business economy
(U.S. Census Bureau, 2012).
Recency bias. The inclination to rely on a recent experience as the baseline for
what will happen in the future (Richards, 2012).
Return on investment. A performance measure used to evaluate the efficiency of
an investment or to compare the efficiency of a number of different investments. To

14
calculate ROI, the benefit (return) of an investment is divided by the cost of the
investment; the result is expressed as a percentage or a ratio (Investopedia, 2012d).
Seasonal unemployment. Periodic unemployment created by seasonal variations
in particular industries, especially industries such as construction that are affected by the
weather (“Seasonal unemployment,” n.d.).
Selectionism. Trying several alternative solutions and selecting the option that
demonstrates the potential for best ex post performance (Sommer, Loch, & Dong, 2009).
Structural unemployment. Unemployment resulting from changes in the basic
composition of the economy. These changes simultaneously open new positions for
trained workers. An example of structural unemployment is the technological revolution.
Computers may have eliminated jobs, but they also opened up new positions for those
who have the skills to operate computers (Investopedia, 2012e).
Trial-and-error learning. Actively searching for new information and
demonstrating flexibility by adjusting activities and targets when encountering new
findings. This method requires stakeholders to apply new and original problem-solving
methods as new information is acquired (Sommer et al., 2009).
Venture capital. Money provided by investors to start-up firms and small
businesses with perceived long-term growth potential. This is a very important source of
funding for start-ups that do not have access to capital markets. It typically entails high
risk for the investor but has the potential for above-average returns. Venture capital can
also include managerial and technical expertise. Most venture capital comes from a
group of wealthy investors, investment banks, and other financial institutions that pool
such investments or partnerships. This form of raising capital is popular among new
15
companies or ventures with limited operating history, as they cannot raise funds by
issuing debt. The downside for entrepreneurs is that venture capitalists usually get a say
in company decisions in addition to a portion of the equity (Investopedia, 2012f).
Significance of the Study
This dissertation research study is significant because it represents what the
author posits to be a departure from the routine examination of factors that influence
community economic development. Unlike quantitative research methods, the author
concluded that qualitative research methods would enable him to clarify how the lived
experiences of respondents shaped their perceptions and, ultimately, how those
perceptions influence entrepreneurism in the City of St. Petersburg. The audience who
will likely derive value from this dissertation research study includes business leaders,
managers, politicians, public administrators, representatives of non-governmental
organizations (NGOs), and academics.

16
CHAPTER TWO: REVIEW OF THE LITERATURE
Smedlund (2006) contended that healthy regional economies demonstrate the
capacity to maintain their critical mass of constant innovation and effective production as
a means of preventing slow decay. Furthermore, a healthy regional economy will inspire
confidence as evidenced by its ability to attract flows of capital, competent employees,
and multinational companies. By virtue of this type of performance, regional economies
will demonstrate the ability to compete against other regional economies (Smedlund,
2006). Since 1993, however, U.S. companies with at least 25,000 employees have
experienced a net drop in employment due to the propensity for large firms to engage in
downsizing, outsourcing, and off shoring (Corman, Lussier, & Nolan, 1996; Gupta &
York, 2008; Judd & McNeil, 2008). Dymski (1996) and Judd and McNeil (2008)
contended that large firms cannot be depended upon for job creation as they have likely
contributed to the diminished state of job and wealth structures. For example, Judd and
McNeil reported there was no net contribution in job creation from large firms from 1990
to 2003 as evidenced by their contribution of 40% of gross new jobs and 43.5% of gross
job loss. Exacerbating this situation, Judd and McNeil reported the formation of large
firms in certain areas of the nation actually discouraged the establishment of start-ups and
retarded the growth of existing firms, adversely impacting net economic performance.
Conversely, small firms have been recognized for their role as the nation’s
primary engine for job creation (Corman et al., 1996; Friar & Meyer, 2003; Gupta &
York, 2008; Hamilton, 2008; Henderson, 2002; Judd & McNeil, 2008). For example,
Judd and McNeil (2008) reported that from 1990 to 2003, small firms experienced job
losses of 24% and job growth of nearly 80%. In addition, Appelbaum and Kamal (2000)
17
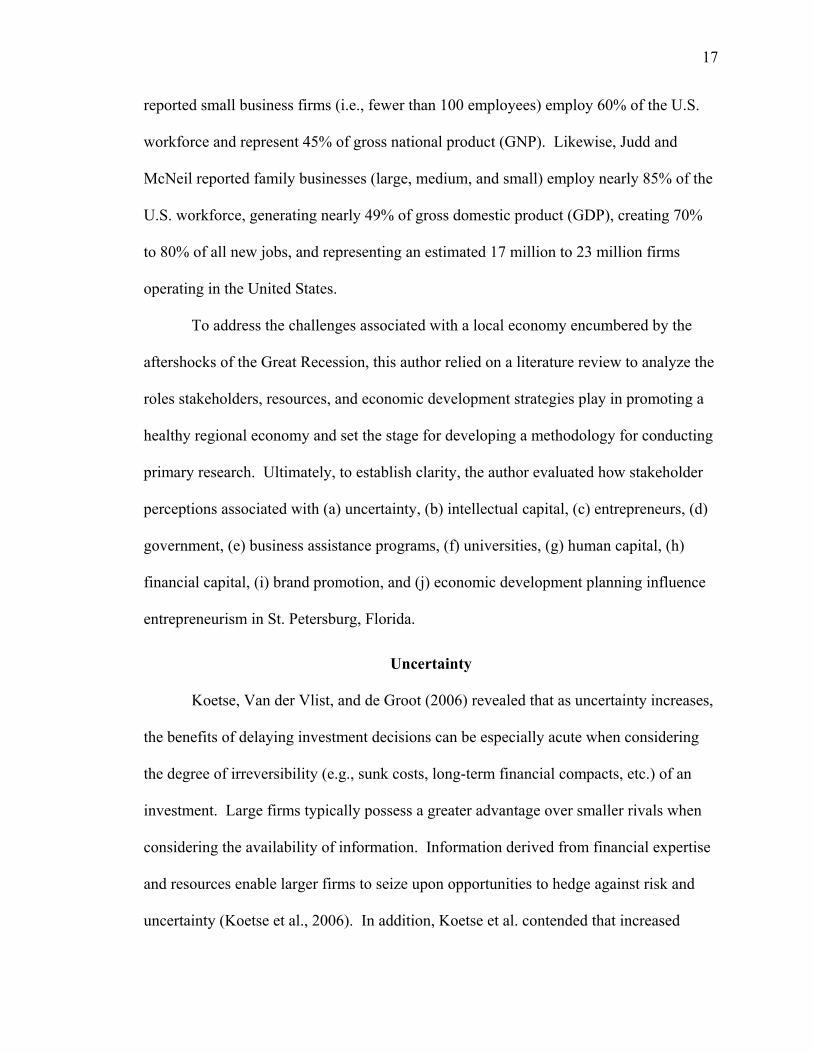
reported small business firms (i.e., fewer than 100 employees) employ 60% of the U.S.
workforce and represent 45% of gross national product (GNP). Likewise, Judd and
McNeil reported family businesses (large, medium, and small) employ nearly 85% of the
U.S. workforce, generating nearly 49% of gross domestic product (GDP), creating 70%
to 80% of all new jobs, and representing an estimated 17 million to 23 million firms
operating in the United States.
To address the challenges associated with a local economy encumbered by the
aftershocks of the Great Recession, this author relied on a literature review to analyze the
roles stakeholders, resources, and economic development strategies play in promoting a
healthy regional economy and set the stage for developing a methodology for conducting
primary research. Ultimately, to establish clarity, the author evaluated how stakeholder
perceptions associated with (a) uncertainty, (b) intellectual capital, (c) entrepreneurs, (d)
government, (e) business assistance programs, (f) universities, (g) human capital, (h)
financial capital, (i) brand promotion, and (j) economic development planning influence
entrepreneurism in St. Petersburg, Florida.
Uncertainty
Koetse, Van der Vlist, and de Groot (2006) revealed that as uncertainty increases,
the benefits of delaying investment decisions can be especially acute when considering
the degree of irreversibility (e.g., sunk costs, long-term financial compacts, etc.) of an
investment. Large firms typically possess a greater advantage over smaller rivals when
considering the availability of information. Information derived from financial expertise
and resources enable larger firms to seize upon opportunities to hedge against risk and
uncertainty (Koetse et al., 2006). In addition, Koetse et al. contended that increased
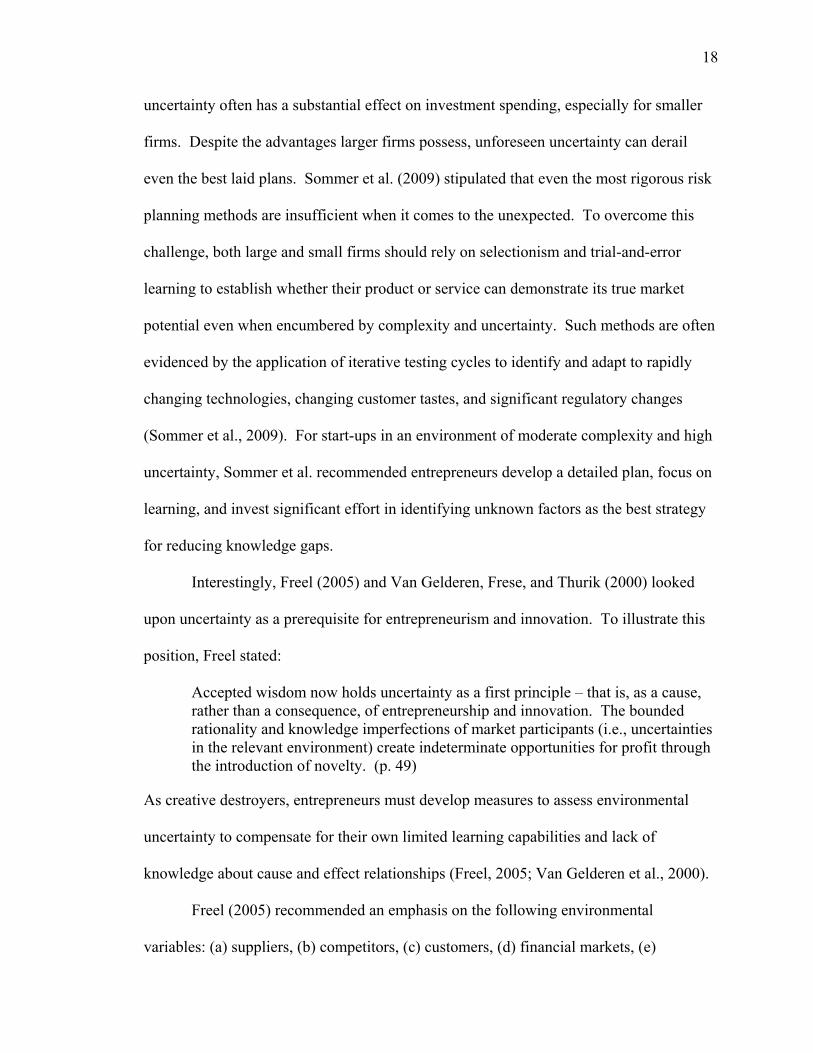
18
uncertainty often has a substantial effect on investment spending, especially for smaller
firms. Despite the advantages larger firms possess, unforeseen uncertainty can derail
even the best laid plans. Sommer et al. (2009) stipulated that even the most rigorous risk
planning methods are insufficient when it comes to the unexpected. To overcome this
challenge, both large and small firms should rely on selectionism and trial-and-error
learning to establish whether their product or service can demonstrate its true market
potential even when encumbered by complexity and uncertainty. Such methods are often
evidenced by the application of iterative testing cycles to identify and adapt to rapidly
changing technologies, changing customer tastes, and significant regulatory changes
(Sommer et al., 2009). For start-ups in an environment of moderate complexity and high
uncertainty, Sommer et al. recommended entrepreneurs develop a detailed plan, focus on
learning, and invest significant effort in identifying unknown factors as the best strategy
for reducing knowledge gaps.
Interestingly, Freel (2005) and Van Gelderen, Frese, and Thurik (2000) looked
upon uncertainty as a prerequisite for entrepreneurism and innovation. To illustrate this
position, Freel stated:
Accepted wisdom now holds uncertainty as a first principle – that is, as a cause, rather than a consequence, of entrepreneurship and innovation. The bounded rationality and knowledge imperfections of market participants (i.e., uncertainties in the relevant environment) create indeterminate opportunities for profit through the introduction of novelty. (p. 49)
As creative destroyers, entrepreneurs must develop measures to assess environmental
uncertainty to compensate for their own limited learning capabilities and lack of
knowledge about cause and effect relationships (Freel, 2005; Van Gelderen et al., 2000).
Freel (2005) recommended an emphasis on the following environmental
variables: (a) suppliers, (b) competitors, (c) customers, (d) financial markets, (e)

19
government and regulatory agencies, and (f) trade unions. Even if business leaders have
sufficient experience to promote their innovations, a hostile environment and intense
competition can pressure firms to adopt strategies that favor financial conservation over
innovation. In many cases, environmental uncertainty can make funding new ventures
less attractive (Storrud-Barnes, Reed, & Jessup, 2010). Some firms, regardless of
economic conditions, will seek to distinguish themselves on the basis of product
differentiation (e.g., premium pricing, incremental improvements, etc.) as opposed to real
innovation (Freel, 2005). Despite such practices, the ability to innovate may ultimately
be contingent upon a firm’s ability to recruit and retain talented human capital.
Ultimately, promoting innovation may help foster a workplace that is perceived as less
hostile and more certain despite conditions in the competitive environment (Freel, 2005).
Liao and Gartner (2006) noted some level of business planning is essential to the
survival of new ventures. In fact, they contended nascent entrepreneurs who completed a
business plan were 2.6 times more likely to survive the initial stages of firm formation.
Early planning proved to be essential in the initial stages of start-up formation, especially
when operating in environments encumbered with financial uncertainty and significant
competitive pressures. Despite these initial findings, Liao and Gartner revealed some
nascent entrepreneurs planned late when they perceived less financial, competitive, and
operational (e.g., obtaining raw materials, attracting employees, and obtaining supplies)
uncertainty. In addition, some researchers advocate the abandonment of strategic
planning altogether when faced with uncertainty. Rather, under this philosophy, nascent
entrepreneurs would be better served by abandoning the strategic planning process and

20
adopting a more adaptive method of responding to emerging challenges (Liao & Gartner,
2006).
Intellectual Capital
Doring, Knappitsch, and Aigner (2010) and Hamilton (2008) stipulated the
geographic or spatial agglomeration of businesses in metropolitan areas often results in
the production of knowledge spillover effects that contribute to economic growth and
higher per-capita value creation. Likewise, Firestone (2010) theorized that establishing
operations near another industry can serve to reduce innovation costs, and productivity
benefits from localized knowledge spillovers often outweigh an increase in congestion
costs, promoting equilibrium between diversity and productivity. To achieve this state of
equilibrium, Firestone indicated policy makers should attempt to establish technological
links (e.g., common knowledge base) between the current industrial base and targeted
industries in order to lower the subsidy thresholds necessary to attract new firms. In
addition, Firestone stipulated that when cities attain a state of equilibrium, the benefits
(e.g., offset congestion costs, lower transportation costs, lower commuting costs, etc.)
from cross-industry spillovers make the community more appealing to firms and
entrepreneurs.
Downtown areas often serve as the epicenter for business firm agglomeration and
knowledge spillovers. R. Baker (2011), a former mayor of the City of St. Petersburg,
illustrated this position by stating:
A downtown is more than a location on a map. It is where a city defines itself, and it is the prism through which the outside world views the city. Downtown is a city’s heart, so if a city is to thrive, its heart must be strong. A downtown with a large commercial, office, and residential base will contribute significantly to the tax rolls of the city with the effect of reducing the tax burden on residents in the city’s neighborhoods, helping residents throughout the city save money. But

21
downtown is more than just a revenue producer. The city center contains many of the community’s businesses, apartments, restaurants, parks, and museums. The major events typically occur there. When it works, downtown becomes the gathering place for the entire city and the surrounding areas. (p. 52)
In addition, R. Baker stipulated that companies and employees alike are attracted to
downtown areas with a higher perceived quality-of-life. Likewise, if vibrancy improves,
there is a significant likelihood that businesses will want to join the downtown
community (R. Baker, 2011). Ultimately, Florida (2012) contended human capital
clusters are responsible for the agglomeration of business firms, which in turn,
concentrate to seize upon the advantages that are derived from common labor pools, not
just to take advantage of linked networks and suppliers.
Entrepreneurs
Relying on quantitative data from 1990 to 2001, Gupta and York (2008) reported
areas of the United States with the highest entrepreneurial growth experienced 125%
higher employment growth, 58% higher wage growth, and 109% higher productivity. In
the context of facilitating conditions that foster job creation, Audretsch and Keilbach
(2005), Corman et al. (1996), Falcone and Wilson (2008), Florida (2012), Gupta and
York (2008), Lerner (2010), Renski (2009), and Yusuf (2010) contended it is essential for
local stakeholders to establish a culture of support to attract and anchor entrepreneurial
firms. To illustrate the importance of this position, Florida (2012) noted creative
individuals require a supportive environment comprising a broad array of social, cultural,
and economic stimuli. Likewise, Smedlund (2006) stipulated stakeholders can facilitate
this endeavor by promoting interconnected networks supported by the collaboration of
regionally embedded institutions (e.g., governments, chambers of commerce, employer’s
unions, banks, science parks, universities, and training centers).

22
Acting as intermediaries, these institutions rely on interconnected networks to
facilitate knowledge transfers for the purpose of attracting financial and creative human
capital (Smedlund, 2006). To illustrate the importance of this issue, Gupta and York
(2008) stated:
Entrepreneurial climate is important not only in creating nascent entrepreneurs, but also in promoting the transition from entrepreneurial attitudes to firm formation and growth. As such, a key topic for entrepreneurship research is to understand what general populations, as well as small business owners’ attitudes are toward entrepreneurship and small business. (p. 349)
Henderson (2002) stipulated that entrepreneurial activity has been recognized for
up to a third of the difference in economic growth rates between nations, contributing
favorably to gross domestic product (GDP). Likewise, Doh (2000) stipulated
entrepreneurial firms demonstrate the following advantages: (a) proactive toward
marketplace opportunities, (b) risk tolerant, (c) innovative, and (d) adaptive to changing
economic conditions. To demonstrate the importance of entrepreneurism in the United
States, Yusuf (2010) reported 70% of the nation’s economic growth was derived from its
associated activity and 67% of all inventions and 95% of all radical innovations created
since World War II have been originated by this method for economic growth.
Bednarzik (2000) defined entrepreneurship as “any attempt at new business or new
venture creation, such as self-employment, a new business organization, or the expansion
of an existing business, by an individual, a team of individuals, or an established
business” (p. 14). Lichtenstein, Lyons, and Kutzhanova (2004) stipulated that
entrepreneurs often act in the capacity of a marriage broker––demonstrating what is
desirable from an economic (opportunity) perspective and what is possible from a
technological (innovation) perspective. Essentially, an entrepreneur’s primary goal is to
create or capitalize on new economic opportunities through the process of innovation.

23
Entrepreneurs develop novel solutions to existing problems or establish connections
between existing solutions and unmet needs or new opportunities (Lichtenstein et al.,
2004). Likewise, Ho and Wong (2006) contended that entrepreneurs are motivated by
either marketplace opportunities or necessity––driven to self-employment by the absence
of alternative employment. In the context of what facets characterize entrepreneurial
start-ups, Falcone and Wilson (2008) contended:
Entrepreneurs often lack deep managerial or industry experience.
Businesses tend to be low investment, high uncertainty, have low potential for
profit, and lack start-up capital to secure large returns.
With limited start-up capital, high uncertainty, and minimal planning,
entrepreneurs must be adaptive.
Without a track record, entrepreneurs often have difficulty securing resources,
which requires them to make tradeoffs to gain the assistance of investors.
Entrepreneurs need to have a tolerance for ambiguity and possess a solid work
ethic in the initial stages of development.
Renski (2009) stipulated that entrepreneurship was the key to reinvigorating
communities in the United States as evidenced by its close ties to the formation of human
capital and regional economic growth. Likewise, Degan (2010) described entrepreneurs
as agents of creative destruction who promote innovation by rendering more expensive or
lower performing products or services as obsolete and introducing value added
alternatives that are less costly and more efficient. Lichtenstein et al. (2004) contended
human capital is the key element in developing an entrepreneurial society. Gupta and
York (2008) and Henderson (2002) reported that in the decade preceding the economic

24
recession of 2007, entrepreneurs facilitated an estimated 75% of the 500,000 jobs created
on an annual basis.
Government
In the context of government’s role in facilitating start-ups and existing business
expansion, Corman et al. (1996) contended resources should be directed at the provision
of quality education programs (e.g., supporting the formation of a highly-skilled
workforce), reliable infrastructure (e.g., roads, transportation, utilities, etc.), and
efficiency and timeliness in helping firms make appropriate decisions (e.g.,
standardization of regulations, etc.). Despite the level of clarity encompassing local
government’s role in promoting favorable economic conditions, one of two approaches
are typically relied upon––local governments take no action and allow the marketplace to
resolve such challenges or they take an active role and engage in intervention. During
recessionary periods, however, intervention is often an essential strategy to sustain
businesses until the next expansionary period (Corman et al., 1996).
To illustrate the critical nature of government intervention during recessionary
periods, Corman et al. (1996) stated:
The need for capital during recessions was ranked fourth in difference between importance and satisfaction. However, during the expansion period, it dropped from the top 10 list of discrepancies between importance and satisfaction. An important consideration for public policy makers is to make capital available to small business owners during periods of recession a high priority and less of a priority during expansion periods. The Small Business Administration (SBA) is doing the opposite. During the recession the SBA was not making many loans, but in 1995 during the expansion the SBA determined that making loans was a top priority. Public policies were in contradiction. At the same time the SBA was making loans available to stimulate the economy, the Federal Reserve was raising interest rates to slow down economic growth. During periods of expansion, the emphasis should change from making loans and toward further development of the infrastructure and other factors listed. (p. 5)

25
In the context of suitable intervention strategies, Corman et al. recommended
governments avoid public policy contradictions and cut taxes during recessionary periods
as a means of increasing consumer demand to stimulate sales. Likewise, small
businesses should establish reserves during expansion periods to compensate for capital
scarcity during recessionary periods (Corman et al., 1996). Doring et al. (2010)
recommended governments ensure their administrators remain flexible, timely, and
develop a well-functioning regional network (e.g., cooperation with the Chamber of
Commerce, regional academic research institutions, and decision-makers at all levels of
government). In contrast, Doring et al. revealed extensive subsidies for businesses,
comparatively high per capita expenditures for cultural and social activities, as well as
deficiencies in the industrial real estate management of a municipality adversely affect a
local economic climate. In the context of privatization of public services and targeting
businesses for existing industrial clusters strategies, Doring et al. found none of these
activities had a positive impact.
To achieve positive outcomes, Maloney and Wassall (2013) recommended
community partnerships between local leaders representing: (a) an intermediary
organization, (b) the local government, and (c) representatives of the cultural community
(through grant funding and technical assistance). In addition, Maloney and Wassall
stipulated local government, as a partner, should perform the following tasks:
direct services, by providing direct funding, signage, and infrastructure
improvements;
indirect services, by providing meeting space and marketing, communications,
and social media assistance; encouraging government employees and officials

26
to attend meetings, speaking publically about the importance of the arts; and
giving the community opportunities to be heard; and
provide a local seal of approval by announcing local government support of
the arts and cultural projects.
In addition, Maloney and Wassall stipulated the most important factor in the success of
cultural economic development was the local government. In essence, local government
leaders, resources, and its innate ability to bring stakeholders together demonstrate the
importance of its influence in economic development partnerships. Ideally, an effective
partnership-based strategy would endeavor to: (a) increase attendance at cultural events,
(b) encourage people to visit the downtown area, (c) increase sales of cultural goods, (d)
encourage knowledge workers to relocate to the local community, and (e) increase
cultural tourism (Maloney & Wassall, 2013).
Schmitz (2013) recommended local governments establish cultural tax districts as
an effective policy tool for supporting the expansion of the local arts community.
Providing clarity, Schmitz contended the cultural tax districts support the investments in
local culture, increase direct local spending on the arts, and help develop an educated
workforce. Conversely, Pedroni and Sheppard (2013) criticized this approach by
stipulating that the link between culture and economic prosperity may have adverse
characteristics. As such, if too many resources are allocated to culture production, that
may inhibit investments in schools, roads, and other infrastructure. In essence, Pedroni
and Sheppard introduced the possibility that the production of culture may yield short-
term benefits, but there was little evidence of a causal connection to economic prosperity
in the long-run.

27
Business Assistance Programs
Despite increasing demands for business assistance (government agencies,
business programs, and voluntary groups manage 74% of assistance programs studied),
Yusuf (2010) contended that support programs only meet entrepreneurs’ needs 26% of
the time. To illustrate the importance of a public agency’s role in fostering
entrepreneurial activity and business incubation, Henderson (2002) reported this method
of job creation costs $1,000 less per new position than alternative job creation strategies.
Yusuf stipulated that such programs are poorly aligned with entrepreneurs’ latent and
expressed needs. In addition, support programs and other forms of assistance are critical
to the success or failure of business start-ups, especially in the initial stages of
development.
Entrepreneurial assistance is the most common intervention method applied by
governments at all levels. Assistance often takes the form of training, information, and
advisory programs. These types of assistance are critical because they can provide the
impetus for helping entrepreneurs develop the capacity to engage in strategic planning,
which contributes favorably to the financial performance and survivability of small
businesses (Lussier, Sonfield, Corman, & McKinney, n.d.). For example, Jones and
Tullous (2002) revealed that one in four pre-venture entrepreneurs go into business after
receiving Small Business Development Center (SBDC) assistance counseling and among
those that actually establish operations, 86% remain in business after 2 years. In
addition, SBDC clients experience 106% sales growth and 93% full-time employment
growth as compared to 18% sales growth and 16% full-time employment growth for non-
SBDC clients (Jones & Tullous, 2002).
28
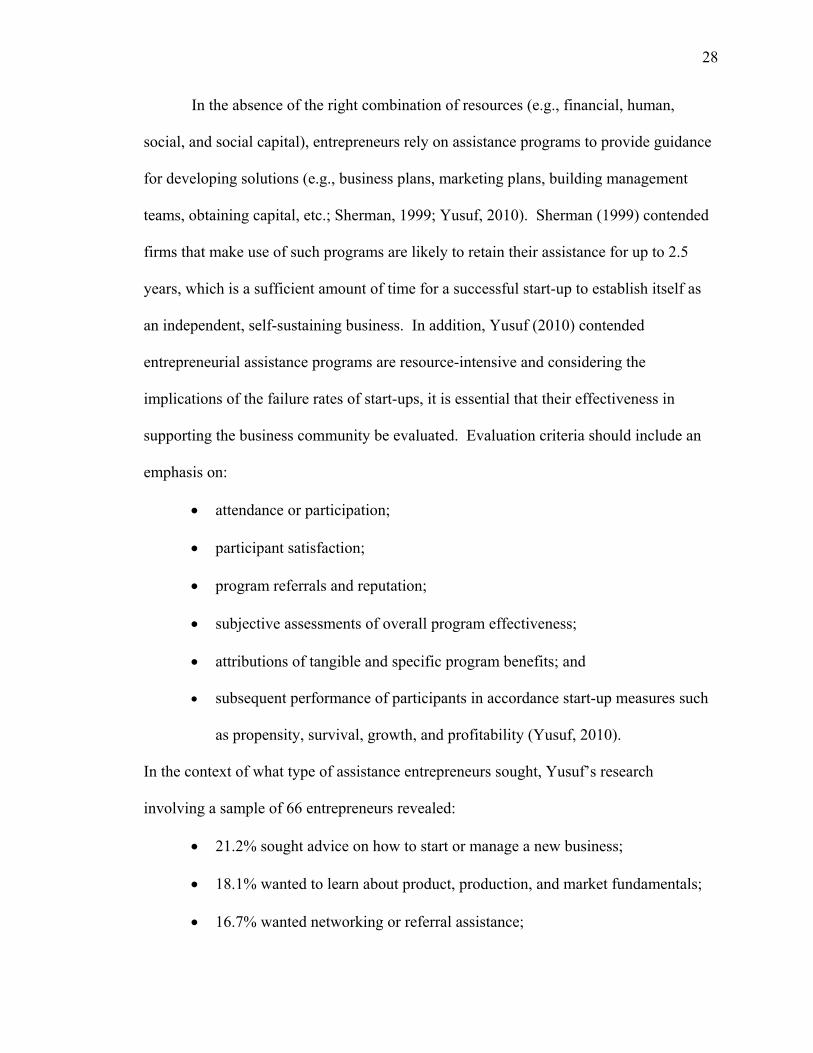
In the absence of the right combination of resources (e.g., financial, human,
social, and social capital), entrepreneurs rely on assistance programs to provide guidance
for developing solutions (e.g., business plans, marketing plans, building management
teams, obtaining capital, etc.; Sherman, 1999; Yusuf, 2010). Sherman (1999) contended
firms that make use of such programs are likely to retain their assistance for up to 2.5
years, which is a sufficient amount of time for a successful start-up to establish itself as
an independent, self-sustaining business. In addition, Yusuf (2010) contended
entrepreneurial assistance programs are resource-intensive and considering the
implications of the failure rates of start-ups, it is essential that their effectiveness in
supporting the business community be evaluated. Evaluation criteria should include an
emphasis on:
attendance or participation;
participant satisfaction;
program referrals and reputation;
subjective assessments of overall program effectiveness;
attributions of tangible and specific program benefits; and
subsequent performance of participants in accordance start-up measures such
as propensity, survival, growth, and profitability (Yusuf, 2010).
In the context of what type of assistance entrepreneurs sought, Yusuf’s research
involving a sample of 66 entrepreneurs revealed:
21.2% sought advice on how to start or manage a new business;
18.1% wanted to learn about product, production, and market fundamentals;
16.7% wanted networking or referral assistance;

29
16.7% wanted to receive general training or information;
4.5% sought guidance on legal, political, or administrative issues;
1.5% were attempting to fulfill goals or achieve satisfaction; and
21.2% were classified as other.
In the context of the actual support or assistance received, Yusuf’s research involving 66
entrepreneurs demonstrated:
24.2% received networking or referral assistance;
21.2% received training on how to start or manage a new business;
18.1% received general training or information;
13.6% learned about product, production, and market fundamentals;
3.0% received emotional support;
1.5% received guidance on legal, political, or administrative issues; and
18.2% were classified as other.
Yusuf’s (2010) research revealed only 30% of the entrepreneurs actually received
the assistance they sought. To demonstrate the nature of the misalignment, entrepreneurs
in the study stipulated the assistance they received from SBDCs was reflected in an
improper matching of the expertise and skills of the advisor who was assigned to meet
their needs (Yusuf, 2010). As an alternative explanation for the misalignment, Yusuf
posited that entrepreneurs shared some responsibility due to their inability to identify
their actual or latent needs in terms of resources and competencies. Essentially, their
expressed support needs were not in alignment with their actual needs due to their lack of
experience. Despite this misalignment, Yusuf reported the experiences of his study

30
participants were almost entirely positive (97%) and they would recommend the program
they encountered to others.
In the context of gender, Jones and Tullous’ (2002) research involving 133 pre-
venture entrepreneurs revealed similar misalignment issues among program participants
and consultants. Jones and Tullous reported female pre-venture entrepreneurs perceived
they required more financial and accounting assistance than did their male peers.
Conversely, consultants’ perceptions differed as they perceived male pre-venture
entrepreneurs were in greater need of financial and accounting assistance than their
female peers. In addition, Jones and Tullous reported females spend an average of 17
hours and males 12 hours with their assigned consultants, which demonstrates behavior
differences in seeking assistance. In the context of an explanation for this discontinuity,
Jones and Tullous posited females are socialized in ways that put them at a disadvantage
as it relates to self-confidence (in the areas of finance, firm creation, and managerial
performance) and indicated consultants should plan accordingly to address gender
differences in terms of providing assistance.
In the context of evaluating the effectiveness of business incubators, Sherman
(1999) reported these assistance programs contribute to business success and, ultimately,
job growth. Overall, Sherman estimated business incubators help create 6.8 jobs for each
firm that attains independence. Similarly, a survey administered to a sample of 70 firms
that graduated from business incubators in Michigan revealed sales growth of 192% from
1989 to 1994 in addition to a 307% increase in average payroll for the same time period
(Sherman, 1999). Despite this record of performance, Sherman, relying on a sample
derived from Pennsylvania business firms, acknowledged there were no significant
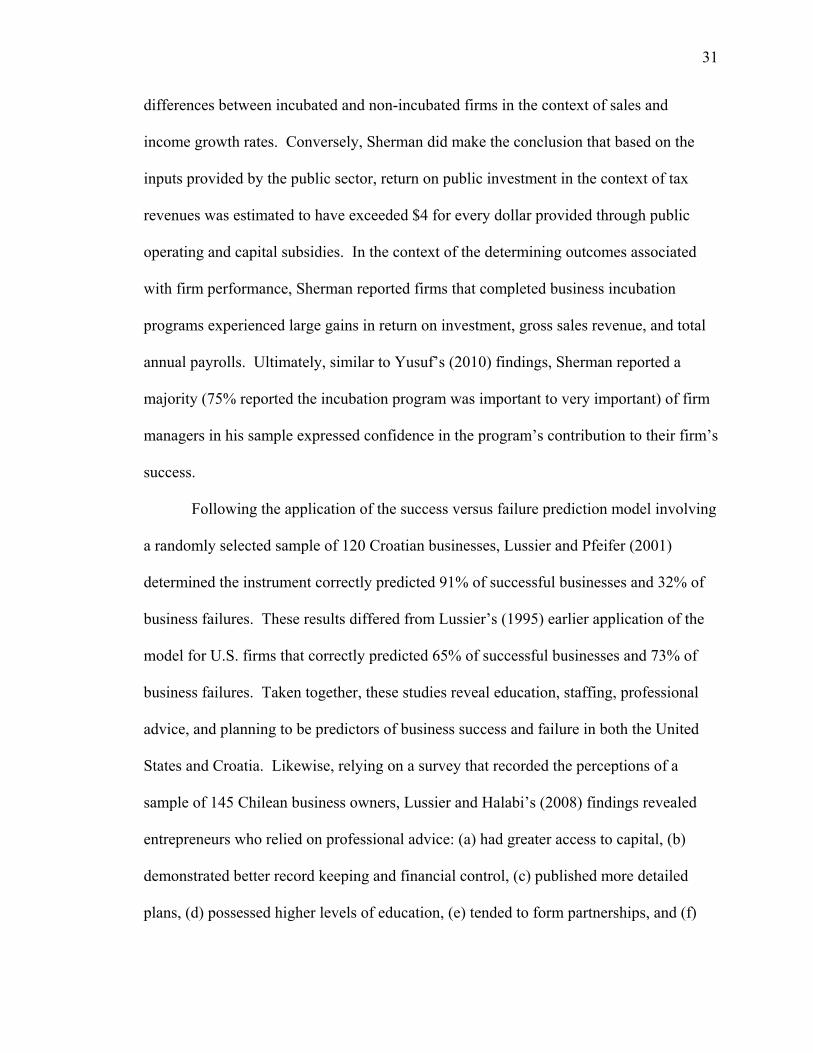
31
differences between incubated and non-incubated firms in the context of sales and
income growth rates. Conversely, Sherman did make the conclusion that based on the
inputs provided by the public sector, return on public investment in the context of tax
revenues was estimated to have exceeded $4 for every dollar provided through public
operating and capital subsidies. In the context of the determining outcomes associated
with firm performance, Sherman reported firms that completed business incubation
programs experienced large gains in return on investment, gross sales revenue, and total
annual payrolls. Ultimately, similar to Yusuf’s (2010) findings, Sherman reported a
majority (75% reported the incubation program was important to very important) of firm
managers in his sample expressed confidence in the program’s contribution to their firm’s
success.
Following the application of the success versus failure prediction model involving
a randomly selected sample of 120 Croatian businesses, Lussier and Pfeifer (2001)
determined the instrument correctly predicted 91% of successful businesses and 32% of
business failures. These results differed from Lussier’s (1995) earlier application of the
model for U.S. firms that correctly predicted 65% of successful businesses and 73% of
business failures. Taken together, these studies reveal education, staffing, professional
advice, and planning to be predictors of business success and failure in both the United
States and Croatia. Likewise, relying on a survey that recorded the perceptions of a
sample of 145 Chilean business owners, Lussier and Halabi’s (2008) findings revealed
entrepreneurs who relied on professional advice: (a) had greater access to capital, (b)
demonstrated better record keeping and financial control, (c) published more detailed
plans, (d) possessed higher levels of education, (e) tended to form partnerships, and (f)

32
hired greater numbers of employees. In addition, a meta-analysis incorporating 25
research studies revealed planning was the most frequently cited factor for predicting
business success or failure (Lussier & Halabi, 2010). This finding was also consistent
with Lussier’s (1995) earlier research that revealed successful firms developed more
specific plans than those that failed.
Relying on a sample of 50 Georgia lenders, Hanks, Barnett, Durden, and
Woodrum (2011) revealed respondents had concluded weak management, poor business
plans, economic conditions, and undercapitalization (e.g., low working capital,
insufficient lines of credit, insufficient operating capital set aside for slow payables, over-
leveraging, etc.) were leading causes for business bankruptcies. Lussier and Halabi
(2010) augmented these findings by stipulating government policy makers should direct
additional resources to provide: (a) more low interest loans to help entrepreneurs avoid
undercapitalization, (b) more low cost or free professional advice, (c) an understanding of
the capital needs to start a business, (d) training on how to maintain records and financial
control, and (e) management training to develop a business plan for effective staffing and
marketing a business.
Universities
Hamilton (2008) warned that community leaders should not rely exclusively on
universities as the engine for job growth despite the pervasiveness of their influence.
Ideally, Bacdayan (2008) recommended universities should be relied upon for local
outreach needs and workforce development in the form of: (a) technical assistance (e.g.,
policy analysis, feasibility studies, etc.), (b) student recruitment, (c) placement services,
(d) service-learning field projects, and (e) guest speakers in the classroom. Interestingly,

33
university faculty ranked technical assistance last and degree-related teaching and basic
research first and second in terms of desired activities. Conversely, Chamber of
Commerce directors rated basic research last and technical assistance first in terms of
desired activities (Bacdayan, 2008).
In the context of establishing community-classroom links, Bacdayan’s (2008)
survey research incorporating responses from a sample of 138 university faculty and 142
Chamber of Commerce directors revealed strong universal support for degree programs
for working adults, class projects, and internships. Hamilton (2008) contended the best
method for inspiring economic growth was a coordinated strategy collectively
implemented by all stakeholder institutions. Falcone and Wilson (2008) recommended a
strategic approach to economic development, specifying such an endeavor was a heuristic
process that requires the formation of a business incubator that integrates the resources
and expertise of the local university, development organizations, government functions,
the local Chamber of Commerce, and private industry. Likewise, Bacdayan
recommended community stakeholders establish alliances that incorporate the expertise
and resources of universities, community colleges, economic development agencies, and
small business development centers to provide technical assistance, help identify export
markets, and provide skills training.
Despite the contention that institutions for higher learning should play a limited
role in economic development, Huffman and Quigley (2002) stipulated universities
should play a major role in attracting human capital and stimulating entrepreneurial talent
in the communities in which they reside. Huffman and Quigley’s research involving the
University of California (Berkley, Stanford University, and Silicon Valley) revealed
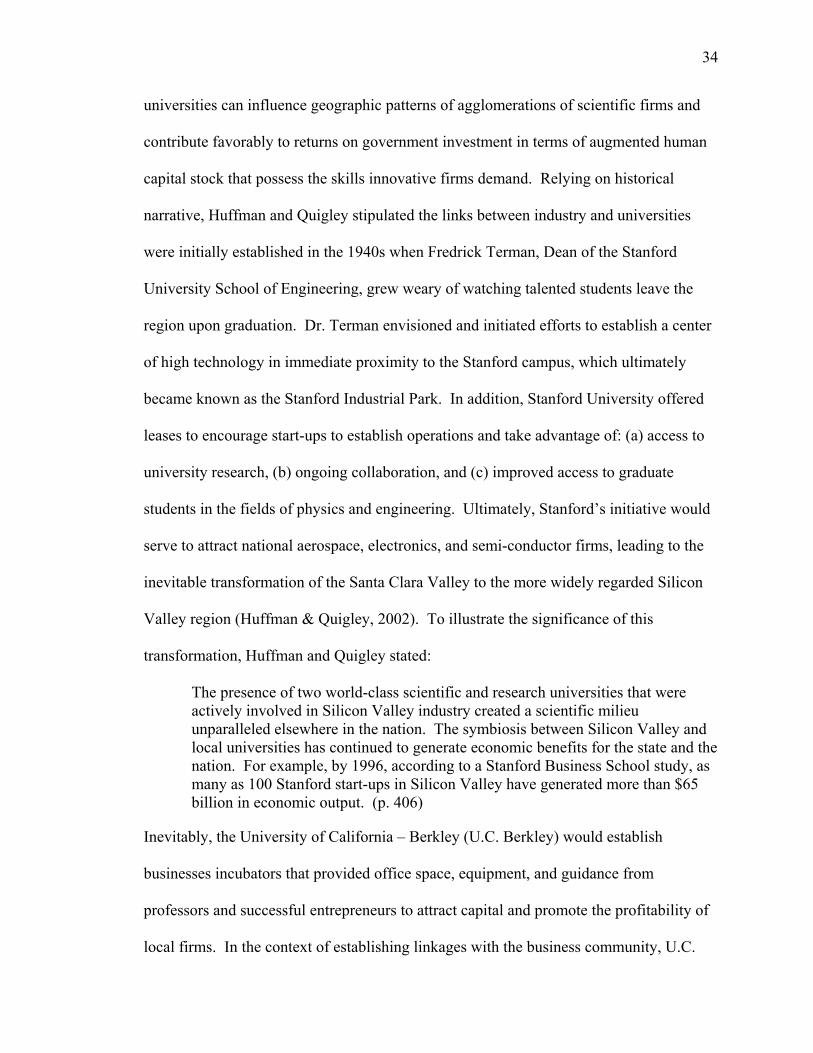
34
universities can influence geographic patterns of agglomerations of scientific firms and
contribute favorably to returns on government investment in terms of augmented human
capital stock that possess the skills innovative firms demand. Relying on historical
narrative, Huffman and Quigley stipulated the links between industry and universities
were initially established in the 1940s when Fredrick Terman, Dean of the Stanford
University School of Engineering, grew weary of watching talented students leave the
region upon graduation. Dr. Terman envisioned and initiated efforts to establish a center
of high technology in immediate proximity to the Stanford campus, which ultimately
became known as the Stanford Industrial Park. In addition, Stanford University offered
leases to encourage start-ups to establish operations and take advantage of: (a) access to
university research, (b) ongoing collaboration, and (c) improved access to graduate
students in the fields of physics and engineering. Ultimately, Stanford’s initiative would
serve to attract national aerospace, electronics, and semi-conductor firms, leading to the
inevitable transformation of the Santa Clara Valley to the more widely regarded Silicon
Valley region (Huffman & Quigley, 2002). To illustrate the significance of this
transformation, Huffman and Quigley stated:
The presence of two world-class scientific and research universities that were actively involved in Silicon Valley industry created a scientific milieu unparalleled elsewhere in the nation. The symbiosis between Silicon Valley and local universities has continued to generate economic benefits for the state and the nation. For example, by 1996, according to a Stanford Business School study, as many as 100 Stanford start-ups in Silicon Valley have generated more than $65 billion in economic output. (p. 406)
Inevitably, the University of California – Berkley (U.C. Berkley) would establish
businesses incubators that provided office space, equipment, and guidance from
professors and successful entrepreneurs to attract capital and promote the profitability of
local firms. In the context of establishing linkages with the business community, U.C.

35
Berkley relied on business plan competitions to encourage entrepreneurial activity,
establish networks, and secure funding sources. In addition, judges were often members
of venture capital firms or served as business consultants (Huffman & Quigley, 2002).
Huffman and Quigley’s quantitative research revealed business students with California
residence at the time of their application to U.C. Berkley were associated with a
statistically significant increase in the probability of living in California after their
graduation. In applied terms, these findings add substantial weight to the role universities
play in economic development and job growth. Ultimately, this phenomenon was
evidenced by Huffman and Quigley’s findings, which revealed the probability of
retaining talented human capital had been increased by an estimated 20 percentage
points, increasing California GDP by nearly $3.75 million for every five out-of-state
students who were attracted to U.C. Berkley and increasing tax revenues by nearly
$375,000.
In order for a university to serve as an effective contributor to economic growth,
Florida (2012) contended institutions for higher learning must play three interrelated
roles:
Technology: serve as centers for cutting-edge research in the fields of
software, biotechnology, etc.;
Talent: serve as talent magnets attracting eminent researchers, generating
spin-off companies, and encouraging other companies to relocate to the
region; and
Tolerance: foster progressive, open, and tolerant people who attract other
members of the creative class.

36
Considering these roles, Florida (2012) stipulated that major research universities are
essential for the formation of a creative economy by serving as a hub for innovation and
knowledge spillovers.
Human Capital
Doring et al. (2010) contended the availability of a highly-qualified workforce is
essential for attaining benefits associated with knowledge spillovers and the close
proximity to universities and scientific research institutions can contribute favorably to
the formation of adequate human capital. Doring et al. revealed a positive correlation
between how an area is equipped with universities and academic research institutions and
the innovative capacity of local businesses engaged in knowledge production. To
illustrate the value of a highly-skilled workforce, Doring et al. stated:
Municipalities or regions with skilled labor and high levels of specialized human capital are more likely to attract innovative networks than less endowed areas. This position was confirmed by a survey of 84 businesses in the northeastern U.S. which found that the availability of skilled labor is the most important factor in influencing business site selection decisions. (p. 245)
For entrepreneurs to build and operate a sustainable business, they must acquire,
mobilize, and deploy the following resources: (a) financial capital, (b) access to markets,
and (c) availability of information (Sherman, 1999; Sriram, Mersha, & Herron, 2006).
Likewise, Appelbaum and Kamal (2000) and Earle (2003) stipulated entrepreneurs must
recruit and retain talented employees to remain competitive in an economic landscape
dominated by large global business enterprises. The successful recruitment and retention
of talented employees require firms to:
recruit, hire, and develop talented employees who are aligned with strategic
business goals;

37
grow and adapt quickly to a rapidly changing business environment; and
develop ways to help employees balance workplace demands with the need
for work/life balance (Horwitz, Chan, & Quazi, 2003).
Failure to abide by these tenets may compromise the competiveness, intellectual
capital, cultural fabric, and institutional knowledge of the firm (Horwitz et al., 2003).
Because small businesses often lack the financial capital to match the compensation and
fringe benefits offered by their larger competitors for human capital, Appelbaum and
Kamal (2000) posited entrepreneurs must emphasize non-monetary benefits. Such
benefits may include: (a) job enrichment, (b) permitting relative autonomy, (c) employee
recognition, (d) internal salary equity among managers and supervisors, (e) enabling
resources such as new technologies, (f) training to enhance skills to promote internal and
external employability, and (g) opportunities to participate in interdisciplinary and cross-
functional projects (Appelbaum & Kamal, 2000; Earle, 2003; Horwitz et al., 2003).
R. Baker (2011) contended quality-of-life could serve as a powerful recruitment
tool to attract talented human capital. Specifically, R. Baker stipulated business firms
must recognize potential employees will be attracted to communities with a reputation for
a high quality-of-life and a progressive outlook. Employers who recognize such external
benefits are in effect expressing their commitment to existing and would-be employees
(R. Baker, 2011). In addition, R. Baker expressed the importance of community green
initiatives (e.g., bike paths, tree plantings, nature preserve expansion, etc.) as an essential
element in enhancing quality-of-life far and above the benefits associated with
conventional amenities.

38
Earle (2003) contended employers must recognize they must expend great effort
to establish an organizational identity that can be clearly distinguished from their larger
competitors. In effect, employers must gain an understanding of how various perks are
valued among employees and how the physical work environment can be engineered to
help shape a firm’s organizational culture, facilitate communication, promote teamwork,
and inspire creativity to help sustain a culture of continuous innovation. For example,
Earle noted office design is often relied upon to differentiate a firm in terms of its
competitiveness as an employer and indicated many employees prefer surroundings that
inspire creativity. Recognizing motivational differences in terms of cultural context,
demographic characteristics of the workforce, and generational differences can contribute
to a more effective recruitment and retention strategy. As such, compensation alone may
not inspire employees (Earle, 2003).
Under conditions where employers operate in a distressed economy, the ways in
which companies make use of workspace may be even more important. For example,
Earle (2003) contended salaries and benefits accounted for 78% of organizational costs,
while rent, operating, and maintenance costs accounted for 8%. In the context of perks,
employers should consider integrating value-added amenities, such as: (a) free exercise
classes, (b) chair massages, (c) an on-site health clinic, (d) a state-of-the-art fitness
facility, and (e) on-site child care. Leveraging the work environment to improve the
efficiency, motivation, and productivity of employees can help firms attain greater
returns on human capital costs. Employers must not presume a distressed economy will
keep talented employees anchored as they will always be in demand. As such, employers
must remain concerned about their firm’s reputation as this can influence employee

39
perceptions on how the actions of their employer affect its reputation. A firm’s leaders
must consider how the firm is perceived in terms of how it values employees in the
context of concern for well-being and quality-of-life in the workplace (Earle, 2003). To
demonstrate the importance of talented employees, Florida (2012) stated:
A company’s most important asset isn’t raw materials, real estate, machinery, transportation systems, or political influence. It is its creative capital – its arsenal of creative thinkers whose ideas can be turned into valuable products and services. Successful companies recognize that their most valuable assets walk out the door every evening; they dedicate their best efforts to ensuring that they come back and give their very best every morning. (p. 120)
Financial Capital
Sufficient access to capital is an essential element to new business formation,
expansion, and the survival of existing firms through refinancing options (Elston &
Audretsch, 2011; Kobeissi, 2009). Elston and Audretsch (2011) contended the riskiness
of borrowers often leads suppliers of financial capital to limit access to loans. This is
problematic because entrepreneurs are typically less risk adverse than are conventional
lending institutions. This phenomenon is evidenced by survey research that revealed
84% of entrepreneurs had experienced a shortage of capital at one time or another and
48% were currently experiencing liquidity constraints (Elston & Audretsch, 2011). In the
context of the different sources of capital that fund start-ups, Elston and Audretsch
reported entrepreneurs often relied on: (a) earnings from a second job (58%), (b) private
loans (21%), (c) credit cards (13%), (d) small business grants (9%), (e) inheritance (3%),
and (f) gifts (1%).
Recognizing the importance of capital availability and its role in facilitating
economic growth, the federal government introduced the Community Reinvestment Act
of 1977 (CRA), which was intended to boost federally insured financial institution
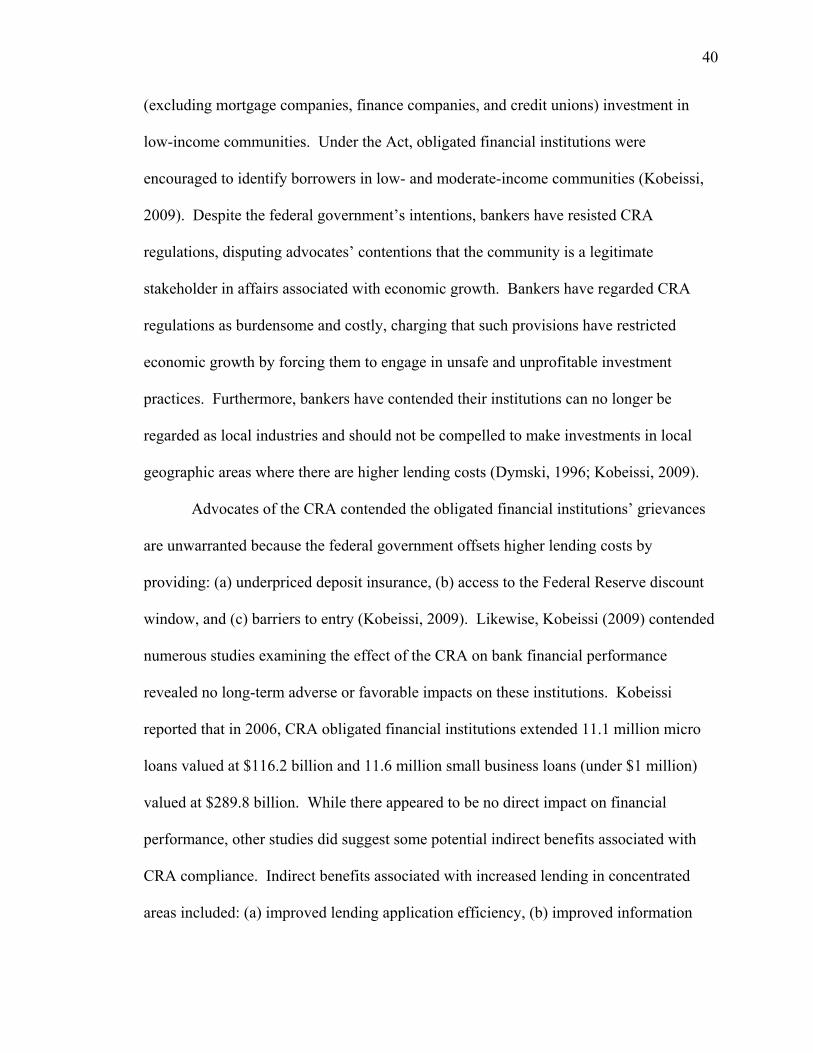
40
(excluding mortgage companies, finance companies, and credit unions) investment in
low-income communities. Under the Act, obligated financial institutions were
encouraged to identify borrowers in low- and moderate-income communities (Kobeissi,
2009). Despite the federal government’s intentions, bankers have resisted CRA
regulations, disputing advocates’ contentions that the community is a legitimate
stakeholder in affairs associated with economic growth. Bankers have regarded CRA
regulations as burdensome and costly, charging that such provisions have restricted
economic growth by forcing them to engage in unsafe and unprofitable investment
practices. Furthermore, bankers have contended their institutions can no longer be
regarded as local industries and should not be compelled to make investments in local
geographic areas where there are higher lending costs (Dymski, 1996; Kobeissi, 2009).
Advocates of the CRA contended the obligated financial institutions’ grievances
are unwarranted because the federal government offsets higher lending costs by
providing: (a) underpriced deposit insurance, (b) access to the Federal Reserve discount
window, and (c) barriers to entry (Kobeissi, 2009). Likewise, Kobeissi (2009) contended
numerous studies examining the effect of the CRA on bank financial performance
revealed no long-term adverse or favorable impacts on these institutions. Kobeissi
reported that in 2006, CRA obligated financial institutions extended 11.1 million micro
loans valued at $116.2 billion and 11.6 million small business loans (under $1 million)
valued at $289.8 billion. While there appeared to be no direct impact on financial
performance, other studies did suggest some potential indirect benefits associated with
CRA compliance. Indirect benefits associated with increased lending in concentrated
areas included: (a) improved lending application efficiency, (b) improved information

41
gathering and the ability to identify high-quality loans, and (c) improved externalities
such as increased property values (Kobeissi, 2009).
Kobeissi (2009) expressed concerns that geographic and product deregulations
and mergers and acquisitions of numerous financial institutions have had an adverse
impact on low- and moderate-income markets and households. Critics of the banking
industry have stipulated these larger banks charge higher prices, are less sensitive to
community impact, and are less willing to make small and less standardized loans. In
addition, critics charge that larger banks are devoting a smaller percentage of their
financial portfolios to small business lending and have engaged in widespread bank
consolidations and branch closings in low-income communities that have already been
underserved (Dymski, 1996; Kobeissi, 2009).
Ho and Wong (2006) and Kobeissi (2009) contended that commercial banks have
often been considered to be the most important supplier of credit to small business.
Relying on a 2003 survey, Kobeissi reported 60.4% of small business establishments
relied on traditional forms of credit (e.g., credit lines, loans, capital leases, etc.) and 68%
obtained credit from the banking industry. In the context of business start-ups, Ho and
Wong (2006), Kobeissi (2009), and Lerner (2010) stipulated that numerous studies have
established a link between credit availability and firm creation, suggesting liquidity
constraints among new businesses can have an adverse impact on entrepreneurism.
Ultimately, new firm and entrepreneur access to bank financing may be constrained by a
lack of collateral, a limited track record, and an inability to communicate current and
future capabilities (Ho & Wong, 2006).

42
Kobeissi’s (2009) quantitative research (relying on regression) demonstrated a
positive and significant relationship between CRA loans, bank deposits, per capita
income, market size (independent variables), and business start-ups (dependent variable).
Kobeissi proposed that new businesses generated by CRA loans would facilitate the
emergence of positive spillover effects, enhancing economic development, employment,
and economic growth. For example, a study commissioned by the Small Business
Administration entitled, The Innovation-Entrepreneurship Nexus: A National Assessment
of Entrepreneurship and Regional Economic Growth and Development, examined the
link between entrepreneurship and regional economic growth from 1990 to 2001 and
ultimately, revealed the most entrepreneurial regions, compared to the least ones,
experienced superior economic conditions (Kobeissi, 2009). Favorable economic
conditions were expressed by 125% higher employment growth, 58% higher wage
growth, and 109% higher productivity (Kobeissi, 2009). In addition, Kobeissi contended
financial institutions that maintain a close relationship with their small business
customers have a better understanding of the operating environments and prospects of
new businesses, managerial attributes of business owners, and customer needs and
resources. Ultimately, an improved understanding of the fundamentals that impact the
small business community can serve to mitigate the adverse impact of information
asymmetries (Kobeissi, 2009).
Lerner (2010) contended the recession that was officially declared in December of
2007 and the ongoing challenges in its aftermath have resulted in a substantial negative
effect on investors’ willingness to finance entrepreneurial ventures. For example, venture
capital investment had dropped by 30% in the fourth quarter of 2008, which was at its

43
lowest level since 2005. As of 2009, there was little evidence of a sustained economic
recovery (Lerner, 2010). In addition, Lerner contended investors (e.g., pension funds,
university endowments, and wealthy individual investors) were directing their investment
capital into existing portfolio companies as opposed to start-ups. Risk aversion is
prevalent and there is additional evidence to demonstrate investors are reneging on
existing commitments to new ventures. This situation is particularly problematic for the
U.S. economy because industry leadership has often been achieved through the efforts of
relatively young firms (e.g., Cisco, Intel, Microsoft, etc.) whose growth was facilitated
through public equity market financing (Lerner, 2010).
Lerner (2010) illustrated the importance of the role of small firms in the economy
by stating:
It appears that small and new firms not only have contributed an important share of research and development themselves, but they also have had in many cases a disproportionate influence by introducing fresh technologies and business models that incumbent firms have struggled to address. (p. 9)
In essence, small firms have outpaced established competitors in terms of meeting
customer needs and introducing new products. While established firms have innovated at
a higher rate (focusing on incremental technological improvements), they have
consistently lagged behind new ventures in developing products on the technological
frontier. Considering these implications, it is evident the nation’s and a local
community’s competitive positioning is highly dependent on the viability of
entrepreneurial ventures (Lerner, 2010).
In the context of the performance of public markets, Lerner (2010) contended
unreasonable swings in investment activity often contribute to over- and under-
investment in entrepreneurial finance options. Lerner stipulated that financial institutions

44
typically attempt to maintain a fixed percentage of their portfolios in each asset class. As
such, when public equity values increase, these institutions are more likely to allocate
more assets to venture capital. Unfortunately, overly optimistic valuations may lead to an
over-shooting phenomenon, directing excessive amounts of capital to business ventures
with poor fundamentals and depriving capital to firms with a stronger foundation (Lerner,
2010). In the context of the performance of venture capital, Lerner contended the most
effective policies were those that emphasized increased efficiency of private markets over
the long-term, rather than providing short-term funding to new firms during market boom
periods.
Kobeissi (2009) charged that financial institutions have failed to make sufficient
capital available to small business. Harmful practices such as redlining, discrimination,
and outright neglect have contributed significantly to deteriorating conditions (e.g.,
chronic poverty, unemployment, an unskilled labor force, high crime rates, and poor
infrastructure) in many underserved communities. Likewise, Dymski (1996) contended
that government programs for economic development have also failed to facilitate
economic growth. The failure of government programs was attributed to: (a)
fragmentation, (b) emphasis on individuals and firms rather than impacted areas, and (c)
confusing social goals with the necessity to establish profitability (Dymski, 1996).
Dymski charged that the government was a poor substitute for providing capital and
mainstream firms should be encouraged by the government to deliver smart subsidies
such as reduced capital gains taxes on venture capital equity investment in inner-city
firms. In light of such financing constraints, Keuschnigg (2004) and Ho and Wong
(2006) contended that informal investment (e.g., angel investors) may be the only

45
remaining form of financing that contributes significantly to entrepreneurial propensity
and innovation-based growth.
Holaday, Meltzer, and McCormick (2002) and Maula, Autio, and Arenius (2005)
stipulated that ideal angel investors often take the form of early-stage investors who are
locally-based, have personal familiarity with the entrepreneur, have practical industry
experience, have owned or managed firms, possesses the skills to start a new business,
have the time to share their expertise, and are willing to introduce entrepreneurs to
members (e.g., other angel investors, attorneys, accountants, etc.) of their network.
Ultimately, provided that entrepreneurs exhibit the potential for favorable returns on
investment, angel investors can introduce entrepreneurs to venture capitalists, who in turn
supply the next round of financing and guidance (Holaday et al., 2002).
Keuschnigg (2004) and Ley and Weaven (2011) contended that venture capital
plays an important role in enhancing a new firm’s ability to generate wealth and jobs.
For example, Keuschnigg reported an increase in the GNP share of venture capital by
0.075% would facilitate the reduction of a short-run unemployment rate by .025%, while
the long-term effect would result in a reduction in unemployment of 0.9% to 2.5%.
Likewise, the presence of an active venture capital sector can favorably impact the
macroeconomic performance of local economies and in terms of potency, venture capital
can deliver three times the performance in establishing new patents (Keuschnigg, 2004).
Ley and Weaven contended venture capital bridges the gap in access to financial capital
in an environment laden with information asymmetries, risk, a higher probability of
failure, and assets that are difficult to liquidate. Venture capitalists attain favorable
results by: (a) carefully screening firms, (b) structuring contracts to strengthen incentives,

46
and (c) closely monitoring firms. Engaging in such practices is likely to add value to new
firms, promote a sense of professionalism, insulate investors from the possibility of
business failure, and encourage entrepreneurs to be more aggressive in the competitive
marketplace. Venture capitalists provide sufficient start-up capital in exchange for an
equity stake and provide advice and expertise to help develop the firm. Venture
capitalists mitigate risks, ensure the firm enters the production stage, and sell their
interests to attain a favorable ROI. Ultimately, the equity share venture capitalists
demand is congruent with the level of effort they must expend in advising entrepreneurs
and the quality of their returns can be heavily influenced by government policy on capital
gains tax (Keuschnigg, 2004).
In the context of the criteria venture capitalists rely on to screen firms, Bishop and
Nixon (2006) contended analysts assess survivability by evaluating:
the entrepreneur’s familiarity with the proposed target market, leadership
ability, and track record (industry related competence);
the entrepreneur’s work ethic and level of market acceptance (market
education capability);
probability of significant growth in the target market timing of entry and
competitive rivalry);
the entrepreneur’s attention to detail and ability to evaluate and respond to
risks (key success factor stability); and
probability of proprietary or patent protection and the ability to attain returns
on investment (lead time and barriers to entry).
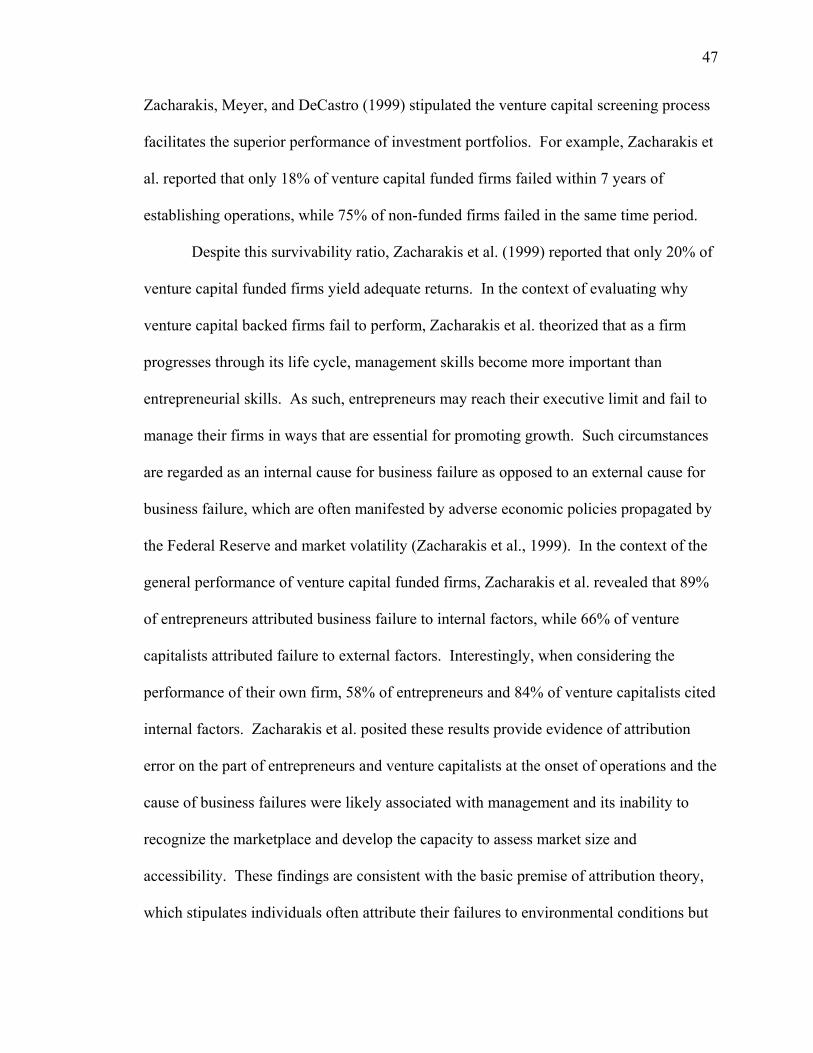
47
Zacharakis, Meyer, and DeCastro (1999) stipulated the venture capital screening process
facilitates the superior performance of investment portfolios. For example, Zacharakis et
al. reported that only 18% of venture capital funded firms failed within 7 years of
establishing operations, while 75% of non-funded firms failed in the same time period.
Despite this survivability ratio, Zacharakis et al. (1999) reported that only 20% of
venture capital funded firms yield adequate returns. In the context of evaluating why
venture capital backed firms fail to perform, Zacharakis et al. theorized that as a firm
progresses through its life cycle, management skills become more important than
entrepreneurial skills. As such, entrepreneurs may reach their executive limit and fail to
manage their firms in ways that are essential for promoting growth. Such circumstances
are regarded as an internal cause for business failure as opposed to an external cause for
business failure, which are often manifested by adverse economic policies propagated by
the Federal Reserve and market volatility (Zacharakis et al., 1999). In the context of the
general performance of venture capital funded firms, Zacharakis et al. revealed that 89%
of entrepreneurs attributed business failure to internal factors, while 66% of venture
capitalists attributed failure to external factors. Interestingly, when considering the
performance of their own firm, 58% of entrepreneurs and 84% of venture capitalists cited
internal factors. Zacharakis et al. posited these results provide evidence of attribution
error on the part of entrepreneurs and venture capitalists at the onset of operations and the
cause of business failures were likely associated with management and its inability to
recognize the marketplace and develop the capacity to assess market size and
accessibility. These findings are consistent with the basic premise of attribution theory,
which stipulates individuals often attribute their failures to environmental conditions but

48
others’ failures to personal flaws. Ultimately, both entrepreneurs and venture capitalists
should rely on such experiences to improve their effectiveness in future ventures to avoid
undesirable outcomes (Zacharakis et al., 1999).
Brand Promotion
In the context of encouraging investment in start-ups and existing businesses,
Sneed, Runyan, Swinney, and Lim (2011) demonstrated positioning, image, and business
mix to be significant, positive predictors of patronage in downtown communities. To
illustrate the importance of place, Florida (2012) stated:
Place has become the central organizing unit of our time, taking on many of the functions that used to be played by firms and other organizations. Access to talented and creative people is to modern business what access to coal and iron ore was to steel making. It determines where companies will choose to locate and grow, and this in turn changes the way that cities must compete. (p. 8)
Conversely, Sneed et al. reported a significant, negative effect of sense-of-place on
patronage intention. Sneed et al.’s survey of 836 residents in four communities in
Michigan and four communities in Oklahoma was intended to examine and reveal
consumers’ perceptions of location as a brand and the influence of these perceptions on
their willingness to patronize those respective areas.
Sneed et al. (2011) stipulated a strong retail presence in a downtown area serves
as an essential element for promoting urban redevelopment strategies. Likewise, Judd
and McNeil (2008) contended the redevelopment of downtown areas will contribute to:
(a) job creation, (b) incubation of small businesses, (c) reduction of sprawl, (d) favorable
property values, and (e) increased options for goods and services. In downtown areas
adversely affected by an economic decline, Sneed et al. reported many communities have
relied on the following strategies: (a) pedestrian malls, (b) festival marketplaces, (c)
indoor shopping centers, and (d) mixed-use centers. Despite these efforts, time has

49
demonstrated such strategies are largely ineffective due to excessive sunk costs, recurring
maintenance costs, and the characteristics of isolated structures used for indoor shopping
centers and mixed-use centers that offer little economic benefit for downtown areas
(Sneed et al., 2011). To address these challenges, Judd and McNeil recommended the
following strategies:
develop a locally-based and flexible vision and strategy;
engineer and build a multi-function downtown;
establish partnerships between public, non-profit, and business entities; and
focus on developing the unique qualities of the downtown area and the larger
community.
Sneed et al. (2011) stipulated that a downtown’s brand comprises image and
positioning. Image is essentially the overall impression while positioning statements
often include symbols, slogans, logos, and any other communication methods that convey
the uniqueness of a brand in relation to competing alternatives. To illustrate the
importance of brand, Sneed et al. stated:
Downtowns perceived as having strong brand identities (as reported by downtown business owners), experienced greater success relative to competing retail venues (e.g., outlying strip centers, shopping malls, etc.), had fewer vacant downtown buildings, and its local businesses reported being successful. (p. 124)
Ultimately, Sneed et al. suggested reliance on brand reputation to be the most effective
method for expressing the quality of a product or service when it is difficult for
consumers to assess its quality or value among competitors.
Crombie (2011) contended that both cities and clusters should take branding as
seriously as companies, recognizing it should transcend tourism promotion and
emphasize economic development to attract relocating companies and entrepreneurs. In

50
essence, branding initiatives should seek to create an environment where diverse people
and companies alike feel integrated into the whole community, vision, or image for the
area (Crombie, 2011). For example, Crombie contended a city brand should provide a
voice or name to the municipality’s culture and social capital––providing the framework
and message for inspiring a more cohesive community. To maximize the city’s brand,
Crombie recommended enhancing its reputational capital by:
establishing a link to the social norms of the target audience, its values, or
valued images through symbols;
establishing a link to a feeling of solidarity with others; and
establishing a link to a position of prestige such as those with higher social
status or celebrities.
In addition, Crombie identified the following place branding challenges:
involves the efforts and resources of multiple stakeholders, often with
competing interests;
measuring effectiveness is difficult;
efforts are rarely under the control of a central authority;
marketers have little control over place brands due to the prevalence of
alternative communication channels (e.g., schools, media, purchases, tips from
friends and family, etc.); and
few government employees have the essential skill sets required to design and
implement major marketing campaigns.
To establish a competitive position among other communities, Crombie (2011)
recommended a holistic approach that places emphasis on: (a) design, (b) infrastructure,

51
(c) basic services, and (d) attractions. In the context of setting a community apart from
its rivals, Crombie recommended the following strategies: (a) advertising and promotion,
(b) large-scale physical redevelopment, (c) public art and civic statuary, (d) mega-events,
(e) cultural regeneration, and (f) public-private partnerships. In addition, Crombie
contended the following issues must be considered: (a) the city government’s branding
capabilities, (b) the demographic characteristics of the city, (c) the wisdom and long-term
perspective of the city government, and (d) the creative climate. Ultimately, to
implement a cluster branding campaign, Crombie recommended:
attaining an understanding of a cluster’s strengths and weaknesses to leverage
assets and minimize liabilities;
obtaining facts about the city, the population, economic growth, education
diversity, jobs, and start-ups to establish a starting point;
obtaining qualitative research associated with the city to establish how
individuals feel about the characteristics of the city;
creating a focused brand marketing strategy that results in communications
that are holistic, consistent, authentic, compelling, and memorable; and
identifying the public face of the communication of the brand.
Sneed et al. (2011) stipulated the attractiveness of a downtown can be influenced
by the concentration and mix of establishments in the area. In addition, the centralization
of a heterogeneous mix of establishments can serve to reduce the cost of time and travel
for the consumer, thereby increasing the area’s attractiveness as a venue. Similarly, these
benefits can be conveyed to entrepreneurs through the agglomeration of businesses,
which can lower hard costs by providing affordable access to raw materials, superior
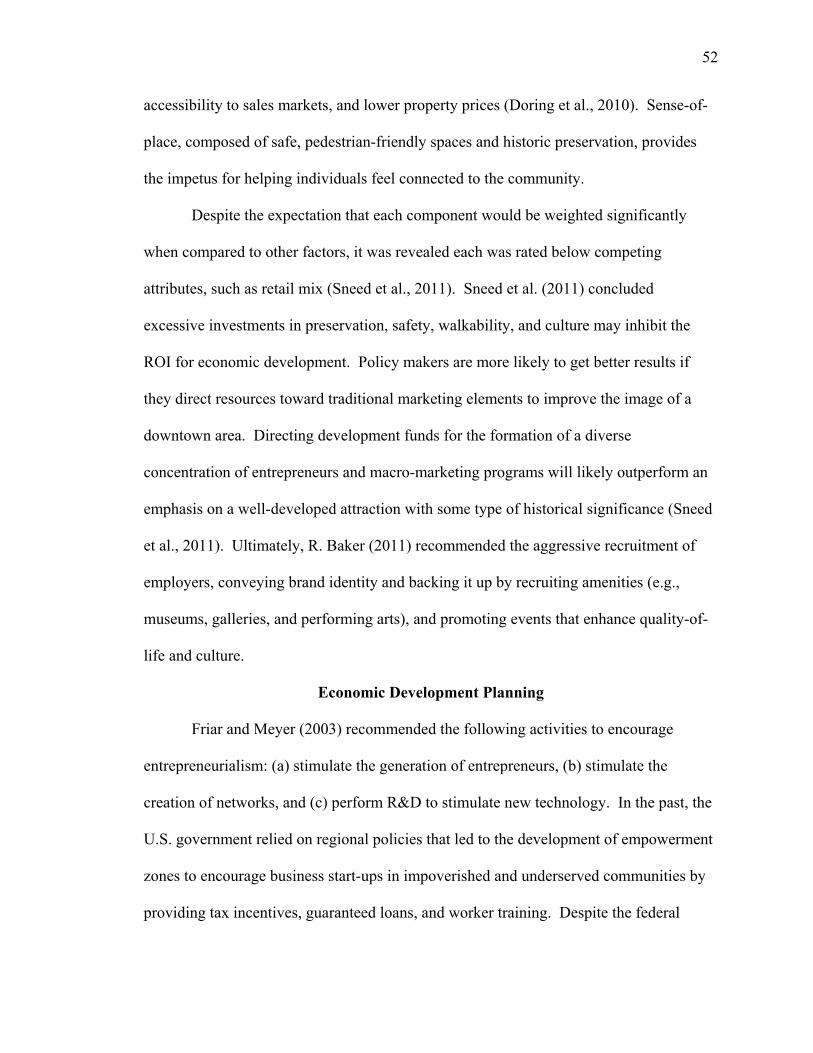
52
accessibility to sales markets, and lower property prices (Doring et al., 2010). Sense-of-
place, composed of safe, pedestrian-friendly spaces and historic preservation, provides
the impetus for helping individuals feel connected to the community.
Despite the expectation that each component would be weighted significantly
when compared to other factors, it was revealed each was rated below competing
attributes, such as retail mix (Sneed et al., 2011). Sneed et al. (2011) concluded
excessive investments in preservation, safety, walkability, and culture may inhibit the
ROI for economic development. Policy makers are more likely to get better results if
they direct resources toward traditional marketing elements to improve the image of a
downtown area. Directing development funds for the formation of a diverse
concentration of entrepreneurs and macro-marketing programs will likely outperform an
emphasis on a well-developed attraction with some type of historical significance (Sneed
et al., 2011). Ultimately, R. Baker (2011) recommended the aggressive recruitment of
employers, conveying brand identity and backing it up by recruiting amenities (e.g.,
museums, galleries, and performing arts), and promoting events that enhance quality-of-
life and culture.
Economic Development Planning
Friar and Meyer (2003) recommended the following activities to encourage
entrepreneurialism: (a) stimulate the generation of entrepreneurs, (b) stimulate the
creation of networks, and (c) perform R&D to stimulate new technology. In the past, the
U.S. government relied on regional policies that led to the development of empowerment
zones to encourage business start-ups in impoverished and underserved communities by
providing tax incentives, guaranteed loans, and worker training. Despite the federal
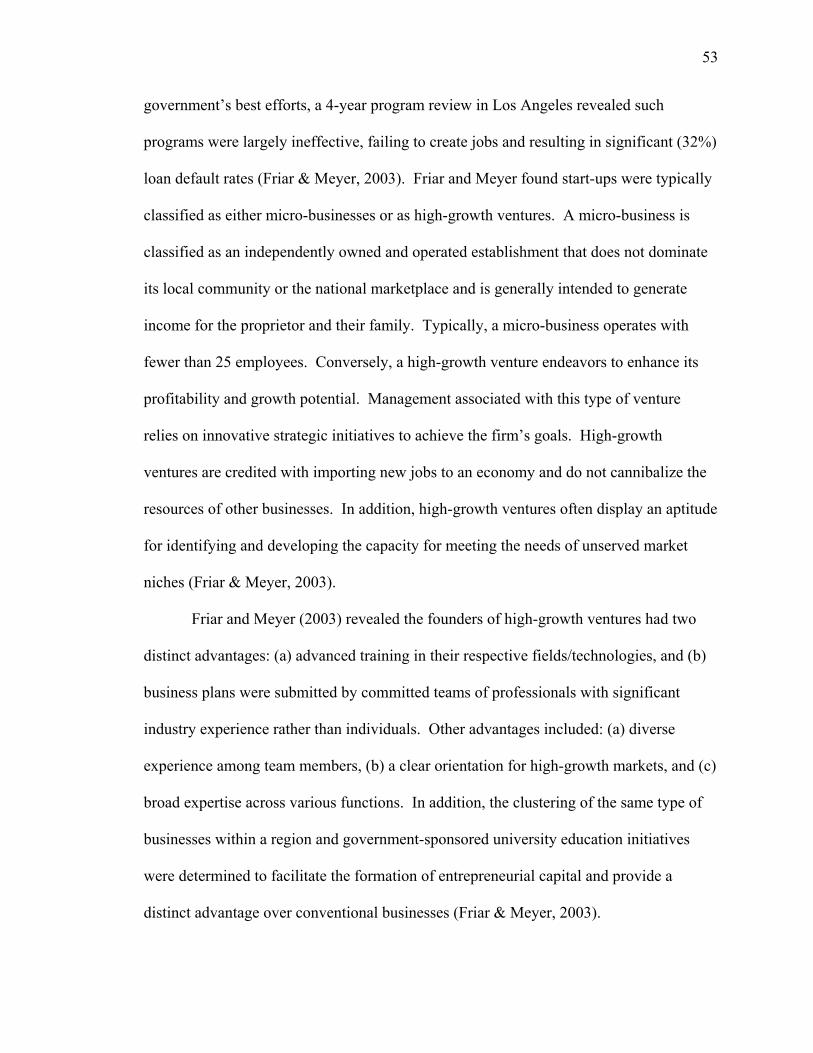
53
government’s best efforts, a 4-year program review in Los Angeles revealed such
programs were largely ineffective, failing to create jobs and resulting in significant (32%)
loan default rates (Friar & Meyer, 2003). Friar and Meyer found start-ups were typically
classified as either micro-businesses or as high-growth ventures. A micro-business is
classified as an independently owned and operated establishment that does not dominate
its local community or the national marketplace and is generally intended to generate
income for the proprietor and their family. Typically, a micro-business operates with
fewer than 25 employees. Conversely, a high-growth venture endeavors to enhance its
profitability and growth potential. Management associated with this type of venture
relies on innovative strategic initiatives to achieve the firm’s goals. High-growth
ventures are credited with importing new jobs to an economy and do not cannibalize the
resources of other businesses. In addition, high-growth ventures often display an aptitude
for identifying and developing the capacity for meeting the needs of unserved market
niches (Friar & Meyer, 2003).
Friar and Meyer (2003) revealed the founders of high-growth ventures had two
distinct advantages: (a) advanced training in their respective fields/technologies, and (b)
business plans were submitted by committed teams of professionals with significant
industry experience rather than individuals. Other advantages included: (a) diverse
experience among team members, (b) a clear orientation for high-growth markets, and (c)
broad expertise across various functions. In addition, the clustering of the same type of
businesses within a region and government-sponsored university education initiatives
were determined to facilitate the formation of entrepreneurial capital and provide a
distinct advantage over conventional businesses (Friar & Meyer, 2003).

54
Renski (2009) found some policy makers preferred to engage in economic
development strategies that fostered local entrepreneurial ventures as opposed to
industrial recruitment, which has been reflected by shrinking recruitment pools and
bidding wars that can diminish the value of their potential contribution to a local
economy. Weber (2002) contended the risks associated with industrial recruitment
through the price of incentives often outweighed the value of the public benefits
generated by the targeted firm’s contribution to economic development. To illustrate the
severity of this problem, Weber stated:
Lacking perfect competition, subsidized firms can influence the price at which the economic development is bought and sold. Firms can bluff and demand more than is really necessary because corporate management has access to relevant information about the firm’s own cost structure and hurdle rates to which the government is not privy. The financial gap firms seek to fill to make a project feasible may be much smaller than they would have the public sector believe. This information asymmetry makes it impossible for governments to know the minimum amount that would induce change in the firm’s location. It can produce a surplus for the sought-after firm that may or may not be passed on to potential employees as jobs or the winning locality as capital investment. (p. 44)
Weber (2002) contended that substantial transaction costs (e.g., accountability
mechanisms, failure to abide by environmental standards, etc.) can further diminish the
value of a firm’s contribution to economic development. Relying on a survey of local
economic development practitioners, Weber reported only 24% of respondents indicated
any systematic or quantitative means of analyzing the viability of deals between
governments and firms. Likewise, a cost-benefit analysis of economic development
programs in Indianapolis revealed it would take more than 4 years to secure a positive
return to the city. Ultimately, cities often rely on contracts to minimize transaction costs;
however, Weber concluded these accountability mechanisms were often too loosely
written and inadequately enforced to be effective.

55
In the context of how entrepreneurial communities can be distinguished by their
fundamental attributes, Lichtenstein et al. (2004) contended they must have achieved a
kind of critical mass of entrepreneurs who are committed to identifying and capturing
new market opportunities. In addition, groups of entrepreneurs are often regarded as a
distinctive element within a larger community. Ideally, the contributions of an
entrepreneurial community must operate at such a level as to continuously replace any
decline in aggregate economic activity from existing businesses. In order for a
community-at-large to reap the benefits of entrepreneurialism, stakeholders must develop
a holistic view and recognize the entire community must support such initiatives. Such
support can be garnered by the following actions: (a) providing loans to start-ups, (b)
passing favorable legislation, (c) formally welcoming new members, and (d) including
new entrants in economic and social networks (Degan, 2010; Gupta & York, 2008;
Lichtenstein et al., 2004). Likewise, Falcone and Wilson (2008) stipulated start-ups often
require assistance with articulating their business definition, while more mature firms
seeking to relocate to a more desirable location often require assistance in the form of
financing. In the context of enterprise development, non-profit, private, and public
organizations fulfill the role of service provider by providing assistance from the onset.
Examples include: (a) youth entrepreneurship programs, (b) microenterprise programs,
(c) business incubators, (d) manufacturing networks, (e) small business development
centers, (f) angel capital networks, and (g) venture capital clubs and funds (Lichtenstein
et al., 2004).
In the context of enterprise development, Lichtenstein et al. (2004) stipulated that
communities committed to economic development must recognize the following tenets:
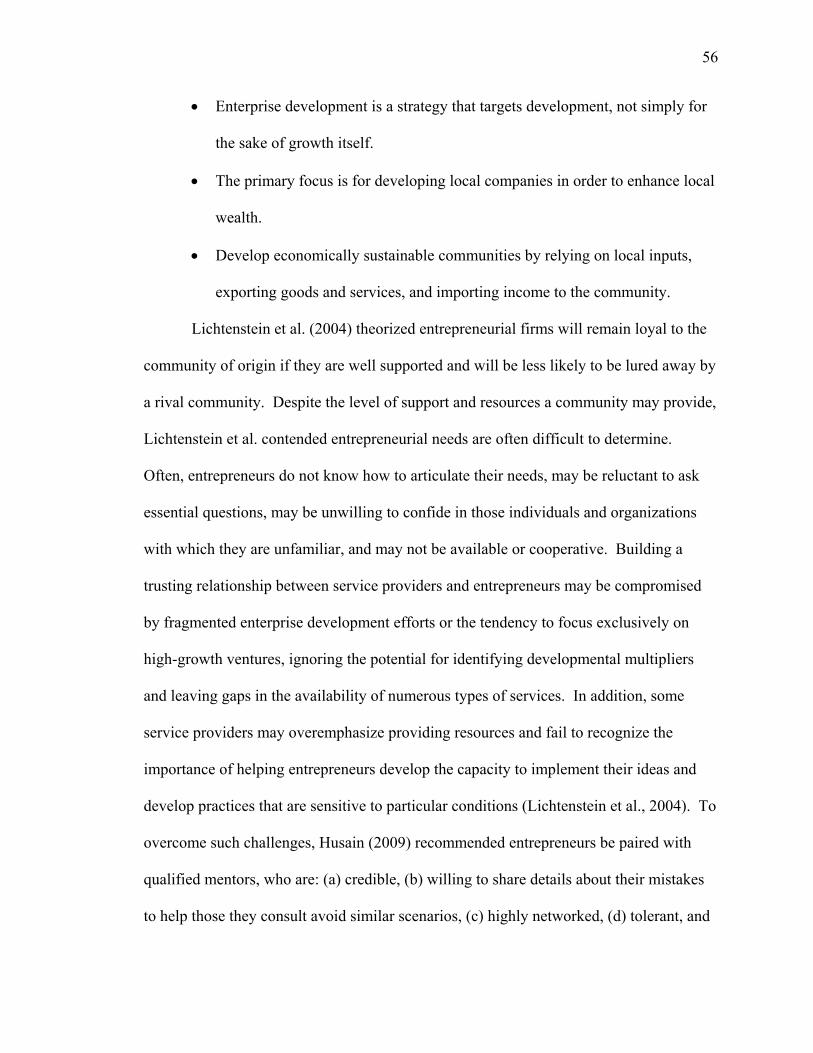
56
Enterprise development is a strategy that targets development, not simply for
the sake of growth itself.
The primary focus is for developing local companies in order to enhance local
wealth.
Develop economically sustainable communities by relying on local inputs,
exporting goods and services, and importing income to the community.
Lichtenstein et al. (2004) theorized entrepreneurial firms will remain loyal to the
community of origin if they are well supported and will be less likely to be lured away by
a rival community. Despite the level of support and resources a community may provide,
Lichtenstein et al. contended entrepreneurial needs are often difficult to determine.
Often, entrepreneurs do not know how to articulate their needs, may be reluctant to ask
essential questions, may be unwilling to confide in those individuals and organizations
with which they are unfamiliar, and may not be available or cooperative. Building a
trusting relationship between service providers and entrepreneurs may be compromised
by fragmented enterprise development efforts or the tendency to focus exclusively on
high-growth ventures, ignoring the potential for identifying developmental multipliers
and leaving gaps in the availability of numerous types of services. In addition, some
service providers may overemphasize providing resources and fail to recognize the
importance of helping entrepreneurs develop the capacity to implement their ideas and
develop practices that are sensitive to particular conditions (Lichtenstein et al., 2004). To
overcome such challenges, Husain (2009) recommended entrepreneurs be paired with
qualified mentors, who are: (a) credible, (b) willing to share details about their mistakes
to help those they consult avoid similar scenarios, (c) highly networked, (d) tolerant, and

57
(e) capable teachers. Rather than merely talking about their experiences, effective
mentors should provide direct and confidential assistance, provide access to their
networks, and play devil’s advocate to help entrepreneurs to vet their intentions (Husain,
2009).
In the context of building entrepreneurial communities, Lichtenstein et al. (2004)
contended purveyors of enterprise development programs must make the following
changes:
rely on a systematic approach to enterprise and community development
efforts by establishing a community-wide enterprise development system;
customize the enterprise development to the specific needs of the community;
emphasize and institutionalize efforts in developing a supply pipeline of
highly skilled entrepreneurs capable of establishing and sustaining successful
companies;
develop new roles, skills, and tools for managing and implementing the
enterprise development system; and
operate the system with the intent of transforming businesses, focusing first on
entrepreneurs, their businesses, and ultimately, the community’s economy.
Bednarzik’s (2000) and Friar and Meyer’s (2003) research findings corroborated
the findings of Corman et al. (1996) by reporting small businesses account for more than
85% of all establishments employing more than 20 employees. In addition, Bednarzik
stipulated employment levels often rise as establishment size increases, which is an
important implication when considering the role of new establishments in job creation.
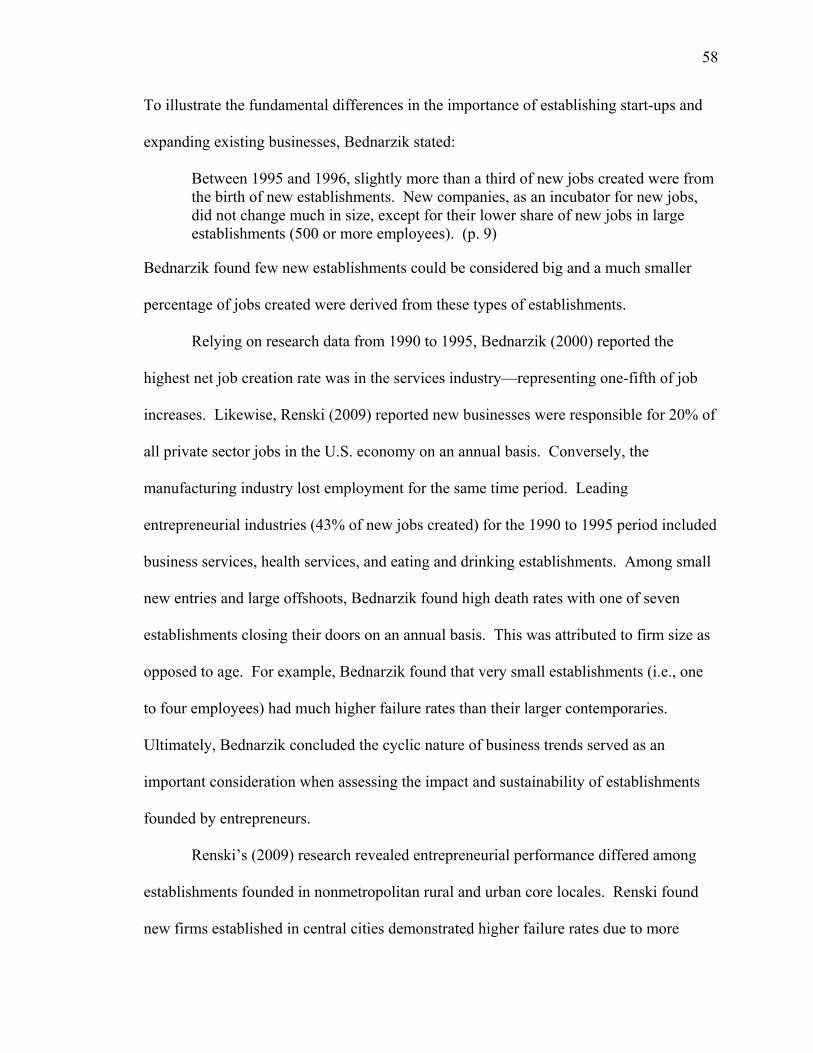
58
To illustrate the fundamental differences in the importance of establishing start-ups and
expanding existing businesses, Bednarzik stated:
Between 1995 and 1996, slightly more than a third of new jobs created were from the birth of new establishments. New companies, as an incubator for new jobs, did not change much in size, except for their lower share of new jobs in large establishments (500 or more employees). (p. 9)
Bednarzik found few new establishments could be considered big and a much smaller
percentage of jobs created were derived from these types of establishments.
Relying on research data from 1990 to 1995, Bednarzik (2000) reported the
highest net job creation rate was in the services industry––representing one-fifth of job
increases. Likewise, Renski (2009) reported new businesses were responsible for 20% of
all private sector jobs in the U.S. economy on an annual basis. Conversely, the
manufacturing industry lost employment for the same time period. Leading
entrepreneurial industries (43% of new jobs created) for the 1990 to 1995 period included
business services, health services, and eating and drinking establishments. Among small
new entries and large offshoots, Bednarzik found high death rates with one of seven
establishments closing their doors on an annual basis. This was attributed to firm size as
opposed to age. For example, Bednarzik found that very small establishments (i.e., one
to four employees) had much higher failure rates than their larger contemporaries.
Ultimately, Bednarzik concluded the cyclic nature of business trends served as an
important consideration when assessing the impact and sustainability of establishments
founded by entrepreneurs.
Renski’s (2009) research revealed entrepreneurial performance differed among
establishments founded in nonmetropolitan rural and urban core locales. Renski found
new firms established in central cities demonstrated higher failure rates due to more
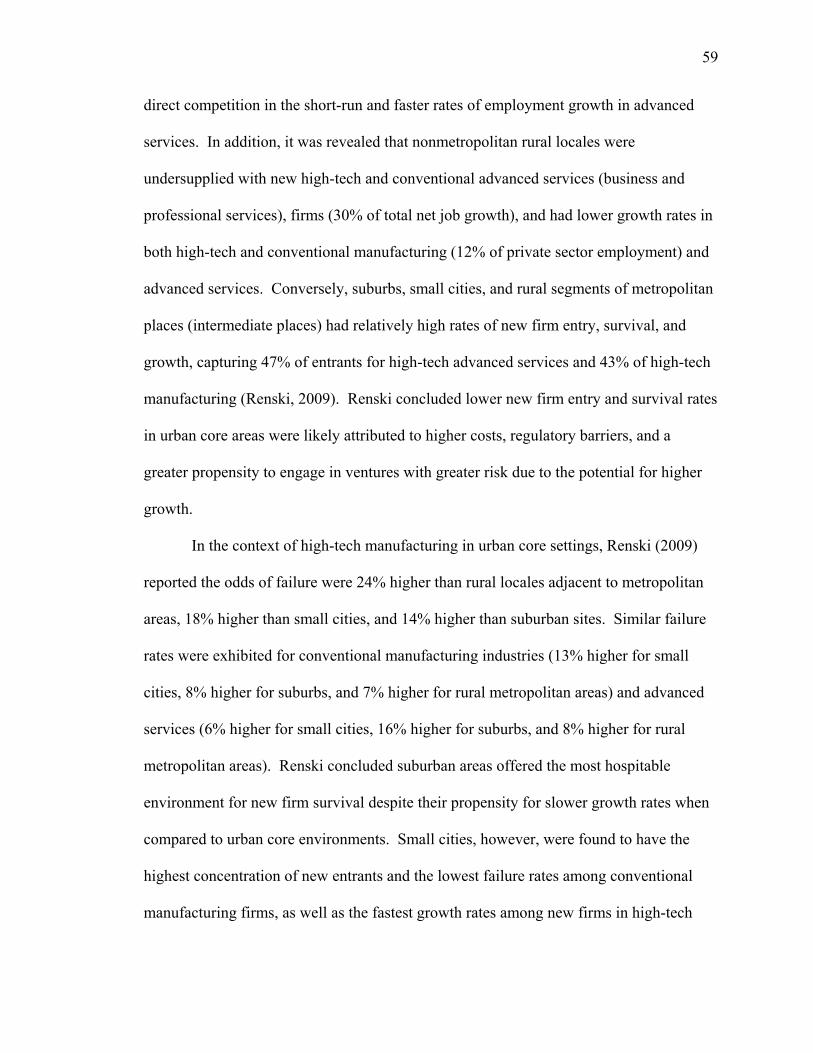
59
direct competition in the short-run and faster rates of employment growth in advanced
services. In addition, it was revealed that nonmetropolitan rural locales were
undersupplied with new high-tech and conventional advanced services (business and
professional services), firms (30% of total net job growth), and had lower growth rates in
both high-tech and conventional manufacturing (12% of private sector employment) and
advanced services. Conversely, suburbs, small cities, and rural segments of metropolitan
places (intermediate places) had relatively high rates of new firm entry, survival, and
growth, capturing 47% of entrants for high-tech advanced services and 43% of high-tech
manufacturing (Renski, 2009). Renski concluded lower new firm entry and survival rates
in urban core areas were likely attributed to higher costs, regulatory barriers, and a
greater propensity to engage in ventures with greater risk due to the potential for higher
growth.
In the context of high-tech manufacturing in urban core settings, Renski (2009)
reported the odds of failure were 24% higher than rural locales adjacent to metropolitan
areas, 18% higher than small cities, and 14% higher than suburban sites. Similar failure
rates were exhibited for conventional manufacturing industries (13% higher for small
cities, 8% higher for suburbs, and 7% higher for rural metropolitan areas) and advanced
services (6% higher for small cities, 16% higher for suburbs, and 8% higher for rural
metropolitan areas). Renski concluded suburban areas offered the most hospitable
environment for new firm survival despite their propensity for slower growth rates when
compared to urban core environments. Small cities, however, were found to have the
highest concentration of new entrants and the lowest failure rates among conventional
manufacturing firms, as well as the fastest growth rates among new firms in high-tech

60
manufacturing. Similarly, Audretsch and Keilbach (2005) contended regions with greater
population density and their immediate neighboring regions exhibited stronger spatial
correlations with measures of entrepreneurship.
To promote growth, however, stakeholders must be cognizant of quality-of-life
concerns as they relate to a community’s image. In the context of a business case for
considering relocation, Corman et al. (1996) stipulated the crime rate directly affects
business performance. As such, consumers are not likely to engage in business
transactions in what is perceived as a high crime area. For example, if crime is more
prevalent during evening hours, businesses may shut down operations during those time
periods to reduce their liability and potential for victimization, thereby losing potential
sales (Corman et al., 1996). Garrett and Ott (2008) stipulated that economic development
stakeholders (especially in urban areas) must recognize increasing crime rates will inhibit
inbound residential and business migration. In addition, Garrett and Ott contended
changes in criminal activity were inversely related to changes in New York City wages.
Specific estimates revealed a 10% increase in the wage growth rate contributed to a 4%
to 6% decline in the crime growth rate (Garrett & Ott, 2008).
In reference to broken windows theory, Fulda (2010) stated, “The theory argues
that cracking down on minor infractions signals intolerance towards major infractions,
and that criminals respond to vigorous enforcement of that we now call quality-of-life
offenses by restrained behavior engendered by that official intolerance” (p. 101). To
illustrate the net benefit of a more assertive law enforcement response, business leaders,
speaking of New York Police Commissioner Ray Kelly’s record of improved public
safety outcomes, credited him for improved investor confidence and ultimately the

61
reversal of capital flight (Whitford, 2012). In the context of reducing downtown blight
and improving a community’s image, Kotler, Haider, and Rein (1993) noted municipal
governments often create pedestrian malls and beautify surroundings to improve
perception. In an effort to attract tourists, government leaders often promote
conventions, subsidize hotels, and build convention facilities. Some communities go as
far as building research parks to facilitate start-ups and promote new technologies and
business incubators.
Despite an adherence to a “build it and they will come” ideology, many of these
commercial office buildings and retail sites remain vacant. In addition, poor regional
planning in urban areas to accommodate business expansion has contributed to traffic
gridlock, sprawl, excessive housing costs, pollution, rising taxes, and increasing
infrastructure costs. Poor planning can adversely impact the image of a community and
considering the nature of global competition, community leaders would likely find
themselves in a better position if they planned for avoiding hard times as opposed to
overcoming them. A proactive methodology to attract business interests could be
manifested as a place audit, which serves as a systematic examination of a community’s
economy, design, physical assets, quality-of-life, and residents to determine the strengths,
weaknesses, opportunities, and threats (SWOT analysis) confronting a community.
Ultimately, such planning must be adaptive in order to confront changing economic
conditions and take advantage of new opportunities (Kotler et al., 1993).
Falcone and Wilson (2008), Ho and Wong (2006), and Sriram et al. (2006)
contended that high taxes, utility costs, difficulty acquiring affordable insurance, crime, a
poorly educated workforce, a jobs mismatch, inadequate infrastructure (e.g.,

62
transportation, etc.), burdensome regulations and permitting requirements, and
environmental pollution adversely affect a community’s ability to attract potential
employers. To illustrate the severity of this issue, Sriram et al. reported in 2004 it was
estimated that 50% to 75% of the City of Baltimore’s 18- to 35-year-olds had a criminal
history and issues with drug addiction, creating a significant employment barrier. This
situation was compounded by a lack of vehicle ownership (a third of Baltimore
households do not have access to a vehicle), inadequate public transportation, and the fact
that higher paying city jobs required a college education. The impact of this phenomenon
was evidenced by demographic statistics that demonstrated the 2002 median household
income for Baltimore ($30,600) had fallen relative to the State of Maryland ($58,600;
Sriram et al., 2006).
The results of these findings are controversial because historical research has
demonstrated inner cities often possess numerous advantages that can be leveraged to
overcome such challenges. For example, Sriram et al. (2006) contended inner cities are
typically endowed with an excellent location, large market demand due to a dense
population, untapped human capital, and superior infrastructure and economic resources.
Sriram et al. stipulated inner cities are often inhibited from leveraging their inherent
resources due to the failure of social models fostered by the U.S. government that have
emphasized poverty alleviation programs (e.g., food stamps, housing subsidies, welfare
programs, etc.) as opposed to dedicating resources to attracting private business
enterprises to inner-city communities for the purpose of job creation and community
revitalization. To ensure sustainable economic development and growth, inner-city
residents need more than jobs––they need to become business owners to promote
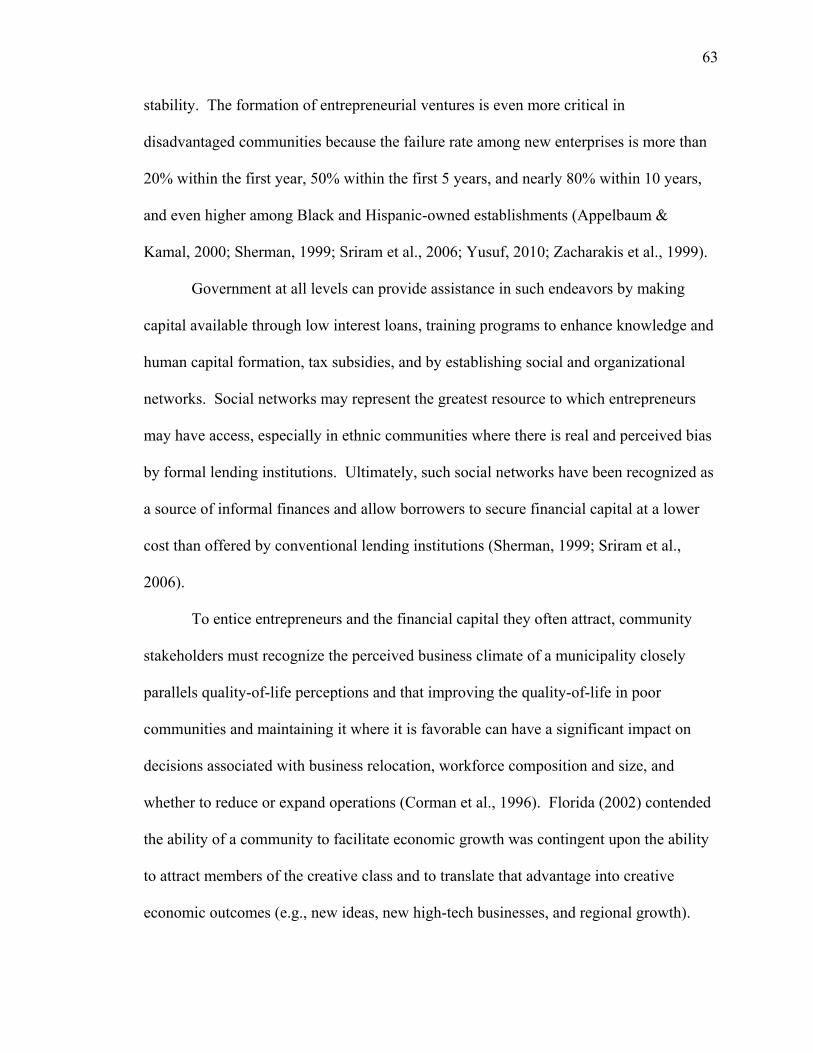
63
stability. The formation of entrepreneurial ventures is even more critical in
disadvantaged communities because the failure rate among new enterprises is more than
20% within the first year, 50% within the first 5 years, and nearly 80% within 10 years,
and even higher among Black and Hispanic-owned establishments (Appelbaum &
Kamal, 2000; Sherman, 1999; Sriram et al., 2006; Yusuf, 2010; Zacharakis et al., 1999).
Government at all levels can provide assistance in such endeavors by making
capital available through low interest loans, training programs to enhance knowledge and
human capital formation, tax subsidies, and by establishing social and organizational
networks. Social networks may represent the greatest resource to which entrepreneurs
may have access, especially in ethnic communities where there is real and perceived bias
by formal lending institutions. Ultimately, such social networks have been recognized as
a source of informal finances and allow borrowers to secure financial capital at a lower
cost than offered by conventional lending institutions (Sherman, 1999; Sriram et al.,
2006).
To entice entrepreneurs and the financial capital they often attract, community
stakeholders must recognize the perceived business climate of a municipality closely
parallels quality-of-life perceptions and that improving the quality-of-life in poor
communities and maintaining it where it is favorable can have a significant impact on
decisions associated with business relocation, workforce composition and size, and
whether to reduce or expand operations (Corman et al., 1996). Florida (2002) contended
the ability of a community to facilitate economic growth was contingent upon the ability
to attract members of the creative class and to translate that advantage into creative
economic outcomes (e.g., new ideas, new high-tech businesses, and regional growth).

64
To illustrate the importance of this market segment, Florida (2012) stipulated the
creative class had emerged as the most dominant and influential group of people in
American society. Likewise, to attract members of the creative class, Florida (2002)
argued communities should endeavor to create an environment that attracts significant
numbers of young people by supporting: (a) a thriving music scene, (b) ethnic and
cultural diversity, (c) tolerance, (d) outdoor recreation, and (e) a great nightlife. In
addition, Florida (2012) posited members of the creative class, more often than not, make
location choices primarily in accordance with their lifestyle interests as opposed to
conventional attractors such as standard quality-of-life amenities. To clarify his position,
Florida (2012) stated:
You can’t just enjoy a ballgame; you have to go to a “state-of-the-art” $500 million stadium for a multimedia circus that distracts you from the very game you paid to see. Many Creative Class people thus tend to shun the heavily packaged commercial venues they call generic – the chain restaurants and nightclubs, the stadiums with bells and whistles – or they patronize them but with a conscious sense of irony and camp, as in the obligatory trip to a business conference in Las Vegas. They prefer more authentic, indigenous, or organic venues that offer a wide range of options, places where they can have a hand in creating them. (p. 154)
Ultimately, Florida (2012) contended communities need to invest in people and business
climates, promote density, transit-oriented development, walkability, create green spaces
and other public spaces, encourage diversity, and build real quality of place.
Doring et al. (2010) and Judd and McNeil (2008) posited that communities with a
higher quality-of-life (e.g., recreational value, positive social climate, attractive inner
city, citizen friendly administration, adequate cultural and social institutions, etc.) have a
distinctive binding effect and attract creative individuals in greater numbers. For
example, Judd and McNeil, relying on a 2007 retail development survey administered to
residents of Marion, Indiana, reported 71% of respondents suggested additional retail

65
establishments would improve their quality-of-life, 69% stipulated sales tax revenues
would increase, and 60% contended additional retail establishments would facilitate job
creation and prevent additional losses in employment opportunities.
In the context of developing an economic development plan for a downtown area
that would encourage recurring commerce, R. Baker (2011) suggested community
stakeholders should engage in the following efforts:
increase the frequency of recurring events;
develop and expand the fixed activity generators (e.g., medical complexes,
marine research, education, general business, hotels, shopping, and
restaurants);
support and expand cultural amenities;
establish a premier activity attractor (e.g., cafés, retail, etc.) and establish
connections to other activity centers;
improve access to and around the area; and
develop a focus on making the area a desirable place to live and work in an
effort to attract more residential living.
In addition, R. Baker contended recurring events could serve to: (a) increase commerce
and generate revenues, (b) enhance a city’s image, and (c) improve quality-of-life
perceptions among existing residents. Florida (2012) corroborated R. Baker’s position by
stating, “Personal lives and workplaces, whole industries and geographic regions are
beginning to operate on the principles of constant, dynamic, creative interaction” (p. 29).
To clarify his position, Florida (2012) contended members of the creative class rely on
extracurricular activities to help cultivate their interests, values, and identities in both the

66
workplace and in their social lives. Ultimately, to illustrate the importance of attracting
the creative class, Florida (2012), referring to Labor Statistics projections, reported this
market segment was likely to add 5.4 million jobs by 2020.
To demonstrate why some business and community leaders have failed to attract
members of the creative class, Florida (2002) stated:
Stuck in old paradigms of economic development, cities like Buffalo, New Orleans, and Louisville struggled in the 1980s and 1990s to become the next Silicon Somewhere by building generic high-tech office parks or subsidizing professional sport teams. Yet they lost members of the creative class, and their economic dynamism, to places like Austin, Boston, Washington D.C., and Seattle – places more tolerant, diverse, and open to creativity. Because of this migration of the creative class, a new social and economic geography is emerging in America, one that does not correspond to old categories like East Coast versus West Coast or Sunbelt versus Frostbelt. Rather, it is more like the class divisions that have increasingly separated Americans by income and neighborhood, extended into the realm of city and region. (p. 17)
In addition, Florida (2002) divided the creative class into two segments: the super-
creative core and creative professionals. The super-creative core typically includes
scientists, engineers, university professors, poets, novelists, artists, entertainers, think-
tank researchers, and other opinion makers. Super-creative core members are principal
innovators who produce new forms or designs that are readily transferable and useful.
Creative professionals work in a wide-range of knowledge-intensive industries (e.g., high
tech sectors, financial services, legal, healthcare, business management, etc.). These
individuals are engaged in problem-solving and draw on a complex knowledge base to
confront modern challenges. Furthermore, creative professionals often possess a high
degree of formal education and human capital (Florida, 2002). Ultimately, Florida
(2002) posited that communities with a higher concentration of creative class individuals
(i.e., 30% to 35% of the workforce) often exhibited higher levels of economic growth.

67
Florida (2002) contended that for communities to attract members of the creative
class, they must facilitate low entry barriers. To do so ensures new business firms and
people alike will encounter an environment where they are quickly accepted into
numerous social and economic arrangements and endeavors. Florida (2002) described
such destinations as plug-and-play communities, where creative individuals can find
opportunity, build support, be true to themselves, and not be forced into any singular
identity. To illustrate his position, Florida (2002) stated:
Cities and regions that attract lots of creative talent are also those with greater diversity and higher levels of quality of place. That’s because location choices of the creative class are based to a large degree on their lifestyle interests, and these go well beyond the standard quality-of-life amenities that most experts think are important. (p. 20)
In addition, Florida (2002) stipulated members of the creative class prefer active
participative recreation over institutionalized forms. For example, creative individuals
often find an authentic and indigenous street-level culture comprising cafés, sidewalk
musicians, small galleries, and bistros serves to stimulate their senses. Furthermore,
Florida’s (2002) research revealed creative individuals place a higher value on active
outdoor recreation (e.g., bicycling, jogging, kayaking, etc.), which serves to broaden their
creative lifestyles. Ultimately, Florida (2012) stipulated quality of place comprises three
dimensions:
What’s there: the combination of the built environment and the natural
environment.
Who’s there: the diverse kinds of people, interacting and providing cues that
anyone can make a life for themselves in the community.

68
What’s going on: the vibrancy of street life, café culture, arts, music, and
people engaging in outdoor activities.
Markusen, Gadwa-Nicodemus, and Barbour (2013) introduced the business case
for Florida’s (2012) position on quality of place. Relying on consumption base theory,
which posits that investments in certain types of consumption base activity can contribute
favorably to employment growth and income, Markusen et al. stipulated this outcome
could be achieved by:
providing residents with more opportunities to spend a greater share of their
discretionary income on new locally produced goods and services;
seeding innovations that ultimately expand into export markets;
nurturing organizations and occupations that re-spend a greater share of their
earnings locally than their peers; and
attracting and retaining entrepreneurs, firms, and workers.
In contrast, relying on traditional export-based practices can inhibit a community’s
growth potential and simultaneously discourage advances in the arts and culture
(Markusen et al., 2013). To promote clarity, Markusen et al. (2013) stated:
Job center cities are more likely to host businesses whose owners, managers, and employees contribute to local arts and culture through patronage and contributions. Businesses may feel that strong arts and cultural offerings enhance employee motivation, help attract and keep employees, and encourage retail customers. (p. 47)
Audretsch and Keilbach (2005) stipulated a stakeholder approach is essential for
enhancing the social capital of entrepreneurs, which is necessary for encouraging bankers
and venture capital firms to share the risks and benefits associated with their initiatives.
In the context of opportunity costs and alternative investment opportunities, Audretsch

69
and Keilbach’s research revealed the funding of entrepreneurship capital was
considerably more efficient than R&D funding. Audretsch and Keilbach suggested an
increase in entrepreneurship by a given percentage has the potential to deliver three to
four times the impact of R&D inputs by the same percentage. Ultimately, fostering
entrepreneurship in R&D-oriented industries may deliver a more sustainable impact than
other industry start-up types (Audretsch & Keilbach, 2005).
A 1995 survey of CEOs managing companies in the State of Massachusetts
revealed incentives for business expansion, the reduction of business and personal tax
liabilities, improvements in the education system, reductions in regulation, and the
improvement and expansion of the transportation system were essential factors for
improving a local business climate (Corman et al., 1996). Gupta and York (2008)
corroborated these findings by reporting their survey findings revealed 60% of the U.S.
general public and 75% of business owners thought there was too much government
intervention in business affairs and 48% of the general public and 69% of business
owners thought they were over taxed. In addition, Corman et al. (1996) revealed the
availability of capital and attitudes toward business were of primary concern during
recessionary periods.
In the context of the level of importance during periods of expansion and
improved profitability, concerns over personal taxes, crime, and the cost and quality of
telecommunications systems increased significantly. In addition, the 15 factors that
increased in the level of satisfaction during expansionary periods included: (a)
availability of capital, (b) cost of capital, (c) availability of investment tax credit, (d)
quality of public schools, (e) crime level, (f) adequacy of infrastructure, (g) housing
70
costs, (h) cost of semi-skilled labor, (i) cost of low-skilled labor, (j) cost of worker’s
compensation insurance, (k) attitude toward business, (l) spending on education, (m)
business assistance programs, (n) demand for products and services, and (o) health
insurance costs (Corman et al., 1996).
Essential community policies for attracting and retaining desirable business
activity include: (a) investment in the education of skilled people and the development of
small businesses, (b) encouraging immigration from external communities, (c) providing
infrastructure for human and business development, and (d) initiatives that bring public
and non-profit sectors into the entrepreneurial mix (Bednarzik, 2000; Judd & McNeil,
2008; Lichtenstein et al., 2004). Similarly, Doring et al. (2010) reported a number of
empirical studies have demonstrated market development, proximity to major customers,
and flexibility of location to be major considerations when entrepreneurs evaluate the
competitiveness of a community. Conversely, soft locational factors, such as taxes and
subsidies, leisure value, climate, or network clusters, are only considered when hard
factors are adequate (Doring et al., 2010). Relying on econometric models to estimate
changes in employment and revenues, Weber (2002) determined there was a very low
correlation between local incentives (e.g., reduced taxes, targeted financial inducements,
etc.) and employment growth. For example, the State of Michigan’s passage of a $600
million annual tax incentive for manufacturers had failed to produce the desired
economic impact as nearly 700,000 jobs would likely depart the state with or without the
tax benefit (Judd & McNeil, 2008). Ultimately, Florida (2012) corroborated these
findings by stating:
The communities that creatives are attracted to do not thrive for traditional economic reasons, such as access to natural resources or proximity to major

71
transportation routes. Nor is their economic success tied to tax breaks and other incentives designed to lure businesses. A big part of their success stems from the fact that they are places where creative people want to live. This circumvents the age-old chicken-and-egg problem of what comes first, jobs or people. The answer is simple: it is not either-or, but both. Creative centers provide the integrated ecosystem or habitat where all forms of creativity – artistic and cultural, technological and economic – can take root and flourish. (p. 186)
To illustrate the importance of regional politics in determining investment and
implementation strategies, Hamilton (2008) and Judd and McNeil (2008) warned that
poorly designed policies and programs could inhibit entrepreneurism, especially in the
context of technology innovation. In fact, Florida (2012) contended that in order to
achieve favorable economic outcomes, technology, talent, and tolerance must persist and
interact in ways that make them interdependent. To elaborate, Judd and McNeil posited
many economic development strategies do not account for how globalization of services
and production has impacted firm decision-making. At best, Judd and McNeil stipulated
traditional approaches to economic development should be regarded as a zero-sum game,
where economic regions battle for a share of an ever shrinking pie. In addition, Hamilton
theorized that regardless of political affiliation, local governments, if provided with
greater latitude in legislative control and when there was a higher ratio in program
funding, were less efficient in program management than private entities (e.g., local
entrepreneurs, firms, universities, etc.).
Hamilton (2008) recommended increased constraints be placed on elected
officials and more pervasive monitoring be done by independent groups to protect the
effectiveness of such programs, especially in the initial stages of development.
Furthermore, Campbell and Rogers (2007) warned that an over politicized economy is
inherently less free, and as such, expertise and resources are channeled away from the
mechanisms that inspire wealth creation leading to lower incomes and a lower rate of

72
business formation. Campbell and Rogers recommended governments avoid intervention
and as an alternative, foster an environment that safeguards property rights, allows
entrepreneurs to enjoy the freedom to flourish, allows consumers to decide how to spend
their hard earned income, avoids policies that result in income redistribution, and
minimizes large payrolls.
Ho and Wong (2006) revealed that regulatory business costs (e.g., number of
procedures associated with starting a business, number of days to start a business, cost of
starting a business, and minimum paid up capital required to register a business) had a
negative and significant impact on opportunity driven entrepreneurs. Campbell and
Rogers (2007) revealed economic freedom (relying on the Economic Freedom Index of
North America index) had more than twice the marginal effect of a similar increase in
commercial lending and nearly three times the marginal effect of a similar increase in the
percentage of minority businesses. Judd and McNeil (2008) stipulated that in order for
communities to successfully compete in a global environment, economic development
planners must embrace 21st century thinking and promote programs that support business
start-ups and growth of existing businesses, and rely less on recruiting large firms with
tax breaks and other financial inducements. Ultimately, Judd and McNeil concluded the
best economic development strategy would be to emphasize the organic growth of
existing community firms as opposed to the recruitment of new enterprises.
In the context of evaluating the effectiveness of economic development programs,
Hamilton (2008) stipulated such assessments are problematic because: (a) outcomes can
only be achieved over the long-term, (b) identifying comparison groups is difficult, and
(c) a large number of factors can contribute to economic growth. To overcome these
73
challenges, Hamilton recommended a qualitative approach relying on historical narrative
that incorporates the triangulation of data sources (e.g., archives, organizational
documents, interviews, quantitative data, etc.) to develop insights and evidence that can
help establish the dominance of certain factors or perceptions that promote economic
growth. For example, Hamilton’s research encompassing the Denver region in Colorado
revealed business incubators’ efforts to help diversify the local business community had a
favorable impact despite ongoing funding challenges.
Summary
After conducting an initial review of the academic literature, the author concluded
a more robust method of inquiry would be essential for clarifying how stakeholder
perceptions influence entrepreneurism in the City of St. Petersburg. To facilitate this
endeavor, the author concluded qualitative research methods incorporating one-to-one
interviews and a focus group would enable him to clarify how the lived experiences of
stakeholders shaped their perceptions. The author posited the primary research findings
and subsequent analyses would enable him to assess how stakeholder perceptions
associated with: (a) uncertainty, (b) intellectual capital, (c) entrepreneurs, (d)
government, (e) business assistance programs, (f) universities, (g) human capital, (h)
financial capital, (i) brand promotion, and (j) economic development planning influence
entrepreneurism in St. Petersburg, Florida. As such, the author posited an emphasis on
how the following factors would help facilitate the author’s efforts in establishing
sufficient clarity to address the research question and achieve the research goals: (a)
information asymmetries and risk mitigation; (b) intellectual capital and knowledge
spillovers; (c) grass support among community stakeholders; (d) public policy

74
contradictions; (e) business assistance program alignment and access to intellectual
capital; (f) the role of universities in supporting the formation of human capital; (g)
specialized human capital supply and business site selection considerations; (h) access
and availability of financial capital; (i) the importance of distinguishing a community by
establishing marketplace niche; and (j) how quality of place advantages can be translated
to favorable economic outcomes.
75
CHAPTER THREE: METHODOLOGY
Research Design
Due to the inherent inability of quantitative methods to help researchers recognize
the complex relationships that exist between individual behaviors, attitudes, external
structures, socio-cultural issues, and phenomena, the author determined a
phenomenological qualitative research design would serve as the best suited method of
inquiry. Advocates of qualitative research methods contend that associated findings
often: (a) exhibit richness in detail; (b) support holistic analysis; (c) increase the validity
and depth of descriptions; (d) promote open-ended inquiry; and (e) support the discovery
of underlying values, beliefs, and assumptions (Al-Hamdan & Anthony, 2010; Crossan,
2003; Johnson & Onwuegbuzie, 2004; Kelle, 2006; Yauch & Steudel, 2003). Ultimately,
the author posited a qualitative research design would help characterize the essence of
human experiences and, ultimately, how stakeholder perceptions influence
entrepreneurism in the City of St. Petersburg, Florida (Creswell, 2009).
Population and Sampling Procedures
When relying on qualitative research methods, Creswell (2009) stipulated
researchers typically involve a small number of subjects through extensive and prolonged
engagement to develop patterns and the relationships of meanings. Likewise, S. E. Baker
and Edwards (2012) stated:
A small number of cases or subjects, may be extremely valuable and represent adequate numbers for a research project. This is especially true for studying hidden or hard to access populations such as deviants or elites. Here, a relatively few people, such as between six and dozen, may offer us insights into such things as the stratification hierarchy of a drug-producing subculture, an outlaw motorcycle gang, or a corporate boardroom. (p. 8)

76
S. E. Baker and Edwards recommended a minimum sample of 12 participants to satisfy
the requirements of an interpretative phenomenological analysis. As a result, the author
constructed a purposive proportional quota sample consisting of 12 business owners or
managers representing local City of St. Petersburg business establishments. Ultimately,
the author was confident empirical saturation would be achieved with this sample group.
In the context of economic resiliency, the author’s initial assessment of the City of
St. Petersburg’s composition of business establishments revealed six major business
clusters: (a) financial services; (b) marine and environmental sciences; (c) medical
technology and life sciences; (d) information technology; (e) manufacturing; and (f) arts,
culture, and events tourism (City of St. Petersburg, 2012b). While this broad assessment
was useful for orienting the author to the economic drivers of the city, it did not provide
adequate information for developing a defensible sample group. Relying on statistics
provided by CLRSearch.com (2010), the author determined the City of St. Petersburg had
a business establishment population of 6,320. After evaluating the composition of the
City of St. Petersburg business community, the author stratified the sample group by the
North American Industry Classification System (NAICS) to ensure it was aligned with
the major characteristics of the local business population and conformed to the
composition of the top eight (ranked by quantity) NAICS classified business
establishment types. The author established parity by optimizing composition ratios
between the sample group and the population (See Appendix B):
Professional, scientific, and technical services (N = 1,061 [20%], n = 3
[25%]);
Retail trade (N = 844 [16%], n = 2 [17%]);

77
Health care and social assistance (N = 826 [16%], n = 2 [17%]);
Other services (except public administration; N = 589 [11%], n = 1 [8%]);
Finance and insurance (N = 554 [11%], n = 1 [8%])
Construction (N = 493 [9%], n = 1 [8%]);
Accommodation and food services (N = 454 [9%], n =1 [8%]); and
Administration, support, waste management, and remediation services (N =
391 [8%], n = 1 [8%]; CLRSearch.com, 2010).
The application of this sampling method was not intended to establish
generalizability with the business population but rather to: (a) reach the targeted sample
group quickly, (b) acquire a sufficient sample that would provide the opinions of the
target population, (c) offset the potential impact of overweighted subgroups and the
potential for selection bias, (d) avoid sampling bias, and (e) address time and cost
constraints (S. E. Baker & Edwards, 2012; Creswell, 2009).
Instrumentation
The author relied on one-to-one personal interviews and focus group participants
derived from the purposive proportional quota sample. The survey instrument was
designed to promote clarity and facilitate respondent input rather than the author’s.
Likewise, the author relied on 10 semi-structured questions for the foundation of the
focus group agenda. The 10 semi-structured questions were:
1. How would you characterize the current business climate in the City of St.
Petersburg (Uncertainty)?
2. What factors do you believe favorably impact business performance in St.
Petersburg (Intellectual Capital)?

78
3. How would you characterize the level of support your business has been
provided by the St. Petersburg community (Entrepreneurs)?
4. How would you define the local municipal government’s role in supporting
business prosperity and economic growth (Government)?
5. How would you characterize the quality and effectiveness of business
assistance programs in St. Petersburg (Business Assistance Programs)?
6. How would you define the role that local universities play in promoting
economic growth (Universities)?
7. What is your assessment of the availability and quality of the local St.
Petersburg workforce (Human Capital)?
8. How would you characterize current conditions as it pertains to access to
capital (Financial Capital)?
9. How would you describe the effectiveness of City of St. Petersburg’s brand
promotion efforts in terms of its contribution to economic prosperity (Brand
Promotion)?
10. What is your assessment of government and business leader performance in
promoting economic growth (Economic Development Planning)?
The author relied on an electronic audio recording device to support transcription
and coding. While the questions were definitive, the author recognized improvisation
would be required when it was necessary to establish greater clarity in respondent
experiences, perceptions, and values. Improvised questions were recorded electronically.
To protect the anonymity and confidentiality of respondents, audio data were transferred
from the electronic audio recording device and stored on encrypted and password

79
protected solid state media. All file naming conventions were encoded to ensure
deduction could not be relied upon to identify respondent identities. In the context of
reporting findings, the author relied on coded respondent identification numbers in lieu of
actual identities to protect anonymity and privacy. Likewise, the author relied on WinZip
to encrypt all transcripts when engaged in member checking. Only the author maintained
access to recorded one-to-one interviews, associated transcripts, and MAXQDA project
files. At the conclusion of this research study all associated records (e.g., one-to-one
interview recordings, transcripts, project files, etc.) were stored on secured solid state
media. In addition, all data will be maintained for 5 years. Prior to conducting one-to-
one interviews, each respondent was provided an Informed Consent Form (See Appendix
C). The only written documents distributed were the Informed Consent Form and
interview questions to facilitate the interviewing process.
Procedures
Recognizing the potential threats to internal and external validity and reliability,
the author conducted the following procedures: (a) checked transcripts to ensure they
were error-free, (b) ensured coding definitions remained consistent during the coding
process, (c) triangulated different data sources, (d) engaged in member checking and
follow-up, (e) conducted peer debriefing, and (f) facilitated transferability by providing
rich and thick descriptions to help readers interpret findings and reach their own
conclusions (Brown, 2005; Creswell, 2007, 2009; Key, 1997).
To support triangulation and member checking, the author conducted a focus
group to further clarify the analysis derived from the one-to-one interviews and to engage
in the exploratory aspects of the analysis. The focus group research method was intended

80
to promote interaction between participants and serve as a supplementary source of data
(Morgan, 1997). Morgan (1997) contended group interaction is essential for producing
data and insight that are less accessible through more conventional research methods. In
the context of the comparative advantage among qualitative research methods, Morgan
posited group discussions provide direct evidence about similarities and differences in
respondent opinions and experiences. In contrast, conventional one-to-one interviews
elicit data that require researchers to reach conclusions from post-hoc analyses based on
separate statements. In addition, Morgan stipulated the combined use of qualitative
methods enables a researcher to attain a unique understanding of a phenomenon being
studied, promote validity, and strengthen the total research project.
In the context of maintaining control of the interactions, the author served as the
moderator. While some critics contend a moderator can unduly influence a group’s
interactions, Morgan (1997) contended there was little evidence that their impact on the
data is any greater than a researcher’s impact on individual interviews. Additional
concerns for focus groups included: (a) tendency toward conformity, and (b) tendency
toward polarization (extreme views; Morgan, 1997). To overcome these potential
weaknesses, the author as the moderator endeavored to keep the focus group on topic and
was prepared to respond accordingly should an argument emerge due to the highly
controversial nature of the research topic (Morgan, 1997). To minimize the likelihood of
participant disagreement, the author conducted a pretest among peers to identify sensitive
issues in advance. In turn, the author refined the topics for focus group discussion and
refined his own role and techniques for maintaining control of focus group participant
interactions. Ultimately, the author developed a Focus Group Discussion Guide that

81
incorporated an agenda to provide the impetus for control without inhibiting the
willingness to share experiences among participants (See Appendix D). The Focus
Group Discussion Guide was intended to promote a natural progression across topics
with some overlap between topics to avoid artificial compartmentalization (Morgan,
1997).
In the context of the planning and research design for the focus group, the author
addressed privacy concerns by restricting access to audio recordings and transcripts. The
author maintained exclusive access to the focus group session recording, associated
transcripts, and MAXQDA project files. At the conclusion of this research study, all
associated records (e.g., focus group session recording, transcript, project files, etc.) were
stored on secured solid state media. All data will be maintained for 5 years. In addition,
focus group participant identities were expressed using the same method as employed for
the one-to-one interviews. Prior to conducting the focus group, each participant was
provided an Informed Consent Form using the same criteria as expressed in the one-to-
one interviews (See Appendix E). In terms of the focus group site, the author secured a
board room in the St. Petersburg Area Chamber of Commerce facility in Downtown St.
Petersburg. This facility provided privacy and is located in an area of the city that was
easily accessible and proved convenient for all participants. Focus group activities were
completed in 2 hours to satisfy administrative requirements and elicit the opinions,
perceptions, and experiences of participants (Morgan, 1997). Refreshments were
provided to each participant.
In the context of sample selection, the author solicited each respondent to
participate in the focus group at the conclusion of the one-to-one interview. Once the

82
author determined which participants had agreed to participate, the author stratified the
sample group using the same criteria relied upon for selecting one-to-one interview
respondents. In the context of sample size, the author anticipated that six respondents
would actually participate in the focus group. In addition, the author over-recruited by
20% (two respondents) to compensate for cancellations (Morgan, 1997). The author,
relying upon the guidance of Morgan (1997), determined six participants was the optimal
size for this sample group. Morgan contended the rule of thumb size for a focus group
sample is between six and 10 participants. To illustrate his position, Morgan stated,
“Below 6, it may be difficult to sustain a discussion; above 10, it may be difficult to
control one” (p. 43).
In an effort to avoid groupthink and help contend with latecomers, the author as
the moderator encouraged each participant to make opening statements to express his or
her opinions and experiences prior to group interaction. In addition, the moderator
invoked discussion-starter questions due to the tendency of dissenters to suppress their
disagreements in favor of maintaining group consensus. These actions helped the
moderator: (a) establish a nominal group, (b) provide direct evidence about the amount of
consensus and diversity in the group, (c) determine the strength and breadth of the
consensus, and (d) avoid emphasizing the moderator’s manifest interests in favor of the
participants’ (Morgan, 1997). The moderator relied on discussion flags to initiate new
topics and redirect when necessary. In addition, the moderator allowed each participant
to make final statements to provide an opportunity to submit his or her perspective
without the fear of being challenged or interrupted (Morgan, 1997). Upon the completion

83
of the focus group session transcription, a follow-up was conducted to provide an
additional opportunity for participants to conclude their remarks (Morgan, 1997).
Ihantola and Kihn (2011) recommended researchers make their paradigmatic
assumptions explicit to ensure they do not conduct their research under the influence of
their stated assumptions. Likewise, Creswell (2007) contended researchers should be
self-critical and rely on reflexivity to raise questions and challenges to ideas developed
while conducting research. Bracketing can also be employed to ensure that researchers
set aside their preconceptions to promote an unbiased understanding of the experiences
described by the respondents. Collectively, these forms of legitimization can help
researchers confront threats to internal and external validity, which could threaten the
credibility of the research and researcher (Creswell, 2007; Ihantola & Kihn, 2011). The
author relied on a reflexive analysis and bracketing to avoid the pitfalls associated with
bias and to enhance trustworthiness (Argosy University, 2011).
The author recognized his personal biases, values, and experiences could
overshadow the interview process. As such, the author’s self-assessment revealed his
long-standing residence and employment within the City of St. Petersburg could
influence his disposition. To counter this potential for researcher bias, the author did not
ask leading questions or share his literature review findings with respondents. In the
context of values, the author has embraced a pro-business sentiment throughout his adult
life, which is rooted in his family’s ownership of small business enterprises throughout
the region. Interestingly, throughout the author’s employment with the City of St.
Petersburg as an analyst, he has been compelled to participate in policy development and
enforcement initiatives intended to constrain and regulate the actions of certain members
84
of the business establishment community. As such, the author has often felt conflicted,
especially when the city has engaged in punitive measures to enforce local ordinances. In
the context of experiences, the author’s affiliation with the city and the local Chamber of
Commerce could have been a source of bias; however, the author avoided actions that
could have influenced the disposition of the respondents. In addition, the author only
extended invitations to respondents with whom he had no personal affiliation.
Further steps to promote trustworthiness included: (a) administering a pilot survey
to colleagues to ensure the validity of the instrument, (b) soliciting feedback from the
author’s dissertation chair and the Argosy University Institutional Review Board (IRB)
approval process, (c) conducting private interviews in the respondents’ natural
environments where they experienced the phenomenon under discussion, (d) providing
respondents with Informed Consent Forms to ensure they were informed about the
researcher’s intent and their rights (e.g., privacy, confidentiality, anonymity, voluntary
participation, etc.) prior to interviews, and (e) seeking feedback for research findings
from peers to ensure information was accurate and complete (Creswell, 2009; Key, 1997;
Morgan, 1997).
Methodological Assumptions
In the context of the interview process, the author concluded the semi-structured
interview process offered the following advantages:
direct contact with qualified individuals can lead to specific and constructive
suggestions;
often serves as a good source of gathering detailed information; and

85
fewer participants are required to gather rich and detailed data (Thomas,
2010).
Data Processing and Analysis
Recognizing this process as an exploratory form of research, the author engaged
in inductive data analysis, which is essential for identifying patterns, categories, and
themes. Working from the bottom up, the author organized themes in accordance with an
iterative learning process to ensure they were comprehensive and fully reflected the
meanings expressed by one-to-one interview respondents and focus group participants.
Relying on a qualitative codebook developed as a byproduct of MAXQDA’s (qualitative
analysis application) transcription and analysis capabilities, the author developed a
complete and complex picture of the research problem (Creswell, 2009).
Limitations
Advocates of qualitative research methods stipulate reality does not exist within a
vacuum and can be influenced by numerous factors (e.g., culture, gender, cultural beliefs,
etc.). In addition, researchers who rely on qualitative research methods recognize the
complex relationships that exist between individual behavior, attitudes, external
structures, socio-cultural issues, and phenomena. In addition, qualitative research
methods findings can exhibit richness in detail, support holistic analysis, increase the
validity and depth of descriptions, promote open-ended inquiry, and support the
discovery of underlying values, beliefs, and assumptions (Al-Hamdan & Anthony, 2010;
Crossan, 2003; Johnson & Onwuegbuzie, 2004; Kelle, 2006; Yauch & Steudel, 2003).
Likewise, Kelle (2006) contended the growing complexity and heterogeneity of modern
society has made it increasingly difficult to apply quantitative research methods. Despite
86
these advantages, criticisms and disadvantages persist. Criticisms and weaknesses of
qualitative research methods include:
can be unduly influenced by the proximity of the researcher to the
investigation;
regarded as a collection of anecdotal and personal impressions and strongly
subject to researcher bias;
lacks reproducibility, which could lead to radically different conclusions;
lacks generalizability;
process is time consuming; and
important issues could be overlooked; observations and results depend on
interpretations of subjects (omitted variable bias) and participants have more
control over the process (Al-Hamdan & Anthony, 2010; Crossan, 2003; Kelle,
2006; Munck, 1998; Yauch & Steudel, 2003).
In the context of the limitations associated with this research study, the author
recognized there were cost and time constraints. As such, the author endeavored to
complete all one-to-one interviews and a focus group within 2 months of receiving
Argosy University IRB approval to proceed.
Delimitations
In the context of delimitations, the author restricted the sample selection to
owners and managers of business firms that officially operate within the city boundaries
of St. Petersburg. The author concluded the participants included in this sample group
were likely to possess information relevant to this research study and it was anticipated
the author would attain saturation by the time the last respondent was interviewed.

87
CHAPTER FOUR: DATA ANALYSIS AND RESULTS
One-to-One Interview Participation
The author relied on numerous solicitation methods (e.g., direct mail, email,
telephone, referral, walk-in, etc.) to recruit respondents for one-to-one interviews. In
total, the author solicited 45 candidates and ultimately 10 agreed to participate (22%
response rate). Seven of the 10 respondents were referrals from members of the St.
Petersburg Area Chamber of Commerce. Despite not achieving the goal of 12
respondents, the author concluded the composition of the purposive proportional quota
sample group was sufficiently aligned with the population characteristics of St.
Petersburg business establishments to maximize the potential for saturation while
minimizing the potential for overrepresentation. To achieve the goal of 12 respondents
while maintaining the integrity of the composition of the purposive proportional quota
sample group, the author would have needed to secure the commitment of one
construction and one health care and social assistance business establishment (See
Appendix B).
One-to-one interviews were conducted on dates, at times, and at locations that
were conducive for respondents. Interview location characteristics varied, including
private offices, private residences, and public venues. Following the informed consent
discussion period, all respondents elected to participate fully in one-to-one interviews by
signing the informed consent forms. All one-to-one interviews were recorded digitally
and transcribed into a rich text file format accessible through Microsoft Word. To
facilitate member checking, transcripts were remitted to each respondent. Ultimately,
two respondents made changes to their transcripts to clarify their respective statements.

88
In turn, all transcripts were imported into the MAXQDA application to facilitate coding
and data analysis.
One-to-One Interview Coding
Upon importing transcript documents into the MAXQDA application, the author
established a project file that incorporated a coded index based on stakeholder
perceptions (e.g., uncertainty, intellectual capital, entrepreneurs, government, business
assistance programs, universities, human capital, financial capital, brand promotion, and
economic development planning) that influence entrepreneurism. Following the
establishment of the coded index, the author relied on inductive analysis in conjunction
with an iterative review of the interview transcripts to develop sub codes.
From time to time, the author recognized it was necessary to apply sub code
linkages from questions other than those directly associated the code/sub code hierarchy
due to the interrelated nature of stakeholder perceptions. Working from the ground up,
50 sub codes were developed and aligned with index codes associated with the 10 one-to-
one interview questions. In terms of the frequency of responses in accordance with the
50 sub codes, the author coded and categorized 194 individual respondent statements
(See Appendix F). Ultimately, the author relied on the MAXQDA Code Relations
Browser and MAXMap co-occurrence analysis features to demonstrate where sub codes
intersected and exhibited relationships, providing the mechanism for identifying patterns,
categories, and themes.

89
One-to-One Interview Data Analysis and Results
Frequency Analysis
Uncertainty. In the context of uncertainty, the author determined eight of 10
respondents felt the St. Petersburg local business climate was favorable and three of 10
respondents had observed increased risk taking among their peers. To provide clarity,
one respondent stipulated the mindset among business owners had changed and it was her
belief that people had grown weary of the media’s negative outlook on the economy and
had come to the realization that conditions were not as bad as they has been led to
believe. In essence, business leaders had taken the initiative to escape the paralysis
described by the respondent as a duck and cover mentality. One respondent stipulated
lower unemployment was contributing to favorable economic conditions. Conversely,
two respondents expressed concern that the local business climate remained fragile and
vulnerable. Ultimately, three of 10 respondents stipulated businesses that make
connections with other stakeholders have an influence in local affairs. Such efforts can
be perceived as a mechanism for mitigating risk and uncertainty through the formation of
alliances that promote informed decision-making (See Appendix F).
Intellectual capital. The emphasis on intellectual capital overwhelmingly
revealed most respondents (nine of 10) recognized Downtown St. Petersburg served as
the foundation of the city’s economic activity. In addition, five respondents contended
the downtown area’s quality-of-life (e.g., amenities, beaches, community and national
events, downtown nightlife, festivals, livability, restaurants, weather, etc.) served as a
major selling point for attracting visitors and would-be residents and businesses.
Likewise, four respondents attributed the city’s culture (e.g., exhibits, galleries,

90
museums, theaters for performing arts, etc.) to this phenomenon. Taken together,
downtown was recognized as the epicenter for promoting the city’s quality-of-life and
culture value proposition. In fact, one respondent stipulated the downtown area
demonstrated its viability by describing it as an ideal setting for living, working, and
playing.
In the context of the characteristics of intellectual capital, one respondent
recognized there were few large-scale employers throughout the city (with the exception
of hospitals and universities). In addition, two respondents described the downtown area
as an agglomeration of small- and medium-sized businesses. One respondent attributed
this phenomenon to office space constraints in the downtown area. Likewise, two
respondents stipulated decreased demand had promoted more reasonable rates for cost of
space, improving the competitiveness of the downtown area as the city’s center for
economic and cultural activity. Despite overwhelmingly favorable perceptions, two
respondents expressed concern over tax incentives provided to certain business
establishments, calling into question the efficacy of this practice. Finally, one respondent
expressed concern over the transience of business establishments along the Central
Avenue business corridor (See Appendix F).
Entrepreneurs. In the context of entrepreneurs, nine of 10 respondents
concluded the local community was supportive. To provide greater clarity, eight of 10
respondents concluded grass roots support from fellow business owners was strong. In
fact, one respondent credited such support for her financial success. Another respondent
stipulated it was not uncommon for new businesses to be welcomed to the area, even by
their direct competition. This same respondent clarified this position by stipulating

91
business stakeholders have come to realize strong grass roots support is the most
effective strategy for promoting the economic and social viability of an area and for
minimizing information asymmetries. Conversely, one respondent, acknowledging the
importance of grass roots support, stipulated that most of her business derived from
outside the local market and the only reason she operated within the city was to take
advantage of the area’s quality-of-life value proposition. In essence, this business owner
voluntarily elected not to pursue positions of influence among local stakeholders because
doing so offered few benefits and could be counterproductive to her business interests
(See Appendix F).
Government. In the context of government, five of 10 respondents stipulated the
administration was business friendly. To provide clarity, four of those respondents
indicated the administration was approachable if the business owner took the initiative to
reach out. In fact, one respondent emphasized the contributions of the current and former
city mayors. Former Mayor Rick Baker, in particular, was recognized for his efforts in
supporting the arts (e.g., the Dali Museum, etc.) and facilitating economic growth by
hosting and organizing local and national events (e.g., Honda Grand Prix of St.
Petersburg, etc.) that brought the city international acclaim. Conversely, four of 10
respondents contended they believed the local government was controlled by special
interests. Likewise, three of those four respondents indicated they had not experienced
the direct impact from government activity. In addition, two of those respondents
indicated they considered the local government to be a hindrance due to the assertive
nature of parking enforcement in the downtown area. Additional points of concern
expressed by individual respondents included the local municipal government’s: (a)
92
inability to communicate, (b) lack of a regional perspective, (c) inability to manage its
transportation infrastructure, and (d) lack of visibility in supporting cultural endeavors
(See Appendix F).
Business assistance programs. In the context of business assistance programs,
five of 10 respondents reported they had no knowledge of city business assistance
programs. Similarly, two additional respondents indicated they had knowledge of
business assistance programs but voluntarily chose not to utilize such services. When the
author inquired as to why they made this election, both respondents indicated their
organizations had sufficient embedded organic experience and had no need for external
assistance. Conversely, three respondents reported they had utilized the services
provided by city and Chamber business assistance programs and one respondent
preferred the services offered by WorkNet Pinellas (Pinellas County). One respondent, in
an effort to promote clarity, contended that city and Chamber business assistance
programs provided essential access to intellectual capital in the form of training programs
and mentoring. In addition, this respondent indicated business assistance programs
supported networking efforts and ultimately helped promote ongoing business
relationships and business expansion. In the context of a recommendation, the same
respondent recommended business assistance programs reevaluate their curriculum to
make delineations along particular business classifications (e.g., professional, retail, etc.)
to improve program efficiency and impact. Ultimately, only one respondent was critical
of the Chamber’s business assistance programs, stipulating some guidance that was
provided in the past was poor (See Appendix F).

93
Universities. In the context of universities, nine of 10 respondents indicated
institutions of higher learning served as an important resource for supporting the
formation of human capital. Likewise, two respondents contended universities were
essential for supporting innovation. Despite overwhelming support for universities, two
respondents indicated they should initiate efforts to improve their partnerships with the
business community. In an effort to clarify this position, one respondent stipulated
universities should consult with the business community to develop curriculum with
greater relevance in order to address soft skills (e.g., teamwork, communication, etc.)
deficiencies observed among recent graduates. Ultimately, only one respondent indicated
he did not detect the efforts of universities in the St. Petersburg area (See Appendix F).
Human capital. To segue from an emphasis on universities to human capital,
three respondents reported employees and candidates for employment often lacked soft
skills. In addition, two respondents contended candidates for employment also lacked
essential information technology and quantitative analysis skills. To illustrate the
seriousness of such concerns, five of 10 respondents stipulated there was an inherent
shortage of qualified employment candidates in the city. Despite such concerns, seven of
10 respondents reported there was a sufficient number of qualified employment
candidates in the Tampa Bay market area. In essence, despite concerns over the
availability of qualified human capital residing in St. Petersburg, respondents as
employers reported they had no difficulty pursing talent in the larger marketplace. In
fact, two respondents acknowledged some local businesses had opened offices in other
markets as a means of pursuing qualified human capital that was not available locally
(See Appendix F).

94
Financial capital. In the context of financial capital, five of 10 respondents
stipulated traditional forms of business financing remained constrained. Despite such
concerns, four of 10 respondents reported access to financial capital was improving. To
provide clarity, two of those respondents attributed this phenomenon to the observed
expansion of local community banks throughout the city. Interestingly, four of 10
respondents (two of whom had indicated financial capital remained constrained)
indicated they had been conservative with on-hand financial capital throughout the
recessionary period, a strategy that better positioned their respective companies to
weather the economic downturn. To clarify their position, those respondents credited
their own experience with past recessions as helping them recognize the importance of
maintaining sufficient reserves of financial capital to mitigate such risks (See Appendix
F).
Brand promotion. In the context of the city government’s brand promotion
efforts, three of 10 respondents contended the administration was effective in promoting
local events. Likewise, two of those three respondents stipulated the administration was
effective in promoting the city’s value proposition outside of the local market.
Furthermore, four of 10 respondents reported they had absolutely no knowledge of the
administration’s brand promotion efforts. After deliberating, however, the same
respondents acknowledged they were not surprised by this development, because in all
likelihood they were not the intended audience and did not expect to be the direct
beneficiary of such efforts (See Appendix F).
In the context of criticism of the city’s brand promotion efforts, seven of 10
respondents contended that establishing a niche in the local marketplace had been a
95
persistent challenge. Likewise, two respondents provided clarity by stipulating the city’s
brand promotion efforts were disingenuous because the administration had not followed
through on its brand promise of fostering an inclusive environment for all stakeholders.
In addition, five of 10 respondents stipulated more resources should be directed to
support brand promotion efforts. One respondent clarified this position by
recommending the administration consider the implications of a chicken/egg conundrum,
which can be described as the “if you build it - will come” ideology. In essence, this
theory stipulates there must first be economic prosperity before it can be promoted
(simultaneity problem). To prove the existence of economic prosperity, the respondent
recommended success stories from prominent business leaders be integrated into
promotion efforts as a method to convey the business case for establishing and growing
businesses in the city. Furthermore, two respondents expressed concern that
homelessness was having an adverse impact on the city’s image. Ultimately, regardless
of perceived brand promotion performance, six of 10 respondents contended the city’s
culture was its greatest advantage in terms of a value proposition (See Appendix F).
Economic development planning. In the context of economic development
planning, seven of 10 respondents contended government and business leaders must
become more adept at emphasizing the importance of living, working, and playing in the
city. To fully develop an effective economic development plan, four of 10 respondents
stipulated the business community needed to fully participate in the process of
developing a viable strategy. To build and sustain a viable local economy, three of 10
respondents indicated an emphasis on attracting individuals who may or may not identify
themselves as members of the creative class would facilitate business start-ups, business

96
expansion, and efforts in establishing a niche in both the local marketplace and region. In
essence, the position of these respondents controverts the simultaneity problem by
emphasizing the importance of attracting a workforce that will provide the engine for
sustainable business growth by attracting fellow members of the creative class and
business interests that are seeking a competitive advantage by increasing human capital
and improving access to sophisticated consumers (See Appendix F).
Co-Occurrence Analysis
Utilizing MAXQDA’s Code Relations Browser and MAXMap capabilities, the
author relied on co-occurrence analysis to identify patterns, categories, and themes. In
the context of patterns, an analysis of the relationships among coded one-to-one interview
responses revealed stakeholder perceptions associated with intellectual capital,
universities, brand promotion, and economic development planning demonstrated
significantly more intersections among several of their respective sub codes than other
perceptions (e.g., uncertainty, entrepreneurs, government, business assistance programs,
human capital, and financial capital). The author relied on the demonstrated occurrence
of two or more sub code intersections to detect interdependencies. In the context of
themes, the author relied on this analysis to determine which stakeholder perceptions
predominately influence entrepreneurism in the City of St. Petersburg.
In the context of co-occurrence analysis, the author determined four stakeholder
perceptions demonstrated more than two intersections among their respective sub codes:
(a) intellectual capital, (b) universities, (c) brand promotion, and (d) economic
development planning. In descending order (based on the aggregate number of
intersections), sub code intersections included:

97
Intellectual Capital/Culture and Brand Promotion/Culture is the City’s
Greatest Advantage (11 intersections)
Intellectual Capital/Culture and Economic Development Planning/Importance
of Living, Working, and Playing in the City (8 intersections)
Intellectual Capital/Quality of Life and Economic Development
Planning/Importance of Living, Working, and Playing in the City (8
intersections)
Intellectual Capital/Ideal Location for Living, Working, and Playing and
Economic Development Planning/Importance of Living, Working, and
Playing in the City (7 intersections)
Intellectual Capital/Ideal Location for Living, Working, and Playing and
Intellectual Capital/Quality of Life (6 intersections)
Intellectual Capital/Ideal Location for Living, Working, and Playing and
Intellectual Capital/Culture (6 intersections)
Brand Promotion/Culture is the City’s Greatest Advantage and Economic
Development Planning/Importance of Living, Working, and Playing in the
City (6 intersections)
Intellectual Capital/Quality of Life and Intellectual Capital/Culture (5
intersections)
Intellectual Capital/Ideal Location for Living, Working, and Playing and
Intellectual Capital/Downtown (3 intersections)
Intellectual Capital/Ideal Location for Living, Working, and Playing and
Universities/Support Formation of Human Capital (3 intersections)

98
Economic Development Planning/Creative Class and Brand
Promotion/Culture is the City’s Greatest Advantage (3 intersections)
Brand Promotion/Establishing a Market Niche has been a Challenge and
Brand Promotion/Culture is the City’s Greatest Advantage (3 intersections)
Intellectual Capital/Ideal Location for Living, Working, and Playing and
Economic Development Planning/Creative Class (2 intersections)
Intellectual Capital/Culture and Universities/Support Formation of Human
Capital (2 intersections)
Intellectual Capital/Culture and Economic Development Planning/Creative
Class (2 intersections)
Intellectual Capital/Downtown and Intellectual Capital/Culture (2
intersections)
Brand Promotion/Establishing a Market Niche has been a Challenge and
Intellectual Capital/Culture (2 intersections)
Brand Promotion/Culture is the City’s Greatest Advantage and Intellectual
Capital/Quality of Life (2 intersections)
Brand Promotion/Culture is the City’s Greatest Advantage and Intellectual
Capital/Ideal Location for Living, Working, and Playing (2 intersections)
Economic Development Planning/Importance of Living, Working, and
Playing in the City and Intellectual Capital/Downtown (2 intersections)
Economic Development Planning/Importance of Living, Working, and
Playing in the City and Brand Promotion/Establishing a Market Niche has
been a Challenge (2 intersections)

99
Economic Development Planning/Importance of Living, Working, and
Playing in the City and Brand Promotion/More Resources for Promotion is
Required (2 intersections; See Appendix G)
In the context of themes, the author posits respondent (i.e., stakeholder)
perceptions of intellectual capital as related to culture were highly interdependent with
brand promotion efforts as related to the recognition that culture is the city’s greatest
advantage and economic development planning as it relates to the importance of living,
working, and playing in the city. In the context of universities and their role in
supporting the formation of human capital, respondents concluded institutions for higher
learning were most effective in supporting intellectual capital as related to making the
city an ideal place to live, work, and play and for their role in attracting and retaining
members of the creative class as related to economic development planning. In addition,
interdependencies were detected between intellectual capital as related to culture,
universities as related to supporting the formation of human capital, brand promotion as
related to the challenges of establishing a market niche, and economic development
planning as related to the creative class (See Appendix G).
Interdependencies were also detected between brand promotion as it related to
culture as the city’s greatest advantage and intellectual capital as related to quality-of-life
and as an ideal location for living, working, and playing (with observed
interdependencies among intellectual capital variables of the ideal location for living,
working, and playing and quality of life, culture, and downtown). Likewise,
interdependencies were detected between economic development planning as related to
the importance of living, working, and playing in the city and intellectual capital as

100
related to downtown, brand promotion as related to the challenges of establishing a
market niche, and brand promotion as related to the need for more resources. Following
the co-occurrence analysis, the author determined the overriding theme was the formation
and maintenance of intellectual capital in both the city and its downtown area maintains
an interdependent relationship with universities, brand promotion, and economic
development planning. Ultimately, the author contends co-occurrence analysis findings
demonstrated business leaders and the local government administration must endeavor to
establish a market niche that emphasizes why the city and the downtown area in
particular is an ideal location to live, work, and play by virtue of its quality-of-life and
culture value proposition. In the context of economic development planning, an
emphasis on the creative class will help community leaders refine the city’s market niche
and effectively support promotion efforts directed at this market segment (See Appendix
G).
Focus Group Participation
After recruiting all 10 one-to-one interview respondents for the focus group
session, three respondents communicated their intent to participate. Ultimately, two of
the three respondents elected to participate by virtue of their attendance at the focus
group session. Neither participant demonstrated familiarity and represented different
industries. In terms of the characteristics of the focus group, the author concluded it
should be classified as a dyad due to its inherent size. Despite the group’s size, the
author proceeded with the focus group discussion. The rationale for this decision was
based on the author’s determination that a lively and uninhibited discussion could be
sustained by these participants by virtue of their respective industry experience, insights,

101
and passion for entrepreneurism (Kiernan, 2011). In effect, the author was confident in
each participant’s ability to make a valuable contribution to this study. As planned, the
focus group session was conducted in a private board room at the St. Petersburg Area
Chamber of Commerce. A catered lunch was provided in advance of the discussion. In
addition, informed consent was administered to each participant and the focus group
session was digitally recorded in its entirety. The author served as the moderator and
used the 10 one-to-one interview questions for the foundation for the agenda. The author,
as the moderator, relied on those questions to lead an open discussion on how stakeholder
perceptions influence entrepreneurism. The focus group session discussion was
completed in 1 hour and 2 minutes. The author transcribed the recording and forwarded
transcripts to each participant to provide them with an opportunity to verify the accuracy
of the record. No transcripts were returned for editing.
Focus Group Coding
Upon importing the focus group session transcript document into the MAXQDA
application, the author repeated the steps relied upon to establish a coded index for the
one-to-one interview transcripts. Building upon that foundation, the author relied on
inductive analysis to develop sub codes that could augment, contradict, and reinforce the
findings derived from one-to-one interviews. Working from the ground up, nine new sub
codes were developed and integrated with predecessors derived from the one-to-one
interviews. In terms of the frequency of responses in accordance with the nine sub codes,
the author coded and categorized 50 individual statements from the two focus group
participants (See Appendix H). Ultimately, the author relied on the MAXQDA Code
Relations Browser and MAXMap feature to demonstrate where sub codes intersected and

102
exhibited relationships (co-occurrence analysis), providing the mechanism for identifying
patterns, categories, and themes.
Focus Group Data Analysis and Results
Frequency Analysis
Uncertainty. Both participants were in agreement that local economic conditions
were favorable. In addition, both participants stipulated increased risk taking among
business establishments was evident. One participant reaffirmed the importance of
businesses making connections to promote their influence in local affairs (See Appendix
H).
In the context of uncertainty, the author concluded focus group participant
responses were largely consistent with those provided by one-to-one interview
respondents. A majority of one-to-one interview respondents and both focus group
participants contended that in the context of uncertainty, the local business climate was
favorable with some evidence of increased risk taking. In addition, both groups (one-to-
one interview respondents and focus group participants) stressed the importance of
making connections in terms of having influence. While neither of the focus group
participants indicated there was any perception of fragility as related to the local business
climate within the context of the first question emphasizing uncertainty, they did express
their concerns during the discussion associated with intellectual capital as related to
economic prosperity outside of the downtown area (See Appendix H).
Intellectual capital. One participant reaffirmed the importance of downtown as a
symbol of economic viability and both participants emphasized the advantage of the
city’s quality-of-life value proposition. Both participants were in agreement as to the

103
importance of culture in the city. To provide more clarity, one respondent reaffirmed the
importance of downtown in terms of it representing an ideal location for living, working,
and playing. One respondent also emphasized the benefits of the downtown area’s
reasonable rates on cost of space, while simultaneously reporting this phenomenon was
largely attributed to lower demand for office space. The respondent stipulated mobility
technologies had enabled employees to work from any location, significantly reducing
the need for conventional office space (See Appendix H).
Interestingly, despite each participant’s operating tenure in the city, neither could
demonstrate any familiarity with economic conditions outside of the downtown area.
One participant, however, after deliberating, indicated he had observed other areas of the
city appeared to be in economic decline. Interestingly, both respondents agreed there was
a need to establish a viable central business corridor to link and then extend the
downtown area’s prosperity to other contiguous areas of the city (See Appendix H).
In the context of intellectual capital, the author concluded focus group participant
responses were largely consistent with those provided by one-to-one interview
respondents. Specifically, perceptions associated with: (a) the downtown area; (b)
quality-of-life; (c) culture; (d) the ideal location for living, working, and playing; and (e)
the reasonableness of the cost of space were consistent. Points of criticism were not
expressed within the context of the second question. This position, however, changed
during the discussion of the local government’s role (Question # 4) when one participant
criticized the administration for not providing sufficient infrastructure to accommodate
local businesses’ parking requirements (See Appendix H).

104
Entrepreneurs. Both participants reaffirmed their position on the importance of
a supportive community in addition to confirming that was an experience they shared.
One participant reaffirmed the position that grass roots support remains strong and
credited both the local government administration and the St. Petersburg Area Chamber
of Commerce for their efforts in facilitating this advantage. In fact, the participant
contended the relationship between the city and the Chamber had been strained in the
past; however, communication had significantly improved in recent months due to the
installment of a new Chief Executive Officer at the Chamber (See Appendix H).
In the context of entrepreneurs, the author concluded focus group participant
responses were largely consistent with those provided by one-to-one interview
respondents. Both groups consistently expressed their perception that the local
community was supportive of entrepreneurs and grass roots support among businesses
was strong (See Appendix H).
Government. Both participants reaffirmed their position that the local
government administration was business friendly. One participant reinforced the position
that government leadership is accessible if an individual or business took the initiative to
reach out for assistance. Elaborating on the parking challenges in the downtown area,
one participant stipulated insufficient parking capacity for local businesses was a source
of dissatisfaction. The other participant appeared surprised by this response. Ultimately,
the discussion revealed there were segments of the downtown area business community
that were underserved in terms of parking capacity (See Appendix H).
In the context of government, the author concluded focus group participant
responses were fairly consistent with those provided by one-to-one interview
105
respondents. Specifically, half of the one-to-one interview respondents felt the
government administration was business friendly, while both focus group participants
were in agreement with this perception. In the context of government leadership
accessibility, four of 10 one-to-one interview respondents and one of the two focus group
participants had offered praise. In the context of special interest influence, however, four
of 10 one-to-one interview respondents and none of the focus group participants
expressed concern (See Appendix H).
Business assistance programs. Both participants were in agreement that
business assistance programs served as a viable mechanism for providing stakeholders
access to intellectual capital. One participant elaborated by contending business
assistance programs were useful for networking, establishing and sustaining
relationships, and supporting efforts to engage in business expansion by leveraging
connections (See Appendix H).
In the context of business assistance programs, the author concluded focus group
participant responses were fairly consistent with those provided by one-to-one interview
respondents who had actually utilized the services or had some indirect knowledge of the
benefits of such resources. Specifically, one of three one-to-one interview respondents
who made use of services provided by city business assistance programs and both focus
group participants recognized that such resources could provide access to intellectual
capital. Likewise, one one-to-one interview respondent and one focus group participant
reaffirmed business assistance programs were useful for networking, relationships, and
business expansion (See Appendix H).

106
Universities. Both participants reaffirmed their position that universities
effectively supported the formation of human capital. In addition, one participant
reaffirmed the position that universities support innovation. Likewise, both respondents
were in agreement that today’s students are more driven than in the past. This was a
noteworthy development, as one of the participants had been more critical of students and
recent graduates during the one-to-one interview session (See Appendix H).
In the context of universities, the author concluded focus group participant
responses were largely consistent with those provided by one-to-one interview
respondents. Specifically, nine of 10 one-to-one interview respondents and both focus
group participants concluded that universities served as a valuable resource for the
formation of human capital. Likewise, three of 10 one-to-one interview respondents and
one of the focus group participants acknowledged that universities served an important
role in supporting innovation (See Appendix H).
Human capital. To segue from the discussion on universities as the source of
human capital and innovation, both participants were in agreement that quality was
improving. Ultimately, universities were credited for this development (See Appendix
H).
In the context of human capital, the author concluded focus group participant
responses were not entirely consistent with those provided by one-to-one interview
respondents. One of the two focus group participants reversed her position, indicating
the quality of human capital had improved in recent months and attributed this
development to the actions of local universities (See Appendix H).

107
Financial capital. One focus group participant reaffirmed the position that
access to financial capital was improving by stipulating the expansion of local
community banks served as evidence of this phenomenon. Neither participant could
validate whether lending conditions had improved. In fact, both participants contended
they were conservative with on-hand financial capital and had no need to pursue
financing. There was, however, no evidence that financial capital had been constrained
as both participants had retained access to lines of credit (See Appendix H).
In the context of financial capital, the author concluded focus group participant
responses were fairly consistent with those provided by one-to-one interview
respondents. Specifically, one of the focus group participants and four of the 10 one-to-
one interview respondents concluded access to financial capital was improving.
Conversely, neither of the focus group participants acknowledged access to financial
capital remained constrained, albeit both had stipulated they were conservative with on-
hand capital and had no need for external financing. In that regard, if comparing group
responses along the lines of those who indicated they were conservative with on-hand
financial capital, greater consistency among responses was detected (See Appendix H).
Brand promotion. One focus group participant stipulated the local government
administration was effective in promoting local events in the downtown area. In
addition, both participants acknowledged the local government administration was
effective in promoting the city outside of the market as evidenced by observed
attendance, especially visitors who hail from other regions of the continental United
States and foreign shores. Furthermore, both respondents were in agreement that culture
is the city’s greatest advantage and city leaders should endear themselves to exploit that

108
advantage. In fact, both participants concluded business and local government leaders
should collaborate to overcome the ongoing challenge in establishing a market niche for
the city. Both participants concluded the city’s value proposition, as directed to those
aspiring to establish a business, should include efforts to promote the city as a business
friendly community (See Appendix H).
In the context of brand promotion, the author concluded focus group participant
responses were somewhat consistent with those provided by one-to-one interview
respondents. Specifically, one focus group participant acknowledged the local
government was effective in promoting events, which was consistent with the three one-
to-one interview respondents who expressed the same position. Both focus group
participants reaffirmed their position on the government’s effectiveness in promoting
outside of the city. Neither of the focus group participants were critical of the
government’s performance in this area; however, they did recommend the local
government administration should consider emphasizing the friendliness of the local
business community in conjunction with the city’s cultural advantages. In the context of
culture as the city’s greatest advantage, both focus group participants and six of 10 one-
to-one interview respondents were consistent in their perceptions (See Appendix H).
Economic development planning. In the context of economic development
planning, both participants reaffirmed their position that the business community needs to
participate in the process. In fact, one focus group participant elaborated by stipulating
economic development planning should emphasize the importance of attracting and
retaining individuals and sub cultures that identify themselves as part of the creative class
(See Appendix H).

109
In the context of economic development planning, the author concluded focus
group participant responses were fairly consistent with those provided by one-to-one
interview respondents. Specifically, while focus group participants did not directly
express the importance of living, working, and playing in the city, one participant
reaffirmed the importance of the creative class by indirectly implying this market
segment values those dimensions as it relates to culture as a value proposition. In the
context of business community participation, both focus group participants acknowledged
its importance, while four of 10 one-to-one interview participants shared this perception
(See Appendix H).
Co-Occurrence Analysis
Utilizing MAXQDA’s Code Relations Browser and MAXMap, the author
conducted co-occurrence analysis of the focus group transcript to identify patterns,
categories, and themes. In the context of patterns, an analysis of the relationships among
coded focus group session responses demonstrated interdependencies among stakeholder
perceptions associated with entrepreneurs and business assistance programs. The author
relied on the demonstrated occurrence of two or more sub code intersections in an effort
to detect interdependencies. In the context of themes, the author relied on this analysis to
determine which stakeholder perceptions predominately influence entrepreneurism in the
City of St. Petersburg and to support triangulation of data sources.
Relying on the criteria that required a minimum of two intersections among sub
codes, the author determined entrepreneurs as related to grass roots support as a source of
strength had two intersections with business assistance programs as related to its

110
usefulness for networking, and relationships had two intersections with business
expansion related to access to intellectual capital (See Appendix I).
In the context of themes, the focus group discussion added clarity on the
importance of grass roots support among businesses and how such relationships can be
forged and then enhanced by participation in business assistance programs. In fact, the
co-occurrence analysis demonstrated business assistance programs can serve as a useful
instrument for networking, building relationships, and leveraging those connections to
engage in business expansion. In addition, the co-occurrence analysis demonstrated
business assistance programs can serve as an access point to leverage the underlying
knowledge and experience of the business community (See Appendix I).
Recent Local Econometric Trends and Research Results
After evaluating one-to-one interview respondent and focus group participant
statements, the author concluded there was some discontinuity between stakeholder
perceptions and the City of St. Petersburg’s (2012a) local econometric performance
indicators. For example, eight of 10 one-to-one interview respondents and both focus
group participants contended the local business climate was favorable. Conversely, from
2007 to 2012, downtown area office vacancy rates increased 15.1%, Gateway area and
Mid-Pinellas Industrial and Flex Space vacancy rates increased 74.5%, and business tax
receipts paid declined 8.2%. In an effort to resolve the discontinuity, the author
considered the possibility of recency bias. In turn, the author reviewed the short-term
annual trends among these metrics and determined that from 2011 to 2012, downtown
area office vacancy rates had declined 18.5%, Gateway area and Mid-Pinellas Industrial

111
and Flex Space vacancy rates had declined 13.5%, and business tax receipts paid
increased 5.4%.
Considering these findings, the author concluded it was more likely the one-to-
one interview respondents and focus group participants were relying on short-term
observations for their sense of optimism. In the context of focus group participant
perceptions of other areas of the city that were alleged to be in decline, the short-term
(i.e., 2011-2012) statistical trend indicated Gateway area office vacancy rates had
increased 4.7% (12.8% in 2011 to 13.4% in 2012). This finding demonstrated the
continuation of the 2007 to 2012 trend that revealed the 8.1% increase in Gateway area
office vacancy rates (City of St. Petersburg, 2012a). Ultimately, focus group participant
concerns over the economic performance of areas outside of downtown appeared to be
justified.

112
CHAPTER FIVE: DISCUSSION, CONCLUSIONS, AND RECOMMENDATIONS
Discussion
This chapter is intended to compare and contrast the author’s primary research
findings with the body of literature supporting this research study for the purpose of
developing a valid response to the research question and satisfying research goals. As
expressed in Chapter 2, the author assessed how stakeholder perceptions associated with
(a) uncertainty, (b) intellectual capital, (c) entrepreneurs, (d) government, (e) business
assistance programs, (f) universities, (g) human capital, (h) financial capital, (i) brand
promotion, and (j) economic development planning influence entrepreneurism in St.
Petersburg, Florida.
Uncertainty
While the majority of one-to-one interview respondents and both focus group
participants (i.e., stakeholders) expressed favorable perceptions of the local business
climate, they also demonstrated their understanding of the importance of minimizing
information asymmetries. To achieve that end, several stakeholders stipulated making
connections and forming alliances with influential community stakeholders can help
mitigate risk and ultimately promote informed decision-making. In addition, the author
found the perceptions of these stakeholders were consistent with results of previous
studies. Koetse et al. (2006) indicated the availability of information (e.g., financial
expertise) and resources could enable firms to seize upon opportunities to hedge against
risk and uncertainty. Likewise, Liao and Gartner (2006) stressed the importance of
business planning in the early stages of firm formation as a means of preserving viability.
Despite the fact that Koetse et al. was emphasizing the advantages of large firms, the
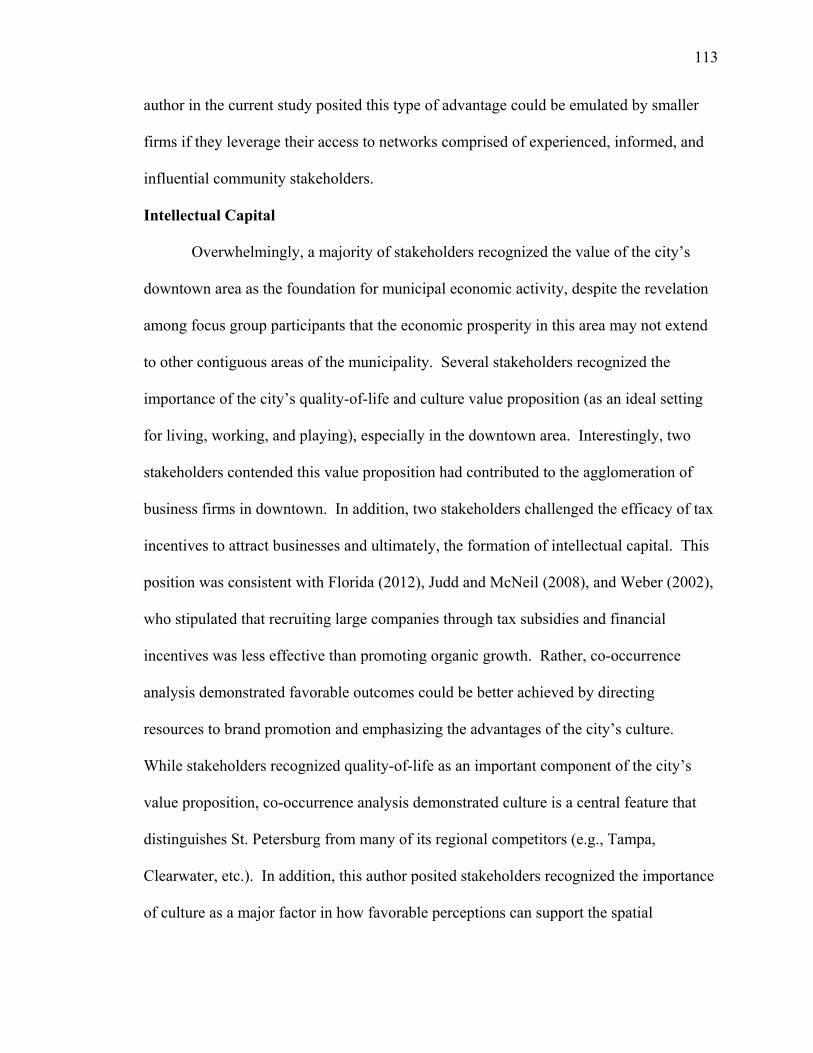
113
author in the current study posited this type of advantage could be emulated by smaller
firms if they leverage their access to networks comprised of experienced, informed, and
influential community stakeholders.
Intellectual Capital
Overwhelmingly, a majority of stakeholders recognized the value of the city’s
downtown area as the foundation for municipal economic activity, despite the revelation
among focus group participants that the economic prosperity in this area may not extend
to other contiguous areas of the municipality. Several stakeholders recognized the
importance of the city’s quality-of-life and culture value proposition (as an ideal setting
for living, working, and playing), especially in the downtown area. Interestingly, two
stakeholders contended this value proposition had contributed to the agglomeration of
business firms in downtown. In addition, two stakeholders challenged the efficacy of tax
incentives to attract businesses and ultimately, the formation of intellectual capital. This
position was consistent with Florida (2012), Judd and McNeil (2008), and Weber (2002),
who stipulated that recruiting large companies through tax subsidies and financial
incentives was less effective than promoting organic growth. Rather, co-occurrence
analysis demonstrated favorable outcomes could be better achieved by directing
resources to brand promotion and emphasizing the advantages of the city’s culture.
While stakeholders recognized quality-of-life as an important component of the city’s
value proposition, co-occurrence analysis demonstrated culture is a central feature that
distinguishes St. Petersburg from many of its regional competitors (e.g., Tampa,
Clearwater, etc.). In addition, this author posited stakeholders recognized the importance
of culture as a major factor in how favorable perceptions can support the spatial

114
agglomeration of creative individuals, businesses, and associated knowledge spillovers
that promote economic growth and by extension inhibit uncertainty through reduced
innovation costs and higher productivity (Doring et al., 2010; Firestone, 2010).
Entrepreneurs
The majority of stakeholders recognized the importance of a supportive
community and emphasized the roles of influential community stakeholders (e.g.,
government, the Chamber, business firms, etc.) in promoting economic growth.
Interestingly, the majority of stakeholders credited grass roots support for much of the
progress in fostering economic prosperity. This author posited these findings were
consistent with those expressed in the literature by Audretsch and Keilbach (2005),
Corman et al. (1996), Falcone and Wilson (2008), Florida (2012), Gupta and York
(2008), Lerner (2010), Renski (2009), and Yusuf (2010), who contended a culture of
support is essential for attracting and anchoring entrepreneurial firms. Likewise, Florida
(2012) and Smedlund (2006) reinforced this position by emphasizing the importance of
promoting interconnected networks through the collaboration of regionally embedded
institutions (e.g., governments, Chambers of Commerce, etc.) and their role in:
serving as intermediaries in the transfer of knowledge among community
stakeholders;
promoting stimuli from a broad array of social, cultural and economic
institutions; and
attracting financial and creative human capital.
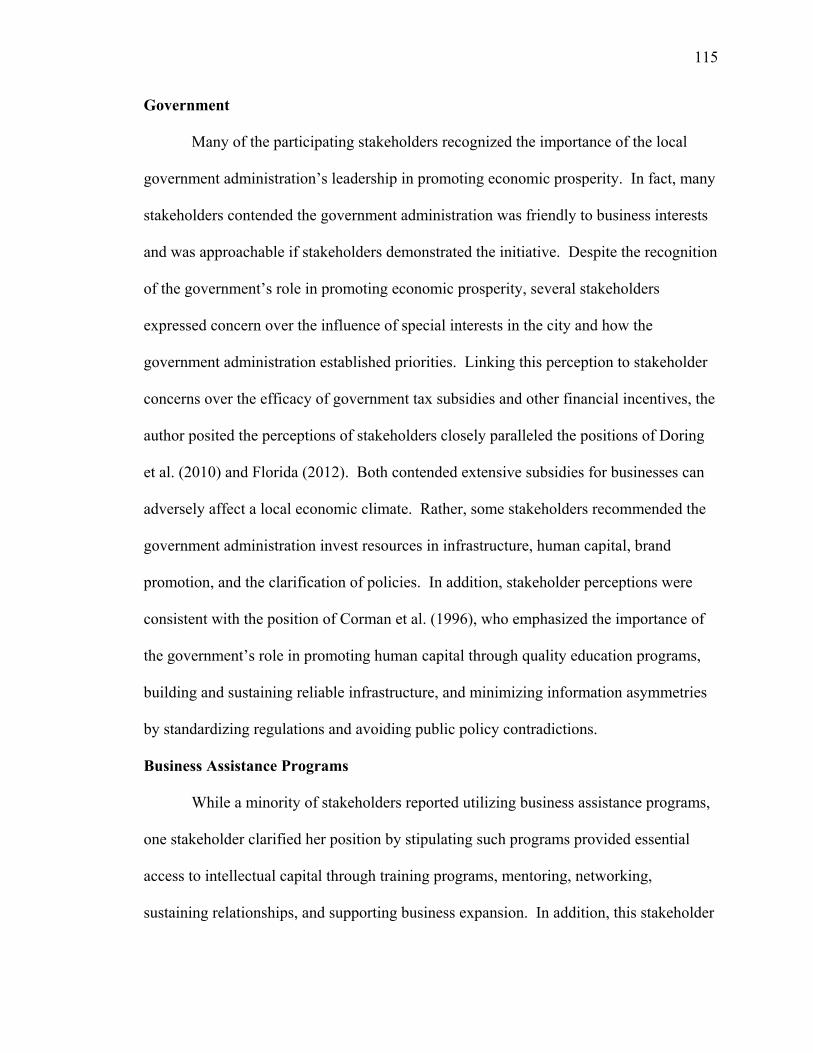
115
Government
Many of the participating stakeholders recognized the importance of the local
government administration’s leadership in promoting economic prosperity. In fact, many
stakeholders contended the government administration was friendly to business interests
and was approachable if stakeholders demonstrated the initiative. Despite the recognition
of the government’s role in promoting economic prosperity, several stakeholders
expressed concern over the influence of special interests in the city and how the
government administration established priorities. Linking this perception to stakeholder
concerns over the efficacy of government tax subsidies and other financial incentives, the
author posited the perceptions of stakeholders closely paralleled the positions of Doring
et al. (2010) and Florida (2012). Both contended extensive subsidies for businesses can
adversely affect a local economic climate. Rather, some stakeholders recommended the
government administration invest resources in infrastructure, human capital, brand
promotion, and the clarification of policies. In addition, stakeholder perceptions were
consistent with the position of Corman et al. (1996), who emphasized the importance of
the government’s role in promoting human capital through quality education programs,
building and sustaining reliable infrastructure, and minimizing information asymmetries
by standardizing regulations and avoiding public policy contradictions.
Business Assistance Programs
While a minority of stakeholders reported utilizing business assistance programs,
one stakeholder clarified her position by stipulating such programs provided essential
access to intellectual capital through training programs, mentoring, networking,
sustaining relationships, and supporting business expansion. In addition, this stakeholder

116
credited her success to the access provided by business assistance programs to intellectual
capital. Ultimately, the author found this stakeholder’s perceptions were consistent with
the findings of Lussier (1995), Lussier and Pfeifer (2001), and Lussier and Halabi (2008),
who stipulated that education, staffing, professional advice, and planning were predictors
of business success (e.g., greater access to capital, superior capital management, more
partnerships and more hiring). As a point of criticism, two stakeholders expressed
concern over the efficacy of such programs, calling into question whether such programs
adequately assess the capabilities and needs of entrepreneurs in conjunction with the
expertise of advisors and mentors. This finding was consistent with the position of Yusuf
(2010), who stipulated business assistance programs were often poorly aligned with
entrepreneurs’ latent and expressed needs.
Universities
An overwhelming majority of stakeholders demonstrated institutions for higher
learning served as an important resource for supporting the formation of human capital,
while a minority of stakeholders expressed the conviction they were essential for
innovation. To improve their standing in the local community, several stakeholders
recommended universities engage the business community in partnerships for the
development of academic programs that promote human capital by addressing soft skills
essential to workplace success. In addition, Huffman and Quigley’s (2002) research
findings were consistent with perceptions described by participating stakeholders.
Specifically, Huffman and Quigley contended universities should play a major role in the
formation of human capital while stimulating talented entrepreneurs. Likewise, Florida
(2012) stipulated universities must fulfill three interrelated roles that emphasize: (a)

117
technology innovation, (b) the pooling of talented creative individuals and business firms,
and (c) fostering a tolerant and progressive agenda to promote diversity. Ultimately,
Florida’s (2012) and Huffman and Quigley’s (2002) research revealed universities can
serve as business incubators by providing access to office space, equipment, guidance,
financial capital, and knowledge.
Human Capital
Several stakeholders conveyed their concern the city had a shortage of qualified
employment candidates. Nonetheless, a majority of stakeholders stipulated qualified
employment candidates could be recruited from other areas in the region. In addition,
two stakeholders reported some local businesses had opened offices in other markets as a
means of pursuing qualified human capital. These findings demonstrate businesses
recognize the importance of a highly-qualified workforce. The author posits the
perceptions of these stakeholders were consistent with the findings of Doring et al.
(2010), who contended municipalities or regions with an ample supply of highly
specialized human capital were more likely to attract innovative networks. In addition,
Doring et al. stipulated the availability of skilled labor is the most important
consideration for influencing decisions associated with business site selection.
In the context of recruiting and retaining talented human capital, several
stakeholders expressed the importance of universities and their role in the formation of
creative human capital. The author posited these stakeholder perceptions were consistent
with the literature. For example, R. Baker’s (2011) position that quality-of-life serves as
a powerful employee recruitment and retention tool in both direct and indirect ways was
consistent with stakeholder perceptions. Likewise, Florida’s (2012) position on creative

118
capital was mirrored by a stakeholder who indicated there were business firms that would
go to extraordinary lengths (e.g., opening offices in other markets, etc.) to secure access
to the human capital they needed to remain competitive.
Financial Capital
In the context of financial capital, half of the stakeholders indicated access
remained constrained even as conditions appeared to be improving. Four stakeholders
indicated conservative handling of financial resources during the economic downturn had
enabled their businesses to weather adversity. One respondent clarified his position by
revealing he had relied on experience with prior recessions to develop a strategic
response. Specifically, this stakeholder’s business firm elected to maintain reserves of
financial capital to mitigate foreseen and unforeseen risks. In the context of the literature,
these findings were consistent with the positions of Elston and Audretsch (2011) and
Kobeissi (2009), who contended that sufficient access to capital was an essential element
to new business formation, expansion, and firm survival. In addition, stakeholder
perceptions associated with new local bank openings appear to buttress the position that
access to financial capital had improved in recent months. Similarly, Kobeissi contended
the prevalence of local banking institutions is of great importance because it enables
financial institutions to gain a better understanding of the operating environments and
prospects of new businesses, helping these stakeholders minimize information
asymmetries. In turn, Kobeissi’s research revealed there is a significant relationship
between loans, bank deposits, per capita income and market size, and the number of
business start-ups.

119
Brand Promotion
Three of the 10 stakeholders disclosed a favorable opinion of the government
administration’s brand promotion efforts, while seven reported establishing a niche in the
local marketplace had been a persistent challenge. Likewise, additional concerns were
raised about inclusiveness and whether the government administration was allocating
sufficient resources to support brand promotion initiatives that effectively conveyed the
business case for establishing and growing businesses in the city. In addition, a majority
of stakeholders contended the city’s culture was its greatest advantage, distinguishing it
from other regional competitors. In context of business support, stakeholders clarified
their position by emphasizing the friendliness of the local business community. Taken
together, culture and the friendliness of the city appeared to provide the foundation for a
market niche. Two stakeholders did express their satisfaction with the government
administration’s efforts in promoting local and national events in the downtown area as
evidenced by what appeared to stakeholders as the increased attendance of individuals
from other regions and foreign shores. To preserve its reputational capital, however, two
stakeholders contended the government administration must confront homelessness and
its adverse impact on the city’s image.
In the context of the supporting literature, the author concluded stakeholder
perceptions were consistent with the research findings of Sneed et al. (2011), who
suggested positioning, image, and business mix are significant, positive predictors of
patronage in downtown communities. Likewise, Judd and McNeil’s (2008) position that
the redevelopment of downtown areas contributes to job creation, incubation of small
businesses, reduction of sprawl, favorable property values, and increased options for
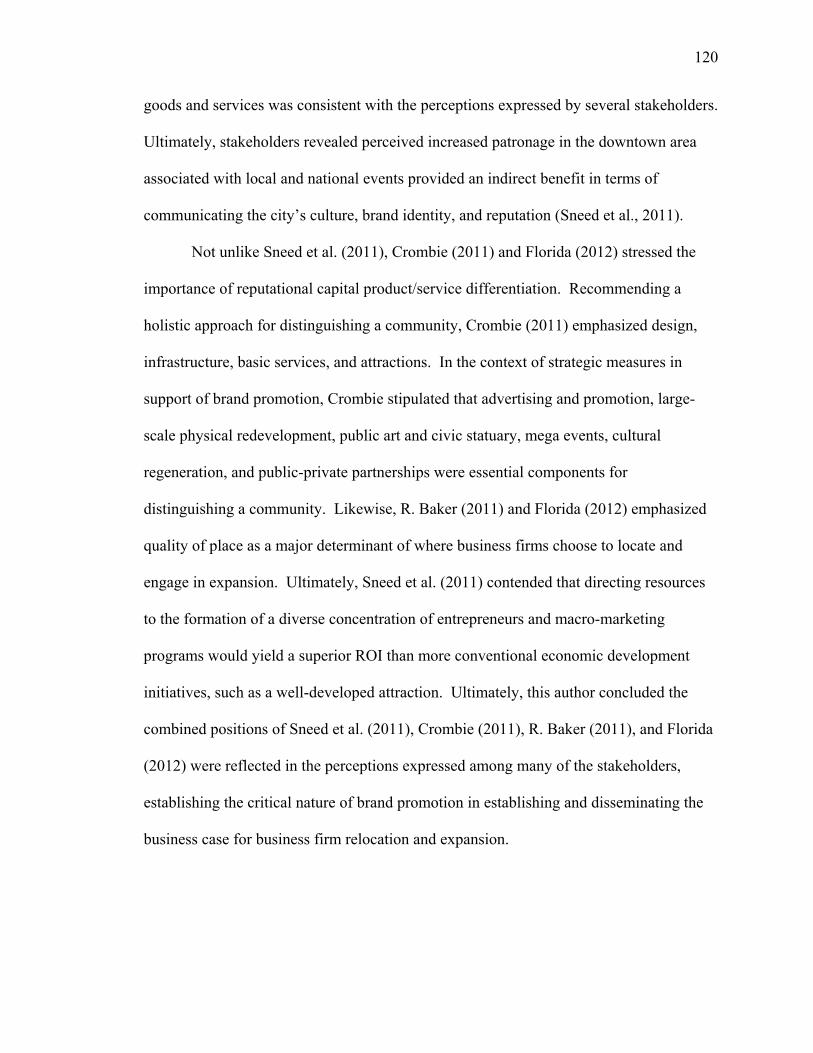
120
goods and services was consistent with the perceptions expressed by several stakeholders.
Ultimately, stakeholders revealed perceived increased patronage in the downtown area
associated with local and national events provided an indirect benefit in terms of
communicating the city’s culture, brand identity, and reputation (Sneed et al., 2011).
Not unlike Sneed et al. (2011), Crombie (2011) and Florida (2012) stressed the
importance of reputational capital product/service differentiation. Recommending a
holistic approach for distinguishing a community, Crombie (2011) emphasized design,
infrastructure, basic services, and attractions. In the context of strategic measures in
support of brand promotion, Crombie stipulated that advertising and promotion, large-
scale physical redevelopment, public art and civic statuary, mega events, cultural
regeneration, and public-private partnerships were essential components for
distinguishing a community. Likewise, R. Baker (2011) and Florida (2012) emphasized
quality of place as a major determinant of where business firms choose to locate and
engage in expansion. Ultimately, Sneed et al. (2011) contended that directing resources
to the formation of a diverse concentration of entrepreneurs and macro-marketing
programs would yield a superior ROI than more conventional economic development
initiatives, such as a well-developed attraction. Ultimately, this author concluded the
combined positions of Sneed et al. (2011), Crombie (2011), R. Baker (2011), and Florida
(2012) were reflected in the perceptions expressed among many of the stakeholders,
establishing the critical nature of brand promotion in establishing and disseminating the
business case for business firm relocation and expansion.

121
Economic Development Planning
A majority of stakeholders contended that influential community leaders
(government and business) must become more adept at emphasizing the importance of
living, working, and playing in the downtown area and throughout the city. Furthermore,
several stakeholders recommended an inclusive approach in developing a viable
economic development strategy. In particular, stakeholders stipulated that establishing a
market niche could be predicated on attracting members of the creative class. In essence,
attracting members of the creative class could help promote sustainable business growth
by increasing human capital and improving access to a greater number of affluent and
sophisticated consumers.
In the context of the literature, the author found the perceptions of stakeholders
were largely consistent with Corman et al. (1996), Florida (2002), and Judd and McNeil
(2008). Corman et al. noted community stakeholders must recognize the importance of
the business climate as it relates to quality-of-life perceptions and indicated those
perceptions can impact decisions associated with business relocation, workforce
composition and size, and whether to expand or contract operations. In addition, Judd
and McNeil posited communities with a higher perceived quality-of-life possess a
distinctive binding effect among creative individuals. Florida (2002) provided further
clarity by stipulating economic growth was contingent upon a community’s ability to
attract members of the creative class. In turn, attracting sufficient numbers of the creative
class can help stakeholders translate a market niche advantage into favorable economic
outcomes (e.g., higher human capital, superior economic growth, higher level of quality
of place, etc.). In addition, R. Baker (2011), Florida (2012), and Markusen et al. (2013)

122
emphasized the importance of location choices associated with quality of place as it
relates to lifestyle interests. Again, the author posits the perceptions of stakeholders were
consistent in the context of the broader interdependencies exhibited between intellectual
capital (e.g., culture, quality-of-life, downtown, etc.) and economic development
planning (e.g., importance of living, working, and playing in the city and the creative
class).
In the context of the government’s role in economic development planning, half
of the stakeholders recognized the positive aspects of the administration’s relationship
with the business community, while several others expressed concern over special
interest influence in public affairs. Despite these findings, three stakeholders stipulated
they had not personally experienced the direct impact from government activity. With
the exclusion of concerns associated with the assertive nature of parking enforcement in
the downtown area, several stakeholders inferred the local government administration
was largely passive when considering the implications of leading economic development
initiatives.
In the context of the literature, Renski (2009) and Weber (2002) warned against
economic development strategies that emphasize industrial recruitment due to the
prevalence of adverse outcomes (e.g., shrinking recruitment pools, bidding wars, etc.)
that can diminish the value of a firm’s contribution to economic growth. Specifically,
Weber, demonstrating a low correlation between local incentives and employment
growth, warned that the price of incentives often outweighs the value of the public
benefits generated by targeted firm’s contribution to economic development. Similarly,
Gupta and York’s (2008) research revealed that 60% of the U.S. general public and 75%

123
of business owners had concluded there was an excessive amount of government
intervention in business affairs. In addition, Florida (2012) corroborated these findings
by discrediting tax incentives and recommending an emphasis on improving quality of
place as means of attracting creative human capital and, ultimately, promoting an
integrated creative ecosystem.
Hamilton (2008) warned that community stakeholders would be wise to apply
increased constraints on elected officials and monitoring by independent groups to
protect the integrity of economic development programs. Rather than relying on
subsidies to attract business firms, Bednarzik (2000), Lichtenstein et al. (2004), and Judd
and McNeil (2008) recommended community stakeholders: (a) invest in the education of
skilled individuals and the development of small business firms, (b) encourage
immigration from external communities, (c) provide infrastructure for human and
business development, and (d) foster initiatives that bring public and non-profit sectors
into the entrepreneurial mix. Likewise, Campbell and Rogers (2007), Ho and Wong
(2006), and Judd and McNeil (2008) recommended lower levels of government
intervention in an effort to minimize transaction costs, promote economic freedom, and
stimulate organic growth of local businesses. Ultimately, when considering stakeholder
perceptions of government administration passivity and the recommendations expressed
in the literature, this author posits local government leadership may have deliberately
chosen to minimize direct intervention efforts. As such, the author posits the local
government administration has recognized the value of economic development
partnerships and has summarily elected to assume a supporting role in deference to the

124
expertise exhibited by intermediaries, business leaders, and other influential community
stakeholders who are not inhibited by information asymmetries.
Conclusion
The conclusion section summarizes the author’s response to the research question
and expresses to the reader whether the research goals of this research study were
satisfied.
Research Question
After evaluating the research problem, the author determined this research study
should serve as an investigative tool for determining how stakeholder perceptions
influence entrepreneurism in the City of St. Petersburg, Florida. Relying on a review of
the academic literature, primary research themes derived from one-to-one interviews and
a focus group, and the synthesis of primary and secondary research findings, subsequent
analysis revealed the following:
Information asymmetries that promote uncertainty can be mitigated by
making connections and forming alliances with experienced, informed, and
influential community stakeholders (Koetse et al., 2006; Liao & Gartner,
2006).
The spatial agglomeration of intellectual capital and subsequent knowledge
spillovers are best facilitated by distinctive community quality-of-life and
cultural attributions (Doring et al., 2010; Firestone, 2010; Florida, 2012; Judd
& McNeil, 2008; Weber, 2002).
A culture of grass roots support among community stakeholders reinforced by
interconnected networks and facilitated by knowledge transfer intermediaries
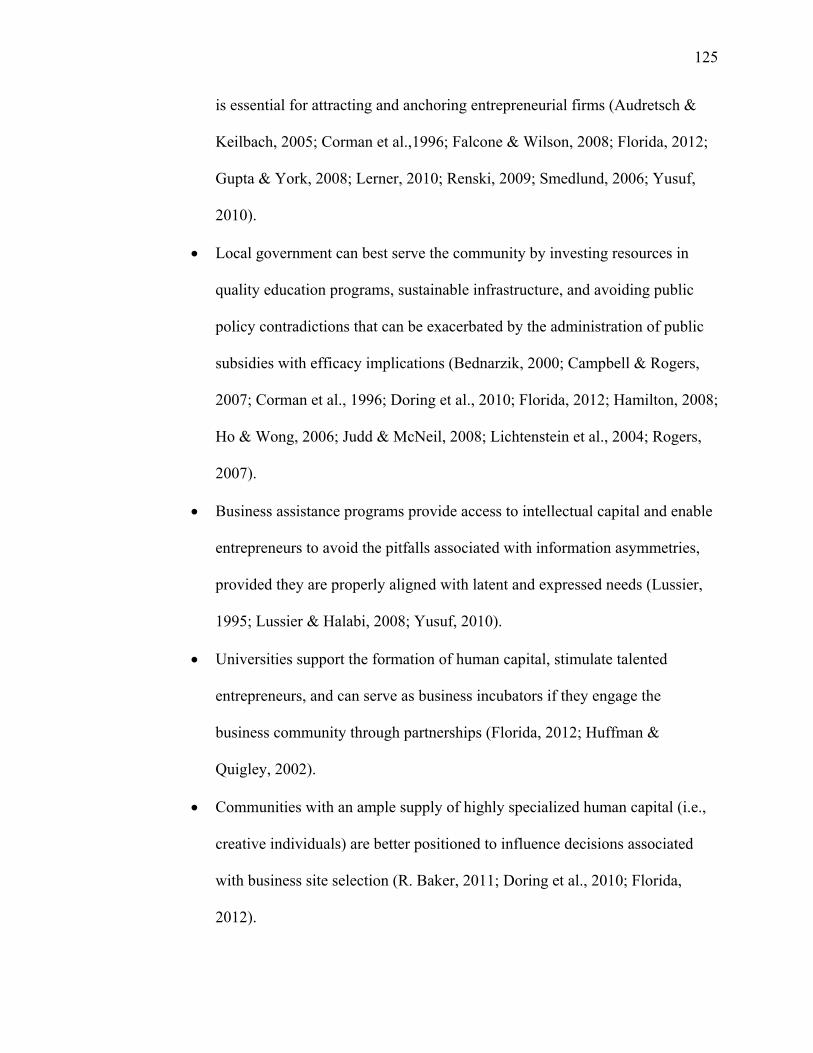
125
is essential for attracting and anchoring entrepreneurial firms (Audretsch &
Keilbach, 2005; Corman et al.,1996; Falcone & Wilson, 2008; Florida, 2012;
Gupta & York, 2008; Lerner, 2010; Renski, 2009; Smedlund, 2006; Yusuf,
2010).
Local government can best serve the community by investing resources in
quality education programs, sustainable infrastructure, and avoiding public
policy contradictions that can be exacerbated by the administration of public
subsidies with efficacy implications (Bednarzik, 2000; Campbell & Rogers,
2007; Corman et al., 1996; Doring et al., 2010; Florida, 2012; Hamilton, 2008;
Ho & Wong, 2006; Judd & McNeil, 2008; Lichtenstein et al., 2004; Rogers,
2007).
Business assistance programs provide access to intellectual capital and enable
entrepreneurs to avoid the pitfalls associated with information asymmetries,
provided they are properly aligned with latent and expressed needs (Lussier,
1995; Lussier & Halabi, 2008; Yusuf, 2010).
Universities support the formation of human capital, stimulate talented
entrepreneurs, and can serve as business incubators if they engage the
business community through partnerships (Florida, 2012; Huffman &
Quigley, 2002).
Communities with an ample supply of highly specialized human capital (i.e.,
creative individuals) are better positioned to influence decisions associated
with business site selection (R. Baker, 2011; Doring et al., 2010; Florida,
2012).

126
Maintaining sufficient financial reserves in good times and bad is an essential
component in new business firm formation, expansion, and survival (Elston &
Audretsch, 2011; Kobeissi, 2009).
A holistic approach to brand promotion will enable stakeholders to distinguish
the reputational capital of their community by establishing a niche in the local
marketplace, contributing favorably to economic growth (R. Baker, 2011;
Crombie, 2011; Florida, 2002, 2012; Judd & McNeil, 2008; Sneed et al.,
2011).
An inclusive approach to economic development planning will enable
community stakeholders to promote a value proposition that translates quality
of place advantages (e.g., quality-of-life, culture, etc.) into favorable
economic outcomes (e.g., lower transaction costs, economic freedom, and
organic growth; R. Baker, 2011; Corman et al., 1996; Florida, 2012; Judd &
McNeil, 2008; Markusen et al., 2013).
Research Goals
In determining how economic, social, and environmental factors inspire or inhibit
entrepreneurism, the author concluded information asymmetries and financial capital
constraints represent the most formidable barriers to business entry. To overcome these
barriers, entrepreneurs must establish connections with experienced and influential
community stakeholders and be prepared to leverage knowledge spillovers and reciprocal
transaction benefits as they arise. In the context of financial capital constraints,
entrepreneurs, at the earliest opportunity, must establish a conservative approach to
maintaining sufficient reserves of financial capital if they expect to survive cyclical

127
economic downturns (Doring et al., 2010; Elston & Audretsch, 2011; Firestone, 2010;
Florida, 2012; Judd & McNeil, 2008; Kobeissi, 2009; Koetse et al., 2006; Liao &
Gartner, 2006; Weber, 2002).
When trying to make the determination of how stakeholder perceptions influence
entrepreneurism, the author concluded favorable perceptions of quality of place can have
a significant impact on business relocation decisions. Likewise, grass roots support of
new and organic business firms can help mitigate information asymmetries and buttress
the reputational capital of the community (Audretsch & Keilbach, 2005; R. Baker, 2011;
Corman et al., 1996; Falcone & Wilson, 2008; Florida, 2012; Gupta & York, 2008; Judd
& McNeil, 2008; Lerner, 2010; Markusen et al., 2013; Renski, 2009; Smedlund, 2006;
Yusuf, 2010).
When making the determination of how interactions of economic, social,
environmental factors, and perceptions of stakeholders inspire or inhibit entrepreneurism,
the author concluded brand promotion and economic development planning are essential
elements for improving the appeal and resiliency of a community. Ultimately, a holistic
and inclusive approach is essential for the formation of a community’s identity that
demonstrates a high level of quality of place that is authentic, sustainable, and appealing
to both creative individuals and business firms (R. Baker, 2011; Corman et al., 1996;
Crombie, 2011; Florida, 2002, 2012; Judd & McNeil, 2008; Markusen et al., 2013; Sneed
et al., 2011).
Recommendations
Despite answering the research question and satisfying the research goals for this
research study, the author concluded there were two fundamental deficiencies in the

128
supporting literature that could benefit from further study. First, the ongoing controversy
regarding the efficacy of tax subsidies and other financial incentives and business
relocation decisions is often a source of division among community stakeholders. In
particular, Weber (2002) warned of a low correlation between local incentives and
employment growth and as such, stipulated the price of such incentives outweighed the
value of benefits derived from economic development. This author posits a mixed-
methods research methodology should be employed in a research study to help reveal
how information asymmetries between local governments and business interests can be
minimized by establishing which factors contribute more readily to sustained economic
growth.
Second, Pedroni and Sheppard (2013) stipulated the academic community had not
sufficiently addressed the existence of a causal connection between culture production
and local economic performance indicators such as gross domestic product (GDP). This
concern is based on Pedroni and Sheppard’s narrative regarding the amount of resources
being developed for culture production and how such investments affect other forms of
infrastructure (e.g., schools, roads, etc.) investment in the long-run. To resolve this issue,
this author recommends a qualitative methods research study incorporating several
sample groups of community stakeholders from cities that have been recognized as
leading centers for creative capital be conducted to establish which combination of
factors underlying economic growth offers the best outcomes in terms of ROI and gains
in reputational capital.
In the context of recommendations for economic development practitioners, the
author recommends a stakeholder approach (partnership) for addressing concerns

129
associated with entrepreneurism. After considering the research findings of Bacdayan
(2008) and Sherman (1999), the author recommends community stakeholders consider
establishing an intermediary organization (e.g., business incubator) to facilitate business
assistance, brand promotion, and economic development planning initiatives. Such an
organization should be led by individuals representing a cross-section of community
stakeholders (e.g., local government, Chamber of Commerce, universities, neighborhood
associations, etc.) and staffed with full-time qualified professionals to ensure all interests
are represented and considered. Under the umbrella of this intermediary organization,
communities could minimize duplicity and ensure qualified expertise and sufficient
resources are employed in ways that generate favorable long-term economic outcomes.
Representing the common interests of community stakeholders, this intermediary
organization would be uniquely qualified to shape a community’s identity for the purpose
of promoting the economic and quality of place advantages that will help recruit and
retain creative individuals who have a propensity to engage in entrepreneurial ventures
and contribute to economic growth.
Conclusion
Considering the recommendations to redress the deficiencies in the supporting
academic literature and those directed to economic development practitioners, the author
contends community stakeholders must confront information asymmetries by establishing
interconnected networks, and ultimately rely on intermediary organizations to advise,
plan, implement, and evaluate brand promotion and economic development planning
initiatives. In the context of the City of St. Petersburg, the author posits such an
organization comprised of qualified representatives of community stakeholder

130
organizations would develop the capacity to: (a) establish an authentic marketplace niche
that distinguishes the city from its rivals, (b) promote quality of place benefits to attract
and retain creative individuals with high levels of human capital, (c) engage in economic
development planning that emphasizes organic growth and the recruitment of business
firms that do not adversely impact net economic performance, (d) assume a holistic view
to facilitate an equitable approach in infrastructure investment, and (e) serve as a business
incubator in partnership with other community stakeholders to assist new start-ups and
entrepreneurs persevere by providing access to intellectual capital, thereby enhancing the
city’s image as a business friendly community to promote a healthy regional economy.

131
REFERENCES
Adams, S. (2012, August 20). There are far too few skilled workers for some jobs? Really? Forbes. Retrieved from http://www.forbes.com/sites/susanadams /2012/08/20/there-are-far-too-few-skilled-workers-for-some-jobs-really/
Albright, M. (2012, February 18). Empty storefronts: The vacancy rates keep getting better. Tampa Bay Times. Retrieved from http://www.tampabay.com/news /business/retail/empty-storefronts-the-vacancy-rates-keeps-getting-better/1215966
Al-Hamdan, Z., & Anthony, D. (2010). Deciding on a mixed-methods design in a doctoral study. Nurse Researcher, 18(1), 45-56.
Amadeo, K. (2012). Natural unemployment rate. About.com. Retrieved from http://useconomy.about.com/od/glossary/g/natural_unemplo.htm
Ammons, D., & Morgan, J. (2011). State-of-of-the-art measures in economic development. PM Magazine, 93(5). Retrieved from http://webapps.icma.org/pm/9305/public/cover.cfm?author=David%20Ammons%20and%20Jonathan%20Morgan&title=State-of-the-Art%20Measures%20in%20Economic%20Development&subtitle=
Appelbaum, S. H., & Kamal, R. (2000). An analysis of the utilization and effectiveness of non-financial incentives in small business. Journal of Management Development, 19(9), 733-763.
Argosy University. (2011). Credibility issues. R7035: Methods and Analysis of Qualitative Research. Retrieved from http://myclassonline.com
Audretsch, D. B., & Keilbach, M. (2005). Entrepreneurship capital and regional growth. The Annals of Regional Science, 39, 457-469.
Bacdayan, P. (2008). Finding win-win forms of economic development outreach. College Teaching, 56(3), 143-148.
Baker, R. (2011). The seamless city: A conservative mayor’s approach to urban revitalization that can work anywhere. Washington, DC: Regnery.
Baker, S. E., & Edwards, R. (2012). How many qualitative interviews is enough? Southampton, United Kingdom: National Centre for Research Methods, University of Southampton.
Bednarzik, R. W. (2000, July). The role of entrepreneurship in U.S. and European job growth. Monthly Labor Review, 123(7), 3-16.
Bishop, K., & Nixon, R. D. (2006). Venture opportunity evaluations: Comparisons between venture capitalists and inexperienced pre-nascent entrepreneurs. Journal of Developmental Entrepreneurship, 11(1), 19-33.

132
Brown, J. D. (2005). Characteristics of sound qualitative research. Shiken: JALT Testing and Evaluation SIG Newsletter, 9(2), 31-33.
Campbell, N. D., & Rogers, T. M. (2007). Economic freedom and net business formation. Cato Journal, 27(1), 23-36.
City of St. Petersburg, Economic Development Division. (2012a). Performance measures. Retrieved from http://www.stpete.org/performance/
City of St. Petersburg, Economic Development Division. (2012b). Business clusters. Retrieved from http://www.stpete.org/economic_development_dept /region_overview/business_clusters.asp
CLRSearch.com. (2010). Establishments by industry type. Retrieved from http://www.clrsearch.com/Saint_Petersburg_Demographics/FL/Establishment-Statistics-by-NAICS-Code
Cohn, S. (2012, July 10). Texas named top US state for business 2012. CNBC. Retrieved from http://finance.yahoo.com/news/texas-named-america%E2%80%99s-top-state-for-business-2012.html
Colvin, G. (2012, August 8). Business’s real problem: Uncertainty, uncertainty, uncertainty. CNNMoney. Retrieved from http://management.fortune.cnn.com /2012/08/08/business-economic-uncertainty/
Corman, J., Lussier, R. N., & Nolan, K. G. (1996). Factors that encourage entrepreneurial start-ups and existing business expansion: A longitudinal study comparing recession and expansion periods. Academy of Entrepreneurship Journal, 1(2), 43-55.
Creative destroyer. (2004). In MBADepot.com. Retrieved from http://www.mbadepot.com/content/4096/
Creswell, J. W. (2007). Qualitative inquiry and research design: Choosing among five approaches (2nd ed.). Thousand Oaks, CA: Sage.
Creswell, J. W. (2009). Research design: Qualitative, quantitative, and mixed methods approaches (3rd ed.). Thousand Oaks, CA: Sage.
Crombie, B. (2011). Branding cities and clusters for economic development. The ISM Journal of International Business, 1(3), 1-20.
Crossan, F. (2003). Research philosophy: Towards an understanding. Nurse Researcher, 11(1), 46-55.
Degan, R. (2010). Social network driven innovation. The ISM Journal of International Business, 1(1), 1-28.

133
DeLisle, J. R. (2009). A flood of economic trouble, a ray of political hope. The Appraisal Journal, 77(1), 6-17.
Denslow, D., & Dewey, J. F. (2008). Florida’s job structure. University of Florida, Bureau of Economic and Business Research. Retrieved from http://www.bebr.ufl.edu/articles/economic-analysis/florida-s-job-structure
Dewey, J. F. (2012). Florida’s long term economic trajectory emerging from the Great Recession. University of Florida, Bureau of Economic and Business Research. Retrieved from http://www.bebr.ufl.edu/articles/economic-analysis/florida-s-long-term-economic-trajectory-emerging-great-recession
Doh, J. P. (2000). Entrepreneurial privatization strategies: Order of entry and local partner collaboration as sources of competitive advantage. The Academy of Management Review, 25(3), 551-571.
Doring, T., Knappitsch, E., & Aigner, B. (2010). Municipalities and regions in locational competition – New economic considerations. Intereconomics, 4, 239-248.
DuBois, S. (2012, August 23). Why we’re freezing near the fiscal cliff. CNNMoney. Retrieved from http://management.fortune.cnn.com/2012/08/23/businesses-fiscal-cliff-congress/?iid=SF_F_River
Dymski, G. A. (1996). Business strategy and access to capital in inner-city revitalization. Review of Black Political Economy, 24(2/3), 51-65.
Earle, H. A. (2003). Building a workplace of choice: Using the work environment to attract and retain top talent. Journal of Facilities Management, 2(3), 244-257.
Elston, J. A., & Audretsch, D. B. (2011). Financing the entrepreneurial decision: An empirical approach using experimental data on risk attitudes. Small Business Economics, 36, 209-222.
Falcone, T. W., & Wilson, T. L. (2008). A proactive culture of support: Establishing a regional comparative advantage in a semi-rural area. Competitiveness Review: An International Business Journal, 18(3), 241-256.
Firestone, S. (2010). Diverse cities and knowledge spillovers. The Annals of Regional Science, 44(1), 1-20.
Florida Chamber of Commerce Small Business Council. (2012). Florida small business index: 2012 quarter 3 survey results. Retrieved from http://www.flchamber.com/get-involved/small-business-council/small-business-index-survey/
Florida, R. (2002, May). The rise of the creative class: Why cities without gays and rock bands are losing the economic development race. Washington Monthly, 34(5), 15-25.
134
Florida, R. (2012). The rise of the creative class revisited. New York, NY: Basic Books.
Freel, M. S. (2005). Perceived environmental uncertainty and innovation in small firms. Small Business Economics, 25, 49-64.
Friar, J. H., & Meyer, M. H. (2003). Entrepreneurship and start-ups in the Boston region: Factors differentiating high-growth ventures and micro-ventures. Small Business Economics, 21(2), 145-152.
Fulda, J. S. (2010). The “broken windows” theory and the New York experience reconsidered. Institute of Economic Affairs, 30(1), 101-102.
Garrett, T. A., & Ott, L. S. (2008). Local crime and local business cycles. St. Louis, MO: Federal Reserve Bank of St. Louis.
Gupta, V. K., & York, A. S. (2008). Attitudes toward entrepreneurship and small business: Findings from a survey of Nebraska residents and small business owners. Journal of Enterprising Communities: People and Places in the Global Economy, 2(4), 348-366.
Hamilton, M. T. (2008). Exploring intervention to the regional institutions for innovation: Technology-based economic development (Doctoral dissertation). Available from ProQuest Dissertations and Theses database. (UMI No. 3365682)
Hanks, G. F., Barnett, S., Durden, L., & Woodrum, W. (2011). Isolating relevant policy issues: Exploration of small business bankruptcies in Georgia. Journal of Management Policy and Practice, 12(2), 11-26.
Harrington, J. (2012, August 29). Study: Many Tampa Bay job seekers lack education required for job openings. Tampa Bay Times. Retrieved from http://www.tampabay.com/news/study-many-tampa-bay-job-seekers-lack-education-required-for-job-openings/1248457
Henderson, J. (2002). Building the rural economy with high growth entrepreneurs. Economic Review – Federal Reserve Bank of Kansas, 87(3), 45-70.
Ho, Y. P., & Wong, P. K. (2006). Financing, regulatory costs and entrepreneurial propensity. Small Business Economics, 28, 187-204.
Holaday, J. W., Meltzer, S. L., & McCormick, J. T. (2002). Strategies for attracting angel investors. Journal of Commercial Biotechnology, 9(2), 129-133.
Holt, L., Colburn, D., & Leverty, L. (2012). Boomers or bust in Florida and the nation. Bureau of Economic and Business Research, University of Florida. Retrieved from http://www.bebr.ufl.edu/articles/boomers-or-bust-florida-and-nation

135
Horwitz, F. M., Chan, T. H., & Quazi, H. A. (2003). Finders, keepers? Attracting, motivating and retaining knowledge workers. Human Resource Management Journal, 13(4), 23-44.
Huffman, D., & Quigley, J. M. (2002). The role of the university in attracting high tech entrepreneurship: A Silicon Valley tale. The Annals of Regional Science, 36, 403-419.
Husain, J. (2009). Lessons learnt from business mentoring practices. The Business Review, Cambridge, 14(1), 300-305.
Ihantola, E., & Kihn, L. (2011). Threats to validity and reliability in mixed-methods accounting research. Qualitative Research in Accounting & Management, 9(1), 39-58.
Investopedia. (2012a). Angel investor. Retrieved from http://www.investopedia.com/terms/a/angelinvestor.asp#axzz22jafVQep
Investopedia. (2012b). Cyclical unemployment. Retrieved from http://www.investopedia.com/terms/c/cyclicalunemployment.asp#axzz22jafVQep
Investopedia. (2012c). Great Recession. Retrieved from http://www.investopedia.com/terms/g/great-recession.asp#axzz22jafVQep
Investopedia. (2012d). Return on investment. Retrieved from http://www.investopedia.com/terms/r/returnoninvestment.asp/#axzz22jafVQep
Investopedia. (2012e). Structural unemployment. Retrieved from http://www.investopedia.com/terms/s/structuralunemployment.asp#axzz22jafVQep
Investopedia. (2012f). Venture capital. Retrieved from http://www.investopedia.com/terms/v/venturecapital.asp#axzz22jafVQep
Investopedia. (2013). Business incubator. Retrieved from http://www.investopedia.com/terms/i/incubatorfirm.asp
Johnson, R. B., & Onwuegbuzie, A. J. (2004). Mixed methods research: A research paradigm whose time has come. Educational Researcher, 33(7), 14-26.
Jones, K., & Tullous, R. (2002). Behaviors of pre-venture entrepreneurs and perceptions of their financial needs. Journal of Small Business Management, 40(3), 233-249.
Judd, R., & McNeil, R. D. (2008). Large firms and small firms: Job quality, innovation and economic development. Journal of American Academy of Business, 14(1), 161-171.
136
Kelle, U. (2006). Combining qualitative and quantitative methods in research practice: Purposes and advantages. Qualitative Research in Psychology, 3, 293-311.
Keuschnigg, C. (2004). Venture capital backed growth. Journal of Economic Growth, 9(2), 239-261.
Key, J. P. (1997). Research design in occupational education. Oklahoma State University. Retrieved from http://www.okstate.edu/ag/agedcm4h /academic/aged5980a/5980/newpage21.htm
Kiernan, N. E. (2011). Program evaluation: Ensuring a lively discussion among participants about IMPACTS. The Pennsylvania State University. Retrieved from http://extension.psu.edu/evaluation/pdf/TS94.pdf
Koba, M. (2012, August 13). Why fewer Americans are starting new businesses. Yahoo Finance. Retrieved from http://finance.yahoo.com/news/america-lost-entrepreneurial-spirit-133825442.html
Kobeissi, N. (2009). Impact of the Community Reinvestment Act on new business start-ups and economic growth in local markets. Journal of Small Business Management, 47(4), 489-513.
Koetse, M. J., van der Vlist, A. J., & de Groot, H. L. F. (2006). The impact of perceived expectations and uncertainty on firm investment. Small Business Economics, 26, 365-376.
Kotler, P., Haider, D., & Rein, I. (1993). There’s no place like our place! The marketing of cities, regions, and nations. The Futurist, 27(6), 14-21.
Lerner, J. (2010, March). Innovation, entrepreneurship and financial market cycles (STI Working Paper 2010/3). Cambridge, MA: Harvard University, Directorate for Science, Technology and Industry.
Ley, A., & Weaven, S. (2011). Exploring agency dynamics of crowdfunding in start-up capital financing. Academy of Entrepreneurship Journal, 17(1), 85-110.
Liao, J., & Gartner, W. B. (2006). The effects of pre-venture plan timing and perceived environmental uncertainty on the persistence of emerging firms. Small Business Economics, 27, 23-40.
Lichtenstein, G. A., Lyons, T. S., & Kutzhanova, N. (2004). Building entrepreneurial communities: The appropriate role of enterprise development activities. Community Development, 35(1), 5-24.
Lussier, R. N. (1995). A nonfinancial business success versus failure prediction model for young firms. Journal of Small Business Management, 33(1), 8-20.

137
Lussier, R. N., & Halabi, C. E. (2008). An analysis of small business in Chile: A correlational study. Journal of Small Business and Enterprise Development, 15(3), 490-503.
Lussier, R. N., & Halabi, C. E. (2010). A three-country comparison of the business success versus failure prediction model. Journal of Small Business Management, 48(3), 360-377.
Lussier, R. N., & Pfeifer, S. (2001). A cross-national prediction model for business success. Journal of Small Business Management, 39(3), 228-239.
Lussier, R. N., Sonfield, M. C., Corman, J., & McKinney, M. (n.d.). Strategies used by small business entrepreneurs. Mid-American Journal of Business, 16(1), 29-37.
MacDonald, E. (2012, September 18). Fed study: D.C. uncertainty worsens jobless rate. Fox Business. Retrieved from http://www.foxbusiness.com/government /2012/09/18/fed-reserve-study-dc-uncertainty-worsens-jobless-rate/
Maloney, G., & Wassall, G. H. (2013). A case study in cultural economic development: The Adams Arts program in Massachusetts. In M. Rushton (Ed.), Creative communities: Art works in economic development (pp. 60-79). Washington, DC: Brookings Institution Press.
Markusen, A., Gadwa-Nicodemus, A., & Barbour, E. (2013). The arts, consumption, and innovation in regional development. In M. Rushton (Ed.), Creative communities: Art works in economic development (pp. 36-59). Washington, DC: Brookings Institution Press.
Maula, M., Autio, E., & Arenius, P. (2005). What drives micro-angel investments? Small Business Economics, 25, 459-475.
Mizuno, K., Mizutani, F., & Nakayama, N. (2006). Industrial diversity and metropolitan unemployment rate. Annals of Regional Science, 40, 157-172.
Morgan, D. L. (1997). Focus groups as qualitative research (2nd ed.). Thousand Oaks, CA: Sage.
Munck, G. L. (1998). Canons of research design in qualitative analysis. Studies in Comparative International Development, 33(3), 18-45.
Pedroni, P., & Sheppard, S. (2013). The economic consequences of cultural spending. In M. Rushton (Ed.), Creative communities: Art works in economic development (pp. 166-189). Washington, DC: Brookings Institution Press.
Pofeldt, E. (2012, August 29). Let’s ask entrepreneurs: Who will really create jobs? Forbes. Retrieved from http://www.forbes.com/sites/elainepofeldt /2012/08/29/lets-ask-entrepreneurs-who-will-really-create-jobs/

138
Renski, H. (2009). New firm entry, survival, and growth in the United States. Journal of American Planning Association, 75(1), 60-77.
Richards, C. (2012, February 13). Tomorrow’s market probably won’t look anything like today. New York Times. Retrieved from http://bucks.blogs.nytimes.com /2012/02/13/tomorrows-market-probably-wont-look-anything-like-today/
Rothwell, J. (2012). Education, job openings, and unemployment in Metropolitan America. Metropolitan Policy Program at Brookings, 1-33.
SBDC at Pinellas County Economic Development. (2012). Entrepreneurs. Retrieved from http://www.pced.org/entrepreneurs/subpage.asp?Entrepreneurs
Schmitz, L. (2013). Do cultural tax districts buttress revenue growth for arts organizations? In M. Rushton (Ed.), Creative communities: Art works in economic development (pp. 80-96). Washington, DC: Brookings Institution Press.
Seasonal unemployment. (n.d.). In Dictionary.com. Retrieved from http://dictionary.reference.com/browse/seasonal+unemployment
Sherman, H. D. (1999). Assessing the intervention effectiveness of business incubation programs on new business start-ups. Journal of Developmental Entrepreneurship, 4(2), 117-133.
Smedlund, A. (2006). The roles of intermediaries in a regional knowledge system. Journal of Intellectual Capital, 7(2), 204-220.
Sneed, C. T., Runyan, R., Swinney, J. L., & Lim, H. J. (2011). Brand, business mix, sense-of-place: Do they matter downtown? Journal of Place Management and Development, 4(2), 121-134.
Sommer, S. C., Loch, C. H., & Dong, J. (2009). Managing complexity and unforeseeable uncertainty in startup companies: An empirical study. Organizational Science, 20(1), 118-133.
Sriram, V., Mersha, T., & Herron, L. (2006). Drivers of urban entrepreneurship: An integrative model. International Journal of Entrepreneurial Behavior & Research, 13(4), 235-251.
Storrud-Barnes, S. F., Reed, R., & Jessup, L. M. (2010). Uncertainty, risk preference, and new-venture strategies. Journal of Strategy and Management, 3(3), 273-284.
Swider, P. (2008, January 30). Office vacancy rate rises. Tampa Bay Times. Retrieved from http://www.sptimes.com/2008/01/30 /Neighborhoodtimes/Office_vacancy_rate_r.shtml
139
Thomas, P. Y. (2010). Research methodology and design. Unisa Institute. Retrieved from http://uir.unisa.ac.za/bitstream/handle/10500/4245/05Chap%204_Research%20methodology%20and%20design.pdf?sequence=6
Trigaux, R. (2011a, January 30). Two cities, St. Petersburg and Tampa, strive to establish their own industry clusters. Tampa Bay Times. Retrieved from http://www.tampabay.com/news/business/economicdevelopment/two-cities-st-petersburg-and-tampa-strive-to-establish-their-own-industry/1148300
Trigaux, R. (2011b, October 9). STEM challenge: Does Florida really want to be competitive? Tampa Bay Times. Retrieved from http://www.tampabay.com/news/business/stem-challenge-does-florida-really-want-to-be-competitive/1195786
Trigaux, R. (2012, July 12). CNBC survey delivers jolting decline to Florida’s attraction to business. Tampa Bay Times. Retrieved from http://www.tampabay.com/news/business/economicdevelopment/cnbc-survey-delivers-jolting-decline-to-floridas-attraction-to-business/1239854
U.S. Census Bureau. (2012). North American Industry Classification System. Retrieved from http://www.census.gov/eos/www/naics/
U.S. Department of Labor, Bureau of Labor Statistics. (2012). Databases, tables & calculations by subject, local area unemployment statistics: Tampa-St. Petersburg-Clearwater, Florida metropolitan statistical area [Data file and code book]. Retrieved from http://data.bls.gov/pdq/SurveyOutputServlet
Van Gelderen, M., Frese, M., & Thurik, R. (2000). Strategies, uncertainty and performance of small business startups. Small Business Economics, 15(3), 165-181.
Voith, R., & Crone, T. (1988). National vacancy rates and the persistence of shocks in U.S. office markets. AREUEA Journal, 16(4), 437-458.
Weber, R. (2002). Do better contracts make better economic development initiatives? Journal of American Planning Association, 69(1), 43-55.
Weidner, J., & Williams, J. C. (2011, February 14). What is the new normal unemployment rate? Federal Reserve Bank of San Francisco Economic Letter. Retrieved from http://www.frbsf.org/publications/economics/letter/2011/el2011-05.html/
Whitford, D. (2012, October 12). Does Ray Kelly have the world’s toughest job? Fortune. Retrieved from http://management.fortune.cnn.com/2012/10/12/ray-kelly-new-york/

140
Woolsey, M. (2008a, July 9). Best cities for young professionals. Forbes. Retrieved from http://www.forbes.com/2008/07/09/cities-professionals-young-forbeslife-cx_mw_0709youngprofessionals.html
Woolsey, M. (2008b, July 9). No respite for Tampa. Forbes. Retrieved from http://www.forbes.com/2008/07/09/cities-professionals-young-forbeslife-cx_mw_0709tampa.html
Yauch, C. A., & Steudel, H. J. (2003). Complementary use of qualitative and quantitative cultural assessment methods. Organizational Research Methods, 6(4), 465-481.
Yeates, M., & Montgomery, D. (1999). The changing commercial structure of non-metropolitan urban centers and vacancy rates. Canadian Geographer, 43(4), 382-399.
Yusuf, J. E. (2010). Meeting entrepreneurs’ support needs: Are assistance programs effective? Journal of Small Business and Enterprise Development, 17(2), 294-307.
Zacharakis, A. L., Meyer, G. D., & DeCastro, J. (1999). Differing perceptions of new venture failure: A matched exploratory study of venture capitalists and entrepreneurs. Journal of Small Business Management, 37(3), 1-14.

141
APPENDICES

142
APPENDIX A
Vacancy Rate Figures

143
Figure A1. Downtown development projects (September 2011).
Figure A2. Gateway area development projects (June 2011).

144
APPENDIX B
Establishments by NAICS Code

145
Table B1 2010 Establishments by NAICS Code
St. Petersburg,
Florida Florida United States
Establishments, Total (by Place of Work) 6,320 522,727 7,700,385
Forestry, Fishing, Hunting, and Agriculture Support 2 0.03% 1,068 0.20% 23,642 0.31%
Mining 2 0.03% 266 0.05% 25,112 0.33%
Utilities 10 0.16% 618 0.12% 16,658 0.22%
Construction 493 7.80% 59,486 11.38% 813,323 10.56
%
Manufacturing 149 2.36% 14,265 2.73% 331,456 4.31%
Wholesale Trade 229 3.62% 32,232 6.17% 431,433 5.60%
Retail Trade 844 13.35
% 73,578 14.08% 1,125,6
19 14.62
%
Transportation and Warehousing 77 1.22% 13,377 2.56% 220,006 2.86%
Information 118 1.87% 8,487 1.62% 143,188 1.86%
Finance and Insurance 554 8.77% 35,604 6.81% 506,488 6.58%
Real Estate and Rental and Leasing 349 5.52% 33,214 6.35% 380,839 4.95%
Professional, Scientific and Technical Services 1,061
16.79% 70,461 13.48% 868,363
11.28%
Management of Companies and Enterprises 37 0.59% 2,504 0.48% 50,541 0.66%
Admin, Support, Waste Mgt, Remediation Services 391 6.19% 32,645 6.25% 383,618 4.98%
Educational Services 64 1.01% 5,497 1.05% 86,867 1.13%
Health Care and Social Assistance 826 13.07
% 51,726 9.90% 785,864 10.21
%
Arts, Entertainment and Recreation 71 1.12% 7,691 1.47% 125,329 1.63%
Accommodation and Food Services 454 7.18% 34,904 6.68% 634,204 8.24%
Other Services (Except Public Administration) 589 9.32% 45,104 8.63% 746,427 9.70%
Note. North American Industry Classification System (NAICS): NAICS is the standard used by Federal statistical agencies in classifying business establishments for the purpose of collecting, analyzing and publishing statistical data related to the U.S. business economy. Adapted from Establishments by Business Type, 2012, CLRsearch.com, Retrieved from http://www.clrsearch.com/Saint_Petersburg_Demographics/FL/Establishment-Statistics-by-NAICS-Code

146
Table B2 Establishments Sample Group Composition by NAICS Code
St. Petersburg, Florida
N % n % Respondent
s
Establishments, Total (St. Petersburg, Florida) 5,212 12 10
Professional, Scientific and Technical Services 1,06
1 20% 3 25% 3
Retail Trade 844 16% 2 17% 2
Health Care and Social Assistance 826 16% 2 17% 1
Construction 493 9% 1 8% 0
Finance and Insurance 554 11% 1 8% 1
Admin, Support, Waste Mgt, Remediation Services 391 8% 1 8% 1
Accommodation and Food Services 454 9% 1 8% 1
Other Services (Except Public Administration) 589 11% 1 8% 1
Note. Ten (10) respondents agreed to participate in the one-to-one interviews. The researcher's goal was twelve (12). The author was unable to secure the participation of two (2) respondents (1 each) from the following two NAICS Code establishment types: Construction and Health Care and Social Assistance.

147
APPENDIX C
One-to-One Interview Informed Consent Form

148
Informed Consent Form
You are cordially invited to participate in a doctoral level business management research study. The purpose of this research study is to interview managers or owners of City of St. Petersburg business establishments to understand: (a) how economic, social, and environmental factors inspire or inhibit entrepreneurism (as reported by the participants), (b) how stakeholder perceptions influence entrepreneurism, and (c) how interactions of economic, social, and environmental factors and perceptions of stakeholders inspire or inhibit entrepreneurism. If you participate in this research, you will be asked to respond to interview questions while being audio taped so the researcher can ensure your answers are completely understood. The tapes will only be reviewed by the researcher and never anyone else. Your participation will take approximately 30 minutes on one occasion that will be scheduled with you on advanced notice for your convenience. Your participation in this research is strictly voluntary. You may refuse to participate at all, or choose to stop your participation at any point in the research, without fear of penalty or negative consequences of any kind. The information/data you provide for this research will be treated confidentially, and all raw data will be kept in a secured file by the researcher. Results of the research will be reported as aggregate summary data only, and no individually identifiable information will be presented. You also have the right to review the results of the research if you wish to do so. A copy of the results may be obtained by contacting the researcher at the address below:
Richard J. Ferner, Jr. 9845 50th Street Circle East Parrish, Florida 34219
There will be no direct or immediate personal benefits from your participation in this research. The results of the study will be shared as an aggregate so as to share the leadership aspects to promote any organizational learning that may arise. I have read and understand the information explaining the purpose of this research and my rights and responsibilities as a participant. My signature below designates my consent to participate in this research study, according to the terms and conditions outlined above.
Signature Date Print Name:

149
APPENDIX D
Focus Group Discussion Guide

150
Focus Group Discussion Guide
Greetings focus group participants. I wanted to begin by thanking each of you for participating in the one-to-one interview process. Your contribution to this research initiative has proven invaluable. With that said, I would like to welcome each of you to this lunchtime focus group session. The intent is to continue the discussion in a group setting among professionals. As before, statements made during this event will be recorded and will remain confidential. A transcript will be provided to each participant. Informed Consent Forms will be disseminated prior to the initiation of the moderated discussion. Despite these formalities, this is an informal event, which will provide each of you with an opportunity to network with fellow business leaders from the City of St. Petersburg. Lunch, which will be provided by Orange Blossom Catering, is free of charge. The parking expense will be fully reimbursed at the conclusion of the event. The focus group session will take approximately one hour. I recognize that your time is valuable, however, I think you will find this event worthwhile, providing each of you with a rare opportunity to be heard. At the very least, this event may help each of you establish a sense of clarity that could not be achieved conventionally.
Following lunch, we will proceed with the focus group session. I, Rick Ferner, will serve as the focus group session moderator. We will rely on the original ten one-to-one interview questions for the foundation for the discussion. The moderator’s role is to provide structure, enhancing our ability to remain on task by initiating and concluding each discussion topic. As we proceed, I want to remind all participants that we are all professionals and each of you has something valuable to say, so please, be courteous to your peers and respect their insights and opinions. Thank you.
Focus Group Discussion Topics
(Uncertainty) Q1: How would you characterize the current business climate in the City
of St. Petersburg?
(Intellectual Capital) Q2: What factors do you believe favorably impact business
performance in St. Petersburg?
(Entrepreneurs) Q3: How would you characterize the level of support your business has
been provided by the St. Petersburg community?

151
(Government) Q4: How would you define the local municipal government’s role in
supporting business prosperity and economic growth?
(Business Assistance Programs) Q5: How would you characterize the quality and
effectiveness of business assistance programs in St. Petersburg?
(Universities) Q6: How would you define the role that local universities play in
promoting economic growth?
(Human Capital) Q7: What is your assessment of the availability and quality of the local
St. Petersburg workforce?
(Financial Capital) Q8: How would you characterize current conditions as it pertains to
access to capital?
(Brand Promotion) Q9: How would you describe the effectiveness of City of St.
Petersburg’s brand promotion efforts in terms of its contribution to economic prosperity?
(Economic Development Planning) Q10: What is your assessment of government and
business leader performance in promoting economic growth?

152
APPENDIX E
Focus Group Informed Consent Form

153
Informed Consent Form
You are cordially invited to participate in a doctoral level business management research study. The purpose of this research study is to interview managers or owners of City of St. Petersburg business establishments to understand: (a) how economic, social, and environmental factors inspire or inhibit entrepreneurism (as reported by the participants), (b) how stakeholder perceptions influence entrepreneurism, and (c) how interactions of economic, social, and environmental factors and perceptions of stakeholders inspire or inhibit entrepreneurism. If you participate in this research, you will be asked to participate in a focus group discussion while being audio taped so the researcher can ensure your answers are completely understood. The tapes will only be reviewed by the researcher and never anyone else. Your participation will take approximately one hour on Thursday, March 28, 2013 at the St. Petersburg Area Chamber of Commerce. Your participation in this research is strictly voluntary. You may refuse to participate at all, or choose to stop your participation at any point during the focus group discussion, without fear of penalty or negative consequences of any kind. The information/data you provide for this research will be treated confidentially, and all raw data will be kept in a secured file by the researcher. Results of the research will be reported as aggregate summary data only, and no individually identifiable information will be presented. You also have the right to review the results of the research if you wish to do so. A copy of the results may be obtained by contacting the researcher at the address below:
Richard J. Ferner, Jr. 9845 50th Street Circle East Parrish, Florida 34219
There will be no direct or immediate personal benefits from your participation in this research. The results of the study will be shared as an aggregate so as to share the leadership aspects to promote any organizational learning that may arise. I have read and understand the information explaining the purpose of this research and my rights and responsibilities as a participant. My signature below designates my consent to participate in this research study, according to the terms and conditions outlined above.
Signature Date Print Name:

154
APPENDIX F
One-on-One Interview Codes
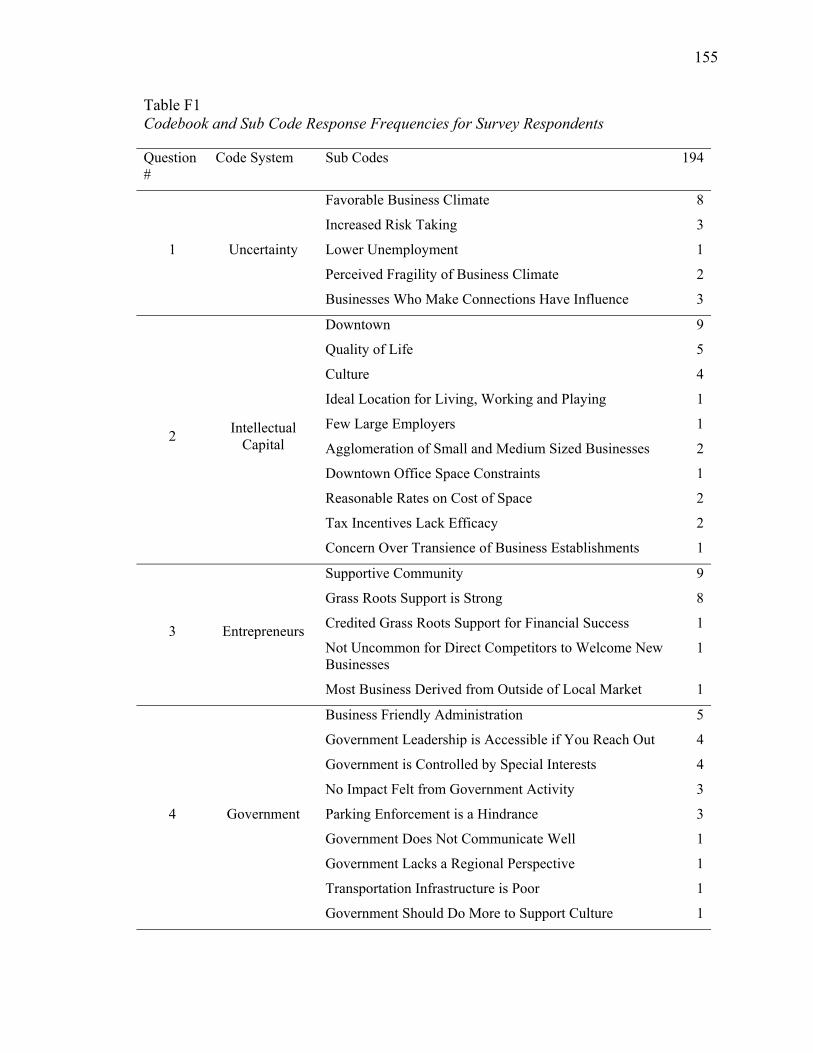
155
Table F1 Codebook and Sub Code Response Frequencies for Survey Respondents
Question #
Code System Sub Codes 194
1 Uncertainty
Favorable Business Climate 8
Increased Risk Taking 3
Lower Unemployment 1
Perceived Fragility of Business Climate 2
Businesses Who Make Connections Have Influence 3
2 Intellectual
Capital
Downtown 9
Quality of Life 5
Culture 4
Ideal Location for Living, Working and Playing 1
Few Large Employers 1
Agglomeration of Small and Medium Sized Businesses 2
Downtown Office Space Constraints 1
Reasonable Rates on Cost of Space 2
Tax Incentives Lack Efficacy 2
Concern Over Transience of Business Establishments 1
3 Entrepreneurs
Supportive Community 9
Grass Roots Support is Strong 8
Credited Grass Roots Support for Financial Success 1
Not Uncommon for Direct Competitors to Welcome New Businesses
1
Most Business Derived from Outside of Local Market 1
4 Government
Business Friendly Administration 5
Government Leadership is Accessible if You Reach Out 4
Government is Controlled by Special Interests 4
No Impact Felt from Government Activity 3
Parking Enforcement is a Hindrance 3
Government Does Not Communicate Well 1
Government Lacks a Regional Perspective 1
Transportation Infrastructure is Poor 1
Government Should Do More to Support Culture 1
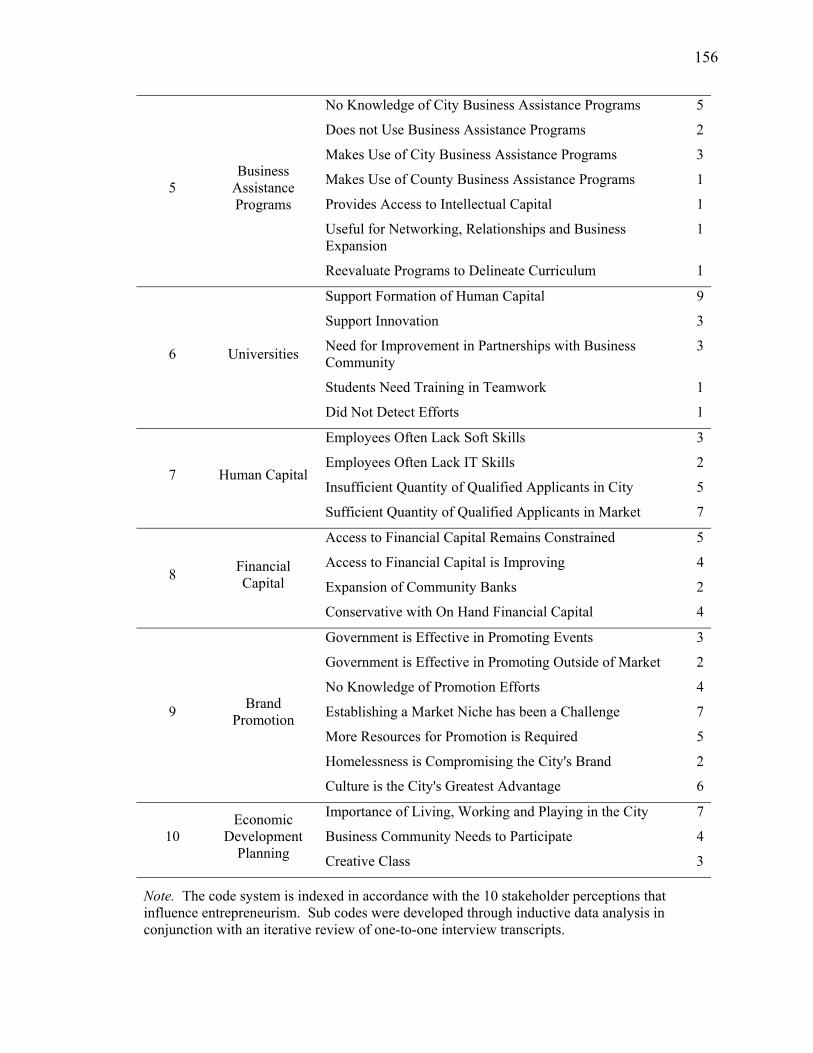
156
5 Business
Assistance Programs
No Knowledge of City Business Assistance Programs 5
Does not Use Business Assistance Programs 2
Makes Use of City Business Assistance Programs 3
Makes Use of County Business Assistance Programs 1
Provides Access to Intellectual Capital 1
Useful for Networking, Relationships and Business Expansion
1
Reevaluate Programs to Delineate Curriculum 1
6 Universities
Support Formation of Human Capital 9
Support Innovation 3
Need for Improvement in Partnerships with Business Community
3
Students Need Training in Teamwork 1
Did Not Detect Efforts 1
7 Human Capital
Employees Often Lack Soft Skills 3
Employees Often Lack IT Skills 2
Insufficient Quantity of Qualified Applicants in City 5
Sufficient Quantity of Qualified Applicants in Market 7
8 Financial Capital
Access to Financial Capital Remains Constrained 5
Access to Financial Capital is Improving 4
Expansion of Community Banks 2
Conservative with On Hand Financial Capital 4
9 Brand
Promotion
Government is Effective in Promoting Events 3
Government is Effective in Promoting Outside of Market 2
No Knowledge of Promotion Efforts 4
Establishing a Market Niche has been a Challenge 7
More Resources for Promotion is Required 5
Homelessness is Compromising the City's Brand 2
Culture is the City's Greatest Advantage 6
10 Economic
Development Planning
Importance of Living, Working and Playing in the City 7
Business Community Needs to Participate 4
Creative Class 3
Note. The code system is indexed in accordance with the 10 stakeholder perceptions that influence entrepreneurism. Sub codes were developed through inductive data analysis in conjunction with an iterative review of one-to-one interview transcripts.

157
APPENDIX G
One-to-One Interview Co-occurrence Model
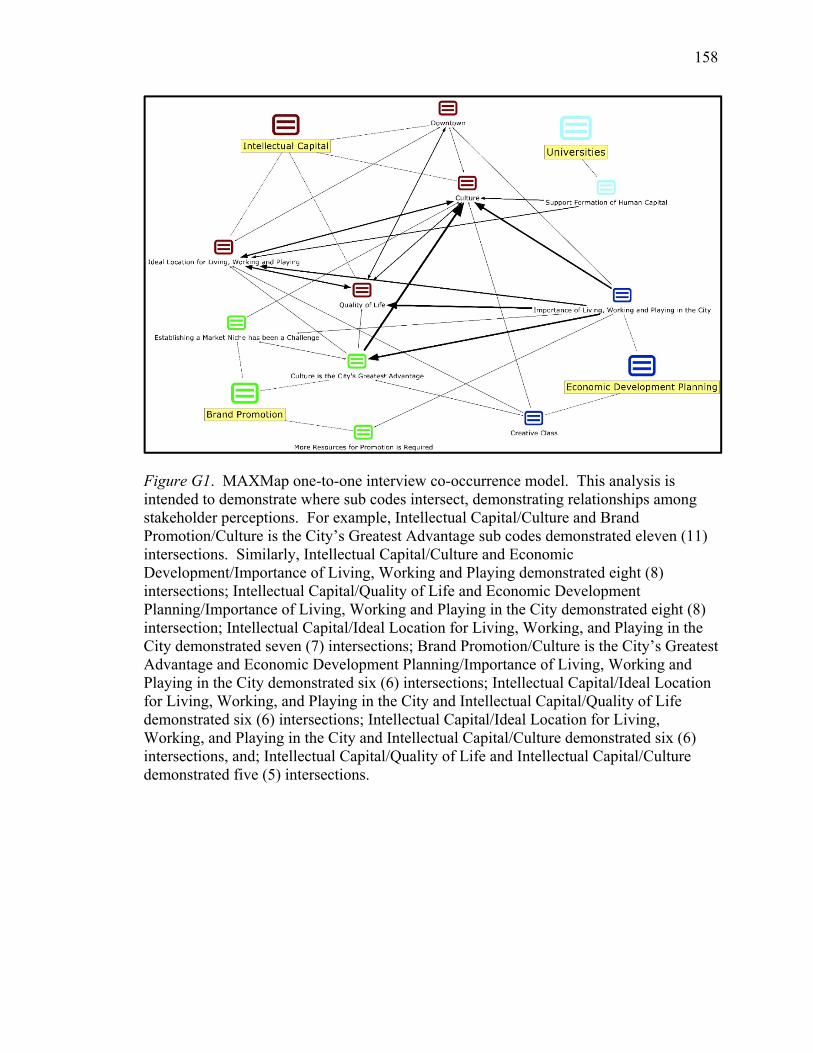
158
Figure G1. MAXMap one-to-one interview co-occurrence model. This analysis is intended to demonstrate where sub codes intersect, demonstrating relationships among stakeholder perceptions. For example, Intellectual Capital/Culture and Brand Promotion/Culture is the City’s Greatest Advantage sub codes demonstrated eleven (11) intersections. Similarly, Intellectual Capital/Culture and Economic Development/Importance of Living, Working and Playing demonstrated eight (8) intersections; Intellectual Capital/Quality of Life and Economic Development Planning/Importance of Living, Working and Playing in the City demonstrated eight (8) intersection; Intellectual Capital/Ideal Location for Living, Working, and Playing in the City demonstrated seven (7) intersections; Brand Promotion/Culture is the City’s Greatest Advantage and Economic Development Planning/Importance of Living, Working and Playing in the City demonstrated six (6) intersections; Intellectual Capital/Ideal Location for Living, Working, and Playing in the City and Intellectual Capital/Quality of Life demonstrated six (6) intersections; Intellectual Capital/Ideal Location for Living, Working, and Playing in the City and Intellectual Capital/Culture demonstrated six (6) intersections, and; Intellectual Capital/Quality of Life and Intellectual Capital/Culture demonstrated five (5) intersections.

159
APPENDIX H
Focus Group Codes
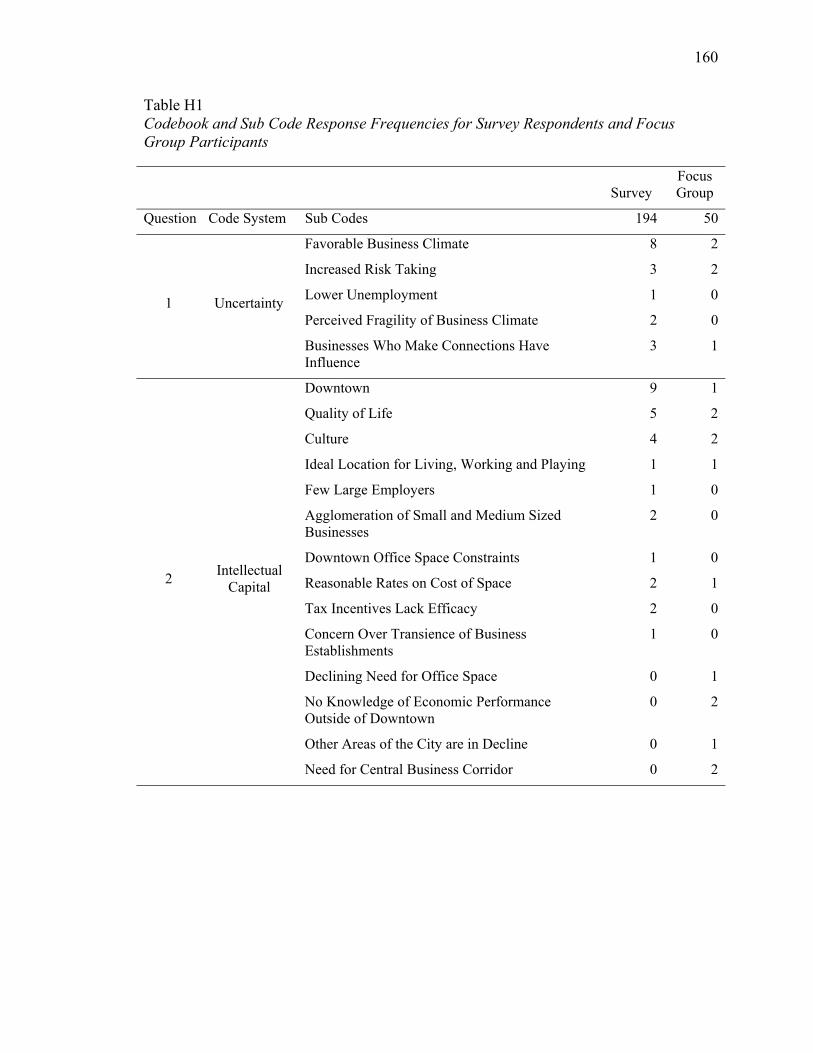
160
Table H1 Codebook and Sub Code Response Frequencies for Survey Respondents and Focus Group Participants
Survey Focus Group
Question Code System Sub Codes 194 50
1 Uncertainty
Favorable Business Climate 8 2
Increased Risk Taking 3 2
Lower Unemployment 1 0
Perceived Fragility of Business Climate 2 0
Businesses Who Make Connections Have Influence
3 1
2 Intellectual
Capital
Downtown 9 1
Quality of Life 5 2
Culture 4 2
Ideal Location for Living, Working and Playing 1 1
Few Large Employers 1 0
Agglomeration of Small and Medium Sized Businesses
2 0
Downtown Office Space Constraints 1 0
Reasonable Rates on Cost of Space 2 1
Tax Incentives Lack Efficacy 2 0
Concern Over Transience of Business Establishments
1 0
Declining Need for Office Space 0 1
No Knowledge of Economic Performance Outside of Downtown
0 2
Other Areas of the City are in Decline 0 1
Need for Central Business Corridor 0 2

161
3 Entrepreneurs
Supportive Community 9 2
Grass Roots Support is Strong 8 1
Credited Grass Roots Support for Financial Success
1 0
Communication between City and Chamber has Improved
0 1
Not Uncommon for Direct Competitors to Welcome New Businesses
1 0
Most Business Derived from Outside of Local Market
1 0
4 Government
Business Friendly Administration 5 2
Government Leadership is Accessible if You Reach Out
4 1
Government is Controlled by Special Interests 4 0
No Impact Felt from Government Activity 3 0
Parking Enforcement is a Hindrance 3 0
Insufficient Parking for Businesses 0 1
Government Does Not Communicate Well 1 0
Government Lacks a Regional Perspective 1 0
Transportation Infrastructure is Poor 1 0
Government Should Do More to Support Culture
1 0
5 Business
Assistance Programs
No Knowledge of City Business Assistance Programs
5 0
Does not Use Business Assistance Programs 2 0
Makes Use of City Business Assistance Programs
3 1
Makes Use of County Business Assistance Programs
1 0
Provides Access to Intellectual Capital 1 2
Useful for Networking, Relationships and Business Expansion
1 1
Reevaluate Programs to Delineate Curriculum 1 0

162
6 Universities
Support Formation of Human Capital 9 2
Support Innovation 3 1
Students are More Driven 0 1
Need for Improvement in Partnerships with Business Community
3 0
Students Need Training in Teamwork 1 0
Did Not Detect Efforts 1 0
7 Human Capital
Employees Often Lack Soft Skills 3 0
Employees Often Lack IT Skills 2 0
Insufficient Quantity of Qualified Applicants in City
5 0
Sufficient Quantity of Qualified Applicants in Market
7 0
Quality is Improving 0 2
8 Financial Capital
Access to Financial Capital Remains Constrained
5 0
Access to Financial Capital is Improving 4 1
Expansion of Community Banks 2 1
Conservative with On Hand Financial Capital 4 2
9 Brand
Promotion
Government is Effective in Promoting Events 3 1
Government is Effective in Promoting Outside of Market
2 2
No Knowledge of Promotion Efforts 4 0
Establishing a Market Niche has been a Challenge
7 0
More Resources for Promotion is Required 5 0
Homelessness is Compromising the City's Brand
2 0
Culture is the City's Greatest Advantage 6 2
Promote Friendliness of the Business Community
0 2

163
10 Economic
Development Planning
Importance of Living, Working and Playing in the City
7 0
Business Community Needs to Participate 4 2
Creative Class 3 1
Note. The code system is indexed in accordance with the 10 stakeholder perceptions that influence entrepreneurism. Sub codes were developed through inductive data analysis in conjunction with an iterative review of one-to-one interview and focus group session transcripts.

164
APPENDIX I
Focus Group Co-occurrence Model
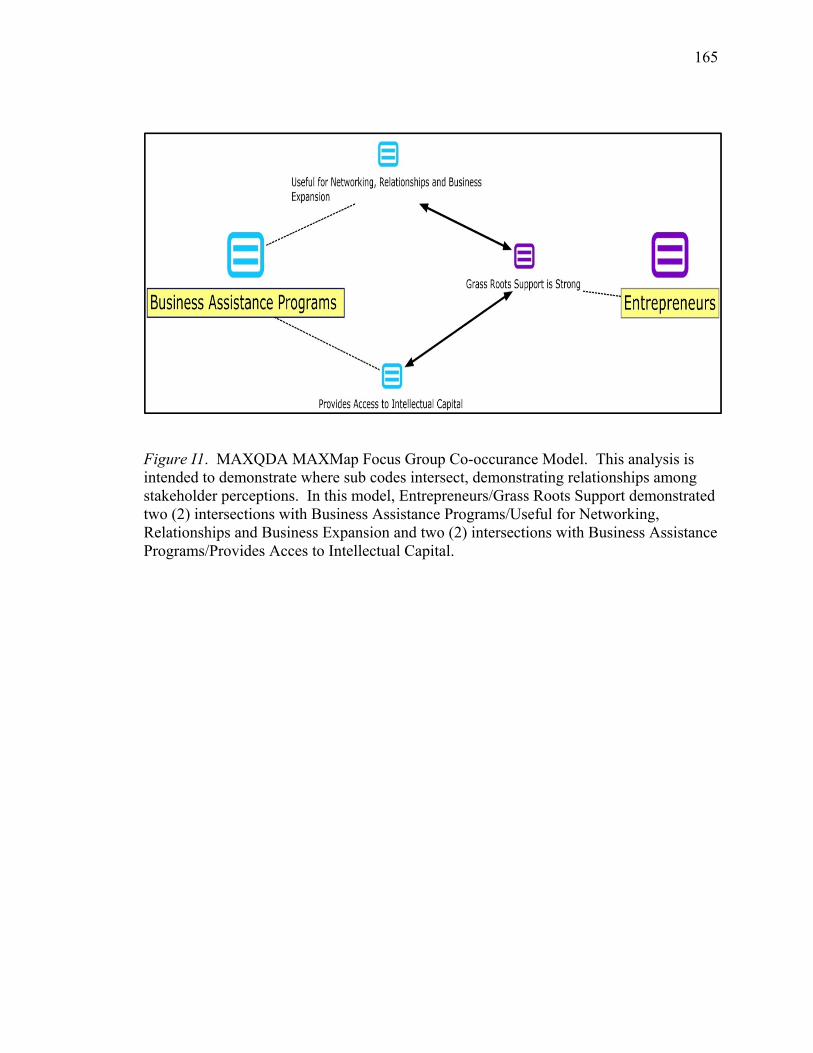
165
Figure I1. MAXQDA MAXMap Focus Group Co-occurance Model. This analysis is intended to demonstrate where sub codes intersect, demonstrating relationships among stakeholder perceptions. In this model, Entrepreneurs/Grass Roots Support demonstrated two (2) intersections with Business Assistance Programs/Useful for Networking, Relationships and Business Expansion and two (2) intersections with Business Assistance Programs/Provides Acces to Intellectual Capital.


