Implementing IT Financial Analysis
88
Implementing IT Financial Analysis Susana Semedo Velez Dissertação para obtenção do Grau de Mestre em Engenharia Informática e de Computadores Júri Presidente: Prof. José Manuel Nunes Salvador Tribolet Orientador: Prof. Miguel Leitão Bignolas Mira da Silva Vogal: Prof. José Manuel Costa Dias de Figueiredo Novembro 2010
Transcript of Implementing IT Financial Analysis

Implementing IT Financial Analysis
Susana Semedo Velez
Dissertação para obtenção do Grau de Mestre em
Engenharia Informática e de Computadores
Júri
Presidente: Prof. José Manuel Nunes Salvador Tribolet
Orientador: Prof. Miguel Leitão Bignolas Mira da Silva
Vogal: Prof. José Manuel Costa Dias de Figueiredo
Novembro 2010


Agradecimentos
Ao meu orientador, Prof. Miguel Mira da Silva, pelo apoio, disponibilidade epreciosas sugestões que ajudaram a levar este trabalho a bom porto.
À minha família, fonte de força, inspiração e boa-disposição. Bem sei que umalinha aqui não é muito, mas é um começo.
Ao Nuno, pela presença nas muitas horas de desabafos e pelos risos e alegriaspartilhados nas restantes.
Aos meus amigos, que me lembram que a vida é um recreio, que há tempo paratudo e que todos os dias trazem uma nova experiência.
Ao Carlos, pela infinita paciência a responder-me.
Ao grupo do SAS, pela disponibilidade e apoio.
Ao Marco e respectivo grupo, que seria de mim sem o vosso tempo e atenção?
A todos os mais que influenciaram a minha vida, um muito obrigado pelas ex-periências que partilharam comigo e as aprendizagens que me proporcionaram.
i

ii

Abstract
The highly competitive scenario in the enterprise world associated with the dif-ficult world economic situation drives organizations’ top management to reducecosts. This specially affects IT, since its budget is very often hard to justify.To reduce costs successfully and with long term consequences it is necessaryto know where the real costs are. To that effect there are several cost modelsavailable.
The problem addressed in this thesis is that although there are cost models thatcan identify IT costs, namely Activity-Based Costing, it does not handle directcosts, which also contain a fair amount of information, and models that operatewith direct costs do not cope with indirect costs.
The proposal to solve this problem is based on a hybrid cost model that combinesthe advantages of both and therefore provides better cost information. In orderto test the hybrid cost model a prototype was developed and data from a realorganization was used.
The results obtained with the prototype led to the conclusion that this proposalmakes it possible to determine the cost of activities using both direct and indirectcosts.
Keywords
Activity-Based Costing, Cost Reduction, Cost Model, ITIL Financial Manage-ment
iii

iv

Resumo
O cenário de grande competitividade empresarial, associado à complicada situ-ação económica mundial leva os gestores de topo a querer reduzir custos. Osdepartamentos de Sistemas de Informação são especialmente afectados por estasituação, uma vez que o seu orçamento é, muitas vezes, difícil de justificar.Para a redução de custos ser feita com sucesso e consequências positivas a longoprazo é necessário saber onde se concentram os verdadeiros gastos e para essefim existem modelos de distribuição de custos.
O problema que esta tese pretende endereçar é que apesar de existirem modelosde custeio que conseguem identificar os custos dos departamentos de Sistemasde Informção, nomeadamente o Activity-Based Costing, este não consegue lidarcom os custos directos, que também contêm grande quantidade de informação eos modelos que operam com custos directos não conseguem lidar com os custosindirectos.
A proposta para resolver este problema consiste num modelo de custeio híbridoque combina as vantagens dos dois tipos de modelos e portanto dá mais e melhorinformação sobre custos. De modo a testar o modelo de custeio híbrido foidesenvolvido um protótipo e foram usados dados de uma organização real.
Os resultados obtidos com o protótipo levam-nos a concluir que esta propostafaz com que seja possível determinar o custo de actividades usando tanto custosdirectos como indirectos.
Palavras-Chave
Activity-Based Costing, Gestão Financeira do ITIL, Modelo de Custeio, Reduçãode Custos
v

vi

Contents
Agradecimentos i
Abstract iii
Keywords . . . . . . . . . . . . . . . . . . . . . . . . . . . . . . . . . . iii
Resumo v
Palavras-Chave . . . . . . . . . . . . . . . . . . . . . . . . . . . . . . . v
Contents vii
List of Figures xi
List of Tables xiii
List of Acronyms xv
1 Introduction1
1.1 Problem Summary . . . . . . . . . . . . . . . . . . . . . . . . . . 3
1.2 Research Methodology . . . . . . . . . . . . . . . . . . . . . . . 4
1.3 Proposal Summary . . . . . . . . . . . . . . . . . . . . . . . . . 6
1.4 Document Structure . . . . . . . . . . . . . . . . . . . . . . . . . 7
vii

2 Related Work 9
2.1 IT Financial Management . . . . . . . . . . . . . . . . . . . . . . 9
2.1.1 Budgeting . . . . . . . . . . . . . . . . . . . . . . . . . . 11
2.1.2 Accounting . . . . . . . . . . . . . . . . . . . . . . . . . . 12
2.1.3 Charging . . . . . . . . . . . . . . . . . . . . . . . . . . . 13
2.2 Cost Models . . . . . . . . . . . . . . . . . . . . . . . . . . . . . 14
2.2.1 Direct Method . . . . . . . . . . . . . . . . . . . . . . . . 15
2.2.2 Activity-Based Costing . . . . . . . . . . . . . . . . . . . 17
2.3 Critical Analysis . . . . . . . . . . . . . . . . . . . . . . . . . . . 21
3 Problem 23
4 First Research Cycle 27
4.1 Diagnosing . . . . . . . . . . . . . . . . . . . . . . . . . . . . . . 28
4.2 Action Planning . . . . . . . . . . . . . . . . . . . . . . . . . . . 28
4.3 Action Taking . . . . . . . . . . . . . . . . . . . . . . . . . . . . 28
4.4 Evaluating . . . . . . . . . . . . . . . . . . . . . . . . . . . . . . 30
4.5 Learning . . . . . . . . . . . . . . . . . . . . . . . . . . . . . . . 31
5 Second Research Cycle 33
5.1 Diagnosing . . . . . . . . . . . . . . . . . . . . . . . . . . . . . . 35
5.2 Action Planning . . . . . . . . . . . . . . . . . . . . . . . . . . . 35
5.3 Action Taking . . . . . . . . . . . . . . . . . . . . . . . . . . . . 36
5.4 Evaluating . . . . . . . . . . . . . . . . . . . . . . . . . . . . . . 39
5.5 Learning . . . . . . . . . . . . . . . . . . . . . . . . . . . . . . . 40
viii
6 Proposal 41
7 Prototype 47
7.1 Technology . . . . . . . . . . . . . . . . . . . . . . . . . . . . . . 47
7.2 Data Model . . . . . . . . . . . . . . . . . . . . . . . . . . . . . 47
7.3 Main Functions . . . . . . . . . . . . . . . . . . . . . . . . . . . . 48
7.4 Interface . . . . . . . . . . . . . . . . . . . . . . . . . . . . . . . 49
8 Third Research Cycle 55
8.1 Diagnosing . . . . . . . . . . . . . . . . . . . . . . . . . . . . . . 55
8.2 Action Planning . . . . . . . . . . . . . . . . . . . . . . . . . . . 55
8.3 Action Taking . . . . . . . . . . . . . . . . . . . . . . . . . . . . 55
8.4 Evaluating . . . . . . . . . . . . . . . . . . . . . . . . . . . . . . 61
8.5 Learning . . . . . . . . . . . . . . . . . . . . . . . . . . . . . . . 62
9 Conclusion 63
9.1 Future Work . . . . . . . . . . . . . . . . . . . . . . . . . . . . . 64
9.2 Publications . . . . . . . . . . . . . . . . . . . . . . . . . . . . . 65
Bibliography 67
ix

x

List of Figures
1 Main priorities for organizations in 2010 (IDC, 2010a). . . . . . . 2
2 Charge the activity or the client? . . . . . . . . . . . . . . . . . . 4
3 The Action Research cycle (Baskerville, 1999). . . . . . . . . . . 5
4 ITIL v2 overview (OGC, 2005). . . . . . . . . . . . . . . . . . . . 10
5 Service Delivery overview (OGC, 2005). . . . . . . . . . . . . . . 11
6 The Activity-Based Costing method (Hicks, 2002). . . . . . . . . 20
7 Benefits of using ABC in various areas (Turney, 1990). . . . . . . 21
8 Cost attribution using the Direct Method. . . . . . . . . . . . . . 24
9 Cost attribution using ABC. . . . . . . . . . . . . . . . . . . . . . 25
10 Costs by month from the Financial Management System (Mendes,2009). . . . . . . . . . . . . . . . . . . . . . . . . . . . . . . . . . 27
11 Direct and indirect costs in the Financial Management System(Mendes, 2009). . . . . . . . . . . . . . . . . . . . . . . . . . . . . 29
12 Service costs in the Financial Management System (Mendes, 2009). 29
13 Direct and indirect costs in Customers in the Financial Manage-ment System (Mendes, 2009). . . . . . . . . . . . . . . . . . . . . 30
14 The conceptual model of SAS ABM (SAS, 2009a). . . . . . . . . 34
15 A conceptual cube of SAS ABM (SAS, 2009a). . . . . . . . . . . 34
16 The DSI model in SAS ABM. . . . . . . . . . . . . . . . . . . . . 36
17 Different types of costs in SAS ABM (model view). . . . . . . . . 37
18 A cube representing a cost flow, from Cost Type to Customers(cube explorer view). . . . . . . . . . . . . . . . . . . . . . . . . 38
xi

19 Cube intersecting the Supplier and Cost Type dimensions (graphview). . . . . . . . . . . . . . . . . . . . . . . . . . . . . . . . . . 38
20 Direct costs in a cube that intersects customer and service di-mensions (grid view). . . . . . . . . . . . . . . . . . . . . . . . . . 39
21 Theoretical model for the proposal. . . . . . . . . . . . . . . . . . 41
22 Activity costs after the first step of the distribution. . . . . . . . 43
23 Product cost after distributing the direct cost. . . . . . . . . . . 43
24 Cost allocation using the hybrid model. . . . . . . . . . . . . . . 44
25 Hybrid model with 4 levels. . . . . . . . . . . . . . . . . . . . . . 45
26 Data model for the prototype. . . . . . . . . . . . . . . . . . . . . 48
27 The cost attribution screen. . . . . . . . . . . . . . . . . . . . . . 50
28 Cost flow for IC (table view). . . . . . . . . . . . . . . . . . . . . 50
29 Cost flow for IC (graph view). . . . . . . . . . . . . . . . . . . . . 51
30 Cost flow for DC (graph view). . . . . . . . . . . . . . . . . . . . 51
31 Product flow for P1 (table view). . . . . . . . . . . . . . . . . . . 52
32 Product flow for P1 (graph view). . . . . . . . . . . . . . . . . . 52
33 Direct and indirect costs from Company X. . . . . . . . . . . . . 57
34 Sample of activity costs for Company X. . . . . . . . . . . . . . . 57
35 Project costs for Company X. . . . . . . . . . . . . . . . . . . . . 57
36 A Company X direct cost flow. . . . . . . . . . . . . . . . . . . . 58
37 Company X indirect cost flow. . . . . . . . . . . . . . . . . . . . 59
38 A product flow from Company X. . . . . . . . . . . . . . . . . . . 60
xii

List of Tables
1 Department costs for the Direct Method example. . . . . . . . . 15
2 The Direct Method (Stinson, 2002). . . . . . . . . . . . . . . . . 16
3 Organization costs for the ABC example. . . . . . . . . . . . . . 19
4 Cost drivers for the ABC example. . . . . . . . . . . . . . . . . . 19
5 Activity drivers for the ABC example. . . . . . . . . . . . . . . . 19
6 Costs for the example for Section 3. . . . . . . . . . . . . . . . . 23
7 Cost drivers for the example for Section 3. . . . . . . . . . . . . . 24
8 Activity drivers for the example for Section 3. . . . . . . . . . . . 25
9 Activity costs from the three tools. . . . . . . . . . . . . . . . . . 61
xiii

xiv

List of Acronyms
ABC Activity-Based Costing
ABC/M Activity-Based Costing/Management
ABM Activity-Based Management
CIO Chief Information Officer
DC Direct Cost
DSI Direcção de Sistemas de Informação
DW Data Warehouse
ERP Enterprise Resource Planning
IC Indirect Cost
IS Information Systems
IT Information Technology
ITIL Information Technology Infrastructure Library
xv


1 Introduction
“ Beware of little expenses: a small leak will sink a great ship.”
- Benjamin Franklin
Financial matters assume a highlight position in organizations’ affairs. Organi-zations are faced with the challenge to adapt to rapid changes in the environmentand to use their resources as efficiently as possible, in order to gain competitiveadvantage.
According to an IDC1 survey, financial departments recognize that IS play animportant part in the organizations welfare (IDC, 2010b) by providing meansto obtain management information that can improve the quality of the deci-sions. This situation challenges CIOs to contribute to the business’ good per-formance, as they must deliver high-quality services, improve IT contributionto the business and innovate, but always under the constraint of having to re-duce costs (IDC, 2010a), especially basic operating expenses, which representapproximately 70% of IT budgets (Cullen & Murphy, 2008).
Reducing costs is a priority for most organizations, as shown in Figure 1. Thispriority is reflected through all the organizational units and IT is no exception.Funding to IT has been decreasing (IDC, 2008) and according to a CIO Exec-utive Council2 survey, 40% of CIOs reported that they were under "very high"or "significant" pressure to reduce costs (Rosenbaum, 2006).
1http://www.idc.com/2http://council.cio.com/
1

0% 10% 20% 30% 40% 50% 60% 70%
Product/ Service Inovation
Process Inovation/Automation
Client Service
Operational EBiciency
Reduce Costs
Increase ProBit
2008
2009
2010
Figure 1: Main priorities for organizations in 2010 (IDC, 2010a).
It is still important to note that organizations are no longer trying to reducecosts to stay afloat, but as an attempt to make business grow, by still providingquality services with lower funding, which means doing more with less (IDC,2010a).
The first step to reduce costs in any sector, but in IT in particular, is to un-derstand these costs. It is not possible to address a problem that one is notfamiliar with. As such, it is not possible to reduce costs effectively and withlong-term results if one does not know where to save (Gruman, 2006). Withouta deeper knowledge of costs, the plans to reduce costs will most likely lead tocuts in areas that will affect the organization’s performance (Michaels, 2008).
Therefore, we reach a pivotal point: to reduce costs it is necessary to knowthem. It is necessary to understand expense flow to be able to make decisionsthat have impact in the future (Gruman, 2006). It is necessary to manage andcontrol costs. This situation makes it imperative to determine the products andservices provided by IT and determine their cost, to finally be able to nurturea transparent IT, where cost and value are perfectly defined (Cameron, 2002;EMA, 2009). In the case of IT, this identification and control is harder to do,since most costs are indirect costs (Silva & Martins, 2008), that is, the costscannot be fully attributed to a single client, product or service.
2

ITIL is a set of concepts and practices for IT management, development andoperations. Included in the various topics that ITIL addresses is IT FinancialManagement (OGC, 2005). ITIL defends that IT financial management shouldbe done in four main steps, among which can be found IT accounting. Thisprocess enables an organization to calculate the costs of providing IT serviceswith the use of a cost model.
From the various existing cost models there is one, Activity-Based Costing(Hicks, 2002), that best fits this purpose. By associating activities with theuse of specific IT resources (Cameron, 2002), Activity-Based Costing techniquesare capable of distributing IT costs in an effective and exact manner (Mendes,2009).
However, there are several questions to take into consideration. Activity-BasedCosting is a cost model that deals quite well with indirect cost, but an orga-nization does not exclusively incur in indirect costs. Direct costs are a sourceof information that an organization cannot ignore, just as indirect costs cannotbe overlooked. In a situation where an organization has both direct and indi-rect costs, which is the most common situation, how should it deal with them?Management wants to know how much it costs to perform an activity, whichimplies that Activity-Based Costing is needed, but it also wants to know whereto count the direct costs.
1.1 Problem Summary
The problem addressed in this thesis is that there isn’t a cost model that candeal with both direct and overhead costs. An organization cannot be limited touse solely Activity-Based Costing to define the value of its activities, since it isincomplete. Activity-Based Costing does not include direct costs, which repre-sent precious information. However, using a system of direct cost allocation iseven worse, since it cannot deal with the overhead costs, which represent a cru-cial part in the total cost. For example, if an item is bought by an organizationfor a certain client in the fulfilment of a certain activity, where should it count?For the client cost or for the activity, as depicted in Figure 2?
3

Figure 2: Charge the activity or the client?
If the expense counts only for the client, it will not be reflected in the activitycost. If the expense counts solely for the activity, then the information that thecost should be associated to a specific client is lost. The expense cannot countin both, otherwise it will distort the total cost, by counting the cost twice.
1.2 Research Methodology
The research methodology chosen to address this problem is Action Research.The reasons that led to this choice are directly related to the fact that thismethodology emphasizes the idea that it is possible to obtain better results byintroducing changes in the processes that are being studied and observe theeffects of those changes (Baskerville, 1999; Avison et al. , 1999). This way theresearcher has the possibility to experience the problem as its context evolveswithin the problem (Hunter, 2004). Also the importance given to the coopera-tion between the researcher and the people that contact with the problem is animportant factor, since without their support, the researcher will most certainlyfind a high resistance to change (Laudon & Laudon, 2007) that can compromiseor even prevent the investigation from happening. Also, the people that contactthe problem have profound knowledge about it that the researcher should usewhen applying changes to the environment (Baskerville, 1999). Action Researchis a cyclical methodology with 5 distinct phases, as depicted in Figure 3:
4

Specifying Learning
Diagnosing
ActionTaking Evaluating
Action Planning
Figure 3: The Action Research cycle (Baskerville, 1999).
1. Diagnosing: This phase corresponds to the identification of the problemsunderlying the organization’s desire to change and also the interpretationof the organizational problem. This analysis leads to the development oftheories about the nature and scope of the problem.
2. Action Planning: Involves the specification of the measures to be takento improve the problem. This phase includes the decision of the organiza-tional actions that will help to decrease the problem, that is, the planningof the actions to be taken.
3. Action Taking: In this phase, the actions planned in the previous phaseare implemented and monitored. The researcher intervenes in the organi-zation’s context, leading to changes.
4. Evaluating: The researcher determines if the implemented changes havedecreased or solved the problem. This evaluation is done by the researcherand the participants in the experience and determines if the theoreticaleffects that were expected, happened in fact and their impact on the prob-lem. If the changes were unsuccessful in diminishing the problem, it is
5

necessary to perform adjustments to both the plan and the theory aboutthe problem.
5. Specifying Learning: Finally, this phase corresponds to the documen-tation of the knowledge acquired during the investigation. In the caseswhere the taken actions were not effective with the problem, the obtainedknowledge should be used in the next Action Research iteration.
The fact that it is a cyclical process, allows the acquired knowledge in everycycle to be applied in the next cycle of the research.
1.3 Proposal Summary
To find a proposal to improve this situation three research cycles were held.
The first research cycle was done using a tool that was developed in the contextof a Master’s Thesis. The purpose of this iteration was to evaluate a simpletool’s effectiveness in dealing with both direct and indirect costs.
The second research cycle was done using a professional tool and the purposeof this cycle was to explore the data exploration potentialities of that tool inseparating and evidencing the influence of both types of costs.
Both experiences were unsuccessful so a hybrid cost model was proposed thatcombines both the advantages of using Activity-Based Costing, which is theidentification of overhead costs, with the simplicity of a direct cost allocationmethod. This model was used as a foundation for the development of a proto-type that represents the theoretical model. The prototype was then used withdata from a real-world company, which provided material for the conclusionspresented.
The hybrid cost model represents the proposal to improve the problem intro-duced and this experience represents the third research cycle.
6
1.4 Document Structure
The next section of this document, Section 2, Related Work, focuses on thevarious topics necessary to understand the area of investigation.
The problem at hands in then clarified in Section 3, Problem. It is importantto note that the problem presented here is the basis for the diagnosing phasesfor all the research cycles.
The following two sections represent two cycles of the research methodology.Section 4 is the First Research Cycle and Section 5 represents the Second Re-search Cycle.
The following sections represent the third, and last, research cycle. The diag-nosing phase is represented by the already mentioned Section 3. The actionplanning phase is represented by Section 6, Proposal, and here is where theproposal for improving the problem is presented. The next section, Section7, Prototype, represents the action taking phase and is dedicated to the pro-totype that implements the solution presented in the previous section. Thesection that follows, Section 8, Third Research Cycle, reviews all the phases ofthe research methodology for this cycle and adds the evaluation and specifyinglearning phases. This section includes the description of the experience heldin a real-world organization to validate the solution presented, as well as thecorresponding results.
Finally, Section 9, Conclusions, presents the conclusions of this thesis, as wellas future work and publications related to this topic.
7

8
2 Related Work
In order to fully understand the problem at hands and to formulate a relevantproposal, there are two topics of great interest to this investigation. The first isIT Financial Management and the second is Cost Models.
2.1 IT Financial Management
Financial management is about raising capital for business operations and thecarefully considered use of that capital. IT financial management can be inter-preted as the financial management responsibilities and activities relating to IT(Sottini, 2009). IT financial management is a deeply explored subject in thecontext of ITIL.
The IT Infrastructure Library (ITIL) is a vast documentation of best prac-tices for IT service management (OGC, 2005). It is a best practice frameworkthat describes how IT resources should be organized to deliver business value,documenting the processes, functions and roles of IT Service Management. Themotivation for the development of ITIL lies in the recognition that organisationsare becoming increasingly dependent on IT in order to satisfy their corporateaims and meet their business needs. This leads to an increased requirement forhigh quality IT services.
ITIL consists of a series of books giving guidance on the provision of qualityIT services, and on the accommodation and environmental facilities needed tosupport IT. Over 30 books where published since it was originally produced, inthe late 1980’s. However, in order to make ITIL more accessible and affordable,the publications were consolidated into 2 books, Service Support and ServiceDelivery, with five principal elements, as shown in Figure 4. The elements are:
• the business perspective;
• managing applications;
• delivery of IT services;
• support of IT services;
9

• manage the infrastructure.
Deliver IT Services
The Business Perspective
Support IT Services
Manage the Infrastructure
Managing Applications
Figure 4: ITIL v2 overview (OGC, 2005).
The element of interest in this thesis is the delivery of IT services.
The delivery of IT services is addressed in the Service Delivery book. Thisbook looks at the services required by the business in order to provide adequatesupport to the business customers. The following topics are covered, as depictedin Figure 5:
• Capacity Management;
• Financial Management of IT Services;
• Availability Management;
• Service Level Management;
• IT Service Continuity Management.
10

Service Delivery
CapacityManagement
FinancialManagement
for IT ServicesAvailability
Management
Service LevelManagement
IT ServiceContinuity
Management
Figure 5: Service Delivery overview (OGC, 2005).
The focus of this investigation lies in the topic of Financial Management of ITServices.
As mentioned, organizations are becoming more dependant of IT services andthey are recognized as critical for the organization’s good performance. Theincrease of user demand has caused IT service costs to grow. By doing financialmanagement as suggested by ITIL, organizations are able to understand thecosts of providing a service and manage those costs in a professional manner(Sottini, 2009). It also increases confidence in setting budgets, provides accuratecost information to support IT investment decisions, leads to a more efficientuse of IT resources throughout the organization and increases professionalismof staff within IT.
This process comprises three activities. They are budgeting, accounting andcharging (OGC, 2005).
2.1.1 Budgeting
Budgeting is the process of ensuring that the correct finance is available forthe provision of IT services and that during the budgeted period they are not
11

overspent (OGC, 2005). A prediction for the period’s expense is done, typicallya year, and the effective costs are regularly monitored. The aim of this processis that the actual costs match the budgeted ones.
This process has enormous influence in both tactical and strategic plans. Assuch, it is necessary that budgeting is done with the business goals in mind andthat its communication to the organization’s management is done effectivelyand without conflicts. Budgeting includes periodic negotiation cycles betweenIT and other business departments, in which expense plans are defined andinvestment programs are discussed. The organization may impose restrictionsto IT budget, namely:
• limits on capital expenditure, as the purchase of hardware or software;
• limits on the operational expenditure, as staff costs, maintenance of com-puter hardware and software;
• limits on variance at any point in time, between actual and predictedspend;
• guidelines on how the budget must be used;
• limits on expenditures outside the organization;
• agreements on how to cope with exceptions.
Budgeting is an important process because it allows an organization to predictthe necessary funding to manage IT during a determined period of time, guar-antees that it is possible to compare actual with predicted spend at any timeand reduces the risk of overspending.
2.1.2 Accounting
Accounting is the set of procedures that enable IT to account fully for the waythe money is spent, particularly the ability to identify costs by client, service oractivity (OGC, 2005).
Accounting allows to determine the exact costs of resource usage with a highlevel of detail, such as CPU usage. However, the level of detail must be carefully
12

pondered otherwise the process of accounting may become too elaborate andwith costs that rapidly overcome the benefits. A way to calculate the costs of ITservices, in a somewhat simple fashion, is using a cost model. The cost modelshould provide cost information by customer in order to facilitate the chargingprocess. Accounting allows for an organization to:
• account for the money spent in providing IT services;
• calculate the cost of providing IT services to internal customers, such asother organization’s departments, or to external customers, as in outsourc-ing;
• perform cost-benefit or Return-on-Investment analysis.
This process is extremely important, since it provides management informationthat justifies the cost of IT services. This information is vital to guarantee thatthe quality of IT services is in accordance to the expenditures made to providethem.
2.1.3 Charging
As referred, accounting allows to calculate the total costs by business unit andthat information may, or may not, be used to charge the services to the respec-tive customers (Silva & Martins, 2008). Charging includes a set of proceduresthat allows IT to recover the costs of the services provided. The charging mech-anism must be:
• Simple: it should not add any more bureaucracy.
• Fair: each client should pay the same money for the same service.
• Realistic: the charging mechanism must be designed to achieve optimalbehaviour.
Charging allows to recover the costs of providing services directly from thecustomer that used them and operate IT as a business unit.
13
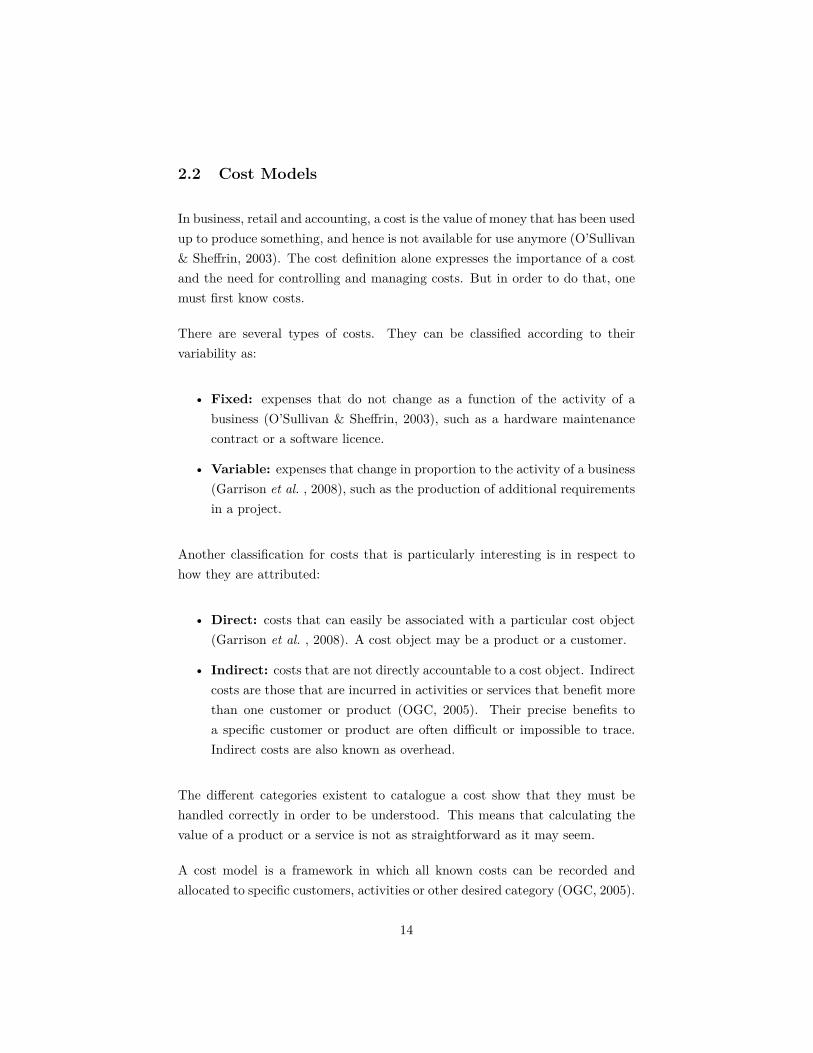
2.2 Cost Models
In business, retail and accounting, a cost is the value of money that has been usedup to produce something, and hence is not available for use anymore (O’Sullivan& Sheffrin, 2003). The cost definition alone expresses the importance of a costand the need for controlling and managing costs. But in order to do that, onemust first know costs.
There are several types of costs. They can be classified according to theirvariability as:
• Fixed: expenses that do not change as a function of the activity of abusiness (O’Sullivan & Sheffrin, 2003), such as a hardware maintenancecontract or a software licence.
• Variable: expenses that change in proportion to the activity of a business(Garrison et al. , 2008), such as the production of additional requirementsin a project.
Another classification for costs that is particularly interesting is in respect tohow they are attributed:
• Direct: costs that can easily be associated with a particular cost object(Garrison et al. , 2008). A cost object may be a product or a customer.
• Indirect: costs that are not directly accountable to a cost object. Indirectcosts are those that are incurred in activities or services that benefit morethan one customer or product (OGC, 2005). Their precise benefits toa specific customer or product are often difficult or impossible to trace.Indirect costs are also known as overhead.
The different categories existent to catalogue a cost show that they must behandled correctly in order to be understood. This means that calculating thevalue of a product or a service is not as straightforward as it may seem.
A cost model is a framework in which all known costs can be recorded andallocated to specific customers, activities or other desired category (OGC, 2005).
14

It is a very useful tool since it allows an organization to be able to calculatecosts, which in turn enables their control and management.
There are two cost models of particular interest to this problem and they arethe Direct Method and Activity-Based Costing.
2.2.1 Direct Method
The direct method is a very simple cost model. This model considers that orga-nizational units can generally be categorized as production departments, whichare directly involved in producing and distributing outputs, and service depart-ments, whose primary activity is providing services to other organizational units.The direct method allocates all costs to the production departments (Stinson,2002). It ignores service departments even if they play a part in providing ser-vices for production departments. All costs are directly allocated to outputs,bypassing any contributions, hence the term direct. The direct method usesallocation bases to distribute the costs of service departments (Caplan, 2009).There is no set criteria to choose the allocation base. The allocation base shouldbe what best relates the cost to its purpose, in this case, the production depart-ment.
As an example of the direct method allocation consider an organization withtwo production departments and two service departments. Assume that the de-partment costs come from the number of employees working in each departmentand from the rent of the space occupied by each department, as shown in Table1:
Table 1: Department costs for the Direct Method example.
15

Department A will have its costs allocated on the basis of number of employeesper production department, as seen below.
10 + 5 = 15
24.000 ∗ 515 = 16.000
24.000 ∗ 1015 = 8.000
In the same manner, Department B will have its costs distributed on the basisof space occupied by square metres (m2), as seen in the calculations below.
75 + 75 = 150
15.000 ∗ 75150 = 7.500
The direct method of allocating the organization’s service department costs tothe production departments is shown in Table 2.
Table 2: The Direct Method (Stinson, 2002).
16

Several aspects of this example should be carefully considered. Even thoughall departments have affected employees and occupy a determined area, thesenumbers are ignored when allocating service department costs using the directmethod. Only the amount of the allocation base of the production departmentsis used in the allocation, in this case the number of employees for DepartmentA and the area occupied for Department B. Another aspect to note is thateven if one of the service departments provided services to the other servicedepartment it would be ignored and its cost would still be allocated to theproduction department. The final aspect to note is that after all allocationshave been completed, all departmental costs are limited to the two productiondepartments.
For the purpose of this investigation a parallel can be established between servicedepartments and activities and production departments and products or clients,meaning that the direct method overlooks all activities existing between thecosts of the organization and its products.
Although this method is very simple and quite affordable for an organization toimplement, it is less accurate than other methods, precisely because it ignoresall that is between the cost and the output. This leads to distorted product andservice costs.
2.2.2 Activity-Based Costing
Activity-Based Costing (ABC) is a concept around which it can be constructedan economic model of the business that provides the accurate and relevant costinformation necessary to support business decisions of all types (Hicks, 2002).
The concept of ABC was developed in the late 80’s by Robert S. Kaplan andW. Bruns (Bruns & Kaplan, 1987). ABC emerged as an answer to competitivepressures, which showed that traditional accounting methods did not provideexact information (Cooper & Kaplan, 1988). While traditional methods addeda large margin of expense to direct costs in order to cover for the indirect,ABC attempts to establish a cause-effect relation between products or servicesand the activities that produce them. This way it is possible to identify whichactivities are causing the overhead and by discovering these activities, ABCalso highlights where the overhead can be controlled (Armstrong, 2002). The
17

use of ABC quickly alerted to the distortions inherent to traditional cost man-agement systems, which led to changes in strategies, processes, operations andconsequently, to improve the competitive advantage of organizations that usedit against organizations that did not (Turney, 1990; Affleck-Graves, 2001).
Using ABC is especially interesting in IT where there are many overhead costsand a broad variety of products and services, which is a fact that ABC copeswith quite well (Rau, 2005).
This model considers that costs are divided between direct and indirect. Directcosts are directly attributed to the respective products. As for indirect costs,they are attributed to activities and the activity costs are then attributed tothe outputs of those activities, namely the products. The characteristic featureof ABC is how the various costs are attributed, from indirect costs to activitiesand from activities to products. ABC looks at activities and tries to identifythe trigger that makes the workload increase or decrease. That trigger is calleddriver (Cokins, 2001). The driver is then used to express the activity’s contri-bution to the production of the output. An analogous process is used for costdrivers. The definition of drivers is a crucial task in ABC and it must be areflexion of the organization’s reality.
The methodology to apply ABC is as following (Hicks, 2002):
• Step 1: Identify and classify activities related to products/services pro-vided by the organization.
• Step 2: Determine costs for each activity identified in the previous step.
• Step 3: Identify the cost driver.
• Step 4: Divide total cost of each activity by products/services accordingto cost driver usage.
As an example, consider an organization specialized in two products. They areelectronic components and software applications. The activities performed bythis organization to be able to sell these products are sales calls, which consists ofcontacting new customers, and product shipping, which consists of shipping theproducts to the clients. The costs of this organization come from the employees’
18

salaries and the facility’s rent, which are both indirect costs and with the valuesindicated in Table 3.
Table 3: Organization costs for the ABC example.
Once the organization’s activities are defined it is then necessary to identify thedrivers. To assign the costs to the activities we will use the number of employeesper activity to distribute the salaries’ costs and the area occupied by activity todistribute the facility’s rent. Analyzing the activities, the factor that influencesthe workload of sales calls is the number of calls made, so that will be the chosendriver. As for shipping, what influences this activity is the number of packagesshipped so that will be the driver. All drivers for this example are shown inTables 4 and 5.
Table 4: Cost drivers for the ABC example.
Table 5: Activity drivers for the ABC example.
19

The ABC method of allocating costs is shown in Figure 6.
Figure 6: The Activity-Based Costing method (Hicks, 2002).
The advantages of using ABC include (Proctor et al. , 2006; Mendes, 2009):
• identifying unprofitable activities;
• identifying opportunities for cost reduction;
• allowing to perform a cost allocation which is closer to the business’ reality;
• helping in making better business decisions.
Besides the referred advantages, the information from ABC can influence otherbusiness areas (Zaman, 2009), as shown in Figure 7. For instance, the ABC in-formation used as the primary mean of decision support in the management andcontrol of enterprise performance is called Activity-Based Management (ABM)(Hixon, 1995). Activity-Based Management uses activity analysis to improveoperational and management control (Blocher, 2004).
20

Figure 7: Benefits of using ABC in various areas (Turney, 1990).
Still, there are disadvantages associated to the use of ABC (Proctor et al. , 2006;Mendes, 2009):
• expensive and difficult to implement and maintain;
• its complexity creates resistance to its use.
2.3 Critical Analysis
IT Financial Management as prescribed by ITIL should be done in a way thatIT can foresee its expenses, justify its expenditures, attribute them to a businessunit and generate financial reports that enable decisions in order to control andreduce IT costs. This way it would be possible to demonstrate that money isbeing spent the best way possible. The benefits of implementing this processwould be felt by the user, whom would get better services, by the customer,whom would get services that are aligned with the business and IT would havemore financial freedom and maybe even the possibility of turning money savedinto investments.
21

Although ITIL specifies how to do IT Financial Management, few are the organi-zations that have it implemented. In a survey by Evergreen, 78% of respondentsadmitted they did not approve ITIL implementations due to organizational re-sistance to change and 50% indicated the fact that ITIL’s value is not proven(Evergreen, 2006). In small organizations this situation is even more evident,since the high level of complexity makes the ITIL approach quite expensive.Still, there are indications on what is the route to follow to cost reduction,namely the indication of the use of a cost model to account for the costs in anorganization.
The Direct Method is the most common in organizations. It is simple andaffordable. However it is too simple to represent reality and that is where ABCtakes a step forward. ABC is a robust cost model that can cope with most ITcosts and there is vast literature on how to do it. But again, organizations arefaced with various obstacles trying to implement it, evidencing the fact thatthere is a gap between theory and reality.
There are several factors that inhibit ABC’s implementation, namely the lackof funding to support the maintenance of a future system and the complexityof the implementation of such a system. Still, according to a recent study,to understand how Portuguese companies deal with ABC, 22% admitted theyadopted this cost model. The reasons indicated for using ABC include thepotential to manage and reduce costs, gathering performance indicators andthe information to help decision making (Tomas et al. , 2008).
22

3 Problem
The need to reduce costs is present everywhere and IT departments are con-stantly faced with this challenge. To reduce costs it is necessary to know andmanage them. But IT departments are complex and it is difficult to distributecosts correctly and calculate an exact value of the services provided. ITIL sug-gests the use of a cost model, but which should be used? The majority of ITcost may be indirect, but there are also direct costs to consider.
The problem addressed in this thesis is that there isn’t a cost model that candeal with both direct and overhead costs. IT departments cannot be limited touse solely ABC to define the value of its activities, since it is incomplete. It doesnot include direct costs, which are a valuable source of information. However,using a system of direct cost allocation is even worse, since it cannot deal withthe overhead costs, which represent a crucial part in the total costs. In short,we want to find a way to deal with direct and overhead costs without havingtwo separate systems.
To better understand the limitations of both cost models, an example is in order.Consider a universe where there are two activities: Activity A and ActivityB. Consider also that there are two products: Product P1 and Product P2.Consider now a direct cost (DC) associated to P1 and an indirect cost (IC).The respective values are indicated in Table 6.
Table 6: Costs for the example for Section 3.
Using the Direct Method all we have to do is attribute these costs to the Prod-ucts. The result is as shown in Figure 8.
23

Figure 8: Cost attribution using the Direct Method.
Although simple enough, is far from accurate. The direct cost is easily allocatedto its correspondent product, but there is no defined way to treat the indirectcost, so in this case it was simply divided equally by all activities. One obviousdisadvantage is that there is no idea of what activities are performed or howmuch they cost. Therefore it is safe to say that this system does not provideenough information and does not fulfil the purpose of this investigation.
Now consider the same universe, where IC has a 50% driver for each activity.Activity A has a 70% driver for P1 and 30% for P2 and Activity B has a 50%driver for each product. This situation is depicted in Tables 7 and 8. The directcost was incurred while performing Activity A.
Table 7: Cost drivers for the example for Section 3.
24

Table 8: Activity drivers for the example for Section 3.
Using ABC, this example results in the situation depicted in Figure 9.
Figure 9: Cost attribution using ABC.
The products’ costs show the difference between both models, and althoughABC gives a more accurate figure, it is still not correct. By analysing closelyFigure 9 it is possible to see that Activity A receives costs from DC and IC,which add up to 450. This value is then distributed accordingly by both P1 andP2. This means that the contribution from DC is being allocated to P2 insteadof being totally attributed to P1. This situation proves that ABC also does notfulfil the purpose of this investigation although it is excellent in treating indirectcosts.
Therefore, we conclude that neither one of these cost models is complete enoughto solve the problem at hands.
25

26

4 First Research Cycle
The first research cycle is based on a Master’s Thesis developed in the academicyear of 2008/2009 with the purpose of controlling IT costs using ABC andsending to each business unit, on a monthly basis, the real costs of IT servicesused, separated by user and by service (Mendes, 2009). As a result, a toolthat implements ABC was developed and tested in the Direcção de Sistemasde Informação (DSI) of Turismo de Portugal. This tool was called FinancialManagement System and allows the user to manage budgets, costs, services andcustomers among other functions.
In order to implement the solution proposed in the referred Master’s Thesis itwas necessary the cooperation of the DSI by giving access to all the invoicesand the definition of services provided by the organization. The Financial Man-agement System registers the costs, that the user must identify as direct orindirect, and according to the information in the invoices, namely supplier andcost type, distributes the costs accordingly. The result of the distribution canbe consulted through graphs, as seen in Figure 10.
Figure 10: Costs by month from the Financial Management System (Mendes,2009).
The graphs in this tool highlight various figures, such as the cost of each serviceprovided by the DSI or even the cost by business unit.
27

4.1 Diagnosing
As mentioned in Section 3, the problem addressed in this thesis is that thereisn’t a cost model that can deal with direct and indirect costs.
In this iteration, the DSI is the universe studied. Using data form the DSI,the Financial Management System provides the costs for the services definedas well as for the customers by performing an ABC distribution. The problemin this context is not knowing how the direct costs are processed and how theyinfluence the calculation of the costs of services and customers.
4.2 Action Planning
This tool was chosen as a starting point to find a solution for this problembecause it is a simple implementation of ABC, which also considers direct costs.There was also the fact that it was possible to contact the person that developedthe work, including the Financial Management System, and therefore have moresupport.
A few meetings were held in order to understand the concepts and learn howto work with the Financial Management System. It is important to note thatthis implementation considers IT services as activities and customers instead ofproducts.
In the course of the meetings, we were able to gather the information neededto represent the context of the DSI in the Financial Management System. Thisinformation included the list of customers, services and gathering the invoicesnecessary. There was also the definition of which drivers to apply in each situ-ation.
4.3 Action Taking
The data gathered from the DSI was uploaded to the Financial ManagementSystem.
28

The various costs are listed and it is possible to distinguish the direct costs fromthe indirect costs, as seen in Figure 11.
Figure 11: Direct and indirect costs in the Financial Management System(Mendes, 2009).
At the service level, the direct costs have no influence in the service cost, asshown in Figure 12. The total cost of services is the sum of indirect costs.
Figure 12: Service costs in the Financial Management System (Mendes, 2009).
At customer level, the direct costs contribute to customer cost, and it is possibleto know the contribution from both direct and indirect costs, as seen in Figure13.
29
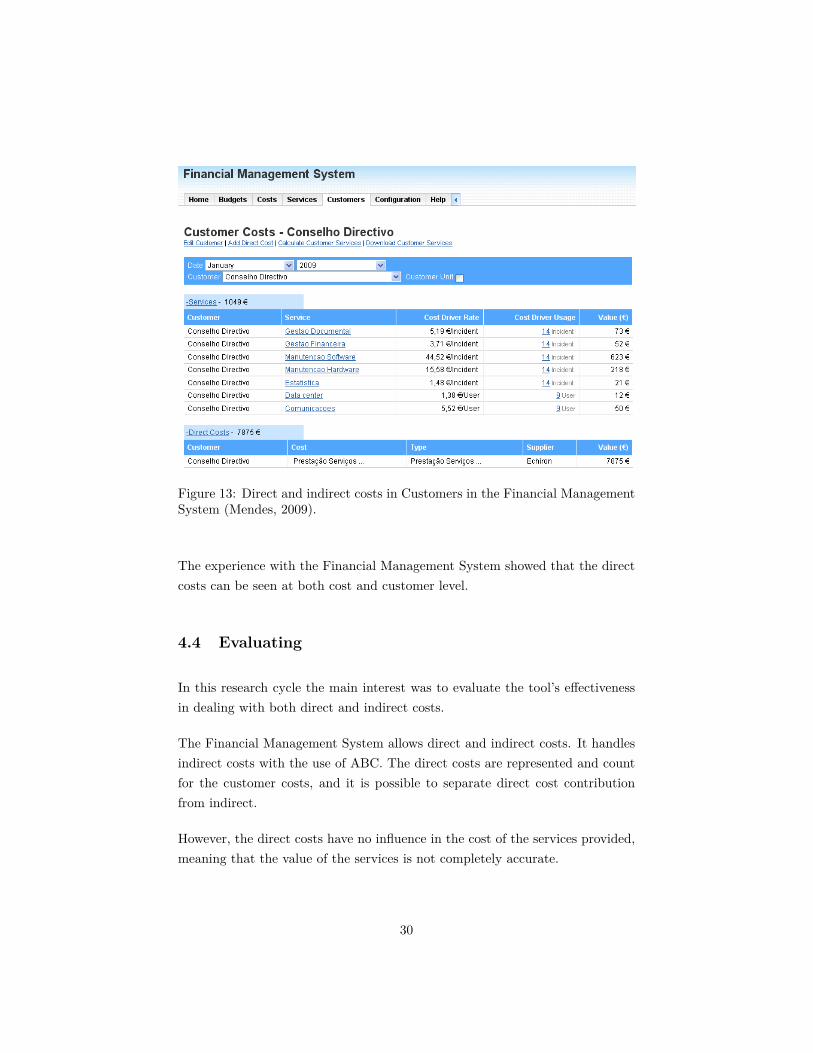
Figure 13: Direct and indirect costs in Customers in the Financial ManagementSystem (Mendes, 2009).
The experience with the Financial Management System showed that the directcosts can be seen at both cost and customer level.
4.4 Evaluating
In this research cycle the main interest was to evaluate the tool’s effectivenessin dealing with both direct and indirect costs.
The Financial Management System allows direct and indirect costs. It handlesindirect costs with the use of ABC. The direct costs are represented and countfor the customer costs, and it is possible to separate direct cost contributionfrom indirect.
However, the direct costs have no influence in the cost of the services provided,meaning that the value of the services is not completely accurate.
30

Furthermore, this system is somewhat limited when it comes to data exploration.It answers only the most direct questions. But by being simple, the FinancialManagement System was quickly learned and accepted by its users.
However its simplicity may be the reason why it cannot accommodate the directcosts, so for the next iteration, a more complex tool will be considered.
4.5 Learning
There are important notes to take from this experience. First, the fact that thisis a simple and effective implementation of ABC shows that it is possible to doit in a non-expensive manner. But most importantly this fact is valid not onlyfor ABC, but for any cost model implementation.
Furthermore, by being simple, a cost model implementation becomes more at-tractive to users, which is an important factor for success.
The success of the refered investigation proves that implementing a cost model,has great benefits when the focus is on the concept and not on the tool thatimplements it.
31

32

5 Second Research Cycle
There are several companies selling tools based on ABC and SAS3 is one ofthem. SAS is a company that intends to turn existing data into knowledgeallowing businesses to respond to changes. SAS offers several products in theFinancial Intelligence area and the point of interest resides here.
The fact that SAS has such a tool and favours an ABM approach seemed to makeit a favourable place to have a good experience. Therefore, SAS was contactedwith the purpose of studying its tool, the SAS Activity-Based Management.
SAS ABM
The SAS Activity-Based Management (SAS ABM) had its origin in the toolOROS, that was used to build cost models based on ABC. This software be-longed to a company named ABC Technologies, which was bought by SAS inApril 2002. OROS is no longer sold by SAS and became obsolete with thedevelopment of SAS ABM (Blocher, 2004).
SAS ABM is an analytic application that models business processes to deter-mine cost, profitability and drivers (SAS, 2009b). According to SAS, with thissolution it is possible to obtain better cost information that can be understoodby employees and not just finance experts, improve processes by identifying ac-tivities that don’t add value and evolve the way an organization does business.
SAS ABM has four conceptual modules, but for the purpose of this investigationwe will concentrate only on three. They are the Resource Module, the ActivityModule and the Cost Object Module. The Resource Module contains informa-tion about resource costs, the Activity Module contains information about workthat is performed within an organization and the Cost Object Module containsinformation about products and services. The three modules together form amodel, a representation of the organization. It is possible to associate thesemodules to ABC’s concept of cost, activity and product, respectively.
3http://www.sas.com/offices/europe/portugal/
33

Each module contains accounts. Costs flow through the model at the accountlevel, through assignments, as seen in Figure 14. This tool allows the user todefine drivers in order to make a more accurate model.
Figure 14: The conceptual model of SAS ABM (SAS, 2009a).
But what makes SAS ABM interesting is not the model. It’s the exploringpossibilities.
In this tool there are two fundamental concepts. The first is the concept ofdimension, which represents a description of components of an organization,and where dimensions intersect, unique opportunities for analysis exist. Thesecond is the concept of cube that is a conceptual container of dimensionalinformation (SAS, 2009a). The intersection of two or more dimensions creates acube, as seen in Figure 15, although a cube can have any number of dimensions.
Figure 15: A conceptual cube of SAS ABM (SAS, 2009a).
The cube describes dimensional relationships and gives the possibility of explor-ing those relationships through different views. There are three types of cubes
34
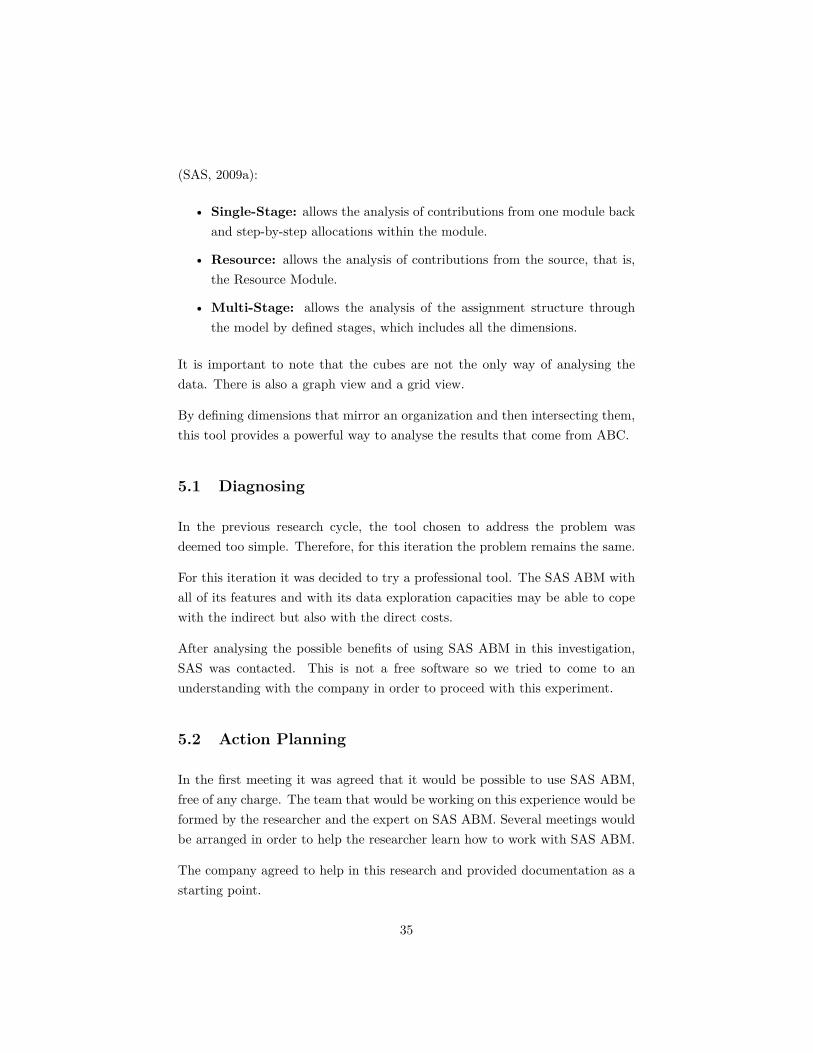
(SAS, 2009a):
• Single-Stage: allows the analysis of contributions from one module backand step-by-step allocations within the module.
• Resource: allows the analysis of contributions from the source, that is,the Resource Module.
• Multi-Stage: allows the analysis of the assignment structure throughthe model by defined stages, which includes all the dimensions.
It is important to note that the cubes are not the only way of analysing thedata. There is also a graph view and a grid view.
By defining dimensions that mirror an organization and then intersecting them,this tool provides a powerful way to analyse the results that come from ABC.
5.1 Diagnosing
In the previous research cycle, the tool chosen to address the problem wasdeemed too simple. Therefore, for this iteration the problem remains the same.
For this iteration it was decided to try a professional tool. The SAS ABM withall of its features and with its data exploration capacities may be able to copewith the indirect but also with the direct costs.
After analysing the possible benefits of using SAS ABM in this investigation,SAS was contacted. This is not a free software so we tried to come to anunderstanding with the company in order to proceed with this experiment.
5.2 Action Planning
In the first meeting it was agreed that it would be possible to use SAS ABM,free of any charge. The team that would be working on this experience would beformed by the researcher and the expert on SAS ABM. Several meetings wouldbe arranged in order to help the researcher learn how to work with SAS ABM.
The company agreed to help in this research and provided documentation as astarting point.
35

5.3 Action Taking
In the course of this experiment 3 more meetings where held.
During these meetings, several aspects of the tool’s functioning were clarifiedwith the expert. Moreover, these meetings were used to build a representationof the DSI in the SAS ABM. The model was built based on the documentationused in the previous iteration and was validated by the expert on SAS ABM. Themodel used reflected the same universe of the Financial Management System.The Resource Module has two dimensions: Cost Type and Supplier, since this isthe information that was used to aggregate cost in the previous tool. Separatingthe resources in two different dimensions would allow for more information to beextracted from the cubes. The rest of the modules have one dimension, whichconsists of Services and Customers, respectively.
Having defined the dimensions, the rest of the elements to complete the modelwhere the same as used in Section 4, namely the cost elements and the drivers.The resulting model is shown in Figure 16.
Figure 16: The DSI model in SAS ABM.
It is important to note that the time allotted by the researcher for this experiencewas not enough to design a model that would take advantage of all of SAS ABMfeatures, resulting in a simplified representation of the DSI.
After designing and calculating the model, the next step was to generate cubesto have more information. When calculating this model, the figures for the var-
36

ious modules matched the figures found for the different levels in the FinancialManagement System.
This model accepts direct and indirect costs. It is possible to assign a cost toa product, but being a simplified representation, it is not clear the distinctionbetween a direct and an indirect cost, as seen in Figure 17.
(a) A direct cost in SAS ABM.
(b) An indirect cost in SAS ABM.
Figure 17: Different types of costs in SAS ABM (model view).
In order to consult the flow of costs through the whole model, a Multi-StageCube is the best way to represent it, as seen in Figure 18.
37

/Users/fluffs/Tese/myThesis/myDissertation/figures/SAS_ABM_Cost_Flow.pdf
Figure 18: A cube representing a cost flow, from Cost Type to Customers (cubeexplorer view).
Using the cubes it was possible to have more detailed information, especiallyabout suppliers. The Resource Cube in Figure 19, shows the costs associatedto suppliers and cost types.
Figure 19: Cube intersecting the Supplier and Cost Type dimensions (graphview).
Even with an incomplete model, there are cubes that evidence the direct costs.
A Multi-Stage cube, intersecting Cost Type and Customer dimension showsthat the costs are not associated to a service, but to a customer.
Also the Single-Stage Cube, shown in Figure 20, highlights the customers thatreceive contributions from services and from costs.
38

Figure 20: Direct costs in a cube that intersects customer and service dimensions(grid view).
The experience with the Financial Management System showed that the directcosts can be seen at both cost and customer level.
Although the model of the DSI used in this experience limited the informationthat could be extracted from the cubes, it was still possible to detect directcosts in the various views.
5.4 Evaluating
The purpose of exploring SAS ABM was to understand if its data explorationpower could make it possible to separate and evidence the influence of bothtypes of costs in the service costs.
This tool allows both direct and indirect costs and SAS ABM gives the user awide range of possibilities. The fact that the user can use the cubes to explorethe data and is not limited to one view is quite an evolution from the usual costinformation. Also the possibility of having n dimensions within each moduleand the ability to intersect them is without a doubt a striking feature.
SAS ABM is a professional tool and the help of an expert makes a significantdifference for its users to be acquainted with and to use it in its full potential.
When modeling a business in SAS ABM, it is important to have a previousnotion of what to analyze. The dimensions are the foundation of the model
39

and must be defined from the start. However, an organization is not static andif a change happens, it might be significant enough to require the model tochange, namely change the dimensions previously defined. Although not verystraightforward, it is possible to add dimensions so that the model can stillreflect the organization it is representing.
The time reserved for this experience was not enough to design a model thatwould highlight all the benefits of using a professional tool, therefore the modelpresented here cannot cope with direct costs.
For the next iteration it was decided to try a new approach, one that involvedthinking of the problem from the beginning and propose the solution from thereand not from an existing system.
5.5 Learning
Two research cycles were done using ABC implementations. The first tool wassimple and easy to use and the second is a professional tool, more complex andwith great data exploration power.
The data exploration power is a good ally in ABC implementations, since themore powerful the tool, the better cost information is provided.
Furthermore, the way that information is presented is also a critical aspect. Byproviding different views and different formats, a tool can make informationmore accessible to viewers.
40

6 Proposal
At the light of the learnings from the previous experiences regarding the matterof this thesis, it was decided to try a new approach. This new approach con-sisted of designing a hybrid cost model that would fit best the purposes of thisinvestigation.
The theoretical model that supports this proposal is based on the ABC model.It consists of a sequence of levels. Drivers, as in ABC, relate each level to thenext. Although ABC only considers three levels, this model can be augmentedwith as many levels as needed, as long as there are drivers connecting them. Thecosts’ total is used as a control figure, to guarantee the distribution correctness.
Figure 21: Theoretical model for the proposal.
To achieve the correct distribution, we must first allocate direct costs. Directcosts have priority over indirect costs so that they can’t influence the ABCdistribution. In the first level it won’t be noticeable, but in the following levelsit can lead to distortions.
A direct cost has the indication of the instance in a level where it should count.It also has the information of all the instances in the previous levels where itshould count. This information is crucial to get a correct distribution. If wedon’t allocate direct costs first they will be distributed in ABC and won’t beentirely charged in the correct instance.
After direct costs are attributed we will proceed with the ABC distribution.The ABC will distribute all indirect costs to the right instances. The sum ofthe direct and indirect costs for each instance will give the cost of the instance.When distributing costs to the next level, we must repeat the same steps. First
41

we must allocate the direct costs, independently of where it was previouslyallocated and how the previous instance is related to the instances in the nextlevel. Then we continue with the ABC distribution, but before doing it, wemust note that part of the instances’ costs have already been distributed, so wemust subtract all the direct costs from the value of the instances and distributethe result of the subtraction. For the next level, we apply the same procedure.
There is one situation to highlight. When considering a direct cost, we knowthe output to which it should be associated but it may happen that the level ofthe output may not be last level in the model. This means that after attributingthe direct cost in the level of its output, since the direct cost is not associatedto any instance of the next level, it will be used in the ABC distribution alongwith the indirect costs.
As an example, consider a model with three levels, the first being the CostLevel, then the Activity Level and finally the Product Level. All drivers arerepresented as a percentage, although the model accepts other types of drivers,just like ABC.
Using the example from Section 3 we will perform a distribution using the hybridcost model. The Cost Level will have two instances: DC costing 200 and ICcosting 500, which amounts to a total of 700. The drivers’ quantities for IC are50% for each activity.
We will begin the distribution with the direct costs. That means DC is the firstto be assigned. Since it is a direct cost, it only has one activity associated andthat is Activity A. This activity now has a cost of 200.
The next step is distributing the indirect costs. As ABC indicates, the IC costis distributed for the various activities using the cost driver quantities indicated.This means that Activity A now has a cost of 450 and Activity B a cost of 250.Now that all costs are attributed we check the total cost in the Activity Level,which is 700, as shown in Figure 22.
42

Figure 22: Activity costs after the first step of the distribution.
For the next step of the distribution, it is known that Activity A has driverquantities of 70% and 30% for Product P1 and Product P2, respectively, andActivity B has driver quantities of 50% for each product. This is the point inthe distribution where the hybrid cost model differs from ABC. The direct costsare first attributed to their respective products, independently of the activitywhere they were attributed first. In this case, it means that P1 has a cost of200 that comes directly from DC, as seen in Figure 23.
Figure 23: Product cost after distributing the direct cost.
Now that all direct costs have been attributed using the Direct Method we haveto do the ABC distribution. When distributing Activity A, with a value of 450,
43

it has to be taken into account that part of that value was from DC. That meansthat the direct cost value has to be subtracted from the activity’s value thatis to be distributed. This means that Activity A will only distribute 250 of itsoriginal value in the ABC method. This results in P1 receiving a cost of 175and P2 receiving a cost of 75 from Activity A. Activity B has no direct costs inits value, so the total activity cost will be distributed. That means that bothproducts will receive a 125 cost from Activity B. The totals are now 500 for P1and 200 for P2, which add up to a total of 700. The complete distribution isshown in Figure 24.
Figure 24: Cost allocation using the hybrid model.
As another example, consider now a model with four levels: Cost, Activity,Product and Client Level. The conditions are the same as in the previousexample and the distribution up until the Product Level is as the one presentedin Figure 24. But here we have another level, the Client Level that hasn’treceived any cost yet. Following the same procedure as before, we distributethe direct costs first. We have DC, but DC is not associated to any client inthis level. Since its value is already associated with the correct output, which inthis case was P1, we no longer consider it a direct cost. Having no more directcosts to allocate we do the ABC distribution. In this case we will use the totalcosts of the products for the distribution. P1 has a 25% driver for Client C1and 75% for Client C2. As for P2, it has a 50% driver for both clients. Thisresults in the distribution depicted in Figure 25.
44

Figure 25: Hybrid model with 4 levels.
Analysing Figure 24 and Figure 25, it is possible to see that the proposed modelcan cope with both direct and indirect costs and does not suffer from the sameshortcomings of the Direct Method or ABC.
45

46

7 Prototype
In order to test the theoretical model a prototype was developed. The mainpurpose of this prototype is to test if the theoretical model is practical and ifit does in fact help in finding an activity’s true value. There were other factorstaken into consideration, namely the usability of the prototype so that real userscould later test it.
7.1 Technology
The prototype that follows was implemented in the OutSystems Agile Platform4.Several factors influenced the choice of this technology. The most importantwere the development time, which is shorter than with other technologies, thetime to learn, which is also shorter, and the fact that the resultant prototypeis a web-based application. That means that it only needs a browser to run,which makes it highly portable.
7.2 Data Model
The prototype is the implementation of the hybrid cost model with three levels.Although more levels are possible, it is simpler to begin with an implementationcloser to the classic ABC. The three levels are the same used in the previousexamples, namely Cost, Activity and Product Level.
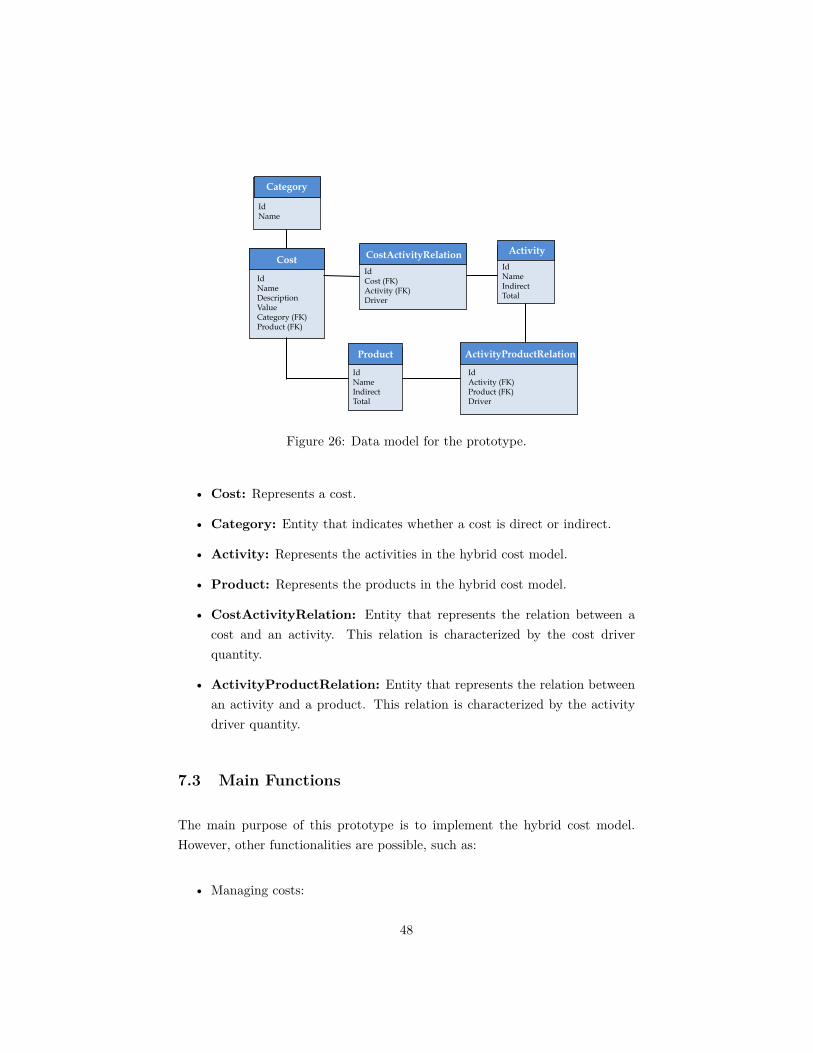
The data model for the prototype is shown in Figure 26 and comprises sixentities:
4http://www.outsystems.com/
47
Activity
IdNameDescriptionValueCategory (FK)Product (FK)
IdName
IdCost (FK)Activity (FK)Driver
IdNameIndirectTotal
IdNameIndirectTotal
IdActivity (FK)Product (FK)Driver
Category
Cost CostActivityRelation Activity
ActivityProductRelationProduct
Figure 26: Data model for the prototype.
• Cost: Represents a cost.
• Category: Entity that indicates whether a cost is direct or indirect.
• Activity: Represents the activities in the hybrid cost model.
• Product: Represents the products in the hybrid cost model.
• CostActivityRelation: Entity that represents the relation between acost and an activity. This relation is characterized by the cost driverquantity.
• ActivityProductRelation: Entity that represents the relation betweenan activity and a product. This relation is characterized by the activitydriver quantity.
7.3 Main Functions
The main purpose of this prototype is to implement the hybrid cost model.However, other functionalities are possible, such as:
• Managing costs:
48

◦ Add, update, remove and list costs;
◦ Attribute costs;
◦ Show a cost flow;
◦ Generate graphs.
• Managing activities:
◦ Add, update, remove and list activities;
◦ Attribute an activity’s cost;
◦ Calculate activity cost.
• Managing products:
◦ Add, update, remove and list products;
◦ Calculate product cost;
◦ Show a product flow;
◦ Generate graphs.
This prototype allows calculating accurately an activity’s cost and a product’scost and also provides two representations for cost flow and that is its mostimportant feature.
7.4 Interface
As mentioned, it is possible to calculate activity’s and product’s costs and havedifferent representations for cost flow.
In order to do these calculations it is necessary that the model is defined. Theuser must provide the activities and the existing products. The costs must alsobe provided and categorized as direct or indirect.
The user must also define the relations between levels. As in the examples givenin Section 3 and Section 6, the driver is considered to be a percentage, but it isnecessary to indicate its quantity. This means that the user must indicate it inorder to relate costs to activities, as seen in Figure 27, or activities to products.
49

Figure 27: The cost attribution screen.
When all data is inserted, the user only has to calculate the model.
Once the model is calculated, the user can consult the total costs in every level,but most importantly the user can choose to see the flow of costs. It is possibleto see the flow starting in a cost and observing its distribution, called a costflow, or choosing a product and observe which activities and costs contribute tothat product, a product flow. In both flows, the user can choose to see this inthe form of a table or a graph.
Resuming the example used in Section 6, if the user chooses to see the cost flowfor IC, the result will be the one in Figure 28.
Figure 28: Cost flow for IC (table view).
Analysing the table it is possible to see that IC is distributed for two activities,A and B, as the amount distributed. That cost is then distributed for twoproducts, P1 and P2. There is also the indication that this cost has no direct
50

influence in any product. Alternatively, the user can choose to see this in theform of a graph, and the result is shown in Figure 29.
Figure 29: Cost flow for IC (graph view).
The representation for DC is shown in Figure 30.
Figure 30: Cost flow for DC (graph view).
As it happens for costs, the prototype can show a product’s flow.
51

Again, using the example from Section 6, if the user chooses the product flowfor P1 the result will be the table seen in Figure 31.
Figure 31: Product flow for P1 (table view).
Analysing the table it is possible to see the costs from activities that contributedto the product’s cost, as well as the direct costs associated. Again, there is alsothe graph view available, as seen in Figure 32.
Figure 32: Product flow for P1 (graph view).
The different views give the user a broader perspective of the costs, since the user
52

can see the different costs flow through the model. The table view allows for amore precise analysis, giving the user exact values that can be used for reporting.The graph view is a representation that allows the user to be quickly aware of asituation, namely quickly identifying a major contributor for a product’s cost.This information is quite valuable and should be used when making businessdecisions related to IT financial management.
53

54

8 Third Research Cycle
This section describes the experience held in a real-world organization. Thisorganization wishes to remain anonymous, therefore it is referred to throughoutthis document as Company X.
8.1 Diagnosing
Company X is a company in the IT consulting and software development marketthat wanted to implement a cost model that would give better cost informationand was especially interested in ABC. They used the Direct Method to definethe cost of their products. This means that there was a lot of informationabout their products that could not be lost with the implementation of a newcost model. This company was a perfect example of the problem described inSection 3.
8.2 Action Planning
As soon as it was established that both parts had an interest in an experiencein Company X, it was decided that the researcher would spend a few weeksin the company. This would ensure contact with the problem. There wouldalso be daily meetings with management allowing a better understanding of theexpectations for this project.
At the light of the unsuccess of the previous experiences regarding the matter ofthis thesis, it was decided to try a new approach. This new approach consistedof designing a hybrid cost model that would best fit the purposes of this investi-gation and the company’s wishes. the hybrid cost model proposed is describedin Section 6.
8.3 Action Taking
Once the hybrid cost model was defined, the next step was to gather costs, froma certain period of time. It was also necessary to have a list of projects, but
55

the crucial part was to define a list of activities. Since this company used theDirect Method, the costs and the projects were easily accessed, but defining theactivities would be a more complicated task. As a starting point, the company’sERP was used. Company X has a project management system incorporated inthe ERP where employees indicate, for a certain period of time, the task theywere working on. This list was analysed with management and employees, andirrelevant tasks were eliminated. The remaining tasks were grouped into activ-ities, which were presented to management for validation. Another importantissue was the definition of drivers. Again, the ERP was of significant relevance.Using the information in the ERP it was possible to associate time to tasks,and consequently activities, therefore achieving a simple driver for the variousactivities. As for costs, the drivers were found through interviews that tookplace during meetings.
During the meetings with management the context where the model wouldfunction was also an important issue. The levels that were going to be usedhad to be decided in order to design a hybrid cost model, as the one proposedin Section 6, that would mirror Company X. The model was subject to thecompany’s management evaluation almost on a daily basis. This allowed themanagement’s feedback to be quickly incorporated in the proposed solution.
After a few more meetings, a suitable model was achieved and tested in Excelsheets. Once it was approved, it was decided to implement the model in theform of a more satisfactory prototype. The prototype is described in Section 7.
A sample of costs, which included direct and overhead costs, were used as inputfor the prototype.
Using the prototype it was possible to obtain information from both direct andoverhead costs. Both types of costs are listed and it is immediately possible tosee to which products the direct costs are associated, as seen in Figure 33.
56

Figure 33: Direct and indirect costs from Company X.
The prototype also showed the costs for the activities defined, as seen in Figure34. The costs for the activities were obtained from the distribution of indirectcosts using ABC and the contribution from direct costs.
Figure 34: Sample of activity costs for Company X.
It was also possible to obtain the cost of each project. The results can be seenin Figure 35.
Figure 35: Project costs for Company X.
Through the use of tables and graphs, it was possible to analyze the flow of adirect cost, as seen in Figure 36.
57

(a) Direct cost flow (table view).
(b) Direct cost flow (graph view).
Figure 36: A Company X direct cost flow.
In Figure 37 it is possible to see an indirect cost from Company X.
58

(a) Indirect cost flow (table view).
(b) Indirect cost flow (graph view).
Figure 37: Company X indirect cost flow.
Through the product flow it was possible to see what were the main costs foreach project, as depicted in Figure 38, and the identification of the amounts ascoming from direct or indirect costs.
59
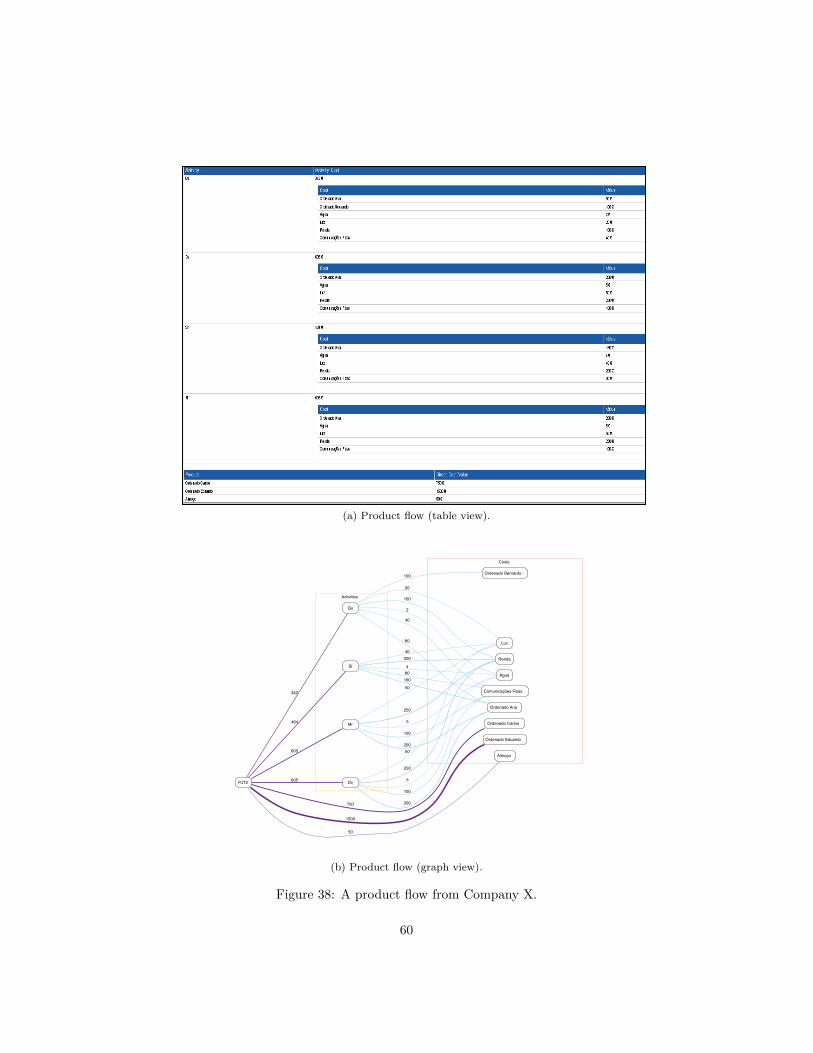
(a) Product flow (table view).
Activities
Costs
PJT2
Gs
342
Dv605
Sl
484 Mr
605
Ordenado Carlos
750
Ordenado Eduardo
1500
Almoço
50
Ordenado Ana
80
Ordenado Bernardo100
Água
2
Luz
20
Renda
100
Comunicações Fixas
40
200
5
50
250
100
160
4
40200
80
200
5
50
250
100
(b) Product flow (graph view).
Figure 38: A product flow from Company X.
60

The prototype showed the influence of direct and indirect costs throughout thewhole model.
8.4 Evaluating
The main purpose of this prototype was to test if the theoretical model is prac-tical and if it does in fact help in finding an activity’s true value.
The use of this prototype and the data from Company X allowed to see thedifferent contributions. Indirect costs were used and distributed with the useof ABC and direct costs are seen contributing directly for a product, but alsocorrectly contributing to the value of an activity. This type of information allowsthe company to define the correct value of its activities and products.
It is important to highlight that this model presents a higher cost for activitiesthan the previous tools presented, as seen in Table 9.
Table 9: Activity costs from the three tools.
The difference is caused by the contribution of direct costs in the cost of ac-tivities. The cost of products remained the same, since the previous systemsalready considered the contribution from direct costs in the products.
The fact that management was profoundly involved in the design of this modelwas a factor of success. Management, that also acts as a user, contributed withfeedback during the development, which was determinant in creating a real andpractical solution for the problem.
When evaluating this model, there were two perspectives taken into consider-ation. According to the researcher’s point of view, this is a successful hybrid
61

cost model, since it fulfils the main requirement, that is to deal with both typesof costs. The model copes with overhead costs performing an ABC distribu-tion and with direct costs associating them to the correct product and to anactivity. Also there is no duplication or loss of costs while calculating a correctdistribution.
According the client’s point of view, here Company X, the proposed hybrid costmodel is a contribution to solving the problem. It is a cost model based on ABCand with the advantages of ABC, namely the information that is extracted fromthe overhead costs, but that allows to maintain and use effectively the informa-tion they already had from the Direct Method. It is a simple implementationthat provides two different ways of visualizing the cost information. It alsoprovides a cost for the activities performed. With this information it is nowpossible to act on it.
8.5 Learning
The result of this research cycle is a hybrid cost model that copes with bothdirect and indirect costs. The overhead costs are distributed by performing anABC distribution and the direct costs are associated to the correct product andto an activity. Therefore, the proposed cost model is a contribution to solvingthe problem addressed in this thesis.
Another important learning from his experience is that understanding the prob-lem is the most important step in finding the solution. In the beginning of thisinvestigation, the problem was defined in theory, but there was no contact withit. Not being totally aware of the problem was an important factor in the out-come of the first two iterations. Not knowing for sure what to look for impairsthe capacity to act on it.
Finally, in this experience the client’s participation and feedback was determi-nant for the success of the hybrid cost model. So in order to find an effectivesolution, the client’s view is essential.
62

9 Conclusion
One of the biggest challenges for enterprises today, and IT specifically, is toreduce costs, but in order to reduce costs it is necessary to identify and controlthose costs. In IT it is not as straightforward as usual, since most IT costs areindirect costs, that is, the cost cannot be attributed to a single client, productor service.
ITIL provides a set of best practices for IT financial management, that includesthe use of a cost model to calculate all expenses. The cost models presented inthis study were the Direct Method and Activity-Based Costing.
The Direct Method is a simple and very affordable cost model, and is verycommon in organizations. However, this cost model is not accurate and leadsto serious distortions.
Activity-Based Costing is more complex than the Direct Method but whenimplemented correctly can give very accurate cost information. The problemwith Activity-Based Costing is that it can become quite complex and expensiveand overlooks the information from direct costs.
Both methods have shown limitations when it comes to deal with the type ofcosts that organizations have to deal with on a daily basis: direct and indirect.The problem addressed in this thesis is that there isn’t a cost model that candeal with both direct and indirect costs and therefore there isn’t a model thatcan give true accurate cost information.
A first experience with an existing tool called Financial Management Systemwas conducted in order to understand the best way to incorporate direct costin an ABC implementation. This experience was important to highlight that itis feasible to implement ABC without much expense and with a simple tool.
Another experience was held with the SAS ABM tool. This tool implementsABC and has a wide range of views that allow the extraction of more infor-mation than the Financial Management System, regarding the same amount ofdata. This experience was important to understand that information should beavailable in different formats in order to make it more accessible.
63

In order to solve the problem addressed in this thesis, a hybrid model wasproposed and a prototype was developed to evaluate that proposal.
This proposal was evaluated with data from a real-world company and it waspossible to determine the cost of activities, which were unknown before theexperience. It was also possible to obtain a cost flow of some expenses andsome projects, which showed what were the main costs in the company. Thisexperience showed that activities without the contribution of direct costs areseriously undervalued. This last experience was considered successful from boththe researcher and the organization’s point of view.
Finally, the methodology chosen for this investigation, Action Research, provedto be a good choice because it makes the researcher contact with the problem.No one can truly understand a problem unless it has had contact with it. It isvery important to study a subject, but it is not enough if you don’t have anycontact with it in a real situation. It was only after being involved with theproblem and after contacting the people that were aware of the problem, thatthe problem became clear. It is crucial to be involved in the context of theproblem.
Moreover, Action Research supports the idea that to find a solution that canreally have a positive effect, the researcher has to talk to the clients. It iscrucial to understand what they need and what they want out of an experienceso that the researcher knows for sure that both parties can get what they want.By talking to and involving the clients in the designing of the solution, theresearcher can learn much more and make way for a true solution to come toexistence.
9.1 Future Work
As for the future, there are a few interesting topics that arise from this thesis.
The information provided by this cost model is as interesting as the capacity toexplore it. For that effect, there are Data Warehouses (DW) that are a subject-oriented, integrated, time-varying, non-volatile collection of data that is usedprimarily in organizational decision making (Inmon, 2005). By giving historical,
64

summarized and consolidated data (Chaudhuri & Dayal, 1997), the DW facili-tates the data analysis and reporting. Allied to the power of a multidimensionalanalysis, the information extracted from this cost model has immense potentialthat should be explored.
Another appealing subject would be to study the association of this cost modelwith profitability analysis. This has already been done with ABC (Harvey,2003) and it would interesting to see the results using a different cost model,since better cost information means that better decisions can be made in a firmto improve profitability (Wisner, 2009).
The topic of reducing IT costs is quite debated (McCartney, 2008; Michaels,2008; Paul, 2008; Weinberg, 2008) and it would be interesting to experiment,based on the information provided by the cost model, what would be the beststrategic measures to implement in order to achieve the best results.
Finally, a way to map IT costs with performance standards would be a a relevantaddition to this experience.
9.2 Publications
During the development of this work one paper was accepted in the followingconference:
• 10ª Conferência da Associação Portuguesa de Sistemas de Informação(CAPSI) 2010: “Reducing IT Costs”.
Also an article was submitted to the following journal:
• European Journal of Information Systems (EIJS): “Implementing IT Fi-nancial Analysis”.
65

66

Bibliography
Affleck-Graves, J. 2001. The impact of activity-based costing techniques on firmperformance. Journal of Management Accounting Research, January.
Armstrong, P. 2002. The costs of activity-based management. Accounting,Organizations and Society, 27(1-2), 99–120.
Avison, D., Lau, F., Myers, M., & Nielsen, P. A. 1999. Action Research. Com-munications of the ACM, 42(1), 94–97.
Baskerville, R.L. 1999. Investigating information systems with action research.Communications of the AIS, 2(3es).
Blocher, E. 2004. Cost management: A strategic emphasis. World Bank Publi-cations.
Bruns, W.J., & Kaplan, R.S. 1987. Accounting & management: field studyperspectives. Harvard Business School Pr.
Cameron, B. 2002. CIOs: Build IT Transparency Through ABC. ForresterResearch, December.
Caplan, Dennis. 2009 (November). Management Accounting Concepts and Tech-niques.
Chaudhuri, S., & Dayal, U. 1997. An overview of data warehousing and OLAPtechnology. ACM Sigmod record, 26(1), 65–74.
Cokins, G. 2001. Activity-based cost management: an executive’s guide. JohnWiley & Sons Inc.
Cooper, R., & Kaplan, R.S. 1988. Measure costs right: make the right decisions.Harvard Business Review, 66(5), 96–103.
Cullen, A., & Murphy, P. 2008 (July). Managing IT When Times Get Tough.
EMA. 2009. The Pressing Need for IT Cost Transparency.
Evergreen. 2006. Developing the Business Value of ITIL 2006 Survey Results.
Garrison, R.H., Noreen, E.W., & Brewer, P.C. 2008. Managerial accounting.McGraw-Hill/Irwin.
67
Gruman, G. 2006. Trimming Dollars. CIO, 19(18).
Harvey, R. K. 2003. New Technologies for Activity-Based Costing andCustomer/Product-Line Profitability Analysis. Value Associates, Ltd.
Hicks, D.T. 2002. Activity-based costing: making it work for small and mid-sizedcompanies. John Wiley & Sons Inc.
Hixon, M. 1995. Activity-based management: its purpose and benefits. Man-agement Accounting (CIMA), 73(6), 30–31.
Hunter, M.G. 2004. Qualitative research in information systems: An explorationof methods. The handbook of information systems research, 291–304.
IDC. 2008 (November). IDC Expects Worldwide IT Spending Growth to SlowSignificantly, But Remain Positive, in 2009.
IDC. 2010a (April). Novos Desafios dos CIO em Portugal: A Importância daGestão e Optimização dos Processos de TI.
IDC. 2010b (March). Novos Desafios no Desempenho Financeiro das Organi-zações em Portugal.
Inmon, W.H. 2005. Building the data warehouse. Wiley India Pvt. Ltd.
Laudon, J.P., & Laudon, KC. 2007. Management Information Systems: Man-aging the Digital Firm 10/E. Prentice Hal.
McCartney, L. 2008 (May). 5 Cost-Cutting Opportunities for CIOs.
Mendes, C. M. M. 2009. Controlo dos Custos Operacionais da Informática.M.Phil. thesis, IST.
Michaels, P. 2008 (November). A guide to cutting IT costs.
OGC. 2005. Service Delivery. TSO.
O’Sullivan, A., & Sheffrin, S.M. 2003. Economics: Principles in action. PrenticeHall, Upper Saddle River, NJ.
Paul, F. 2008 (November). Cutting IT Costs: Dos, Don’ts and Best Practices.
Proctor, R., Burton, N., & Pierce, A. 2006. Managerial accounting for businessdecisions. Financial Times/Prentice Hall.
68

Rau, K. 2005 (April). Activity-Based Costing for IT.
Rosenbaum, D. 2006. Cost Cutting. Again? CIO, 19(18).
SAS. 2009a. ABC Modeling Using SAS Activity-Based Management 6.4. CourseNotes.
SAS. 2009b. SAS Activity-Based Management Fact Sheet.
Silva, M. M., & Martins, J. S. 2008. IT Governance: A Gestão da Informática.FCA.
Sottini, M. 2009. IT Financial Management. Van Haren Pub.
Stinson, J.B. 2002. Cost Allocation: From the Simple to the Sublime. Manage-ment Accounting Quarterly, 4(1).
Tomas, A., Major, M. J., & Pinto, J. C. 2008. Activity-Based Costing andManagement nas 500 Maiores Empresas em Portugal.
Turney, P.B.B. 1990. Activity based costing. Hall, Johnson and Turney(ed.):“Measuring Up, Charting Pathway to Manufacturing Excellence”, Busi-ness One Irwin, Illinois.
Weinberg, N. 2008. Cutting IT Costs: Gartner Recommends 20 Can’t MissTips. CIO, October.
Wisner, P. 2009. Profitability Analysis Using Activity-Based Costing.
Zaman, M. 2009. The Impact Of Activity Based Costing On Firm Performance:The Australian Experience. International Review of Business Research Pa-pers, 5(4), 200–208.
69