IMPLEMENTING ACTIVITY-BASED MODELS IN VIRGINIA · Implementing Activity-Based Models in Virginia 1...
31
1 I MPLEMENTING A CTIVITY -B ASED MODELS IN V IRGINIA VTM Research Paper 09-01 July 2009
Transcript of IMPLEMENTING ACTIVITY-BASED MODELS IN VIRGINIA · Implementing Activity-Based Models in Virginia 1...

1
IIMMPPLLEEMMEENNTTIINNGG AACCTTIIVVIITTYY--BBAASSEEDD MMOODDEELLSS IINN
VVIIRRGGIINNIIAA
VTM Research Paper 09-01
July 2009

Implementing Activity-Based Models in Virginia
i
TABLE OF CONTENTS
Table of Contents ................................................................................................................................. i
List of Figures........................................................................................................................................ i
List of Tables ......................................................................................................................................... i
Chapter 1. Summary ............................................................................................................................1
Chapter 2. Transportation Models: A Brief Comparison ..............................................................2
Overview of Four-Step models ............................................................................................2 Overview of Activity-Based Models....................................................................................3 Benefits of Activity-Based Models.......................................................................................6
Chapter 3. Practical Implications of Implementing Activity-Based Models ...............................9
Chapter 4. Commercial Software Development............................................................................15
Chapter 5. Advanced Four-Step Modeling Techniques ...............................................................17
Chapter 6. Preliminary Cost Estimate.............................................................................................19
Chapter 7. Conclusion and Recommendations .............................................................................23
Appendix 1: List of Reviewed Documents and Materials............................................................24
Appendix 2: List Of Agency Correspondence...............................................................................25
Appendix 3: Summaries of Activity-Based Models .....................................................................26
LIST OF FIGURES
FIGURE 1. EXAMPLES OF “TOURS” ...................................................................................................................4
LIST OF TABLES
TABLE 1. CURRENT AND FUTURE ACTIVITY-BASED MODELS IN UNITED STATES ............................................12
TABLE 2. COMPARATIVE COST OF MODEL DEVELOPMENT ............................................................................21

Implementing Activity-Based Models in Virginia
1
CHAPTER 1. SUMMARY
Four-step travel demand models are widely used, and almost as widely lamented, throughout the United States. The Transportation Research Board (TRB) recently published Special Report 288: Metropolitan Travel Forecasting, Current Practice and Future Directions, which recommended that MPOs and other agencies using travel demand models begin to transition to more advanced model forms in order to respond effectively to new policy and planning requirements.
The Virginia Department of Transportation (VDOT) has for several years been actively updating the MPO models it maintains for all urban areas of the Commonwealth of Virginia outside of the Northern Virginia (the Washington, DC area). Recently, as part of the model update program, and in response to Special Report 288, VDOT’s travel demand modeling group and VDOT’s on-call travel demand modeling consultant, The Corradino Group, conducted research into the feasibility of implementing activity-based models in Virginia. In addition to reviewing recent published literature on the theory and practice of activity-based models, the research included interviews with agency staff in many of the areas in which activity-based models are being developed or used.
The present report summarizes the theory and practice of four-step models and activity-based models. The report assesses the costs and benefits of moving to an activity-based model framework, as well as practical concerns regarding the performance of such models.
In view of the difficulty associated with activity-based model development, and in light of a variety of theoretical and practical concerns, including unique characteristics of VDOT’s travel demand modeling program, this report recommends an incremental approach to advanced model development, including activity-based methods as these become standardized and more widely available. The proposed strategy for implementing advanced techniques includes approaches capable of meeting present and anticipated planning and policy challenges at VDOT and at MPOs in Virginia, while managing budgetary constraints, schedule requirements, and performance risks associated with cutting edge development projects.

Implementing Activity-Based Models in Virginia
2
CHAPTER 2. TRANSPORTATION MODELS: A BRIEF COMPARISON
The development of travel demand models began in the 1950’s, resulting rather quickly in the emergence of what has become known as the four-step model. To this day, the four-step model remains the most common modeling approach used to evaluate transportation plans and projects. According to its critics, the widespread use of the four-step model does not imply its superior efficacy, but that it is simply the most economical option, with respect both to data requirements and simplicity of operation. As a result of the perceived fundamental flaws associated with the four-step model, activity-based models have been advanced as alternatives, and in a few areas put into practical application.
OVERVIEW OF FOUR-STEP MODELS
A conventional four-step model is most readily defined by its four-steps: trip generation, trip distribution, mode choice, and assignment. As the first two steps imply, the basic unit of analysis in a four-step model is the individual trip. The trip generation step estimates where and how many individual person trips are produced and attracted, for each trip purpose - typically home-based work trips, home-based non-work trips, and non-home-based trips. The trip distribution step links the production end and attraction end of each trip between zones. The mode choice step establishes the type of mode each trip will use, ultimately converting person trips to vehicle trips, transit trips, and possibly non-motorized trips. The assignment step then places (or “assigns”) these trips on the transportation network based on parameters such as distance, speed, time, cost, and capacity.
The four-step model bases trip generation, trip distribution, and mode choice on socioeconomic and land-use data within the model area. Advanced versions of four-step models may also consider characteristics of the transportation network (such as tolls, parking costs, roadway capacity, or transit availability), and may include joint effects through feedback between the steps. Most models, including those used in Virginia, aggregate the input data at the level of the Transportation Analysis Zone (TAZ). Depending on the spatial density of the network, a TAZ could encompass a very large rural area with relatively low population and employment, or a very small urban area with relatively high population and employment. Typically, all of the individual household attributes are combined to create average socioeconomic characteristics for each TAZ. Although not common, four-step models can use a more disaggregate level than a TAZ-based structure, such as considering the attributes of individual households or groups of households through the analysis, similar to the preferred approach of activity-based models.
Four-step models consider the time-of-day in different ways. Many basic models simply use a 24-hour period and calculate daily trips, using an hourly capacity of the individual links to establish general capacity restraint across the networks. Others model peak periods or peak hours to better simulate actual network conditions and associated travel delays. In most cases, time-of-day factors are used to calculate either hourly, peak period, or daily volumes. Regardless, the time of day does not significantly affect whether the trip is made, but simply how it is assigned to the network.
As described, four-step models offer a proven and relatively simple approach to forecasting general travel demand, which in turn explains their prevalence. The relationships between the

Implementing Activity-Based Models in Virginia
3
steps are clear and the data requirements relatively manageable; however, this relative simplicity does not necessarily reflect the actual complexity of travel behavior.
Critics of four-step modeling practice believe that there are fundamental flaws associated with it that can only be rectified by implementing activity-based models. A summary of these concerns is documented in TRB Special Report 288: Metropolitan Travel Forecasting – Current Practice and Future Direction (SR 288) which argues that four step models often cannot effectively support analyses of contemporary policy concerns such as induced demand, alternative land use policies, vehicle emissions, freight movement, and non-motorized travel.
As noted in SR 288, four step models are not “behavioral in nature.” Rather they rely on statistical correlations between demographics and traffic patterns. Often, those correlations represent averages over long time periods, or broad areas. The result is that four-step models have difficulty reflecting small scale changes, dynamic effects, and changes in travel behavior that represent complex trade-offs of cost, convenience and time-savings under various constraints. Certain specific policy areas are identified in SR 288 as particularly difficult to represent in a four-step framework, including:
1. Time chosen for travel 2. Travel Behavior related to demand policies such as “road pricing, telecommuting
programs, transit vouchers, and land use controls” 3. Non-motorized Travel 4. Time-Specific traffic volumes and speeds 5. Freight and Commercial Vehicle Movements.
These policy areas are all significant for metropolitan travel models in Virginia, and the Virginia Transportation Modeling (VTM) program at VDOT is actively researching strategies to address them in our models.
OVERVIEW OF ACTIVITY-BASED MODELS
At present, although certain new modeling approaches have been implemented successfully within the four-step framework, the most common trend toward addressing these concerns is to shift toward activity-based model frameworks. In an activity based model, travel is derived from participation in activities and depends on the organization of those activities. Travel patterns are organized within activity-based models as sets of related trips known as “tours”. The socioeconomic characteristics of individual households are developed from survey data and other data sources, and are used to estimate household interactions and resulting travel patterns at a highly disaggregate level. The resulting model results can be aggregated in diverse ways to explore travel behavior in detail.
In contrast to four-step models, which use discrete trips as their standard travel unit, activity-based models analyze travel in sets called “tours” that have a coordinated structure. Tours are made up of multiple trips that are anchored at important starting and ending points, such as home or work. Figure 2.1 (Davidson, 2007) illustrates the tour concept.

Implementing Activity-Based Models in Virginia
4
shopping
HOME
worklunch
shopping
day-care
movies
libraryJourneys-to/from-work
Journeys-at-work
Other journeys
shopping
HOME
worklunch
shopping
day-care
movies
libraryJourneys-to/from-work
Journeys-at-work
Other journeys
HOME
worklunch
shopping
day-care
movies
libraryJourneys-to/from-work
Journeys-at-work
Other journeys Source: An Overview of Tour-Based Models, presentation made by PB at Southeast Florida FSUTMS User’s Group Meeting, November 2007
Figure 1. Examples of “Tours”
In this example, which shows four tours that an individual might make in a single day, one tour (in blue) starts at work and is made up of trips from work to lunch, lunch to shopping, and shopping to work, while another tour (in red) is made up of a trip from home to work, from work to day-care, and from day-care to home. The other two tours (in green) are tours made for entertainment (home to shopping, shopping to movies, movies to home) and personal utility (home to library and library to home).
One of the benefits of estimating tours rather than trips is that coordinated decisions within a household may be modeled comprehensively based on a wider set of influential factors. Thus, for example, the home-to-library tour might be taken as a separate tour as shown in Figure 2.1. But in another household with different vehicle availability and socio-economic characteristics, or with different accessibility to possible destinations, the library activity could become a stop along with shopping and movies, or a stop on the home-to-work tour, or perhaps not take place at all. Activity-based models will situate trips in tours based on the likelihood of the various possibilities given detailed socio-economic, land use and network characteristics.
In order to create tours, activity-based models typically synthesize a set of persons and households that are distributed based on the socioeconomic and demographic characteristics of the study area. While similar processes have been used in cross-classification trip-generation models within the four-step framework (where zonal population characteristics are disaggregated into more specific categories), using a population synthesizer permits the model to build consistent marginal distributions of a much wider range of population characteristics. Population synthesis also allows the model to propagate (and re-aggregate) these characteristics at later stages in the model, and to explore subtle travel effects such as the decision not to make a certain tour based on the experienced level of highway congestion that are more difficult to accommodate in the four-step framework.
Using synthesized population data, the activity-based model estimates tours (or trip patterns) using the specific socioeconomic details of the household along with time of day constraints, accessibility indicators, available modes of travel, and other factors. Once created, these activity patterns are used to establish the primary and secondary destinations of the trips within each tour. Compared to typical four-step models, an activity-based model expands the patterns observed in

Implementing Activity-Based Models in Virginia
5
an origin destination survey to the entire model region, and recognizes more of the details of those patterns in constructing future travel estimates.
Though some research has been conducted into using activity-based modeling approaches for freight and for travel other than household passenger tours, existing activity-based models typically limit themselves to household dynamics, and otherwise operate in a framework that has much in common with four-step models. In particular, the assignment step of existing activity-based models is performed by converting person tours to vehicle trips, aggregating those trips into trip tables, and assigning them to the highway and transit networks using equilibrium assignment, just as a four-step model would. A separate line of network modeling research, applicable to both activity-based and four-step models, has led to an approach known as dynamic traffic assignment (DTA), which intends to account for congestion effects that evolve over time. DTA uses a much more detailed representation of network characteristics, including turn lane capacities, intersection controls, and time-dependent demand to produce an estimate of travel demand across both space and time. VDOT is currently investigating the state of practice in DTA, and expects to implement this enhancement in future models where it proves beneficial and feasible to do so.
While the conceptual structure of the activity-based model is comprehensive and appealing, its complexity and relative novelty have limited its practical application. In fact, as noted above, existing activity-based models have typically been implemented by extending and replacing certain portions of the four-step framework, and they have not been implemented as a comprehensive replacement. The most famous, and the most ambitious, activity-based model, FHWA’s Transportation Analysis and Simulation System (TRANSIMS), has been in development for more than 15 years, but has yet to be used for anything greater than small-scale test projects involving only partial elements of its overall structure. The reasons for the slow deployment of activity-based approaches are discussed later in this report.

Implementing Activity-Based Models in Virginia
6
BENEFITS OF ACTIVITY-BASED MODELS
As noted above in the discussion of four-step models, certain transportation policy questions are difficult to address in a standard four-step framework. However, TRB Special Report 288 also notes that “there is no single approach to travel forecasting or set of procedures that is ‘correct’ for all applications or all MPOs.” The report recommends
Development and implementation of new modeling approaches to demand forecasting that are better suited to providing reliable information for such applications as multimodal investment analyses, operational analyses, environmental assessments, evaluations of a wide range of policy alternatives, toll-facility revenue forecasts, and freight forecasts, and to meeting federal and state regulatory requirements. [page 8]
While activity-based models do improve sensitivity to relevant factors in some important new policy areas, they are by no means a panacea, and even the most advanced of these models that have been implemented to date do not address all the concerns noted in SR 288. Moreover, while activity-based models promise specific advantages in some areas, there is still considerable debate as to how well these advantages can be realized in practice, and whether the cost of model development and maintenance can be justified.
Theoretical Benefits
Detail – Whereas most conventional four-step models base their forecasts on aggregate socioeconomic attributes of a transportation analysis zone (TAZ), activity-based models attempt, through various statistical strategies, to construct more detailed population distributions from available zonal data. Typically, to support this higher level of detail, activity-based models use much more highly disaggregate input data than four-step models, and often rely on parcel-based data to develop both residential and employment characteristics. Because activity-based models track person-level travel through the modeling process up to trip assignment, they support considerably more sensitive estimates of how various factors interact to influence overall trip-making.
Precision – In principle, the results of an activity-based model can also be examined at a very fine scale (down to the level of a household), although the statistical validity of such results is limited by the precision and variance of the input data. In addition, the impact of various policies on specific types of households can be examined explicitly at any point in the process, rather than attempting to recover those effects from aggregate results. Thus, for example, it would be just as easy to report statistics related to the travel impacts of increased tolls on households in a certain poor neighborhood as it would be to generate regional VMT estimates for all travelers. While some precision increase can be accomplished in four-step models using disaggregate data in the trip generation step, four-step models summarize that input to trip tables early in the process, losing considerable detail about the disaggregate impact of later steps in the modeling process such as trip distribution and mode choice.
Consistency – By virtue of their structure, activity-based models certainly create the opportunity to enforce greater consistency by requiring, for example, that tours begin and end at the same

Implementing Activity-Based Models in Virginia
7
location, such as the home or work place. Further, activity-based models allow direct modeling of how trips destined to primary destinations, such as work or school, are related to trips to secondary destinations such as shopping or recreation. Activity-based models can also more easily capture the interaction of departure times and the sequencing of trips, as well as the consistency of mode choice during the course of a tour, all of which are necessary in modeling time- and congestion-based phenomena such as peak spreading and trip suppression (where travelers choose not to make a trip because congestion or other factors make it too inconvenient).
Behavioral Realism – It is sometimes claimed that activity-based models represent travel behavior more realistically than trip-based four-step models. This claim comes in two forms, practical and theoretical. At a practical level, activity-based models may provide better sensitivity to various inputs and express more accurate statistical relationships between various input factors and modeled outcomes. The models thus may produce forecasts that more closely resemble what would actually take place were the model’s input scenario to occur in reality. Unfortunately, there is little concrete evidence presently available to substantiate this claim, though interesting practical research is underway, most notably a project sponsored by Ohio DOT to compare an activity-based model and its advanced four-step counterpart in Columbus (Anderson et al, 2009).
The more theoretical version of the behavioral realism claim stems from the assertion that activity-based models “simulate” behavior. Leaving aside the trivial sense in which all travel demand models attempt to simulate what would happen given certain new conditions, the claim that activity-based models simulate behavior has two main variants. First, activity-based models are commonly implemented as a set of discrete choice models and corresponding utility functions. From the perspective of rational choice theory, such models can be said to simulate behavior, because they are ostensibly analogous to actual behavioral processes. Such a claim is not well supported by psychological and econometric research, however (for an extensive discussion, see Friedman, 1996). Second, activity-based models often use statistical techniques such as drawing samples from an empirical distribution that are described as “simulation” due to the use of that term to characterize a method for estimating complex statistical models where an analytic solution is not available but the result could be “simulated” through numerical techniques (Train, 2003). However, the use of the term “simulation” in this sense does not actually make any claim regarding the realism of activity-based models.
Analytic Flexibility –Activity-based models, which present more consistent and detailed results and are sensitive to a wider range of inputs, create greater opportunities for testing policy alternatives or transportation demand management strategies. In this way, the model becomes a more comprehensive policy analysis tool, rather than a simply a traffic volume generator. Also, the household-based structure of activity-based models, as well as the desirability of using extremely disaggregate input data, allows these models to operate effectively in conjunction with land use forecasting models.
Practical Benefits
As noted earlier, there are five significant policy areas identified in TRB’s Special Report 288 in which major model improvements are required in order to provide effective policy support:

Implementing Activity-Based Models in Virginia
8
1. Time chosen for travel 2. Travel Behavior related to demand policies such as “road pricing, telecommuting
programs, transit vouchers, and land use controls” 3. Non-motorized Travel 4. Time-Specific traffic volumes and speeds 5. Freight and Commercial Vehicle Movements.
Each of these areas benefits to a greater or lesser extent from activity-based modeling strategies, as follows:
1. Time chosen for travel is often a complex function of intra-household demands such
as transporting children to school, negotiating work schedules with limited vehicles,
telecommuting, and limitations of transit availability. Fully capturing these joint
dependencies in relation to time chosen for travel is likely to be much more
straightforward in an activity-based framework.
2. Travel demand policies present a broad a wide range of possible modeling needs,
some of which can be partially handled using advanced four-step techniques. In
general, however, the level of specificity that activity-based models offer with respect
to variations in acceptable travel cost trade-offs across the population makes these
models particularly well suited to analyzing travel demand policies.
3. Non-motorized travel is a particularly thorny problem, since the environmental factors
that affect such travel often occur on a very small scale. For example, the absence of a
hundred feet of sidewalk along a major arterial can effectively eliminate pedestrian
travel to nearby destinations, yet such environmental effects are extremely difficult to
code into any type of travel demand model. To the extent that sufficiently detailed
input information can be made available (and forecast), activity-based models may be
more sensitive at a person-by-person level to non-motorized travel characteristics.
4. Modeling time-specific traffic volumes and speeds probably requires dynamic traffic
assignment (DTA), but DTA may be more effective in the context of activity-based
trip models, as those can more easily model the time of demand and thus incorporate
phenomena such as peak spreading. DTA is also a desirable component for analyzing
tolling strategies, and in particular, value pricing strategies where tolls vary over time
with the level of congestion. However DTA can work within both the four-step and
activity-based model frameworks.
5. Freight and commercial vehicle movements are not intrinsically easier to handle using
activity-based models. In fact, existing activity-based models have almost exclusively
modeled freight and commercial vehicles using the same techniques as four-step
models. The limiting factors in freight modeling have more to do with the sparse
availability of data, and with the absence of detailed knowledge about the factors that
influence freight and commercial vehicle movements, than they do with the overall
model framework.

Implementing Activity-Based Models in Virginia
9
CHAPTER 3. PRACTICAL IMPLICATIONS OF IMPLEMENTING ACTIVITY-BASED MODELS
VDOT has made a substantial investment in the development of a standardized four-step model program for Virginia. All current VDOT models are four-step models that have been developed using comprehensive household surveys conducted in accordance with federal guidelines. VDOT’s Policies and Procedures Manual (PPM) recommends using a four-step approach for all VDOT models and specifies that models should be cost effective and meet transportation planning needs and policy directions. All VDOT models fulfill these criteria and VDOT is currently updating all of its four-step models to reflect the most recent survey data and planning assumptions available, to conform to higher standards outlined in the PPM, and to respond to future planning and policy evaluation needs.
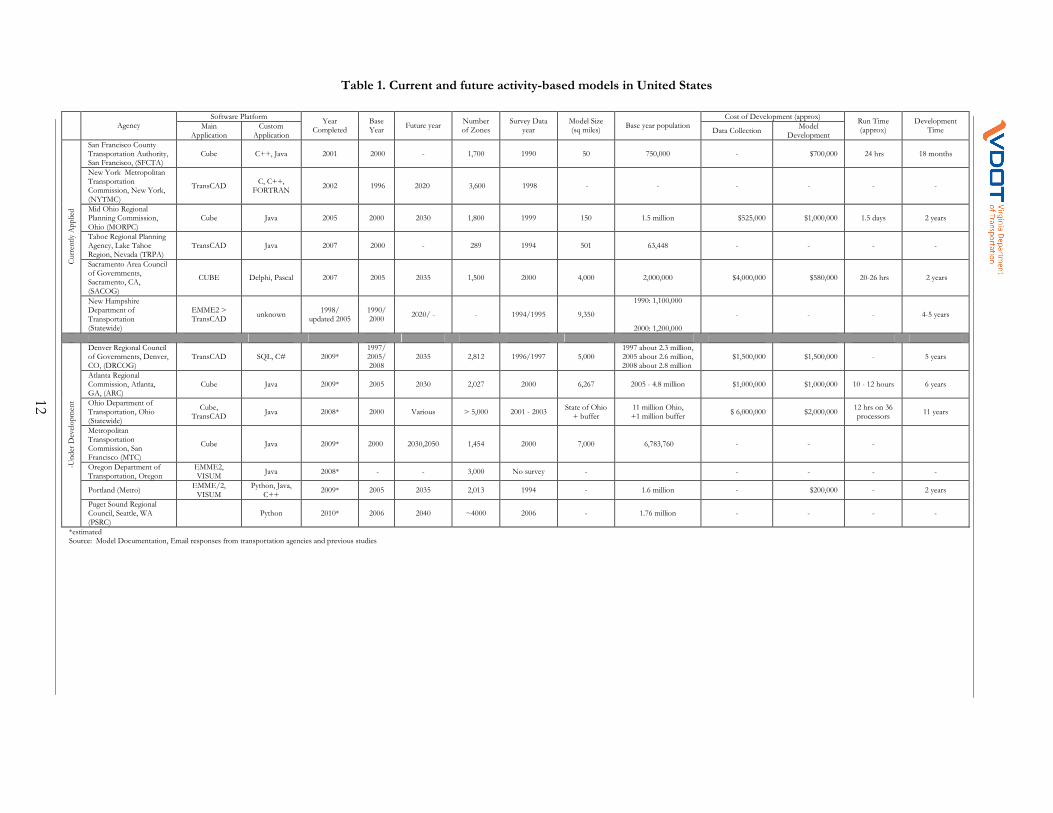
Given the cost of maintaining VDOT’s current modeling program, and the importance of keeping reliable, working models available for VDOT and MPO planning activities, it is critically important to consider all of the practical issues associated with implementing a comprehensive new strategy such as activity-based models. Research was conducted into the status and results of the most prominent activity-based model programs currently in practice or under development. Table 3.1 presents some basic information on these models, and Appendix A presents more detailed summaries of each model.
In essence, the major benefit of activity-based models is that these models reduce conventional model insensitivity by more precisely tracking the factors that influence trip-making patterns and coordinated trip-making behavior. The primary penalty for using this more detailed approach is a more complicated model. Several major practical constraints re-appear in activity-based model development, especially during the early stages of that development, as described below.
Data Requirements – Activity-based models require large amounts of detailed and accurate input data to estimate the characteristics of each individual and household, and to correctly evaluate accessibility across highway, transit and non-motorized networks. Most of the current activity-based models use the same Census Public Use Micro Data Sample (PUMS) data inputs as conventional models. Activity-based models, however, often require more detailed information not readily available from these sources, most notably household and transit surveys. A significant number of these models use parcel-based, rather than zone-based, land use data. Without this greater level of detail, many of the advantages of activity-based models are negated. In practice, overcoming or compensating for holes in data can be a major expense of model development. With the higher data requirements of activity-based models, the amount of time and effort needed for data gathering (travel survey, household survey) and quality control account for a major portion of the model development effort. Table 3.1 confirms the high cost of data development for these models. VDOT’s investment in the National Household Transportation Survey add-on program may reasonably be expected to mitigate some of these costs, but supplemental survey data would likely be required.
At an industry-wide level, recent trends in Census policies and data collection practices suggest that traditional census data will, at least in the near term, become considerably less detailed. For example, the Census has abandoned the long form in favor of the much more limited American Community Survey (ACS), and policy changes have made release of detailed small area tables
Implementing Activity-Based Models in Virginia
10
from either the ACS or the Census itself much more limited, to the point where only the largest urban areas will received detailed data tables through the Census Transportation Planning Package (CTPP).
The way travel demand modeling is presently organized in Virginia, data collection and data preparation for travel demand models are the responsibility of the MPOs that use these models. The MPOs have difficulty providing even the relatively limited data required by the existing four-step models. Thus, if VDOT unilaterally moves toward activity-based model frameworks, the cost of the required additional data development will fall on the regional partner agencies, and may create budget, schedule and staffing problems for those agencies. These problems will be compounded by the changes in Census policy just noted.
Forecast Requirements – Another factor to bear in mind is that activity-based models are just as dependent as four-step models on forecasts of future year land use and economic conditions. Thus, regardless of how correct the model is in the base year, there is additional uncertainty in future year data forecasts, and the uncertainty is not reduced by using an activity-based model. Also, activity-based models typically require much more detailed input data than four-step models. To address this problem, most of the agencies implementing activity-based models also either already have, or are jointly implementing, land use forecasting tools. Developing suitable disaggregate future land use forecasts for activity-based models using the manual approaches employed by most Virginia MPOs is quite likely impractical. At present, only one MPO in Virginia (FAMPO) is currently using a land use forecasting model, though others have expressed interest in learning about the available technologies. VDOT does not maintain any land use forecasting capability among its staff. Yet to adequately support the MPOs in preparing forecasts, and to ensure that the provided forecasts are technically correct, such capability would need to be developed.
Software Requirements – While major vender-supplied travel demand modeling software such as TransCAD, Cube, and EMME provide customization applications for conventional four-step model development, activity-based models require custom-written software that can be linked to the conventional model applications.1 Table 3.1 shows all of the models use custom applications written in C, C++, Java, or Delphi to implement the household synthesizing, activity generating, and tour making routines. The extended run-times shown in Table 3.1 further illustrate the complexity of these models. While the major software vendors are all developing components that will eventually internalize these functions, there is no certain horizon date for their release. Therefore, agencies interested in activity-based models must incorporate the costs and uncertainties of independent software development, as well as cost and staffing requirements for on-going model maintenance into their overall development plans.
Institutionally, custom software development at VDOT will also require either a culture shift, or a willingness to spend considerably more money for model maintenance than for the existing program. At present, our models are maintained as collections of scripts within a commercial
1 At the time of the writing of this report, Citilabs, the maker of Cube, had announced it would release an “off the shelf” tour based modeling setup during the Fall of 2009. This setup has not yet been evaluated or tested by an independent party.

Implementing Activity-Based Models in Virginia
11
travel modeling platform (Citilabs Cube). While all the existing four-step models can be maintained by VDOT’s model development staff, only one staff member is currently trained in computer programming at the level required to maintain custom activity-based models. Additionally, most Virginia MPOs would likely not have the staff resources needed to apply an activity based model developed and maintained by VDOT. VDOT policy calls for applications developed using professional software development tools to be managed through the Information Technology Division. However, knowledge of travel demand modeling techniques is not available within ITD. The result is that VDOT would likely have to depend on out-sourcing to consultants for model development and maintenance, adding considerable additional costs and quality-control challenges.
Staffing Challenges –The universal similarities of most conventional four-step models and widespread familiarity with the vendor software that they run on allow for a relatively straightforward introduction of new staff to operate and maintain such models. In contrast, the complexity of new, custom-built activity-based models makes staff expertise very difficult to acquire, retain and replace. This may result in the model’s primary benefits not being realized for lack of experienced staff to operate and maintain the model, and to ensure that the models are correctly applied by the MPOs. Relying more heavily on consultants to design, develop and maintain VDOT’s travel demand models will increase the cost of the travel demand modeling program. Yet VDOT will still need to retain suitably qualified staff in order to ensure that the consultant work is performed correctly, that the resulting models meet the needs of VDOT and the MPOs that VDOT supports, and to provide support to model users.
Development Time and Costs – While advances in model support such as FHWA’s Travel Model Improvement Program (TMIP), a widespread community of practitioners, and vendor-supplied modeling software have helped standardize four-step models, standard procedures for developing activity-based models have yet to emerge. Even where such models are attaining a certain de facto standardization as agencies adopt or adapt existing software in order to shorten the model development time and lower costs, it is not yet clear whether the resulting model systems are the best solution, or simply the most expedient. As a result, every activity-based model development effort shares the characteristics of a research project, including uncertain time and budget requirements. Table 3.1 shows that the time required to develop activity-based model averages several years, depending on the size of the model area and available funding. Development costs range from $200,000 for an experimental test model to $2,000,000 for a functional statewide model. TRB Special Report 288 suggests that the average development cost ranges between $1,000,000 – $1,400,000 dollars per model area depending on the size and population of the area. Developing an advanced four-step model in a comparably sized region is usually expected to cost about two-thirds as much.
12
Table 1. Current and future activity-based models in United States
Software Platform Cost of Development (approx)
Agency Main
Application Custom
Application
Year Completed
Base Year
Future year Number of Zones
Survey Data year
Model Size (sq miles)
Base year population Data Collection
Model Development
Run Time (approx)
Development Time
San Francisco County Transportation Authority, San Francisco, (SFCTA)
Cube C++, Java 2001 2000 - 1,700 1990 50 750,000 - $700,000 24 hrs 18 months
New York Metropolitan Transportation Commission, New York, (NYTMC)
TransCAD C, C++,
FORTRAN 2002 1996 2020 3,600 1998 - - - - - -
Mid Ohio Regional Planning Commission, Ohio (MORPC)
Cube Java 2005 2000 2030 1,800 1999 150 1.5 million $525,000 $1,000,000 1.5 days 2 years
Tahoe Regional Planning Agency, Lake Tahoe Region, Nevada (TRPA)
TransCAD Java 2007 2000 - 289 1994 501 63,448 - - - -
Sacramento Area Council of Governments, Sacramento, CA, (SACOG)
CUBE Delphi, Pascal 2007 2005 2035 1,500 2000 4,000 2,000,000 $4,000,000 $580,000 20-26 hrs 2 years
Currently Applied
New Hampshire Department of Transportation (Statewide)
EMME2 > TransCAD
unknown 1998/
updated 2005 1990/2000
2020/ - - 1994/1995 9,350
1990: 1,100,000
2000: 1,200,000
- - - 4-5 years
Denver Regional Council of Governments, Denver, CO, (DRCOG)
TransCAD SQL, C# 2009* 1997/2005/2008
2035 2,812 1996/1997 5,000 1997 about 2.3 million, 2005 about 2.6 million, 2008 about 2.8 million
$1,500,000 $1,500,000 - 5 years
Atlanta Regional Commission, Atlanta, GA, (ARC)
Cube Java 2009* 2005 2030 2,027 2000 6,267 2005 - 4.8 million $1,000,000 $1,000,000 10 - 12 hours 6 years
Ohio Department of Transportation, Ohio (Statewide)
Cube, TransCAD
Java 2008* 2000 Various > 5,000 2001 - 2003 State of Ohio + buffer
11 million Ohio, +1 million buffer
$ 6,000,000 $2,000,000 12 hrs on 36 processors
11 years
Metropolitan Transportation Commission, San Francisco (MTC)
Cube Java 2009* 2000 2030,2050 1,454 2000 7,000 6,783,760 - - -
Oregon Department of Transportation, Oregon
EMME2, VISUM
Java 2008* - - 3,000 No survey - - - - -
Portland (Metro) EMME/2, VISUM
Python, Java, C++
2009* 2005 2035 2,013 1994 - 1.6 million - $200,000 - 2 years
-Under D
evelopment
Puget Sound Regional Council, Seattle, WA (PSRC)
Python 2010* 2006 2040 ~4000 2006 - 1.76 million - - - -
*estimated Source: Model Documentation, Email responses from transportation agencies and previous studies

Implementing Activity-Based Models in Virginia
13
Theoretical Drawbacks – While activity-based models may improve upon some of the limitations of conventional models, there are also questions regarding their theoretical assumptions and whether the benefits promised by these models can be realized in practice.
One of the appealing aspects of activity-based models is that they appear to be modeling travel by “following people around”, rather than by making gross a priori generalizations about broad classes of people and types of travel. Yet for any real population, each day is necessarily different. What is of interest to planners and policy makers are not the outcomes of a single day (or even many single days), but rather our expectations regarding the most common outcomes, and our understanding of how those expectations shift in response to changes in the population, and in response to the travel and activity opportunities available to that population. In other words, we need generalizations but we would prefer them to be “precise” rather than “gross”. Reconciling the disaggregate specificity of the activity-based modeling project with the need to construct accurate generalizations about travel behavior and the factors that influence it presents a number of theoretical and practical challenges.
Further, because population synthesis and certain other steps in activity-based models are based on drawing samples from random probability distributions, the results of all major calculations, including the generation of households, activity patterns, and trip tours, will potentially be different every time the model is run. The result is that final network assignments will also potentially be different, and perhaps very different, for every model run. And there is no statistical guarantee that any of the outcomes of the different model runs represents the “most likely” or “expected” outcome, nor even that the expected outcome corresponds to the average of multiple model runs.
Both the theory and the implementations of activity-based models are intrinsically more complex than four-step models. While that complexity can make activity-based models more sensitive and responsive to a wider range of inputs, it also becomes more difficult to clearly identify the assumptions that the models are making. In the end, activity-based models can emerge as much “blacker boxes” than their trip-based four-step counterparts. Thus, establishing an activity-based model’s validity, its applicability for a certain policy or project analysis, or even its technical correctness, is a much more challenging problem than for a four-step model.
One of the important issues highlighted in Special Report 288 is that policy makers would like to know not just the model’s outcome, but also have an estimate of the uncertainty associated with the model’s forecasts. Because of their disaggregate nature, and the ability to summarize very detailed subsets of the modeled population, activity-based models present an illusion of extreme precision. Yet the precision obtained from such models cannot exceed the precision of their input data. Computations of variability of the model results based on the variability of the model’s synthetic population begs the question of how variability in the input data (and even the variability in the many possible synthetic populations that match the input data) might be reflected in the model’s output.
Verification of Benefits – Ultimately the goal of pursuing a new conceptual framework would be to achieve better results. However, the basic metric (improved performance) has yet to be

Implementing Activity-Based Models in Virginia
14
validated by substantial comparisons of the two modeling frameworks. In most cases, a new activity-based model is not developed in conjunction with an update of the previous four-step model, leaving no means for a direct comparison. In Columbus, Ohio, an older four-step model is being updated and validated to allow for such a comparison with a newly developed activity-based model, with no comparative results available as of yet. As reported at the 12th TRB Planning Applications conference (Anderson et al, 2009), substantial improvements are being made to the Columbus four-step model to ensure that any advantages observed reflect the difference between trip- and activity-based approaches, and not simply the fact that the trip-based model does not reflect best practices for such models. Lemp and Kockelman (2009) compared a conventional model with an activity-based model in the context of implementing tolls in Austin, Texas, but concluded that the comparison could not demonstrate that activity-based model “performed better or was more sensitive to the inputs.” With little definitive evidence either way, the rationale behind moving to activity-based models remains heavily dependent on theoretical assumptions of superiority, not actual, verifiable performance metrics.
Compatibility of Model Results – According to TRB Special Report 288, another source of agency reluctance to overhaul their modeling practice is that many plans and projects have been implemented based on traffic volume estimates from existing four-step models. The results of a new modeling approach may conflict substantially with previous model results, and as noted above, it can be quite different given the complexity of the activity-based modeling platform, to determine whether the differences reflect a better estimate, or simply the outcome of an alternate set of assumptions. Current projects for which funding has been secured could be jeopardized if the modeling practice on which they are justified is overhauled completely. Completed studies might have to be redone - at additional cost - using the results from new models to convince public and private entities to defend the appropriation of funds. Resolving these concerns will require that activity-based models be validated across multiple analysis years to demonstrate that their sensitivities are appropriate, particularly where they differ from trip-based models (whose simplistic trip generation is in this case an advantage, since the model can be validated against historical trends in VMT growth compared to basic socio-economic data).
All of the above issues related to developing activity-based models should not be underestimated. In fact, TRB Special Report 288 confirms that the major obstacles for agencies transitioning to activity-based models are the lack of vendor supplied software, lack of adequately trained staff, insufficient funding, and some tangible assurance that the investment of effort, time, and resources will actually produce better results.

Implementing Activity-Based Models in Virginia
15
CHAPTER 4. COMMERCIAL SOFTWARE DEVELOPMENT
Considering the sensitivity benefits that activity-based models propose to provide and given the strong advocacy for these models among academic researchers and model innovators working for consultants and various sponsoring agencies, it is clear that model development in this area will continue, and that a more standardized and better-supported platform for such models will eventually emerge. In fact, the most significant arguments against embarking on a development program in the near term are based on the reality that these models are still in a research-and-development stage, with all of the costs, uncertainty, and pitfalls associated with that process. A low-risk strategy would suggest delaying independent software development, and waiting for activity-based techniques to stabilize and for major software vendors to incorporate activity-based components into their software.
Three major modeling software vendors (Caliper, PTV, and Citilabs) were contacted regarding their development plans for activity-based components. All three vendors stated that they are investing time and money to incorporate such components into their software, however none has yet released a fully functional version of a disaggregate activity-based model. A summary of their responses is below:
PTV (VISUM). PTV has a built-in application for developing an aggregate tour-based model. While used extensively in Europe and Asia, PTV’s approach is very different from the emerging U.S. practice, but can be applied by someone with general modeling skills. The application is fully integrated with the VISUM software (including menu driven procedure-control) and may be a good fit for small and mid-size MPOs. One major reason why PTV’s application is not in use in the U.S. is that it is an aggregate model, whereas all advanced models in the U.S. use disaggregate activity-based models. While there is no theoretical requirement that activity-based models be constructed as disaggregate models using statistical simulation, there has been little serious consideration in the United States of activity-based models that do not have that structure. Consequently, PTV is working with experts in the field of disaggregate activity-based models to implement the disaggregate approach preferred in the U.S. into their software as well.
Caliper (TransCAD). Caliper reports that it is developing a "complete suite" of advanced practice/activity-based programs. However, there is no schedule for release of these components. The latest version of TransCAD (version 5.0) has a population synthesizer and a dynamic assignment routine, two common components of activity-based models that are also available from other vendors and also in open-source implementation. Caliper is also working on existing activity-based models (specifically, the New York Best Practice Model).
Citilabs (Cube). Citilabs is currently the software vendor for VDOT. Citilabs indicated that they have developed a set of complex scripts for activity-based modeling, which they intend to sell as a Cube component, but have not released yet. They plan to release this new project by Fall of 2009. According to Citilabs, the scripts are fully capable of being applied to small and mid-sized cities. The model approach does not have many household types in. In order to make it appropriate for larger cities, the number of

Implementing Activity-Based Models in Virginia
16
household types will need to be expanded. Citilabs reports that research and development are still underway.

Implementing Activity-Based Models in Virginia
17
CHAPTER 5. ADVANCED FOUR-STEP MODELING TECHNIQUES
A number of techniques are available to improve four-step models incrementally. Many of these techniques can achieve benefits attributed to activity-based models. Using some combination of these techniques, it may be possible for VDOT to meet the planning and policy needs of its model users without the costs and risks associated with comprehensive activity-based model development. The techniques indicated here have been applied in other areas, and in some cases, to one or more of VDOT’s existing four-step models. The VDOT travel demand modeling group is considering all of these techniques for comprehensive implementation during scheduled updates to the Richmond/Tri-Cities and Hampton Roads models over the next two years.
Zonal Data – Review and adjust Transportation Analysis Zones to support more detailed modeling. Explore moving toward parcel-based and other disaggregate methods for developing land use. Add support for land use forecasting models to VDOT’s staff capabilities, and encourage MPOs to adopt land use forecasting models.
Trip Generation – Enhance trip generation, with time-of-day factors and feedback from subsequent model steps (to capture some of the effects of trip linkage). Population synthesis can be applied to trip generation in the four-step framework. Auto-availability modeling would permit.
Trip Distribution – Implement destination choice models in place of gravity models, allowing greater sensitivity to market segmentation, accessibility, and characteristics of origin and destination zones. Improve parking cost data and the representation of parking costs in the model.
Trip Purposes – Evaluate additional trip purposes using NHTS survey data. Purposes might include Home-to-school, School-to-work, Home-based-shopping, Work-based-Other (variation of Non-Home-Based), Home-to-University, and others.
Commercial Vehicles – Add commercial vehicle models, and heavy truck models in regions outside Hampton Roads (where a state-of-practice heavy truck model is currently being implemented).
Time of Day – Sub-divide large models into time-of-day components to support trip time choice and dynamic traffic assignment. Such models would account for directional flow by time period, rather than limiting results to bi-directional daily traffic.
Mode Choice – Improve parking cost data and modeling. Extend mode choice to vehicle occupancy and to additional transit modes. For example, satellite parking as occurs in Norfolk near ODU suggests a drive-to-transit mode, where a long drive is followed by a short transit ride, which operates differently than park-and-ride where a short drive is followed by a relatively long transit ride.
Non-Motorized Travel -- Increase sensitivity to factors influencing non-motorized modes, perhaps by extending and adding detail the non-motorized component recently implemented in Charlottesville.

Implementing Activity-Based Models in Virginia
18
Network Modeling – Add junction modeling in networks to better manage bottleneck effects. Add dynamic traffic assignment to support congestion and pricing models.
Transit Modeling – Add a transit component to all models where transit is available. Increase detail in transit route coding, including enhancements such as schedule-based transfer penalties and more detailed walk access coding. Improve the representation of
Four-Step Interactions – Add feedback between steps, possibly by jointly solving trip distribution, mode choice and trip assignment constraints. This approach, already largely implemented in the Richmond/Tri-Cities and Hampton Roads models, improves model sensitivity to constraints shared across multiple model steps.
Implementing Activity-Based Models in Virginia
19
CHAPTER 6. PRELIMINARY COST ESTIMATE
Table 2 presents estimates of the approximate cost for developing advanced four-step models versus activity-based models for all VDOT model regions, and maintaining those models over five years. Sub-table 2.A shows costs for advanced four-step models. Sub-table 2.B shows costs for activity-based model development. Sub-Table 2.C compares five-year costs for each development approach. In developing cost estimates, the following assumptions were made:
• Model Development o All model development will be contracted to consultants o Development costs are pro-rated to each model area, but work will be performed
simultaneously for models in comparable size groups
• Model Maintenance o Maintenance costs for model software are calculated at 10% of the initial
development cost per year for each model area o Software maintenance costs are carried forward for five years
• Survey Costs o The NHTS add-on survey results due in October 2010 are expected to provide
sufficient data to estimate the models in the small model areas o Additional survey and data collection will be required in the large areas and would
likely be paid for by VDOT
• MPO Base Year Data Development o Base year data development includes an estimated cost for developing land use
modeling capabilities by the MPOs and preparing initial base year data and future forecasts for model development
• MPO Data Maintenance Costs o Costs are in addition to money already spent on data forecasting at the MPOs o Costs are based on 1.5 FTE (or equivalent in consultant costs) to maintain and
use forecasting capabilities and to construct forecasts o Data maintenance costs are totaled over a five year period
• Advanced Four-Step Model Development o Costs represent amounts anticipated to be spent over five years to upgrade
existing models to advanced four-step practice using techniques identified in Chapter 5 of this report
o Costs only include consultant charges; internal costs for the modeling program are presumed to be unchanged
Model Development Costs are presented as a range, allowing for uncertainty in any development process that relies on unproven technologies.
For all seven of the small and medium area models, the total cost for developing and maintaining these models as advanced four step models over a five year period is estimated to be in the range of $2.1 to $2.8 million compared to a range of $5.3 to $5.9 million for activity-based models. For all three of the large area models, the total cost for developing and maintaining these models over a five year period is estimated to be in the range of $2.0 to $2.8 million for advanced four step models compared to a range of $8.9 to $10.6 million for activity-based models. Overall, the total cost for developing and maintaining all of Virginia’s models as advanced four step models over a

Implementing Activity-Based Models in Virginia
20
five year period is estimated to be in the range of $4.2 to $5.6 million compared to a range of $14.2 to $16.5 million for activity-based models. The information used to develop these ranges is shown in Table 2.A and 2.B.
The average cost to maintain all of Virginia’s models as advanced four-step models over a five year period is estimated to be slightly less than $5.0 million which equates to an average yearly cost of slightly less than $1.0 million. In comparison, the average cost to maintain all of Virginia’s models as activity-based models over the same five year period is considerably higher and is estimated to be about $15.4 million which equates to about $3.1 million per year. Average costs are shown in Table 2.C.

21
Table 2. Comparative Cost of Model Development
2.A. Advanced Four-Step Model Costs
VDOT MPO
Model Development
Internal TAZs
Population (2000) Low High
5-Year Model
Maintenance Surveys Base Year
Data
5-Year Model
Maintenance
Winchester 167 83,000 100,000 200,000 50,000 N/A 20,000 100,000
Blacksburg-Christiansburg 207 83,000 75,000 150,000 50,000 N/A 20,000 100,000
Danville 181 70,000 60,000 125,000 50,000 N/A 15,000 75,000
Small
Harrisonburg 174 61,000 100,000 200,000 50,000 N/A 20,000 100,000
Roanoke 224 215,000 150,000 250,000 75,000 N/A 30,000 150,000
Lynchburg 282 215,000 150,000 250,000 75,000 N/A 30,000 150,000
Medium
Charlottesville 246 160,000 150,000 250,000 60,000 N/A 25,000 125,000
Subtotal 785,000 1,425,000 410,000 0 160,000 800,000
Hampton Roads 1,059 1,531,000 300,000 750,000 150,000 N/A 60,000 300,000
Richmond/ Tri-Cities 980 997,000 300,000 500,000 125,000 N/A 50,000 250,000
Large
Fredericksburg 804 236,000 150,000 300,000 100,000 N/A 40,000 200,000
Subtotal 750,000 1,550,000 375,000 0 150,000 750,000
Grand Total (Advanced Four-Step) 1,535,000 2,975,000 785,000 0 310,000 1,550,000

22
2.B. Activity-Based Model Costs
VDOT MPO
Model Development
Internal TAZs
Population (2000) Low High
5-Year Model
Maintenance Surveys Base Year
Data
5-Year Model
Maintenance
Winchester 167 83,000 250,000 300,000 125,000 N/A 60,000 300,000
Blacksburg-Christiansburg 207 83,000 200,000 250,000 110,000 N/A 60,000 300,000
Danville 181 70,000 150,000 200,000 100,000 N/A 45,000 225,000
Small
Harrisonburg 174 61,000 250,000 300,000 125,000 N/A 60,000 300,000
Roanoke 224 215,000 250,000 350,000 150,000 N/A 90,000 450,000
Lynchburg 282 215,000 250,000 350,000 150,000 N/A 90,000 450,000
Medium
Charlottesville 246 160,000 250,000 350,000 140,000 N/A 75,000 375,000
Subtotal 1,600,000 2,100,000 900,000 0 480,000 2,400,000
Hampton Roads 1,059 1,531,000 1,250,000 2,000,000 300,000 500,000 240,000 1,200,000
Richmond/ Tri-Cities 980 997,000 1,000,000 1,500,000 275,000 400,000 200,000 1,000,000
Large
Fredericksburg 804 236,000 1,000,000 1,500,000 250,000 300,000 160,000 800,000
Subtotal 3,250,000 5,000,000 825,000 1,200,000 600,000 3,000,000
Grand Total (Activity-Based) 4,850,000 7,100,000 1,725,000 1,200,000 1,080,000 5,400,000
2.C. Cost Comparison
Total
(Average Costs) Cost Per Year
(5 Years)
Advanced Four-Step Model $4,900,000 $980,000
Activity-Based Model $15,380,000 $3,076,000

Implementing Activity-Based Models in Virginia
23
CHAPTER 7. CONCLUSION AND RECOMMENDATIONS
The perceived conceptual benefits of activity-based models, combined with vocal advocacy from many prominent sources, ensure that the development of such models will continue. As more models are developed, greater understanding, standardization, and validation of activity-based approaches will occur. As mentioned in Chapter 4, model software vendors are currently developing activity-based components for release over the next few years, which will lower costs and simplify development requirements. However, at this time, activity-based models clearly remain in the research and development phase. As with any nascent technology, the level of development cost and uncertainty appears prohibitively high for VDOT, given the agency’s budget limitations, institutional structure, and need for timely model improvements.
Despite the advocacy for scrapping four-step models in favor of activity-based approaches, there are many techniques available to improve the performance of four-step models, as noted in Chapter 5. Moreover, incremental enhancements to elements of existing Virginia four-step models use data and techniques that are often structured compatibly with activity-based models. Building these enhancements now could later simplify the development of activity-based models.
There is, at present, much more evidence of obstacles to implementing activity-based models than there is evidence of the superiority of their results. Given the cost estimates presented in Chapter 6 that indicate that activity-based models would be over three times more expensive to develop and maintain than advanced 4-step models over a five year period and given the institutional limitations at VDOT and the MPOs that constrain how activity-based models could be developed, initiating a comprehensive activity-based modeling program at this time appears premature. A gradual development approach that incorporates elements of these models as they become available in vendor supplied software likely represents the most prudent path for protecting resources and maintaining consistency between model updates. For relatively small areas with simple travel demand issues, the four-step model will remain appropriate for the foreseeable future. For larger areas, or as policy and planning analysis needs in a model region increase, new approaches can be adopted either by extending the four-step framework with advanced strategies, or by taking incremental steps toward activity-based modeling. Activity-based approaches should be regularly re-evaluated when considering how best to improve model performance and to respond to new policy and planning requirements.
This incremental approach distributes the cost of new model development over time and generalizes it throughout the statewide modeling program. This approach also allows staff to develop the capacity to build and maintain activity-based models as knowledge of those techniques is disseminated into standard travel modeling practice. We believe this approach of gradually incorporating advanced practices will allow VDOT to enjoy the benefits of those practices, while avoiding the costs and uncertainties of cutting-edge model development, by pursuing model development in a manner that is both technically sound and fiscally responsible. Such incremental development will also help VDOT ensure that working models are always available, so that organizational commitments and deadlines can be kept, and analytic consistency can be maintained.
Implementing Activity-Based Models in Virginia
24
APPENDIX 1: LIST OF REVIEWED DOCUMENTS AND MATERIALS
1. Transportation Research Board. Special Report 288 - Metropolitan Travel Forecasting, Current Practice and Future Direction, 2007
2. Anderson, R.S., Giaimo, G.T, and Schmitt, D. On Comparing Aggregate Trip-Based and Disaggregate Tour-Based Travel Demand Models. Presentation at 12th National TRB Planning Applications Conference, May 19, 2009. Available online at http://www.trb-appcon.org.
3. Bowman, J.L., Activity Model Development Experiences. TMIP Web Seminar, June 18, 2009 http://tmip.fhwa.dot.gov/webinars/activitymodel
4. Bradley, M.A., Bowman, J.L, Griesenbeck, B. Paper. Development and application of the SACSIM activity-based model system, Submitted for the 11th World Conference on Transport Research, June 2007
5. Bradley, M.A., Bowman, J.L, Castiglione, J. Puget Sound Regional Council: Activity Model Work Plan. September, 2008
6. Cervenka, K. Activity Modeling Initiatives. Presentation at AMPO travel modeling work group meeting, September 8, 2005
7. Charlton,B. The San Francisco Model in Practice Validation, Testing, and Application. May 2006 8. Davidson, B. Parsons Brinckerhoff. An Overview of Tour-Based Models. Southeast Florida FSUTMS
User’s Group Meeting. Florida Department of Transportation. November 2, 2007. 9. Florida Model Task Force. Research Projects.
http://www.fsutmsonline.net/index.php?/site/directory/modeling_research. 2007. 10. Friedman, Jeffrey. The Rational Choice Controversy: Economic Models of Politics Reconsidered. Yale University
Press, 1996. 11. Gliebe, J. Dynamic Choices in Coordinated Household Activity-Travel Systems. Presented at Innovations in
Travel Demand Model Conference, June 2008 12. Hunt, JD, Donnelly, R., Abraham, J.R., Batten, C., Freedman, J., Hicks, J., Costinett, P.J., Upton, W.J.
Design of a Statewide Land Use Transport Interaction Model for Oregon. 2001 13. Lemp, J., and Kockelman, K. Paper. Anticipating Welfare Impacts via Travel Demand Forecasting Models:
Comparison of Aggregate and Activity-Based Approaches for the Austin, Texas Region. Presented at the 88th Annual Meeting of the TRB. January, 2009.
14. Metropolitan Travel Survey Archive, University of Minnesota. http://www.surveyarchive.org/archive.html. Accessed December 2007
15. Parsons Brinckerhoff Quade & Douglas, Inc in association with PB Consult, AECOM Consult, Urbitran Associates, Inc., Urbanomics, Alex Anas & Associates, NuStats International, George Hoyt & Associates, Inc. Transportation Models and Data Initiative, General Final Report: New York Best Practice Model (NYBPM). January 2005
16. PB Consult, Inc., Mark Bradley Research. MTC Travel Model Specification Plan: Working version. November 2006
17. RDC, Inc. Activity-Based Modeling System for Travel Demand Forecasting, Travel Model Improvement Program. September 1995
18. Train, Kenneth. Discrete Choice Methods with Simulation. Cambridge University Press, 2003. Available online at: http://elsa.berkeley.edu/books/choice2.html
19. Transportation Model Improvement Program (TMIP) clearing house documents. http://tmip.fhwa.dot.gov/. Accessed December 2007
20. VHB. Results of FY2006 Travel Forecasting Research, Task 5: Review of Current Use of Activity-Based Modeling. Metropolitan Washington Council of Governments, National Capital Region Transportation Planning Board, Washington, D.C. 2006.
Implementing Activity-Based Models in Virginia
25
APPENDIX 2: LIST OF AGENCY CORRESPONDENCE
Atlanta Regional Commission: Guy Rousseau, Modeling Manager
Denver Regional Council of Governments: Erik Sabina, Modeling Manager
Mid Ohio Regional Planning Commission: Rebekah Anderson (former project manager, now with Ohio DOT)
New Hampshire Department of Transportation: Subramanian Sharma
Ohio Department of Transportation: Greg Giaimo, Senior Modeler
Portland METRO: Richard Walker

Implementing Activity-Based Models in Virginia
26
APPENDIX 3: SUMMARIES OF ACTIVITY-BASED MODELS
The following are brief summaries of activity-models currently in use or under development.
Agency: New Hampshire Department of Transportation (NHDOT) Status: Model completed (1998) and operational Overview: This statewide model was one of the first to be developed using a tour-based component, and it remains in operation today. While its specific development costs are unknown, original model development occurred between 1994 and 1998. The original base year data was for 1990. The model was originally developed in EMME/2 with customized application software to perform the tour-based components, including:
1. Household vehicle availability (auto ownership); 2. Household tour generation (number of tours by purpose); 3. Primary destination choice of tour; 4. Tour level mode choice (auto vs. non-auto tour); 5. Tour type (number and type of stops); and, 6. Secondary destination choice.
In 2005, the model was converted from EMME/2 to TransCAD and zonal data updated to 2000. No new surveys were conducted.
Base zonal data was taken from the Census, PUMS, state and Dun & Bradstreet employment databases, and state planning forecasts. The primary data source for the estimation of the travel behavior models was the New Hampshire Activities and Travel Survey. A total of 2,844 households in New Hampshire provided data on the activities and travel undertaken by household members over a 24-hour period. On-board transit surveys and vehicle intercept surveys supplemented the household survey data. All of these surveys took place between 1994 and 1995.
The New Hampshire model uses a tour-based approach to create trip tables that are ultimately incorporated back into a conventional mode choice (auto occupancy, auto access to transit trips, and truck trips) and travel assignment model. However, initial mode choice occurs as well during the tour generation steps. While this model cross-classifies households by socioeconomic category in order to generate discrete household tours for each household (it does not synthesize households), the trips within the tours themselves are ultimately converted into individual trip tables by trip purpose for assignment. This model is strictly a tour-based model. It does not generate activity patterns or relate trip activity across an entire day. Rather, it generates tours with trips, and then divides these trips into four daily time periods using factors developed from survey data and traffic counts.
Conversations with NHDOT staff revealed that while the model is currently operational, for lack of financial resources and staff trained to operate it, it did “gather dust” for significant periods of time. Further, the model has yet to be used for the types of policy analysis or development of

Implementing Activity-Based Models in Virginia
27
traffic management systems that it was originally developed for, but rather, it has typically been used to generate basic trip assignment forecasts for regional traffic analyses and project plans. Currently, NHDOT has contracted with outside transportation consultants to update and upgrade the model, as well as use it for policy analysis in a toll and capacity study for I-93. This will represent the first real utilization of its advanced capabilities.
Agency: San Francisco County Transportation Authority (SFCTA) Status: Model completed (2001) and operational Overview: The SFCTA activity-based model is another older model still in use in United States. This model is rather simple in structure as it does not consider the intra-household interactions in modeling the daily activity patterns. The model was developed in approximately one year. Model validation process took approximately six months to complete. SFCTA have approximately three to four staff members to maintain and/or use the model.
Agency: Mid Ohio Regional Planning Commission, Columbus, Ohio (MORPC) Status: Model completed (2004) and operational Overview: The Columbus Ohio model is an activity-based model that was completed in 2005. It was the first activity-based model implemented in United States urban area to include household interactions. The Columbus model was developed using multiple applications: the application software used is Cube/TP+, and the custom application program language used is Java. The average run time for the model is approximately 1.5 days. It is estimated that the total cost of model development was over 1.5 million dollars spread over a period of 42 months. MORPC have approximately three to four staff members to maintain and/or use the model. MORPC is currently updating its previous conventional four-step model for the purposes of providing a direct comparison of model results between the two frameworks. This comparison will represent the first opportunity of this kind.
Agency: New York Metropolitan Transportation Commission (NYMTC) Status: Model completed and operational Overview: The NYMTC activity-based model is named New York Best Practice Model (NYBPM). It was completed in year 2005 and was developed using TransCAD as main software application and C/C++/FORTRAN for custom applications. NTMTC have approximately five to seven staff members to maintain and/or use the model.
Agency: Tahoe Regional Planning Agency (TRPA) Status: Model complete and operational Overview: The TRPA model was developed in completed in year 2007. The model uses TransCAD as major application software. Most of the model structure in this model is borrowed from the Columbus, Ohio model. This model also used the household survey data from the Columbus, Ohio model to reduce the model development costs. TRPA have approximately two to three staff members to maintain and/or use the model.

Implementing Activity-Based Models in Virginia
28
Agency: Sacramento Area Council of Governments (SACOG) Status: Model complete and operational Overview: The SACOG activity-based model was completed in 2007. The model development was completed in almost two years. The SACOG activity-based model uses a combination of Cube, Delphi and Pascal as its model application platform. The total cost of model development was approximately $980,000, half of which was used for data collection. SACOG have approximately three to four staff members to maintain and/or use the model.
Agency: Atlanta Regional Commission (ARC) Status: Development ongoing Overview: Since the model development is ongoing not much model documentation is available. However based on the description available online it can be concluded that ARC model is expected to be complete in year 2009. It will have taken approximately four years to develop this model at a cost of over $2.7 million. The model is being developed in Cube Voyager platform with some custom application being developed in Java. ARC has approximately four to six staff members to maintain and/or use the model.
Agency: Denver Regional Council of Governments (DRCOG) Status: Development ongoing Overview: It is interesting to note that most of the model development for the DRCOG activity-based model was done in-house. Hence the cost of model development was approximately $800,000. The cost of data collection was not separately available. Because DRCOG already has access to extensive disaggregate data on households and employment locations, relatively little new data collection was required. The DRCOG model is developed in TransCAD with custom applications being developed in C# (Microsoft .NET platform). DRCOG have approximately four to six staff members to maintain and/or use the model.
Agency: Portland Metro (METRO) Status: Development underway Overview: The METRO model is being developed using EMME/2 and VISUM application software; in addition it uses Python, Java and C++ to program customized applications. This model was expected to be finished in 2008 and will have taken approximately 2 years for development. While the model development will be completed for under $200,000, it is estimated that data collection efforts will cost around $1.2 million. METRO has approximately three to four staff members to maintain and/or use the model.
Agency: Ohio Department of Transportation (ODOT) Status: Development near completion Overview: The Ohio statewide model is scheduled for completion in year 2008. The model has been developed over 11 years. The model is being developed using Cube, Java and TransCAD. The data collection cost, which include cost associated with MPO household surveys is $6 million, while the model development cost is $2 million which includes many economic, land use and freight components in addition to tour-based personal travel models. The base year is 2000

Implementing Activity-Based Models in Virginia
29
and it takes over 12 hrs to run the model on 36 processors. ODOT have approximately five to seven staff members to maintain and/or use the model.
Agency: Metropolitan Transportation Commission (MTC) Status: Development underway Overview: The San Francisco MTC travel demand model is expected to be developed by year 2009. The base year is 2000 and the future year of the model will be 2030/2050. The major application used for model development is Cube Voyager. Not much information is available about the cost of development. MTC have approximately three to four staff members to maintain and/or use the model.
Agency: Puget Sound Regional Council, Seattle, WA (PSRC) Status: Development underway Overview: The Puget Sound activity-based travel demand model is under development with no established ultimate delivery date. The model is being implemented incrementally, by replacing portions of the existing four-step model. The base year is 2006 and the future year of the model will be 2040. The major application used for model development is EMME. Not much information is available about the cost of development. PSRC has approximately four to five staff members to maintain and/or use the model.