Implementation Outcomes of a Social Intervention for...
44
Implementation Outcomes of a Social Intervention for Children with Autism in Public Schools Jill Locke, PhD, Christina Kang-Yi, PhD, Lindsay Frederick, Julie Caramanico, & David Mandell, ScD Center for School Mental Health 2017
Transcript of Implementation Outcomes of a Social Intervention for...

Implementation Outcomes of a Social
Intervention for Children with Autism
in Public Schools
Jill Locke, PhD, Christina Kang-Yi, PhD, Lindsay
Frederick, Julie Caramanico, & David Mandell, ScD
Center for School Mental Health 2017

Playground Engagement(Locke, Shih, Kretzmann, & Kasari, 2015)

Social Network Inclusion
1.60 1.61
1.05
1.70
2.03
1.80
0
0.5
1
1.5
2
2.5
3
K-1st 2nd-3rd* 4th-5th*
*p < .05• Typical Peers • Children with ASD
(Rotheram-Fuller, Kasari, Chamberlain, & Locke, 2010)

Increases relevance to the
setting, use of the intervention,
positive outcomes for students
Conducting research in
partnership with schools
Interventions have largely
been delivered in clinical and
university-based settings
Importance of Working with Schools
Limits generalization
and sustainment

Research to……practice?
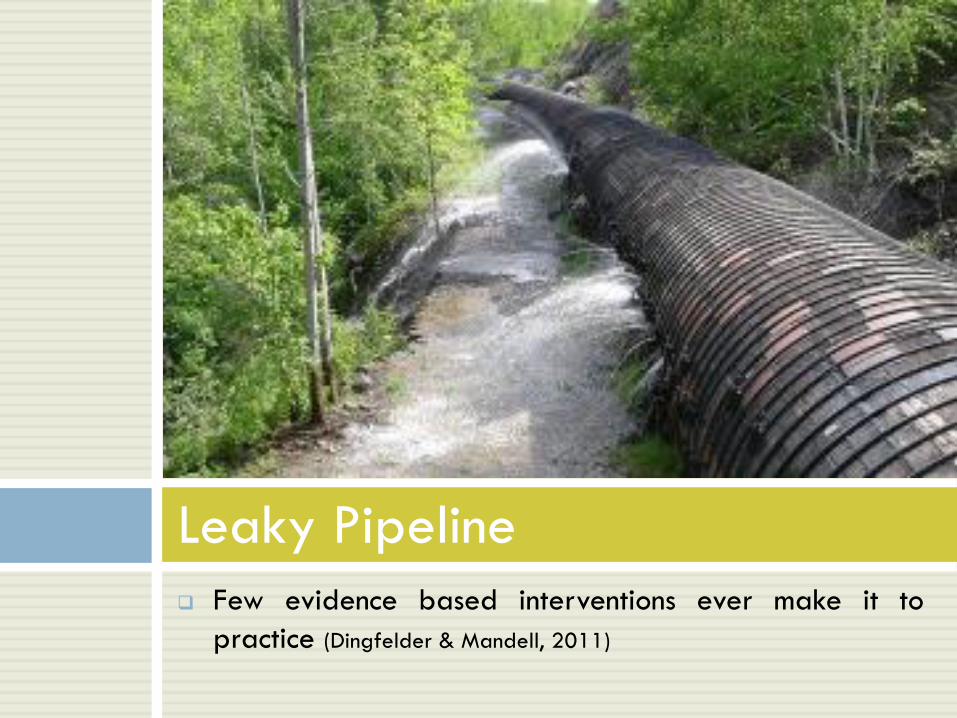
Few evidence based interventions ever make it to
practice (Dingfelder & Mandell, 2011)
Leaky Pipeline

Barriers to Implementation(Locke, Olsen, Wideman, Downey, Kretzmann, Kasari, & Mandell, 2015)
Training
Resource Limitations
Staffing
Policies Surrounding Recess
Level of Support
Competing Demands

Pebbles, Rocks, and Boulders(Locke, Wolk, Harker, Olsen, Shingledecker, Barg, Mandell, & Beidas, submitted)
General implementation of evidence-based practices
Implementation Process, Staffing, Leadership, Support
Specific to social engagement intervention
Staffing, Barriers, Facilitators
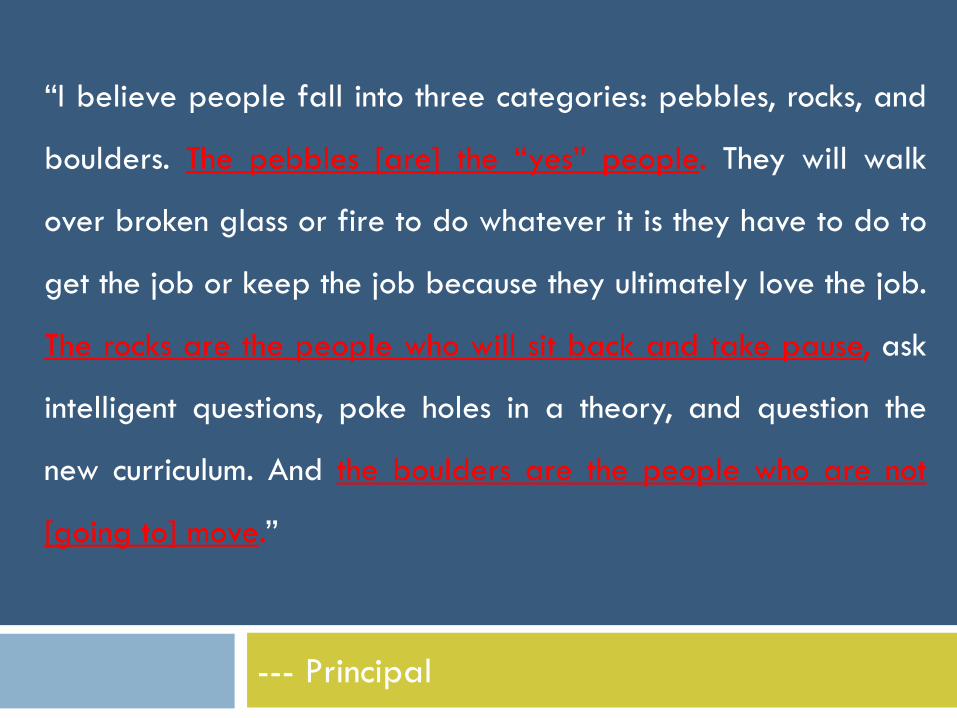
“I believe people fall into three categories: pebbles, rocks, and
boulders. The pebbles [are] the “yes” people. They will walk
over broken glass or fire to do whatever it is they have to do to
get the job or keep the job because they ultimately love the job.
The rocks are the people who will sit back and take pause, ask
intelligent questions, poke holes in a theory, and question the
new curriculum. And the boulders are the people who are not
[going to] move.”
--- Principal

Current Study
Stepped-wedge design
Schools randomized to Remaking Recess with or
without implementation support
Remaking Recess – 12 sessions during recess (30-45
minutes each)
Remaking Recess with Implementation Support – 12
sessions during recess plus three sessions with principals
and key stakeholders

School-based social engagement intervention to train staff
during the recess period to facilitate social opportunities
for children
Remaking Recess (Kretzmann, Locke, Kasari, 2012)
FacilitatorCoachh
ttp
://w
ww
.rem
akin
grec
ess.
org

Coaching
Didactic Model Feedback

Implementation Strategies
Implementation strategy is a “method or technique used to enhance the adoption,
implementation, and sustainability of a clinical program or practice” – Proctor, Powell,
& McMillen (2013), p.2

Implementation Strategy
Identify and prepare
championsTailor strategies

Implementation Support
3 Consultation Sessions
scheduling staffing during recess
building internal capacity
amending school-wide policies for recess
providing tangible support and resources
improving implementation climate
adapting and modifying the intervention to fit the needs
of the school
embedding Remaking Recess within the school culture

Recruitment

Child CharacteristicsRemaking Recess
(Total N = 14)
Remaking Recess with Implementation
Support (Total N = 17)
N Mean/% N Mean/%
Age 14 9 17 8.6
Gender
Male 14 100 13 76.5
Race/Ethnicity
White 5 35.7 10 58.8
Black 5 35.7 5 29.4
Latino 2 14.3 0 0.0
Asian 1 7.1 2 11.8
Other 1 7.1 0 0.0
Grade Level
Kindergarten 0 0.0 4 23.5
First grade 2 14.3 0 0.0
Second grade 3 21.4 2 11.8
Third grade 1 7.1 2 11.8
Fourth grade 1 7.1 4 23.5
Fifth grade 7 50.0 5 29.4

School-Personnel
Characteristics
Remaking Recess
(Total N = 13)
Remaking Recess with Implementation
Support (Total N = 16)
N Mean/% N Mean/%
Age 13 38.3 15 38.0
Gender
Female 13 100.0 10 68.8
Race/Ethnicity
Caucasian 8 61.5 10 62.5
African American 5 38.5 4 31.3
Latino 0 0.0 1 6.3
Highest education
High school 3 23.1 2 18.8
Bachelors 6 46.2 7 43.8
Graduate degree 2 15.4 6 37.5
Associate degree 2 15.4 0 0.0
Years experience 13 4.1 16 6.7
Role
Teacher 3 23.1 8 50.0
Other school personnel 10 76.9 7 43.8
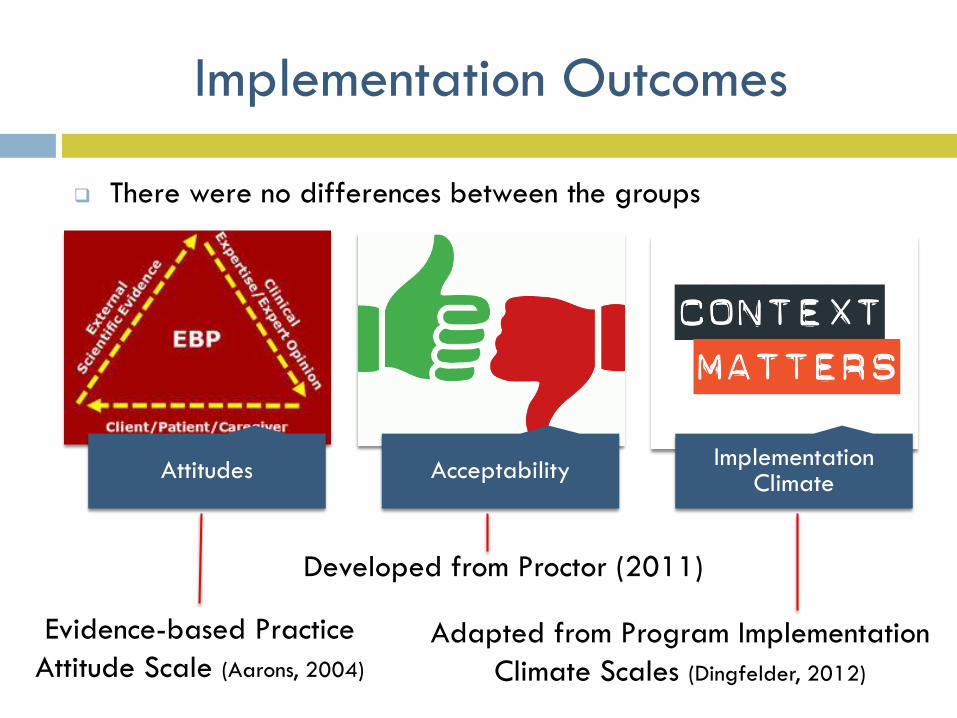
Implementation Outcomes
Attitudes AcceptabilityImplementation
Climate
There were no differences between the groups
Evidence-based Practice
Attitude Scale (Aarons, 2004)
Adapted from Program Implementation
Climate Scales (Dingfelder, 2012)
Developed from Proctor (2011)

Requirements
Openness
Divergence
Self-Rated
Fidelity
EBPAS Results
EBPAS Requirements predicted Self
Rated Fidelity (F=5.08, p<0.03)
Acceptability and Implementation
Climate did not predict fidelity
Appeal
EBPAS:

Organizational Readiness for Change
Staff Principal
Individual Factors
Staff Attributes
Organizational Climate
Mission, Autonomy, Stress, Cohesion, Communication, Change
(Lehman, 2002)

ORC Results
Rater Domain Fidelity
Staff Staffing
Staff Individual Growth
Staff Organizational Adaptability
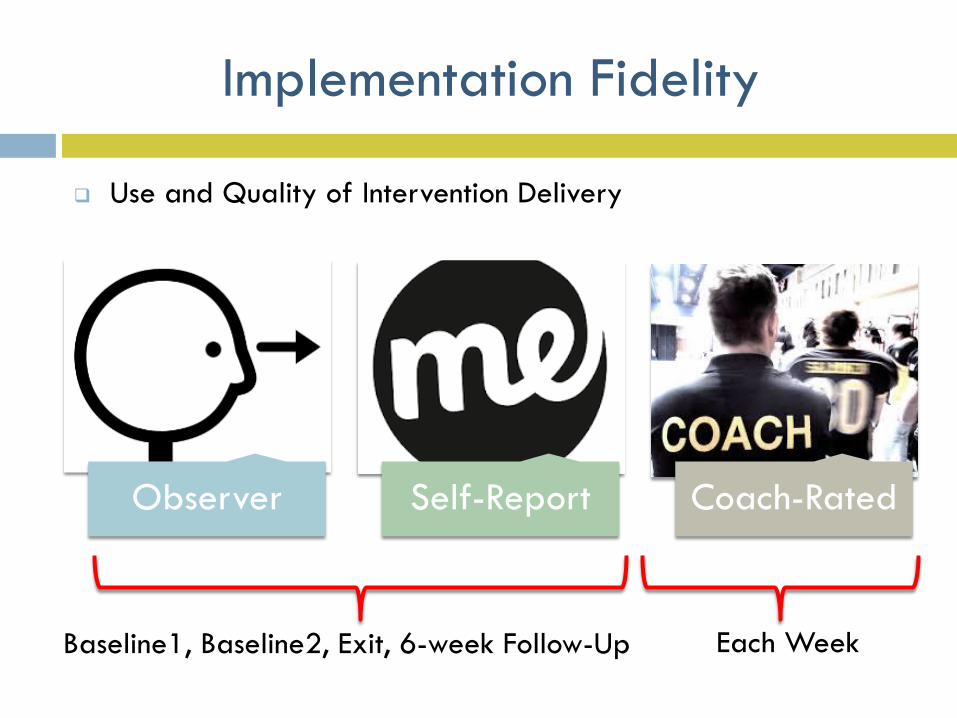
Implementation Fidelity
Observer Self-Report Coach-Rated
Use and Quality of Intervention Delivery
Baseline1, Baseline2, Exit, 6-week Follow-Up Each Week

Implementation Fidelity
Schools did not use any aspect of Remaking Recess prior to receipt of training
Fidelity increased over the six-week training and follow-up periods
Overall use and quality of intervention delivery was low

Discussion
Implementation fidelity is low
Individual-level factors may affect implementation in schools more strongly than organizational factors
District and school mandates to use EBPs may result in lower implementation
Teachers/staff ratings may be more proximal to understanding EBP implementation than principals

Playground engagement
Friendship
Social network inclusion
Child Outcomes
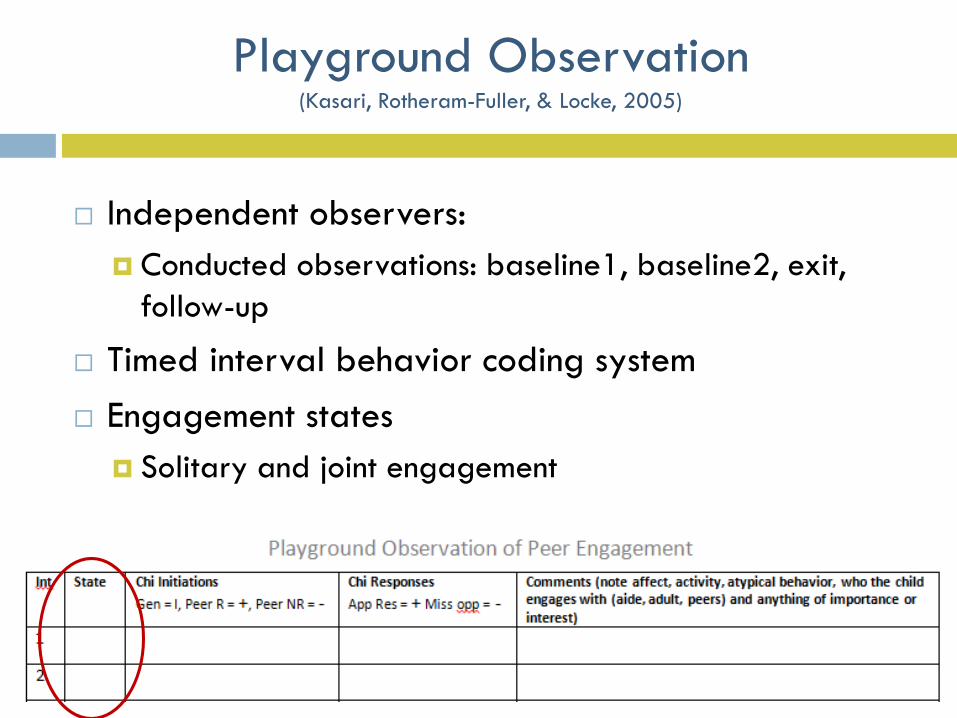
Playground Observation(Kasari, Rotheram-Fuller, & Locke, 2005)
Independent observers:
Conducted observations: baseline1, baseline2, exit,
follow-up
Timed interval behavior coding system
Engagement states
Solitary and joint engagement

Solitary Engagement
0
0.05
0.1
0.15
0.2
0.25
0.3
0.35
0.4
Baseline1 Baseline2 Exit Follow-up
Solita
ry E
nga
gem
ent
Time Point
Remaking Recess Only
Remaking Recess with Implementation Support

Joint Engagement
0
0.1
0.2
0.3
0.4
0.5
0.6
0.7
Baseline1 Baseline2 Exit Follow-up
Join
t Enga
gem
ent
Time Point
Remaking Recess Only
Remaking Recess with Implementation Support

Friendship Nominations
Social Network Inclusion
Information We Get:
Information We Get:

Received Friendship Nominations
0
0.5
1
1.5
2
2.5
3
Baseline1 Baseline2 Exit Follow-up
Fri
end
ship
Nom
ina
tion
s
Time Point
Remaking Recess Only
Remaking Recess with Implementation Support

Social Network Inclusion
0
0.1
0.2
0.3
0.4
0.5
0.6
0.7
0.8
Baseline1 Baseline2 Exit Follow-up
Soci
al N
etw
ork
Incl
usi
on
Time Point
Remaking Recess Only
Remaking Recess with Implementation Support

Colleen (11)
Cara (5)
Erica (9)
Julie (5)
Johnny (6) ***
Wendy (7)
David (7)
Steve (7)
Elizabeth (5)
Brad (5)Fred (3)
Sammy (4)
Cheryl (5) Tina (5)
Kevin (1)
Dan (1)
Lenny (1)
Kathleen (2) Megan(1)
Isolates: Posey (0), Bob (0), Annie (0), Chester (0)
Baseline 1 Social Network
1.5
3
10
5
4
4 5
7
7
6.5
6
Isolate
Peripheral
Secondary
Nuclear

Sammy (13) Johnny (7) ***
Bob (5) Fred (13)
Brad (7)
Cheryl (9) Tina (11)
Colleen (9)
Cara (9) Erica (2)
Julie (5)
Elizabeth (5)
Kathleen (9) Megan (8)
Posey (6)
Annie (4)
Chester (5)
Wendy (6)
Steve (6) David(4)
Kevin (4) Dan (5)
Lenny (1)
Baseline 2 Social Network
4.5
510
8.5
9
5.5
3
13
8.5 5.5Secondary

David (14)
Johnny (16) ***
Bob (6)
Sammy (15)
Wendy (18)
Steve (10)Lenny (14)
Dan (15)
Kevin (9)
Cheryl (13) Tina (13)
Cara (12) Elizabeth (10)
Julie (10)
Colleen (12)Erica (9)
Annie (9) Posey (9)
Chester (9)Megan (4)
Fred (7) Brad (6)
Exit Social Network
6.5
9
13
12
14.5
17
Nuclear

Johnny (12) ***
Bob (4) Steve (12)
David (12)
Colleen (10)
Cara (11)
Julie (9)
Erica (5)
Kevin (9) Dan (8)
Annie (9)
Lenny (7) Sammy (7)
Posey (6)
Chester (6)
Follow Up Social Network
8.510.5
5.5
12
8
7.5
Cheryl (10) Tina (12)
Megan (9)
Elizabeth (11) Wendy (9)
Fred (6) Brad (7)6.5
11
10
Nuclear
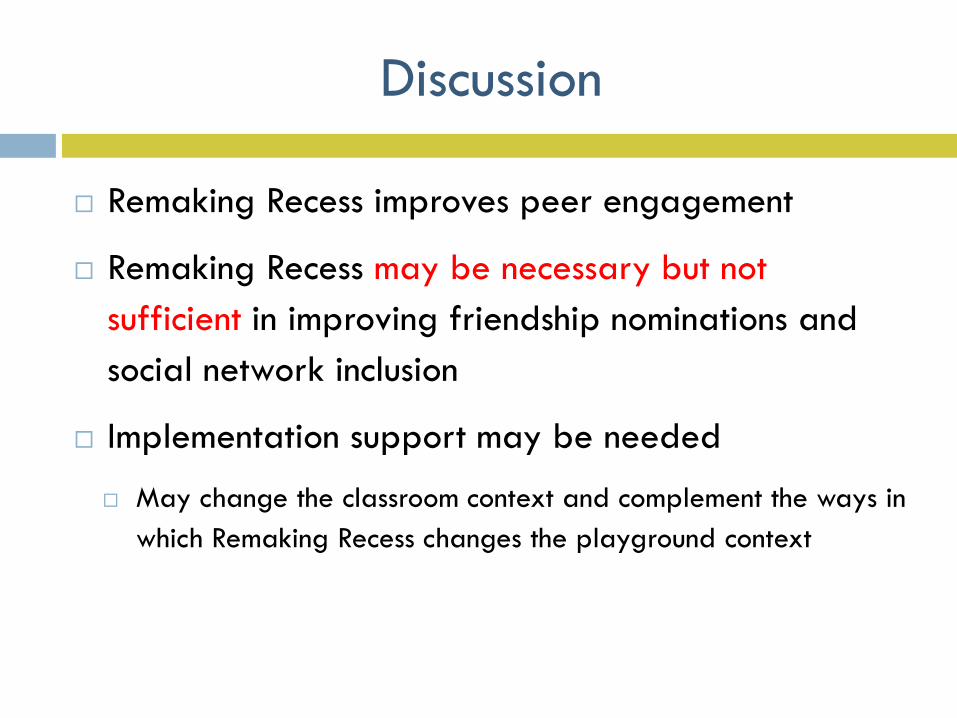
Discussion
Remaking Recess improves peer engagement
Remaking Recess may be necessary but not
sufficient in improving friendship nominations and
social network inclusion
Implementation support may be needed
May change the classroom context and complement the ways in
which Remaking Recess changes the playground context
Acknowledgments
FARFund Early Career Award
NIMH K01MH100199
Autism Science Foundation
(Grant # 13-ECA-01L)

Determinants of Practice40
Factors that obstruct or enable changes in targeted
professional behaviors or healthcare delivery
processes.
Krause et al., 2014

Implementation Outcomes41
The effects of deliberate and purposive actions to
implement new treatments, practices, and services.
Implementation outcomes
• Acceptability
• Adoption
• Appropriateness
• Costs
• Feasibility
• Fidelity
• Penetration
• Sustainability
Service outcomes
• Efficiency
• Safety
• Effectiveness
• Equity
• Patient-centeredness
• Timeliness
Client outcomes
• Satisfaction
• Function
• Symptomatology
Proctor et al., 2011
Implementation Strategies
Implementation strategy is a “method or technique used to enhance the adoption,
implementation, and sustainability of a clinical program or practice” – Proctor, Powell,
& McMillen (2013), p.2

Individual, School, District Levels
Determinant Implementation Strategy Implementation Outcome
Turnover Use Train the Trainer Strategies
Train designated school personnel
to train others in new practices.
Sustainability
Determinant Implementation Strategy Implementation Outcome
Provider views EBP
unfavorably
OR
Provider habit
(forgets to use EBP)
Audit and Provide Feedback
Collect and summarize data
regarding implementation of the
new program or practice over a
specified time period and give it to
administrators and school
personnel to monitor, evaluate, and
support implementer behavior.
Adoption
Penetration

Individual, School, District Levels
Determinant Implementation Strategy Implementation Outcome
Implementation outcomes:
Acceptability Costs Penetration
Adoption Feasibility Sustainability
Appropriateness Fidelity