IMPLEMENTATION OF GOOD AGRICULTURAL PRACTICES FOOD …
219
The Pennsylvania State University The Graduate School Department of Agricultural Economics, Sociology, and Education IMPLEMENTATION OF GOOD AGRICULTURAL PRACTICES FOOD SAFETY STANDARDS ON MID-ATLANTIC STATES AND NEW YORK PRODUCE FARMS A Dissertation in Agricultural and Extension Education and International Agricultural Development by Roshan Nayak © 2016 Roshan Nayak Submitted in Partial Fulfilment of the Requirements for the Degree of Doctor of Philosophy December 2016
Transcript of IMPLEMENTATION OF GOOD AGRICULTURAL PRACTICES FOOD …
The Pennsylvania State University
The Graduate School
Department of Agricultural Economics, Sociology, and Education
IMPLEMENTATION OF GOOD AGRICULTURAL PRACTICES FOOD SAFETY
STANDARDS ON MID-ATLANTIC STATES
AND NEW YORK PRODUCE FARMS
A Dissertation in
Agricultural and Extension Education and International Agricultural Development
by
Roshan Nayak
© 2016 Roshan Nayak
Submitted in Partial Fulfilment
of the Requirements
for the Degree of
Doctor of Philosophy
December 2016
The dissertation of Roshan Kumar Nayak was reviewed and approved* by the following:
John C. Ewing
Associate Professor, Agricultural and Extension Education
Dissertation Advisor
Chair of Committee
Edgar P. Yoder
Professor of Agricultural and Extension Education
INTAD Advisor
Luke F. LaBorde
Associate Professor of Food Science
Connie D. Baggett
Associate Professor, Agricultural and Extension Education
Director of Graduate Studies
*Signatures are on file in the Graduate School
iii
ABSTRACT
In the wake of multistate outbreaks and subsequent economic cost and health causalities,
food industry stakeholders formulated policies for their produce suppliers. The U.S. Food and
Drug Administration’s guidance on Good Agricultural Practices (GAPs) have been the basis for
most of the industry initiated GAP certifications or audit processes. In this food safety regulatory
setting, a third-party audit is a critical tool to ensure neutral and impartial assessment of safety
standard compliance by the produce growers. Growers reported audit burden when they have to
meet multiple duplicative standards and GAP audits. In response to the growing audit burden, the
United Fresh Food Safety and Technology Council harmonized GAP standards. The Produce
GAPs harmonized food standards are accepted by major food retailers and auditing agencies.
In this given scenario, which recognizes the undeniable significance of GAPs in
preventing microbial contaminations of produce, it is not always the case that growers were able
to have successfully implemented GAPs on their farms and pass the audits. Therefore, it
becomes necessary to assess the areas of frequent GAP noncompliance along with the barriers
that growers are facing in implementing GAP programs. The study employed “evaluation and
monitoring” stage of a policy cycle model and a mixed method approach to assess the
implementation GAPs of harmonized food safety standards by the produce growers of Mid-
Atlantic states and New York. The primary purpose of the study was to identify the food safety
standards of frequent noncompliance, aspects of noncompliance, barriers to GAP implementation
and risk assessments, and GAP information sources.
Produce USDA GAPs harmonized audits (field operations and harvesting) for the 2013-
14 growing season were treated as a principal on-farm evaluation tool. Audits from Delaware,
Maryland, New Jersey, New York, Pennsylvania, and Virginia were accessed and analyzed to

iv
identify standards as well as criteria of GAP noncompliance. Based on the findings from the
analysis of 166 audits, a paper survey was designed and administered to 212 USDA harmonized
GAPs certified growers of those six states. In total 116 usable mail surveys were analyzed to
validate the findings from the audits, identify challenging food safety standards, and assess the
barriers to GAP compliance and risk assessments.
Analysis of audits and surveys produced both confirmatory and contradictory findings.
The across-validated evidence pointed to problematic food safety standards that included having
a food safety policy for subcontractors, documentation of corrective actions, policy for glove use,
workers’ compliance with hygienic practices, and writing water management plan and testing
procedures. There were no significant differences in the proportions of growers who rated
complying with food safety standards as a challenging task in states such as Pennsylvania, New
Jersey, and New York. Time and cost were two significant constraints for GAP incorporation.
Preparing a risk assessment plan and understanding auditors’ expectations were major barriers to
carrying out risk assessments on the farms.
Survey respondents mostly obtain GAP information from Cooperative Extension, sell
their produce to resellers and expressed their intention to renew their GAP certificate annually.
Findings of the study have implications for Extension and outreach agencies to improve and
tailor on-farm food safety programming. Emphasizing and prioritizing the problematic
requirements in food safety programs, Extension can better assist the growers to successfully
implement GAP programs on their farms and prepare them for the audit. Further study is
necessary to determine the effect of farm size, marketing channels, and barriers on GAP
compliance.
Key Words: Food Safety Standards, GAPs, Mid-Atlantic States, Extension, Produce Growers

v
TABLE OF CONTENTS
Page
List of Figures……………………………………………………………………………. vii
List of Tables…………………….………………………………………………………. viii
Acknowledgements………………………………………………………………………. x
Chapter 1 Introduction…………………………………………………………………… 1
Foodborne Illness Outbreaks………………………………………………………... 1
On-Farm Food Safety Practices……………………………………………………... 5
Third-Party Audits…………………………………………………………………... 8
Harmonization of GAPs Food Safety Standards……………………………………. 10
Areas of Research Concern…………………………………………………………. 13
Purpose and Objectives ……………………………………………………………... 15
Study Assumptions …………………………………………………………………. 16
Study Limitations…………………………………………………….……………… 16
Organization of Dissertation………………………………………………………… 17
Chapter 2 Review of Literature…………………………………………………............... 18
On-Farm Contaminations…………………………………………………………… 18
Preventive Measures………………………………………………………………… 20
Risk Assessments……………………………………………………………………. 22
Compliance with GAPs……………………………………………………………... 24
Theoretical Framework……………………………………………………………… 29
Policy cycle…………………………………………………………………....... 30
Monitoring and evaluation………………………………………………. ……. 33
Produce USDA GAPs Harmonized Audit Process………………………….………. 34
Summary ……………………………………………………………………………. 38
Chapter 3 Methodology.…………………………………………………………………. 39
Research Design…………………………………………………………………...... 39
Population and Sample……………………………………………………………… 40
Document Analysis…………………………………….……………………………. 41
Data collection……………………………………………………………….…. 41
Data analysis………………………………………………………………….… 43
Survey Analysis …………………………………………………….………………. 44
Instrumentation…………………………………………………………………. 44
Survey sample………………………….…………………………………….…. 46
Data collection………………………………………………….………………. 46
vi
Data analysis…………………………………………………………………… 48
Summary……………………………………………………………………….……. 50
Chapter 4 Results………………………………………………………………………… 52
Objective 1: Identify Areas of Frequent GAP Noncompliance Through Analysis of
Produce USDA Gaps Harmonized Audits for Field Operations and
Harvesting of Mid-Atlantic States and New York….…………………….…. 53
Objective 2: Describe the Aspects of Field Operations and Harvesting Harmonized
Food Safety Standards and Criteria of Noncompliance……………………... 68
Objective 3: Identify the Challenging Harmonized GAP Audit Standards for
Growers of Mid-Atlantic States and New York Using Mail Survey………... 83
Objective 4: Determine the Source of GAP Information, Barriers to Implementing
GAPs and Carrying Out Risk Assessments on the Farms...………………… 100
Summary………………………………………………………………………….…. 113
Chapter 5 Discussion, Conclusions, and Recommendations……….……………………. 115
Discussions……………………………………………………………………….…. 115
General Questions…………………………………………………….………… 115
Field Production...……………………………………………………………… 117
Harvesting………………………………………………………………………. 119
Transportation……………………………………..……………………………. 120
Risk assessments….………………………………..…………………………… 120
Other survey findings.…………………………….……………………………. 121
Conclusions...………………………………………………………………………... 125
Implications for Extension……………………………………………………… 127
Food safety culture……………………….……………………………….……. 129
Food Safety Modernization Act………………………………………………... 131
Recommendations for Future Studies………………….……………………………. 133
Summary……………………………………………….……………………………. 137
References……………………………………………………………………………… 139
Appendix A: Field Operations and Harvesting Harmonized Standards……….….….… 154
Appendix B: Overall Count Tables for PA, DE, MD, NJ and NY……….…….……… 158
Appendix C: Survey Proportional Test Results………………………………….……... 159
Appendix D: Survey Questionnaire ……………………………………………….…… 162
Appendix E: Growers’ Comments……………………………………………………... 166
Appendix F: INTAD Study- JIEE Manuscript….………………………...…………..... 168
Appendix G: Survey Questionnaire for INTAD Study………………………………… 194

vii
LIST OF FIGURES
Figure 1.1. Contributing factors to produce safety concerns……………………….............. 3
Figure 1.2. Food supply chain under regulated system………………………….……......... 9
Figure 1.3. Parameters used in preparing Harmonized GAP standards……….…................. 12
Figure 2.1. Policy cycle model……………...………….……………………………........... 31
Figure 3.1. Research design comprising of qualitative and quantitative approach………… 40
Figure 4.1. CAN and IAR frequency chart for field production…………………………… 55
Figure 5.1. Overall result chart showing implications for Extension………………………. 130
Figure 5.2. Aspects of food safety culture……………………………………………...…... 132
viii
LIST OF TABLES
Table 2.1. List of Standards Under Major Sections of Field Operations and Harvesting…… 36
Table 2.2. Risk Assessment Requirements……………………….…………………………. 37
Table 3.1. Produce USDA Gaps Harmonized Audits for The Growing Season 2013-14...… 42
Table 3.2. Certified Growers, Respondents, and Percentage………………………………... 48
Table 4.1. Produce USDA GAPs Harmonized Audits for the growing season 2013-14……. 53
Table 4.2. Frequency of CAN and IAR by standards for New Jersey………………………. 57
Table 4.3. Frequency of CAN and IAR by standards for New York………………………... 59
Table 4.4. Frequency of CAN and IAR by standards for Pennsylvania………….…………. 61
Table 4.5. Frequency of CAN and IAR by standards for Delaware………………………… 62
Table 4.6. Frequency of CAN and IAR by standards for Maryland………………………… 64
Table 4.7. Proportional Difference Test Table………………………………………………. 65
Table 4.8. Risk Ratio Table for Worker Education and Training…………………………… 66
Table 4.9. Risk Ratio Table for Sampling and Testing……………………………………… 66
Table 4.10. Risk Ratio Table for Workers Health/Hygiene and Toilet/Handwashing
Facility……………………………………...................................................................... 67
Table 4.11. Risk Ratio Table for Vehicles, Equipment, Tools and Utensils………………... 67
Table 4.12. Certified Growers, Respondents, and Percentage…………………….….……... 83
Table 4.13. Characteristics of Produce Growers by the Produce they grow……….………... 84
Table 4.14. Market Where Grower Sell Their Produce……………………………………... 85
Table 4.15. Reliability of Scales Measuring Produce Growers’ Challenge to Meet Food
Safety Standards…………………………………………………………………………
86
Table 4.16. Challenging Food Safety Standards related to Food Safety Plan.……………… 87
Table 4.17. Challenging Food Safety Standards related to Documentation………………… 88
Table 4.18. Challenging Food Safety Standards related to Employees’ Training.…………. 89
Table 4.19. Challenging Food Safety Standards related to Water Management……………. 90
Table 4.20. Challenging Food Safety Standards related to Cleaning Procedures…………… 90
Table 4.21. Challenging Food Safety Standards related to Harvesting policy……………… 92

ix
Table 4.22. Challenging Food Safety Standards related to Transportation.………………… 92
Table 4.23. Challenging Food Safety Standards related to Risk assessments………………. 93
Table 4.24. Rating of the Challenge to Comply with Other Food Safety Standards………... 94
Table 4.25. Ranking of Overall Challenging Standards………………………………….…. 95
Table 4.26. Test of Association for Produce Type and Writing Procedures for Cleanliness
and Proper Functioning of Shipping Units……………………………………………. 98
Table 4.27. Test of Association Between Produce Type and Writing a Policy on On-Farm
Trash Handling………………………………………………………………………… 99
Table 4.28. Amount of Information from Various Sources………………………………… 100
Table 4.29. Barriers to Implement GAPs…………………………………………………… 102
Table 4.30. Chi-Square Test of Association Between Time and Challenge to Comply Food
Safety Standards………………………………………………………………………… 103
Table 4.31. Chi-Square Test of Association Between Cost and Challenge to Comply Food
Safety Standards………………………………………………………………………… 104
Table 4.32. Chi-Square Test of Association Between GAP resources and Challenge to
Comply Food Safety Standards………………………………………………………… 106
Table 4.33. Chi-Square Test of Association Between GAP knowledge and Challenge to
Comply Food Safety Standards………………………………………………………… 108
Table 4.34. Barriers to Carry out Risk Assessment………………………………………… 109
Table 4.35. Chi-Square Test of Association Between Challenge to perform a pre-harvest
risk assessment and barriers to carry out risk assessments …………………….……… 111
Table 4.36. Chi-Square Test of Association Between Challenge to Conduct a Water
System Risk Assessment and Barriers to Carry Out Risk Assessments ………………. 112
Table 4.37. Chi-Square Test of Association Between Challenge to Write a Risk
Assessment Plan on Domestic and Wild Animal and Risk Assessment Barriers……… 113
x
ACKNOWLEDGEMENTS
I would like to extend my science gratitude to my academic advisor and committee chair
Dr. John Ewing for his continuous support and cooperation of my Ph.D. research. I would like to
gratefully thank Dr. Edgar Yoder, Dr. Luke LaBorde, and Dr. Connie Baggett for their guidance.
I would like to thank Dr. Joan Thomson for her guidance and encouragement. My sincere thanks
also goes to Ms. Jenifer Dougherty and Mr. Ken Peterson of USDA-AMS for their assistance in
obtaining audits and Mr. Jeffrey Stoltzfus and Ms. Lee Stivers of Penn State Extension for their
help with surveying growers. I would also like to thank Terra Ingram for her administrative
support. In addition, I thank my parents, family members, friends, and colleagues. I could not
have accomplished this achievement without their support.

1
Chapter 1
Introduction
Foodborne Illness Outbreaks
Foodborne disease is one of the major public health concerns in the World. The World
Health Organization (WHO) estimates that each year millions of people die worldwide with
foodborne diseases due to microbiological contamination food and water (WHO, 2014). The
Centers for Disease Control and Prevention (CDC), which monitors and investigates multistate
outbreaks, reports that one out of every six Americans is affected by foodborne illnesses
resulting in approximately 3000 deaths each year (CDC, 2016a).
The investigations of multistate foodborne outbreaks linked numerous cases of
hospitalization and deaths to consumption of contaminated produce (CDC, 2016b). Foodborne
disease associated with fresh fruits and vegetables has increased greatly during the years 1970 to
1990 (Lynch, Tauxe, & Hedberg, 2009). Furthermore, the Center for Science in the Public
Interest (CSPI) has reported that during 2002 and 2011, 17% of total outbreaks and 23,748
illnesses were due to produce related outbreaks (CSPI, 2014).
Food items can be contaminated with disease-causing pathogens at any stage within the
food supply chain, from farm to fork. The following paragraphs offer a brief account of
foodborne illness outbreaks linked to produce in recent years in the U.S. and the sources of
contaminations for each. Recently, a multistate outbreak was attributed to Escherichia coli O157
(STEC O157) contaminated alfalfa sprouts produced by Jack & Green Sprouts of River Fall,
Wisconsin (CDC, 2016d). Consumption of cucumbers contaminated with Salmonella resulted in
six deaths and 204 hospitalizations in 2015-16 (CDC, 2016c); and the 2014 Salmonella outbreak
2
associated again with cucumbers infected 275 people in 29 states of the U.S. (Angelo et al.,
2015).
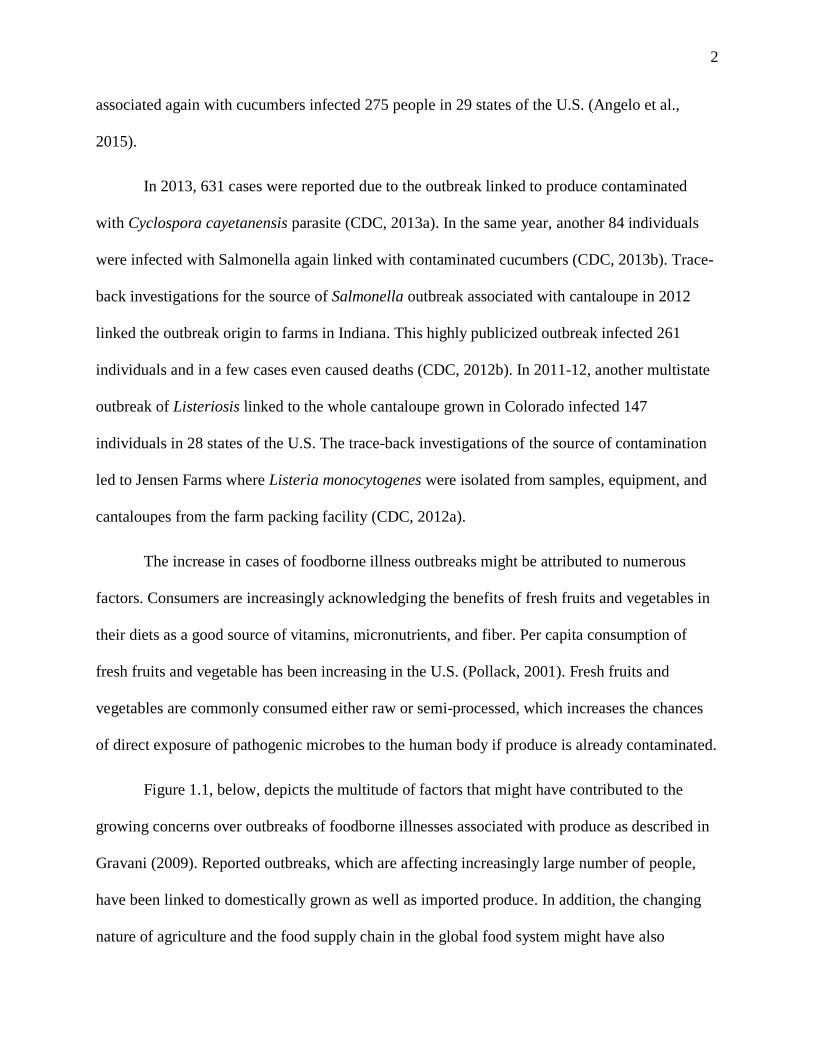
In 2013, 631 cases were reported due to the outbreak linked to produce contaminated
with Cyclospora cayetanensis parasite (CDC, 2013a). In the same year, another 84 individuals
were infected with Salmonella again linked with contaminated cucumbers (CDC, 2013b). Trace-
back investigations for the source of Salmonella outbreak associated with cantaloupe in 2012
linked the outbreak origin to farms in Indiana. This highly publicized outbreak infected 261
individuals and in a few cases even caused deaths (CDC, 2012b). In 2011-12, another multistate
outbreak of Listeriosis linked to the whole cantaloupe grown in Colorado infected 147
individuals in 28 states of the U.S. The trace-back investigations of the source of contamination
led to Jensen Farms where Listeria monocytogenes were isolated from samples, equipment, and
cantaloupes from the farm packing facility (CDC, 2012a).
The increase in cases of foodborne illness outbreaks might be attributed to numerous
factors. Consumers are increasingly acknowledging the benefits of fresh fruits and vegetables in
their diets as a good source of vitamins, micronutrients, and fiber. Per capita consumption of
fresh fruits and vegetable has been increasing in the U.S. (Pollack, 2001). Fresh fruits and
vegetables are commonly consumed either raw or semi-processed, which increases the chances
of direct exposure of pathogenic microbes to the human body if produce is already contaminated.
Figure 1.1, below, depicts the multitude of factors that might have contributed to the
growing concerns over outbreaks of foodborne illnesses associated with produce as described in
Gravani (2009). Reported outbreaks, which are affecting increasingly large number of people,
have been linked to domestically grown as well as imported produce. In addition, the changing
nature of agriculture and the food supply chain in the global food system might have also

3
contributed to food safety concerns. Moreover, events such as increasing number of multistate
outbreaks, identification of new human pathogens on produce, and reports of inefficient pre-and
post-harvest handling contribute to the growing concern over produce safety.
Figure 1.1. Contributing factors to produce safety concerns (from Gravani, 2009)
Incidences of outbreaks have been a major concern not only for public health reasons but
also for the economic and social cost that are incurred. Griffith, Mullan, and Price (1995) listed
the economic and social costs linked to food safety. Economic costs include expense associated
with treatment, investigation, legal activity, and diminished business activity. Business cost
includes loss of productivity, expenses incurred due to produce recall, loss of demand,
destruction of produce, investigation time, administrative, and remedial costs. There are also
social costs, such as disability, pain, grief, and anxiety. As per the U.S. Department of
Agriculture (USDA), each year foodborne illnesses cost $15.6 billion (CDC, 2016a). The exact
Food safety concerns linked to produce
Number of produce
outbreaks
Number of people
affected
Produce outbreak
proportion
Wide variety of fresh produce Micro-
biological agents
Domestic and imported
produce
Changing food supply
chain

4
estimation of such incidences is often not possible because many cases of foodborne illness
associated with consumption of fresh produce go undetected or not reported.
Food safety hazards can be physical, chemical, or biological. Biological hazards
(microbial pathogens), similar to chemical and physical hazards, can contaminate produce at any
stage of food supply chain. Biological hazards include contamination due to pathogenic microbes
such as bacteria, viruses, and parasites. A variety of microbial pathogen may cause
contamination of produce and these pathogens responsible for foodborne outbreaks usually can
survive extensive periods of transportation or storage before they reach the consumer. Tauxe
(2002) identified bacteria as one of the major causative agents of produce contamination linked
to numerous foodborne illness outbreaks in the U.S.
The growing food quality and safety concerns prompted the food industry to introduce
preventive measures to control food from various potential hazards. Hazard Analysis Critical
Control Point (HACCP) is a set of proactive measures adopted by food industries to address food
safety concerns. The purpose of HACCP is to reduce the risk of food contamination from
potential hazards at Critical Control Points (CCPs) within food production and processing
facilities. According to Notermans, Gallhoff, Zwietering, and Mead (1995) “CCPs are defined as
points, procedures, etc. at which a hazard can be eliminated or reduced to acceptable levels” (p.
89).
The established HACCP criteria for controlling microbial pathogens and other hazards
can be elaborated in three steps (Notermans, Gallhoff, Zwietering, & Mead, 1995). Step one
refers to the compilation of a list of food item specific hazardous micro-organisms. The second
step includes quantitative assessment of potentially hazardous microbial growth and determining
an acceptable level of microbes. The third step refers to taking corrective measures if

5
unacceptable microbe counts are observed in food. In other words, these three steps emphasize
establishment of controlling factors and describe the process of hazard identification, evaluation,
and control action. The very first step to identify the source of contamination is to evaluate the
possible food vehicles for pathogens causing outbreaks.
Before the introduction of HACCP, the safe production of food was regulated by
ordinances and monitored by local and international bodies. There were chances that unsafe or
contaminated products might be missed from inspections under those regulations. That situation
called for the introduction of Good Manufacturing Practices (GMP). This concept of GMP, later,
expanded to HACCP, introduced safety criteria for specified CCPs in food production and
processing facilities. HACCP has been used as an instrument to ensure a controlled environment
for food safety (Mortimore & Wallace, 1998). The process steps under HACCP are can
significantly reduce biological contaminants (LaBorde, 2011). On the other hand, reduction of
biological agents to an acceptable level from fresh produce requires multiple preventive
measures at more than one process step. Therefore, Sperber (2005) and Soon, Manning, Davis,
and Baines (2011) questioned the appropriateness of HACCP principles to significantly
eliminate biological hazards from produce on the farms (as cited in LaBorde, 2011).
On-Farm Food Safety Practices
Investigation reports on produce related outbreaks by CDC traced sources of
contamination to farms where the farm setting and practices might have caused the
contamination (CDC, 2016a). Practices such as cleaning and irrigating with contaminated water,
poor handling and processing practices, use of contaminated and untreated manures, lack of
adequate storage infrastructure, and less efficient regulatory systems contribute to creating a
high-risk environment (WHO, 2015). Lynch et al. (2009) expressed concern over the greater

6
likelihood of food contamination during produce field production, initial processing, and final
preparation phase.
The concept of Good Agricultural Practices (GAPs) has evolved with the growing
concerns over food quality, safety, and sustainability raised among the consumers, retailers,
governments, processors, and growers (FAO, 2003). Moreover, the incidences of foodborne
illness outbreaks and subsequent investigations linking the source of contamination to farms
have mobilized the adoption of GAPs. GAPs have been assessed as an effective measure to
reduce the risk of produce contamination on the farms. Once produce is contaminated with
disease-causing hazards, it becomes difficult to disinfect them. Therefore, preventive measures
such as GAPs are more desirable than corrective actions when outbreaks occur.
According to FAO (2003), “GAP applies available knowledge to addressing
environmental, economic and social sustainability for on-farm production and post-production
processes resulting in safe and healthy food and non-food agricultural products.” Apart from
meeting the regulatory requirement of the government or private retailers, GAPs also ensure
quality and safety of produce, create new market opportunities, and improve farm workers’
health and working environment (FAO, 2008). There are major economic benefits to the
growers, such as economic risk reduction and increased opportunity for market access (Rejesus,
2009).
In 1998, the U.S. Food and Drug Administration (FDA) in partnership with the U.S.
Department of Agriculture (USDA) released guidance for the food industry to minimize
microbial food safety hazards for fresh fruits and vegetables (USFDA, 1998). Although the guide
offers a broad range of guidelines for growers to address risk areas in farming practices through
implementation of GAPs and GMPs, specifically it focuses on microbial hazards and risk
7
reduction not risk elimination. The primary purpose of GAP guidance is to reduce the possibility
of microbe contaminations associated with practices application of raw manure or improperly
treated compost, contaminated agricultural or processing water, unhygienic practices by farm
workers, and poor sanitary facilities. The FDA’s GAPs guide is based on the following eight
principles (Gravani, 2009, p. 109):
Principle 1: The prevention of contamination is favored over reliance on corrective measures
once contamination has occurred.
Principle 2: Use of GAPs in those areas of farm practices where growers have a degree of
control while not increasing risks to the food supply.
Principle 3: Anything that comes in direct contact with fresh produce has the potential of
contaminating it.
Principle 4: The source and quality of water can be the indicator of contamination when water
directly comes in contact with produce.
Principle 5: Manure or municipal bio-solids should be managed properly in farm practices to
minimize contamination.
Principle 6: Appropriate standards on worker hygiene and sanitation should be implemented
during production, harvesting, packing, and transportation.
Principle 7: Follow all food safety regulations (local, state, and federal) or standard
agricultural practices.
Principle 8: Accountability in all steps of agricultural environment for a successful food safety
program.

8
Third-Party Audits
The frequent occurrence of multistate outbreaks and subsequent economic cost and health
causalities have prompted governments and food retailers to impose food safety regulations on
produce growers. Food retailers and supermarkets formulated food safety standards for their
produce suppliers that are more or less aligned with FDA’s GAPs guidance. Thus, FDA’s GAP
guidelines have been the basis for most of the industry initiated food safety policies for growers
(Petersen, 2009).
Compliance with GAPs standard ensures that produce growers have taken appropriate
food safety measures on their farms as indicated in the GAP guidance to minimize the risk of
produce contamination. In this regard, a third-party audit is critical to ensure neutral and
impartial assessment of safety standard compliance. Russell (2000) defined third-party audit as
an audit “performed by an audit organization independent of the customer-supplier relationship
and is free of any conflict of interest” (as cited in Petersen, 2009, p. 323). Third party audits
serve as a tool for retailers and other produce buyers to verify that the produce they purchase has
been grown under an established GAP program.
In 1999, Safeway Inc. introduced the requirement of third-party audits for its produce
suppliers. Their audit requirements were initially limited to high-risk produce, but later expanded
to all fruits and vegetables. Another evidence of the growing importance of Third-Party
Certificates (TPC) and GAPs is that in 2006, the USDA Agricultural Marketing Service (USDA-
AMS) announced the requirement of TPC from produce suppliers for their feeding assistance
programs to ensure that GAPs and GMPs were being followed by the suppliers (as cited in
Petersen, 2009). Produce retailers of Pennsylvania are more likely to demand their suppliers to

9
provide evidence of growers’ GAP compliance in the form of TPCs (Tobin, Thomson, LaBorde,
& Bagdonis, 2011).
TPCs by third-party auditors are unbiased proof of GAP compliance. In general, auditors,
experts in verifying standard food safety practices on the farm, are responsible for certifying
farms. TPC ensures produce which is coming out of farms have the lowest possible chance of
microbe contaminations and hence, is safer for consumption. Popular certification bodies such as
Global G.A.P, International Food Services (IFS), and USDA-AMS have adopted the principles
woven into the GAP framework as the basics of auditing criteria.
Jahn, Schramm, and Spiller (2003) presented a certification system (Figure 1.2) that can
be applicable to various food safety certification systems, where growers are positioned as first-
party and produce retailers as the second-party. More detail on the audit process is provided in
the theoretical framework section of chapter 2.
Figure 1.2. Food supply chain under regulated system (from Jahn, Schramm, & Spiller, 2003)

10
Audit standards and requirements vary among auditing firms and the retailers to which
growers supply their produce. However, growers make the final decision of choosing the
appropriate third-party certifier (Rejesus, 2009). In other words, growers supplying to various
retailers have to meet different certification standards, thus creating a potential audit fatigue
situation for growers. Describing reasons for audit fatigue Koch (n.d.) stated that in the absence
of a standardized certification process, it as one of the major challenges for produce suppliers to
meet different buyers’ requirements with single a single audit. Growers suffer audit fatigue by
meeting the food safety requirement of multiple buyers by going through multiple audit
processes and allocating time and resources. In other words, audit fatigue arises due to multiple
duplicative standards and GAP audits. GAPs harmonization initiative and Global Food Safety
Initiative (GFSI) were two initiatives taken to harmonize food safety standards (Gorny, n.d.).
Harmonization of GAPs Food Safety Standards
To reduce audit fatigue, the United Fresh Food Safety and Technology Council planned
to harmonize GAP standards that lead to Produce GAPs Harmonization Initiative by the effort of
stakeholders across the supply chain (“Harmonized food safety,” 2013). The initiative began in
2009 with an idea that one audit by any credible third party would be acceptable to all produce
buyers and thus reducing the audit burden on growers (Gombas, 2010, 2013). Reflecting on the
goal of the Harmonization Initiative, the Food Safety Magazine reported that:
The goal of the Produce GAPs Harmonization Initiative is one audit by any credible third
party, acceptable to all buyers. To achieve this goal, the Initiative developed food safety
Good Agricultural Practices standards and audit checklists for pre- and post-harvest
operations, applicable to all fresh produce commodities, all sizes of on-farm operations

11
and all regions in the U.S., and has made them available for use by any operation or audit
organization at no cost. (“Harmonized food safety,” 2013, para. 3)
The proposed produce rules under the Food Safety Modernization Act (FSMA) are
largely in compliance with harmonized standards. Since that initiative, buyers are increasingly
accepting and encouraging their suppliers to adopt harmonized food safety standards (Gombas,
2013). Produce buyers that are accepting harmonized standards include Wegmans, Costco,
H.E.B, Kroger, SAFEWAY, Subway, Sysco, and many other buyers. On the other hand, the
agencies that are performing GAPs audits using harmonized standards include Global G.A.P.,
NSF, SCS Global Services, SGS, and Equicert. The USDA is among the organizations that carry
out GAP audits using produce harmonized standards. Ken Petersen, head of USDA-AMS’s Fruit
and Vegetable Program audit section, advocates that:
USDA played an active role in helping the industry develop sound harmonized GAPs and
GHPs (Good Hygiene Practices) produce standards. We were also among the first to
perform audits using the Harmonized Standards, which helps ensure that American
produce food safety criteria are met. Many retailers specifically request harmonized
GAPs audits, so we work with fruit, vegetable and specialty crop suppliers of all sizes to
verify their on-farm practices meet or exceed the standards, and we’ve seen many
growers successfully migrate to the harmonized audit. (Gombas, 2013, Where We Are
section, para. 11)
Figure 1.3, below, shows the proposed parameters for the harmonizing of GAPs audit
standards. One of the major parameters of harmonization was that the standards should be
consistent with FDA’s GAPs guidance. The other parameters emphasized how standards should
be of science-based, attainable, auditable, and verifiable; scalable to all size farm operations; and

12
freely accessible to buyers, sellers, and auditors. More specifically, the two parameters in
particular –1) applicability of standards to all the North American operations and 2) their
appropriateness for the regional- and commodity-specific food safety needs– were the basis of
this study’s research hypotheses.
Figure 1.3. Parameters used in preparing Harmonized GAPs standard (from Gombas, 2013)
Over the years, the number of farms audited with USDA harmonized GAPs standards
have increased. Completing an audit could be a sound investment for the business. A food safety
plan that has been created as a response to GAP compliance can help the farm to keep sanitized
and manage records. In addition, GAPs Harmonized plan is a comprehensive management plan
that acknowledges maintenance of documents of standard food safety implementation and
practices as a sign of a robust and a credible food system. The theoretical framework section of
Harmonization of GAP Standards
Consistent with
FDA's GAPs guide Applicable
to North American operations
Risk-based and
Science-based
FDA's regulations on physical
Hazards
Operations of all sizes
Regional and
Commodity-Specific
needs
Acceptable by
customers
Freely accessible
13
this study provides an overview of the USDA Produce GAPs Harmonized audit standards as well
as the criteria for obtaining certification.
Areas of Research Concern
For a safer food supply and a viable economy, produce growers are increasingly
encouraged by outreach programs and the retailers to adopt GAPs on their farms and apply for
TPC. The GAPs guidelines recommend growers to change some of their traditional agricultural
practices that may enhance the risk of produce contamination. One of the key objectives for
implementation of GAPs and passing an audit is that produce growers are taking all necessary
steps to minimize the risk of produce contamination to ensure that produce is safe for
consumption.
On the other hand, in this given scenario that recognizes the undeniable significance of
GAPs in reducing the chances of microbe contaminations of produce, it is not always the case
that growers have been able to successfully implement GAPs on their farms and pass the audits.
In other words, even though growers are increasingly valuing GAPs, they are not consistently
practicing GAPs on their farms (Lewis Ivey, Lejeune, & Miller, 2012). Gravani’s (2009)
argument further articulates the disconnect between knowledge and action:
Although most growers and packers are now aware of the importance of food safety
and the need to reduce the microbial hazards and risks associated with the growing,
harvesting, and packing of fresh fruits and vegetables, implementation remains
inconsistent (p. 115).
Assessment of these inconsistencies is vital for successful implementation of GAP programs.
Moreover, identification of particular food safety standards where such inconsistencies exist will
help experts, educators, and risk communicators to strategize their outreach programs to assist
14
produce growers efficiently. Successful implementation of GAP programs requires identification
of challenging food safety standards. These are areas of food safety where growers are
unsuccessful in complying with GAP standards; they relate to preventive controls, risk
assessments, traceability, documentation, and record keeping. Limited studies are available that
specifically assess on-farm implementation of the Harmonized GAPs standards or identify
standards that are difficult to comply with by the produce growers of Mid-Atlantic States and
New York.
Moreover, identification of areas of frequent GAP noncompliance needs to be studied
along with the factors for contributing to difficulties that growers are facing in implementing
GAPs. Interventions are necessary for educational and other supportive agencies to prepare
produce growers to specifically address those issues before applying for an audit. Growers’
failure to implement GAP guidelines necessitates a discussion on the barriers or challenges that
growers are facing with regard to GAPs implementation. A better understanding of areas of
GAPs noncompliance and growers’ on-farm challenges to implementing GAPs will help food
safety program planners and policy enforcing agencies to come up with strategies to accomplish
their programming/policy objectives.
In the context of Extension’s food safety programming, evaluation findings often do not
offer significant information on the standards that growers may find challenging when
attempting to comply with the requirements. Accordingly, existing programs may not be
effectively preparing participating produce growers to adopt GAPs on their farms. Analysis of
evaluations of Penn State Extension’s food safety programs for the 2013 growing season
provided sparse evidence to explain growers’ GAP implementation barriers (Nayak, Tobin,
Thomson, Radhakrishna, & LaBorde, 2013).

15
This study begins with the premise that the GAP standards where growers often fail to
comply with the requirement can be identified from GAPs audit reports. Programs that identify
challenging standards and improve their curriculum addressing those standards will better
prepare produce growers to implement GAPs effectively. On the other hand, the experience of
produce growers who have already been through the auditing process may also be useful in
informing the efforts of educators aimed at better preparing growers for certification.
This current study intends to determine challenging food safety policy requirements and
communicate them to outreach (Extension) and certifying agencies. Scarce evidence on
problematic produce safety standards prompted this study to evaluate the on-farm
implementation of GAPs food safety standards using auditors’ on-farm observations to food
safety standards and produce growers experience with GAP implementation.
Purpose and Objectives
This study was an attempt to strengthen food safety communication between audit
agencies and produce growers by taking their perspectives into account. The consistency of
evidence from the GAP harmonized audits and from the produce growers themselves would be
vital to the whole concept of GAP adoption.
The primary purpose of the study was to assess on-farm implementation of GAPs
harmonized food safety standards for field operations and harvesting by produce growers. The
study focused on various aspects of GAP implementations that included the frequency of
corrective actions for an individual harmonized GAP standard, the criteria of noncompliance,
growers’ experience with GAP implementation with relationship to farm locations, commodity
type, and barriers to GAP adoption and carrying out risk assessments. The objectives that guided
the study were as follow:
16
1. Identify areas of frequent GAP noncompliance through analysis of produce USDA
Harmonized GAP audits for field operations and harvesting of Mid-Atlantic States:
Pennsylvania, Delaware, Maryland, New Jersey and Virginia including New York;
2. Describe the aspects of field operations and harvesting harmonized food safety standards
and criteria of noncompliance;
3. Identify the most challenging GAPs harmonized food standards for growers of Mid-
Atlantic states and New York using a mail survey;
4. Determine sources of GAP information and barriers to implementing GAPs and carrying
out risk assessments on the farms.
Study Assumptions
The study was based on three key assumptions as follow:
Assumption 1: An audit is a key evaluation tool to identify deficiencies in GAP
compliances.
Assumption 2: Farm operations audited by agencies other than USDA such as GLOBAL
G.A.P. and SCS Global Services share identical characteristics with the
USDA audited farms in terms of farm practices, needs, and challenges.
Assumption 3: The frequency of corrective action required for a GAP harmonized food
safety standard during the auditing process is positively associated with the
challenges that growers face to comply with that standard.
Study Limitations
The study only focused on the farm operations that were audited by the USDA. The
addition of farm operations audited by other agencies might have added more variation to the
dataset, particularly for states having small sample sizes. Moreover, due to small sample sizes
17
from MD, VA, and DE, the researcher was not able to compare survey findings among these
states. Therefore, non-probabilistic sampling might be a study limitation and impose restrictions
on generalizing the findings to the entire population of harmonized GAP certified growers. The
audit analysis included farms that were audited for the growing season of 2013-14. On the other
hand, the survey was administered to growers audited for the growing season of 2015-16. The
study recognizes the process of validation and comparison of findings from two samples audited
in two different seasons might be a study design weakness.
Organization of Dissertation
Chapter 1 provides the basis for third-party audits and harmonization of GAPs food
safety standards supported by a narration on the background information related to the
occurrences of foodborne outbreaks associated with fresh produce and sources on contamination
linked to farm practices. This chapter introduces the areas of research concern and defines the
study purpose, objectives, assumptions, and limitations. Chapter 2 focuses on review of the
literature covering multiple topics relevant to the study such as on-farm contamination of
produce, preventive measures, risk assessment, and GAP compliance as determined from survey
research results. Chapter 2 also describes the theoretical model as well as the produce USDA
GAPs harmonized audit process.
Chapter 3 defines the research design adopted in the study. This chapter also focuses on
document analysis, survey instrumentation, population, sample, survey administration and
analysis. Chapter 4 presents all the data analysis results under each of the study objectives.
Chapter 5 discusses the study results and provides study conclusions. This chapter specifically
emphasizes the implication of study findings for Cooperative Extension programming and offers
further research recommendations.
18
Chapter 2
Review of Literature
The Center for Science in the Public Interest (CSPI) reported the occurrence of 23,857
cases of foodborne illness due to 428 outbreaks related to produce and produce dishes between
1990 and 2003 (DeWaal & Barlow, 2004). Reviewing foodborne illness outbreak trends in the
U.S. from 2004 to 2013, the CSPI reported that produce caused more illness with higher number
outbreaks (other than multi-ingredients) than any other food category (Fisher, Bourne, &
Plunkett, 2015). Furthermore, over the period of ten years, between 2004 and 2013, produce
alone caused 629 outbreaks resulting in more than 20,000 cases of illnesses. The same report
also indicated that an average number of diseases per outbreak was largest for produce-related
outbreaks. However, when considering pound for pound fruits and vegetables are safest for
consumption; and seafood, poultry, pork, and beef were riskier of illness than produce (Fisher,
Bourne, & Plunkett, 2015).
On-Farm Contaminations
North Carolina Cooperative Extension report briefly highlighted three separate case
studies of foodborne illness outbreaks associated with produce: (1) cantaloupe in May 2002, (2)
green onions in 2003, and (3) the highly-publicized spinach outbreak in 2006 (Rejesus, 2009).
The spinach outbreak in 2006 was associated with contamination due to Escherichia coli (E.
coli) O157:H7. The investigation into the cause of the outbreak identified bacteria in the
irrigation water sample and animal feces on the ranch. Produce in the pre-and post-harvest
environment on the farms can be contaminated by numerous agents such as soil, wind, manure,
19
water, dust, wildlife, farm equipment, and most importantly workers’ handling of produce
(Hajmeer & Crozier-Dodson, 2012).
In 1996, an outbreak of E. Coli O157:H7 resulted in infections and diseases,
hospitalizations, and even three cases of hemolytic-uremic syndrome in Connecticut and Illinois.
The investigation linked mesclun lettuce from a single produce grower as the source of the
outbreak. The field investigation also revealed that water might be the likely source of E. Coli
O157:H7 contamination of lettuce. The investigation team observed multiple potential sources of
contamination on the farm that included chickens having access to both lettuce field and adjacent
beef cattle operations, recirculation of wash water, no hand washing facilities, no use of gloves
by workers, and boxes reused for lettuce (Hilborn et al., 1999).
Buchat and Ryu (1997) provided a brief account of pre-harvest practices that promote
produce contamination by pathogenic microorganisms such as Listeria monocytogenes,
Salmonella, and pathogenic E. Coli. Microbes present in irrigation water, manure, or untreated
sewage contribute towards produce contaminations. Untreated sewage with human pathogen if
used as fertilizer may more likely contaminate produce. Irrigation water contaminated with
human waste may be a source of pre-harvest contamination of produce on the field (Wachtel,
Whitehand, & Mandrell, 2002).
Beuchat (1996) listed sources of microbial contamination during pre-harvest practices.
These sources include feces, soil, irrigation water, water used to apply fungicides and
insecticides, green or inadequately composted manure, air (dust), wild and domestic animals,
insects, and human handling (as cited in Beuchat & Ryu, 1997). Regarding the contact of non-
root produce to ground, Beuchat and Ryu (1997) stated that “whatever the case, soil on the
surface of fruits and vegetables may harbor pathogenic microorganism so that remain viable

20
through subsequent handling to the point of consumption unless effective sanitizing procedures
are administrated” (p. 461). For example, Listeria can be found in soil, vegetation, water, and
pressing equipment on the farm, and raw fruits and vegetables are the medium of listeria
distribution in food supply (Harris, 2002; as cited in Hajmeer & Crozier-Dodson, 2012).
Detection of microorganisms on produce is often challenging. The type and levels of microbe
contamination depend on commodity types and level of post-harvest processing (León, Jaykus,
& Moe, 2009).
Preventive Measures
Prevention of produce contamination is vital in outbreak control efforts. Development
and implementation of Good Agricultural Practices (GAPs) are the first steps to control
contamination of produce with foodborne illness pathogen. GAPs are the prerequisite for the
development of Hazard Analysis Critical Control Point (HACCP) (Delazari, Riemann, &
Hajmeer, 2006). Preventive measures should be prioritized to control produce contamination
rather than a responsive measure. However, implementation of preventive measures is not an
easy task. Powell, Jacob, and Chapman (2011) asserted that “it remains a challenge to compel
food producers, processors, distributors, retailers, foodservice outlets and home meal preparers to
adopt scientifically validated safe food-handling behaviors, especially in the absence of an
outbreak” (p. 817).
Produce growers have a vital role in the prevention of contamination of produce.
Growers’ on-farm decisions to reduce risks of microbial contamination have implications on the
health of consumers. Cited in Powell et al. (2011) the U.S. Government emphasized that food
safety as the primary responsibility of food producers even in the presence of inspectors’
supervision of compliance. Bihn and Gravani (2006) suggested that “growers need to carefully
21
evaluate every phase of their [farming] operation and develop specific food safety plan
(program) that addresses the hazards and risks that are present” (as cited in Gravani, 2009, p.
108). Therefore, it is important for produce growers to make decisions wisely and understand the
consequence of produce contamination due to their practices on society and also benefits of
adopting standard food safety practices.
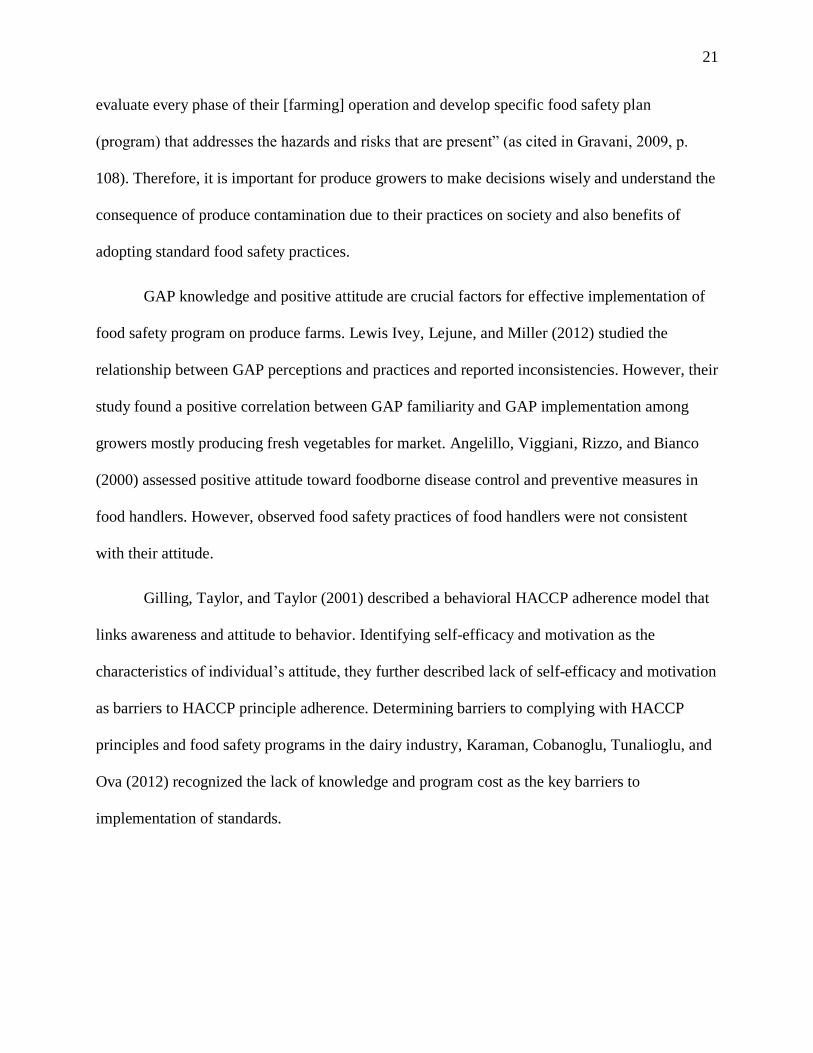
GAP knowledge and positive attitude are crucial factors for effective implementation of
food safety program on produce farms. Lewis Ivey, Lejune, and Miller (2012) studied the
relationship between GAP perceptions and practices and reported inconsistencies. However, their
study found a positive correlation between GAP familiarity and GAP implementation among
growers mostly producing fresh vegetables for market. Angelillo, Viggiani, Rizzo, and Bianco
(2000) assessed positive attitude toward foodborne disease control and preventive measures in
food handlers. However, observed food safety practices of food handlers were not consistent
with their attitude.
Gilling, Taylor, and Taylor (2001) described a behavioral HACCP adherence model that
links awareness and attitude to behavior. Identifying self-efficacy and motivation as the
characteristics of individual’s attitude, they further described lack of self-efficacy and motivation
as barriers to HACCP principle adherence. Determining barriers to complying with HACCP
principles and food safety programs in the dairy industry, Karaman, Cobanoglu, Tunalioglu, and
Ova (2012) recognized the lack of knowledge and program cost as the key barriers to
implementation of standards.

22
Risk Assessments
Risk assessments are key components of GAPs Harmonized Food Safety Standards.
Rowe (1977) provided a general definition of risk as the probability that something undesirable
will happen (as cited in Harwood, 2000). Douglas (1992) defined risk as “the probability of an
event combined with the magnitude of the losses and gains that it will entail” (p. 40). The term
“probability” has been an integral component in studies that quantify characteristics of risk. On
the other hand, the qualitative aspects of risk emphasize the component of uncertainty in
combination with some sort of damage, an uncertain outcome from an activity (Kaplan &
Garrick, 1981). In the context of multistate outbreaks, the risk of foodborne illness can be
explained by the risk of getting sick or hospitalized or even dying as a result of consumption of
contaminated food. Lammerding and Fazil (2000) argue that “the risk of foodborne disease is a
combination of likelihood of exposure to a pathogen in food, the likelihood that exposure will
result in infection or intoxication, and subsequently illness and severity of the illness” (p. 147).
Growers are required to perform and write pre-harvest and water system risk assessments
to comply with standards regarding risk assessments. Such assessments include identification of
the source of physical, biological and chemical hazards and written procedures to address the
potential risk of produce contamination due to the hazards. Limited literature is available that
specifically focused on establishing relationship between growers’ perception of risk and food
safety behavior. Keraita, Drechsel, and Konradsen (2008) studied the farmers’ health risk
perception with the relationship to use of contaminated water in vegetable farming in Ghana.
Their study indicated that even though farmers were aware of health risks associated with the use
of contaminated water, their risk reduction practices were largely influenced by growing pressure
from media and authority.
23
Bihn, Smart, and Hoepting (2013) advocated that produce growers have the responsibility
to recognize the risk associated with their farm practices and should address those risks by
adopting food safety practices. Isin and Yildirim (2006) studied the effect of farmers’
perceptions of the harmfulness of pesticide use on their farm practices. Their study indicated
farmers who perceive pesticides as harmful to the environment were more sensitive to their
practices. Cary and Wilkinson (1997) in developing a regression model conclude that
perceptions of profitability and personal environmental concerns as key factors to explain
farmers’ conservation behaviors.
Growers carry their personal beliefs on the risk associated with their on-farm practices,
and it can be argued that these perceived risks influence their on-farm actions. Growers’ personal
beliefs of risks may potentially influence how they evaluate the risk associated with their on-
farm practices. Their low levels of perceived risk may indicate that growers possess a false sense
of security regarding their on-farm practices (Tucker & Napier, 1998). At the same time, auditors
also hold a set of beliefs about the risk associated with farm practices and what growers should
do in response to minimize the possibility of produce contamination.
Inaccuracies and inconsistencies in auditors and growers’ risk perceptions and assessment
may hurt the purpose of the GAP certification program. For an effective implementation of risk
assessment programs, there needs to be consistencies in perceived risks by the auditors and
produce growers. Effective communication between growers and auditors may reduce the
underestimation or overestimation of risk in assessments. Inconsistencies in risk evaluations may
stand as an obstacle to GAP certification process.
24
Compliance with GAPs
Studies were conducted to assess growers’ compliance with food safety practices in
several states of the United States. The general methodology in these studies were self-report
surveys. Hultberg, Schermann, and Tong (2012) developed a survey based on Food and Drug
Administration’s (FDA) GAP guidelines to measure Minnesota vegetable growers’ compliance
with GAPs. In that self-reporting survey, the majority of the respondents indicated
implementation of GAPs with regards to workers’ health and hygiene, access to safe and clean
drinking water for workers, workers’ food safety training, having a Standard Operating
Procedures (SOPs), sanitization of containers, and cleanliness of farm tools. Their study also
identified deficiencies in a few areas of GAP practices such as treatment of water used for
washing and cleaning, keeping the animals out of fields, and regular cleaning of harvesting tools
as per food safety policy.
Rangarajan, Pritts, Reiners, and Pedersen (2002) surveyed New York fruits and vegetable
growers to assess their manure, compost, and on-farm water quality management practices with
federal guidelines. Similar studies were conducted in six New England States (Cohen,
Hollingsworth, Olson, Laus, & Coli, 2005) and in seven states across the U.S. (Jackson et al.,
2007). Ellis et al. (2005) conducted a similar study in Iowa using observation and interviews
with farmers.
Cohen, Hollingsworth, Olson, Laus, and Coli (2005) surveyed fruit and vegetable
growers in six states of New England. Water from wells were major drinking and irrigation water
sources in those surveyed farms. Around one-third of surveyed farms were unaware of testing
drinking water and a majority of their survey respondents had not tested irrigation water for
coliform. More than 90% of the respondents to the survey did not use sanitizers for water used
25
for washing produce. The majority of the respondents reported that they usually to always wash
their harvest and storage containers before use. Additionally, the majority of the growers handled
food with bare hands. The study showed high adoption of GAPs among the growers of New
England.
Jackson et al. (2007) conducted a comprehensive survey and assessed the growers’ and
packers’ familiarity with the GAPS and implementation of GAPs in Florida, Texas, California,
Georgia, Michigan, New York, and Arizona. Growers were knowledgeable with GAPs
irrespective of their age. Growers recognized the importance of hygienic practices, but the major
obstacles were associated cost and perceived level of difficulty of the policy. Resources such as
supplies and cost were among the major barriers to providing handwashing facilities in the field.
The study showed that GAP awareness is positively related to the likelihood of growers provide
handwashing and toilet facilities to workers (Jackson et al., 2007).
The general belief is that conventional washing and sanitization procedures are enough to
reduce microbial level to a safe level. However, these procedures are not sufficient to ensure
produce safety by entirely reducing microbes on the produce. Condition of contaminations,
interval between contamination and washing, attachment in inaccessible sites, formation of
biofilms, internalization of bacteria within produce are the factors that limit the efficiency of
washing to reduce microbes (Sapers, 2001). Growers should have a basic understand of those
factors while writing a water management plan for their food safety plan.
Bihn et al. (2013) studied the irrigation water sources and management practices by
produce growers of New York and indicated the absence of information related to the quality of
water used in many farm operations. Their study showed that during the growing season,
growers utilize water from various sources such as surface water (pond, stream, and lakes),

26
municipal water and underground or well-water. The majority of their survey participants who
use surface water for irrigation apply the water overhead increasing the risk of produce
contamination. Furthermore, a minor percentage of respondents, who used overhead delivery
method for irrigation, tested surface water for generic E. Coli.
Assessment of water quality through testing is vital for water risk assessment. Bihn et al.
(2013) supported that testing of water is an integral component of water management risk
assessment. Produce growers can make informed management decisions based on the testing
results. In that same survey, growers were asked about having adjacent lands that pose a risk.
Interestingly, almost half of the respondents did not answer the question. Their survey findings
showed a majority of the growers did not have a food safety plan in place. Korslund (2014)
interviewed stakeholders to assess the importance of a food safety plan for small fruits and
vegetable growers of Minnesota. This study also identified barriers to developing and
implementing food safety plans. Those barriers included amount of time, increased cost,
increased paperwork, access to information about food safety plan.
Harrison et al. (2013) surveyed food safety practices on small- and medium-sized farms
and farmers’ market. A slightly majority of their survey respondents indicated animal access to
their agricultural production area. Their survey revealed growers use of the surface, well or
rainwater to irrigate their crop and some growers using untested well-water to wash produce.
Survey respondents used a variety of sanitizers such as mild detergent, liquid soap, 50% bleach
solution, 20:1 water to bleach solution, Sulphur/citric solution, ammonia and water, and
household cleaner with bleach, which touched produce. One-third of the responded always
cleaned the containers carrying produce to the market between uses.

27
Becot, Nickerson, Conner, and Kolokinsky (2012) studied the cost and time associated
with implementing GAPs on the farms of Vermont. Their study found that the GAP adoption
cost ranged between $37 to $54 per acre and approximately 7hr of work per week to meet the
GAP requirements. Becot et al. (2012) also mentioned that regional supermarkets such as
Hannaford, Price Chopper, and wholesale distributors are asking growers for GAP certification.
Their survey showed that GAP certified growers were different from non-certified in terms of
farm size, number of employees, and direct sale of produce to consumers, supermarkets, and
wholesale markets.
Certified growers tend to have large farms and sell relatively less directly. In other words,
a non-certified grower usually sells a higher portion of produce directly to the consumers.
Regarding the barriers to certification, their study reported reasons for growers not to seek GAP
certification. That included, they were selling to buyers that do not require certification and
secondly, their gross selling was not more than $500,000 (FSMA exempt criteria). On an average
GAP-certified farms required two people for record keeping, a total of 7hrs/week. Audit cost was
higher for vegetable growers than apple growers. Similar studies were also conducted by
Hardesty and Kusunose (2009) for leafy green and Wood and Thornsbury (2005) for fresh
strawberries.
LGMA, a voluntary program, was introduced by a group of leafy green handlers of
California in response to E. Coli outbreak associated with Spinach. Hardesty and Kusunose
(2009) surveyed leafy green growers of California to measure LGMA compliance cost. The
study reported an overall increase in cost for compliance with LGMA. The modification of
practices to comply with LGMA cost growers averaged $13.60 per acre.

28
Hamilton et al. (2015) studied the barriers to implementation of GAPs in the vegetable
farms of Minnesota. Farm visits further validated their survey findings. Finding of their study
showed the existence of inconsistencies between self-reporting of GAP incorporation and actual
incorporation to their farm practices. A major inconsistency was observed in growers’ practices
on keeping animals and pests out of farm packing and storage areas. Findings showed a
significant difference between growers’ claim of providing hygienic food handling environment
to farm workers and available records or logs to support that claim and to present to the auditors
during the audit process. The majority of the farms required their employees to wash hands
before starting work. However, the on-farm survey showed 30% of farms had hand washing
signs in their restrooms.
Panisello and Quantick (2001) identified potential technical barriers to implementing
HACCP principles that included the illusion of control, the persistence of old habits and attitude
of personnel, lack of time, lack of motivation and supervision, documentation (paperwork), and
difficulties in verification and validation of HACCP. Lichtenberg and Page (2016) studied the
prevalence and cost associated with the implementation of food safety practices by leafy green
and tomato growers in Mid-Atlantic states, under produce safety rule of FSMA. The majority of
their survey participants were from Pennsylvania, New Jersey, and Maryland. Their study
focused on the cost associated with replacing containers for each harvesting year, employees’
training, facility for sanitation, testing of soil amendment were studied with regards to Produce
safety rules.
Lichtenberg and Page’s (2016) survey showed that the tomato or leafy green growers
selling directly to consumers are more likely to wash their produce. The majority of the
respondents of Mid-Atlantic states inspected and monitored their field for wildlife activities as
29
well as washed containers before harvesting. With regards to specific food safety standards,
produce marketing channels has no or less effect of on either growers’ compliance with wildlife
monitoring or sanitizing containers used for harvesting. The tomato and leafy green growers of
Mid-Atlantic who sell a higher proportion of their produce to retailers and restaurants are more
likely to test water and soil amendments. Under FSMA, produce growers with a gross income of
between $25, 000 and $500,000 and selling more than 50% of their produce directly to end-user
(qualified) are exempted. Lichtenberg and Page (2016) argued that even though very small and
small-scale farmers might be exempted from FSMA, produce buyers may still require their
suppliers to improve food safety practices.
Marine, Martin, Adalja, Mathew, and Everts (2016) studied GAP knowledge and
implementation of GAPs by the vegetable producers of Mid-Atlantic states (Maryland and
Delaware). Their study highlighted a lower GAP certification among fresh produce growers.
Lewis Ivey et al. (2012) reported that university representatives and government regulators
influence producers’ management decisions regarding produce food safety. Tobin, Thomson,
LaBorde, and Radhakrishna (2013) studied factors affecting Pennsylvania growers’ decision on
food safety practices. Their study reported that customer requirements motivated them to adopt
GAPs.
Theoretical Framework
The global food system has been transformed significantly over the years. The way in
which foods have been produced, processed, packed, and transported has changed as well as
consumers’ food habits and preferences. Quality, as well as the safety of food items, have
become important attributes of food system regulatory frameworks. Private sectors are playing a
key role in shaping the global food system with quality and safety regulations (Fulponi, 2006).
30
Food standards are required to ensure quality and safety of food from production to delivery
processes. In this regulatory setting, GAP certification has become a tool for product safety.
With much publicity from outreach agencies and growing pressure from produce retailers to
incorporate GAPs into farm practices, inconsistencies were reported.
To explore the areas where GAP noncompliance was frequently reported, the standards
that produce growers find challenging to comply, and the barriers to GAP implementation, this
study adopted the monitoring and evaluation stage of policy cycle framework.
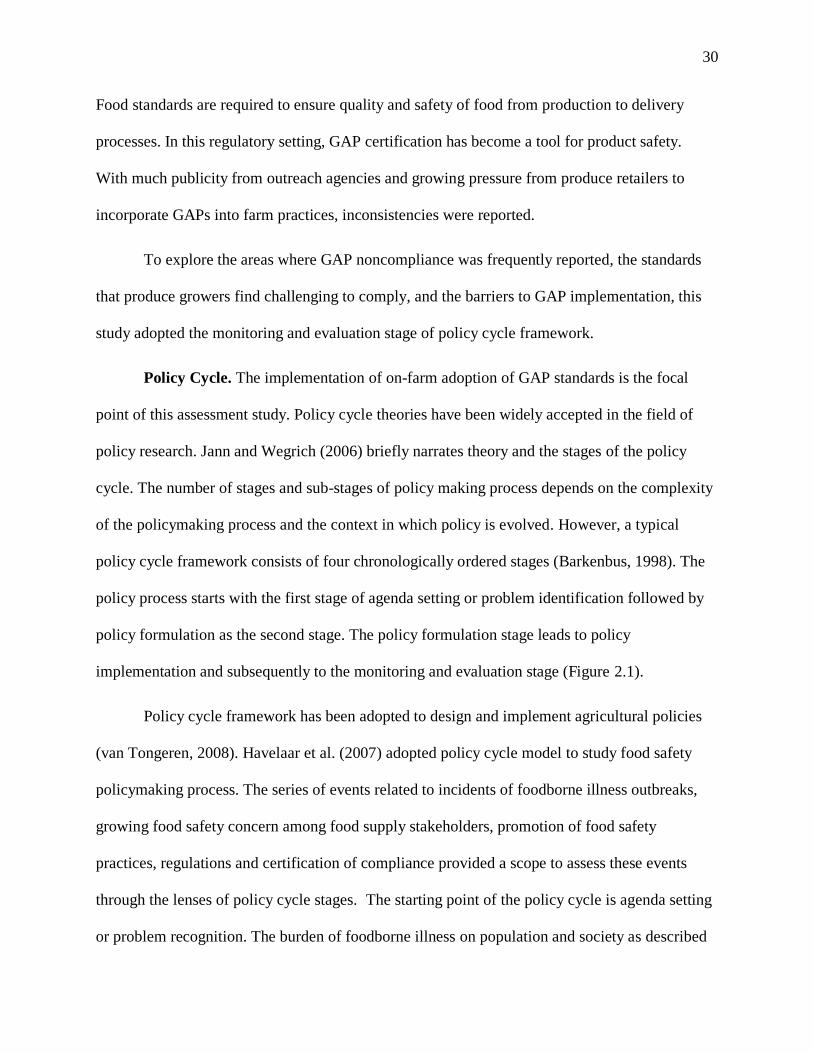
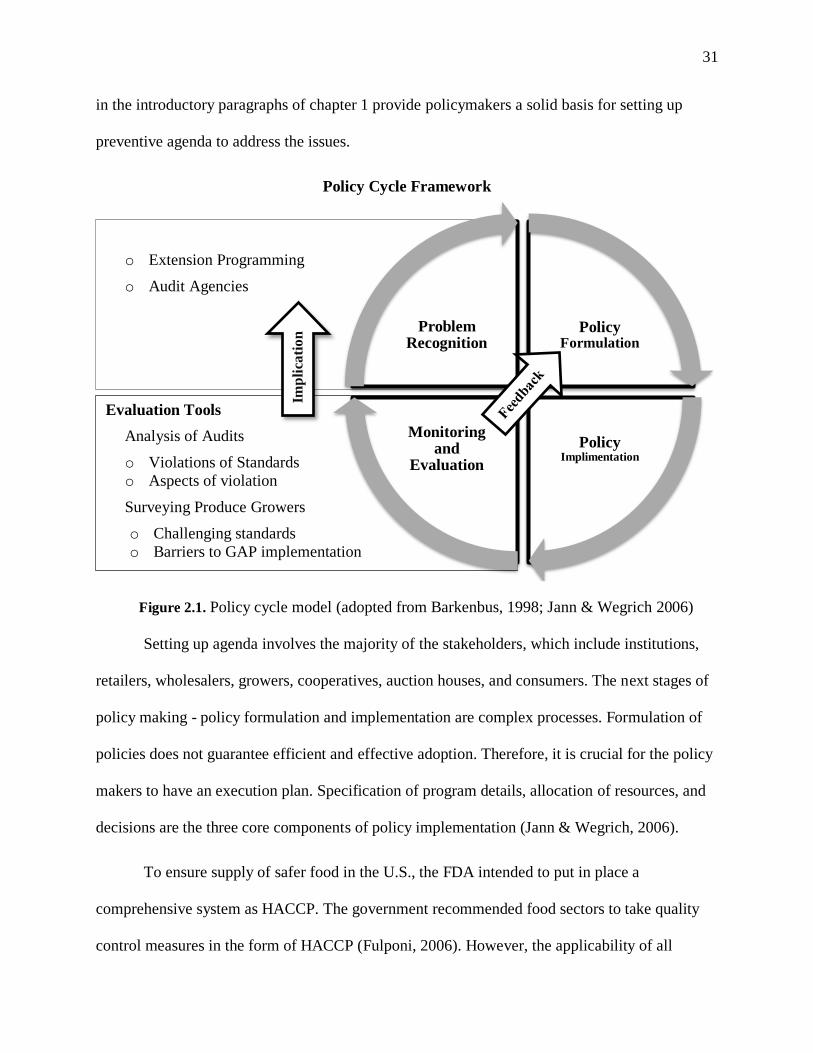
Policy Cycle. The implementation of on-farm adoption of GAP standards is the focal
point of this assessment study. Policy cycle theories have been widely accepted in the field of
policy research. Jann and Wegrich (2006) briefly narrates theory and the stages of the policy
cycle. The number of stages and sub-stages of policy making process depends on the complexity
of the policymaking process and the context in which policy is evolved. However, a typical
policy cycle framework consists of four chronologically ordered stages (Barkenbus, 1998). The
policy process starts with the first stage of agenda setting or problem identification followed by
policy formulation as the second stage. The policy formulation stage leads to policy
implementation and subsequently to the monitoring and evaluation stage (Figure 2.1).
Policy cycle framework has been adopted to design and implement agricultural policies
(van Tongeren, 2008). Havelaar et al. (2007) adopted policy cycle model to study food safety
policymaking process. The series of events related to incidents of foodborne illness outbreaks,
growing food safety concern among food supply stakeholders, promotion of food safety
practices, regulations and certification of compliance provided a scope to assess these events
through the lenses of policy cycle stages. The starting point of the policy cycle is agenda setting
or problem recognition. The burden of foodborne illness on population and society as described
31
Evaluation Tools
Analysis of Audits
o Violations of Standards
o Aspects of violation
Surveying Produce Growers
o Challenging standards
o Barriers to GAP implementation
o
o Extension Programming
o Audit Agencies
in the introductory paragraphs of chapter 1 provide policymakers a solid basis for setting up
preventive agenda to address the issues.
Policy Cycle Framework
Setting up agenda involves the majority of the stakeholders, which include institutions,
retailers, wholesalers, growers, cooperatives, auction houses, and consumers. The next stages of
policy making - policy formulation and implementation are complex processes. Formulation of
policies does not guarantee efficient and effective adoption. Therefore, it is crucial for the policy
makers to have an execution plan. Specification of program details, allocation of resources, and
decisions are the three core components of policy implementation (Jann & Wegrich, 2006).
To ensure supply of safer food in the U.S., the FDA intended to put in place a
comprehensive system as HACCP. The government recommended food sectors to take quality
control measures in the form of HACCP (Fulponi, 2006). However, the applicability of all
Policy Formulation
Policy Implimentation
Monitoring and
Evaluation
Problem Recognition
Imp
lica
tio
n
Figure 2.1. Policy cycle model (adopted from Barkenbus, 1998; Jann & Wegrich 2006)
32
HACCP principles in pre-harvest practices was questioned. Hajmeer and Crozier-Dodson (2012)
stated that:
The implementation of a true HACCP system at pre-harvest may not be achievable as it is
on the postharvest side. This is primarily because of the nature of an open environment at
the field/farm level, where the control of hazards is more challenging compared to more
restricted settings. Implementation of all HACCP principles may not be achievable at pre-
harvest either. (p. 104)
Initiatives were taken to address the issue of foodborne outbreaks linked to produce both
domestically produced or imported. That included Produce Safety Initiative in 1997 and the
release of guidance for industry for fresh fruits and vegetables (USFDA, 1998) and fresh-cut
fruits and vegetables (USFDA, 2008). The FDA, to address the E Coli O157:H7 outbreaks linked
to fresh and fresh-cut lettuce, introduced Lettuce Safety Initiative. Commodity Specific Food
Safety Guidelines for the Melon Supply Chain was introduced in 2005 in response to reduce the
risk of melon contamination. The Leafy Greens Marketing Agreement (LGMA) metrics program
was initiated in California (Hajmeer and Crozier-Dodson, 2012).
The increasing concern of society on issues affecting food safety on regulatory bodies,
integration of global financial markets with food companies, and growing purchasing power of
consumers contributed to the development of private voluntary standards (Fulponi, 2006).
Retailers’ involvement in rulemaking can be viewed in two angles, first as their motive to reduce
risk and liability cost and secondly, their intention to hold or gain consumers’ confidence
(Havinga, 2006). Citing Picciotto (2002) and Scott (2002), Havinga (2006) mentioned that
standard setting, monitoring of compliance with standards, and enforcement of standards are the
three key components of regulation. Private standards by retailers can be regarded as self-

33
regulation, which “implies that private sectors are regulating the behavior of their organization,
its members, or associates without government involvement” (Havinga, 2006; p. 517). Havinga
(2006) also confirmed that the suppliers who supply to many supermarkets with different food
safety policies are struggling to meet individual supermarket’s requirements.
Suppliers have to cope and perform in this regulatory environment introduced by
government and retailers. Produce suppliers have to bring changes in their practices such as the
way food is produced, processed, packed and transported to buyers. In the European context,
Hammoudi, Hoffmann, and Surry (2009) claimed that the framework in which regulations were
formulated by the private retailers had incentives for retailers as well as for the suppliers. In
other words, compliance with regulations may provide a competitive advantage and create a
market opportunity. On the other hand, non-compliance may result in an exit from the current
produce market. A firm that does not meet the standard requirements may lose the market
opportunity. Private standards are designed to improve safety assurance and tap market access
and opportunities.
One of the advantages of harmonization of regulations or GAP standard is the acceptance
by the majority of supermarkets. As a result of harmonization of standards, produce buyers may
more likely to pressurize produce suppliers to comply with regulations. The supermarkets see it
as advantageous both for them as well as for their suppliers.
Monitoring and evaluation. Findings from the monitoring and evaluation stage of
policy process were intended to provide feedback and connect to the policy formulation stage.
Policy continuation, modification or termination are the consequence of assessments showing
whether or not policy goals and objectives are met. Although data is important in all the stages of
34
the policy cycle, farm level data are valuable indicators to the success of policy, and testing the
hypotheses laid during the policy formulation stage.
Data from the farm level provides opportunities for periodic assessment of
policy/programs. van Tongeren (2008) characterizes that agricultural policy data should be
“relevant, objective, transparent, accurate, and comparable over time and space, accessible and
timely” (p. 33). This assessment study employed audit analysis and a survey as two key
evaluation tools. Evaluation data were in the form of auditors’ on-farm observations and input
from the certified growers. The two sources of information provided cross-validated evidence on
challenging GAPs harmonized food safety standards for the growers of the Mid-Atlantic States
and New York.
Evidence of policy success in the context of GAP harmonized audits can be in terms of
increasing the number of produce growers applying and successfully passing GAP harmonized
audits and ultimately reduction in the number of foodborne outbreaks associated with fresh
produce. USDA estimates showed that “the total number of illnesses attributed to USDA-
regulated products fell more than 12 percent from 2009 to 2015” (Vilsack, 2016). Although GAP
certifications are voluntary, an increasing number of growers are applying for certification, and
that indicates the growing acceptance among the producers.
Produce USDA GAPs Harmonized Audit Process
USDA’s Specialty Crop Inspection (SCI) Division audit programs verify compliance to
field operations, harvesting, and post-harvesting harmonized food safety standards. This study
focuses on the field operations and harvesting harmonized food safety standards. A typical GAP
audit process comprised of two events. First the trained auditors visit the farm and observe
practices on the farms and packing houses. In the second event, auditors verify the food safety

35
plan, Standard Operation Procedures (SOPs,) and documents showing adherence with food
safety plan and SOPs (Critzer & Wszelaki, n.d.). The produce GAPs harmonized food safety
standards checklist (USDA Harmonized Checklist, 2013) provides details of audit requirements.
Auditors verify farm operation’s compliance with reference to the checklist questions. The audit
checklist has three major sections: general questions, field production, harvesting, transportation
(Table 2.1). All questions under the checklist are assessed with the following terms:
1. Compliant (C): This refers to operation meets harmonized standards.
2. Corrective Action Needed (CAN): This term applies when the farm operation does not
meet the standard criteria. However, the noncompliance does not refer to an immediate
health or food safety risk.
3. Immediate Action Required (IAR): Labeling a question with “IAR” refers to non-
conformance of the standard requirement(s) that is assessed as an immediate food safety
risk.
4. Questions in the checklist that are not applicable to the operation are assigned as “Not
Applicable” (N/A).
The auditors are required to document their comments or explanations on each assessed
question as CAN and IAR. For each question answered as CAN or IAR, the auditor fills out a
Corrective Action Report referring to the harmonized GAP guidance. Furthermore, auditors may
also be responsible for providing explanations to clarify complaint status or clarify their
assessment as N/A. According to the standard criteria, none of the questions corresponding to the
field operation and harvesting should be reported as IAR. In other words, reporting of IAR to any
question will lead to failure of harmonized audit. Food safety criteria stress upon having a
written food safety policy and compliance with the policies, assigning people with role,

36
responsibility and resources, documentation for traceability and recall program, and compliance
with labeled instructions for the use of agricultural chemicals. Appendix A lists all the
harmonized GAP standards for field operations and harvesting and the policy requirements.
Table 2.1
List of Standards Under Major Sections of Field Operations and Harvesting
Section General
Questions Section
Field
Production Section Harvesting Section Transportation
1.1 Management
Responsibility
2.1 Field History
and
Assessment
3.1 Pre-harvest
Assessment
4.1 Equipment
Sanitation
and
Maintenance
1.2 Food Safety
Plan
2.2 Worker
Health/
Hygiene and
Toilet/
Handwashin
g Facilities
3.2 Water/Ice
1.3 Documentatio
n and Record
Keeping
2.3 Agricultural
Chemicals /
Plant
Protection
Products
3.3 Containers,
Bins and
Packaging
Materials
1.4 Worker
Education and
Training
2.4 Agricultural
Water
3.4 Field
Packaging
and
Handling
1.5 Sampling and
Testing
2.5 Animal
Control
3.5 Postharvest
Handling
and
Storage
1.6 Traceability 2.6 Soil
Amendments
1.7 Recall
Program
2.7 Vehicles,
Equipment,
Tools and
Utensils
1.8 Corrective
Actions
1.9 Self-audits

37
After the complete assessment, the auditor tallies the audit by filling out a score sheet that
records numbers of C, CAN, IAR, and NA’s for each section of the audit to make decisions on
the growers’ status on GAPs compliance. To pass an audit, growers need to comply with at least
80% of the questions that were not assessed as NA.
Apart from those mandatory criteria of compliance, USDA acceptance requirements also
put a significant emphasis on assessment of risk linked with farm operations. Table 2.2 lists the
risk assessment requirements under the produce GAPs harmonized food safety standards. If
farming operation fails to pass the audit in the auditor’s first visit to the farm, the growers will
have another opportunity to address any problems that the auditor found during the audit process.
After the grower takes the appropriate corrective action, he or she can schedule a follow-up
audit.
Table 2.2
Risk Assessment Requirements
Question Requirement
2.1.1 The food safety plan shall, initially and at least annually thereafter, evaluate and
document the risks associated with land use history and adjacent land use, including
equipment and structures.
2.4.2.1 An initial risk assessment shall be performed and documented that takes into
consideration the historical testing results of the water source, the characteristics of
the crop, the stage of the crop, and the method of application
2.5.1 The operation has a written risk assessment of animal activity in and around the
production area.
2.6.1 The food safety plan shall address soil amendment risk, preparation, use, and storage.
3.1.1 A pre-harvest risk assessment shall be performed.
38
Summary
The review of literature focused four aspects of on-farm food safety issues: 1) Sources of
produce contamination, 2) food safety regulations, 3) growers’ compliance and 4) certification
for GAPs. An abundance of literature identified sources of produce contamination and linked
them to farm practices and to farm settings. Researchers agreed that preventive measures in the
form of GAPs are effective in minimizing produce contamination. Many authors on the topic of
food safety regulations tend to favor GAP adoption and certification. At the same time, studies
on the barriers to GAP compliance more frequently concentrated on cost and time as a burden.
Many studies that used mail surveys as a tool to collect data on produce growers’
adherence to GAPs, primarily relied on self-reporting of practices. Serval of those studies
discovered inconsistencies in reporting and actual practices. However, those studies did not
provide any reasons for such inconsistencies. Contamination due to water and manure were very
often discussed in a significant number of studies. Limited studies were available that focused on
on-farm food safety practices by Mid-Atlantic produce growers.

39
Chapter 3
Methodology
Research Design
This study employed a triangulation approach to answering the research objectives and to
further validate the findings across different methodologies. Triangulation is a widely-accepted
approach in mixed method studies, where qualitative and quantitative methods are combined to
confirm findings (Creswell & Miller, 2000). Analysis of produce USDA Good Agricultural
Practices (GAPs) Harmonized audits and mail survey of harmonized GAP certified produce
growers served as two methodological tools to assess on-farm implementation of GAPs
standards. Triangulation offers opportunities to study a phenomenon in different methodological
perspectives (Denzin, 1978) and it can also be used for a broad understanding of the topic
(Olsen, 2004).
The research design followed a qualitative and a quantitative methodology in a sequence
as a strategy to evaluate the implementation of GAPs Harmonized standards in six states.
Analysis of produce USDA GAPs Harmonized audits was the initial and significant step to
initiate the inquiry. The evidence from the audit analysis provided a solid basis for further
inquiry and to develop a survey to understand growers’ perspective on GAP implementation and
barriers.
The purpose of adoption of two methodologies to study a single phenomenon was to
validate and increase the credibility of findings. Hussein (2009) presented a typical example of
triangulation that combined qualitative and quantitative methods as a data validation measure.
The author argued that triangulation surely help to increase internal consistency and
generalizability of the study as well as increase the confidence on the credibility of study
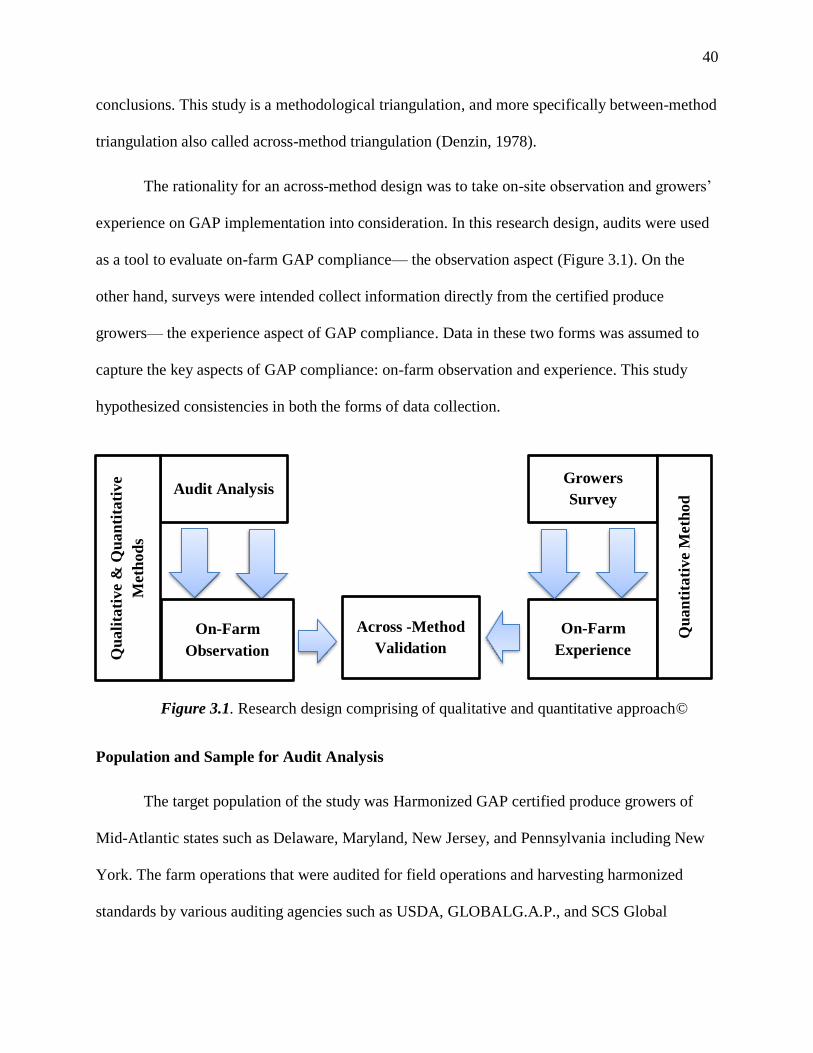
40
conclusions. This study is a methodological triangulation, and more specifically between-method
triangulation also called across-method triangulation (Denzin, 1978).
The rationality for an across-method design was to take on-site observation and growers’
experience on GAP implementation into consideration. In this research design, audits were used
as a tool to evaluate on-farm GAP compliance— the observation aspect (Figure 3.1). On the
other hand, surveys were intended collect information directly from the certified produce
growers— the experience aspect of GAP compliance. Data in these two forms was assumed to
capture the key aspects of GAP compliance: on-farm observation and experience. This study
hypothesized consistencies in both the forms of data collection.
Population and Sample for Audit Analysis
The target population of the study was Harmonized GAP certified produce growers of
Mid-Atlantic states such as Delaware, Maryland, New Jersey, and Pennsylvania including New
York. The farm operations that were audited for field operations and harvesting harmonized
standards by various auditing agencies such as USDA, GLOBALG.A.P., and SCS Global
Figure 3.1. Research design comprising of qualitative and quantitative approach©
Growers
Survey Audit Analysis
On-Farm
Observation
On-Farm
Experience
Across -Method
Validation
Qu
ali
tati
ve &
Qu
an
tita
tive
Meth
od
s
Qu
an
tita
tive M
eth
od

41
Services constituted the population of this study. Finding of this study might also be inferred to
farm operations audited for GAP and Good Handling Practices (GHP).
The study sample constituted of farm operations audited by USDA for GAPs harmonized
food safety standards (field operations and harvesting). The reason for selecting USDA audited
farms as a study sample was because of accessibility to the audits and the contact information of
certified growers (USDA, 2016). Selection of USDA audited farm operations as study sample
could further be supported by the argument that it was one of the earlier agencies that adopted
harmonized standards for GAP audits.
Document Analysis
Document analysis is one of the established methods of the qualitative research (Corbin
& Strauss, 2008, as cited in Bowen, 2009). In this study document analysis was conducted on
redacted produce USDA GAPs harmonized audits. In the absence of evidence on growers’
compliance with the harmonized food safety standards, audits were assumed to be a rich source
of information to initiate this evaluation study. Analysis of audits provided information on
specific food safety standards where growers are frequently failing to comply with the
requirements.
Data collection. Redacted produce USDA GAPs harmonized audits for the growing
season 2013-14 were accessed from the USDA Agricultural Marketing Service (AMS) (USDA,
2016). Accessed audits were for Mid-Atlantic states: Pennsylvania, New Jersey, Delaware,
Maryland, Virginia, and New York. In total 166 (N) redacted audits for field operations and
harvesting were accessed from the six states. Since no information was available on the number
of audits performed in West Virginia, no West Virginia audits were accessed from USDA for
that period. This study did not include West Virginia.

42
Table 3.1 shows the complete list of states, and the corresponding number of accessed
GAPs harmonized audits for field operations and harvesting. The prime reason to include New
York as a Mid-Atlantic state in this study was to increase the variation in the data since relatively
large number of audits (n=67) were accessed for New York.
Table 3.1
Produce USDA Gaps Harmonized Audits for The Growing Season 2013-14
State Number of Accessed Field Operations and Harvest Audits
Delaware 6
Maryland 8
New Jersey 36
New York 67
Pennsylvania 40
Virginia 9
West Virginia Not Available
Total States 166
A typical produce USDA Harmonized GAPs food safety standard checklist, in addition to
food safety standard requirements and verification criteria, also contains pertinent information
related to the farm operation and commodity. Such information includes audit date, farm
location, business mailing address, audit date, description of farm operation, company name,
other contractors’ name, audited commodity, and total acres covered by the audit. This additional
information was redacted from the audits before they were shared for this research. The accessed
audits contained information related to audit summary, auditors’ on-farm observation and
comments, corrective action reports, auditors’ name, and field office address.
43
Data analysis. In the first stage of analysis, audits (N=166) were systematically reviewed
to identify food safety standards for which Corrective Action Needed (CAN) or Immediate
Action Required was reported. Document analysis procedures included sorting out audits where
at least one CAN or IAR was reported on the checklist. The number of CANs and IARs were
counted for each section and sub-sections under all major sections: general questions, field
production, harvesting, and transportation. Results were presented in percentage and graphical
format to identify standards for which maximum noncompliance were reported.
Results were grouped for individual states and collectively for all the six states. This
study utilized the frequency or the count of CANs combined with IARs as a parameter to
determine frequently violated or non-complied standard or GAP area. In other words, GAP
standard requirements with a maximum number of CANs and IARs were labeled as the standard
of frequent violations. Microsoft Excel® (2016) software was used to create tables and charts to
describe the frequencies of CANs and IARs.
Each standard requirement has single to multiple aspects for compliance. Thus, in order
to better understand all aspects of noncompliance relative to the standard requirements, auditors’
comments and observations to questions were carefully reviewed. This step included analysis
and comparison of auditors’ comments to violations relative to a single standard across different
farms and states. Consistencies and variations in reasons for noncompliance were the two
principal criteria adopted while reviewing the comments. Since these audits were redacted, no
information was available related to farm commodity and farm location. Therefore, findings
from the audit analysis were not intended to link to any particular product or a farm operation.
Proportional tests were performed to determine if the proportion of audited farms in each
state is significantly different from other states with respect to reported noncompliance to a

44
section in the audit checklist. There are in total 22 sections under four sections such as general
questions, field production, harvesting, and transportation. Proportions were calculated by
counting the number of farms where CAN or IAR was reported for a particular section within a
state.
Proportion (π) =Number of farms where CAN and IAR e reported for an individual section for a state (nπ)
Total number of farms audited for that state (n)
One of the conditions of a proportional test is that the cell counts should be greater or
equal to five (nπ ≥ 5). In other words, for this test analysis, in any given state, the number of
farms where CAN or IAR for a section was reported should be greater than or equal to five to
perform proportional test analysis. Based on this condition, four sections were identified for
which the farm counts were either greater than or equal to five. Those four sections were 1.4, 2.2,
2.7, and 4.1; and all were from New Jersey and New York. Therefore, z-test of proportion was
performed for those four standards and two states: New Jersey and New York.
Furthermore, in order to determine the likelihood to observe GAP noncompliance on the
farms of a state relative to other states, risk ratios were calculated. Risk ratio tests were
performed for all the sections of the audit checklist for the farms of Pennsylvania, New Jersey,
and New York. The reason for selecting Pennsylvania, New Jersey, and New York was that in
these three states relatively large number of farms were audited compared to Delaware and
Maryland. In none of the farms of Virginia either a CAN or an IAR was reported.
Survey Analysis
Instrumentation. In order to measure growers’ experience with implementation of
Harmonized GAPs standards on their farms, a four-page survey questionnaire was developed
(Appendix D). Questions on the survey were primarily based on the findings from the audit

45
analysis. The purpose of the survey was to assess the implementation of harmonized GAPs
standards by certified growers in terms of how challenging it was for them to comply with the
food safety standard requirements, barriers in GAP implementation and carrying out risk
assessments, commodity they grow, marketing channel, source of GAP information, and their
intention to be certified annually.
Survey development procedures intended to capture maximum aspects of GAP
compliance. However, multiple questions measuring related standards were combined create to
one questions to reduce overlapping of questions and keep the questionnaire length short for
growers to respond. The questionnaire was validated for face and content validity by a panel of
experts. The questionnaire was further reviewed by a food safety Extension educator and a
harmonized GAP certified produce grower. Their feedback was incorporated to improve the
readability, validity, and clarity of the questions.
Growers were asked to rate food safety standards on how challenging it was for them to
comply with the harmonized food safety standard requirements on a challenge Likert-type scale.
The Likert scale ranged from “not at all challenging” to “very challenging” with a mid-point of
“moderately challenging.” Along with the five options, growers were also provided with an
additional option of “NA” (Cohen et al., 2005) in case a standard was “not applicable” to the
farm operation. In total 27 questions were asked related to various food safety standards under
nine separate sections. These sections were: (1) food safety plan, (2) documentation, (3)
employees’ food safety training, (4) water management, (5) cleaning procedures, (6) harvesting
policy, (7) transportation, (8) risk assessments, and (9) other standards.
Additionally, the survey also focused on other key aspects of food safety practices such
as barriers in implementing GAPs and carrying out risk assessments, and GAP information

46
sources. Multiple options were provided with the questions identifying barriers including an
open-ended option to specify other unlisted barriers. For further insight into concerns associated
with on-farm risk assessments, the survey included an additional open-ended question.
Questions were also related to the amount of GAP information growers are obtaining
from various sources that included USDA GAPs user’s guide, Cooperative Extension, online
sources etc. The amount of information obtained from various sources was measured on a five-
point, Likert-type scale ranging from “none” to “a great deal of” with a midpoint of “a fair
amount of” information. Growers were asked to indicate the type of produce they grow such as
fruits, vegetables or both and the market where they sell their produce. At the end of survey,
growers were asked to specify their intention to renew their USDA GAPs harmonized
certification annually. The survey for the growers was reviewed and determined as exempt
research by the Institutional Review Board (IRB) at the Pennsylvania State University on March
07, 2016 (study#00004552). Data collection procedures were in accordance to the approved IRB
protocol.
Survey sample. The sample frame of the survey included the harmonized GAPs certified
produce growers for field operations and harvesting in the Mid-Atlantic states comprising of
Pennsylvania, Virginia, New Jersey, Delaware, and Maryland, as well as New York. These
growers were audited by the USDA for GAP Harmonized food safety standards between May
2015 and November 2015. The survey sample size of this study was 212.
Data collection. Mailing addresses of all those growers were accessed from the USDA-
AMS website and LVF 2016 onion growers list of Pennsylvania. Mailing addressed were
verified using the United States Postal Service address lookup tool to reduce sample frame error.
Separate lists with verified farm addresses were created for individual states. The study followed

47
modified Total Design Method proposed by Dillman (1991) with four contact points. Surveys
were mailed to 212 produce growers of Mid-Atlantic states and New York in the month of
March 2016. A cover letter explaining the background and purpose of the study, a consent form
describing their right as a study participant, and a prepaid envelope were also enclosed along
with the paper survey. Surveys were tracked using unique tracking numbers.
Out of the 212 surveys, 7 were not delivered because of mailing address error, which
represented sample frame error of approximately 3.3%. After three weeks, reminder postcards
were sent to all the non-respondents to increase the response rate (Rangarajan et al., 2002) asking
growers to complete the surveys or request another blank survey from the researcher. On the
seventh week, blank surveys were sent to all the non-respondents; and one week later the second
reminder postcards were mailed. Surveys were collected from the last week of March through
mid-June 2016. In total 120 surveys were returned and the majority of them were returned during
the first three weeks of administration of surveys. The advantages of using mail surveys as data
collection method include: (1) Mail surveys are not subjected to interview bias; (2) Anonymity
of respondents can be ensured; and (3) Respondent can complete the survey at their own pace
(Pennings, Irwin, & Good, 2002).
The overall survey response rate was 58.5%, which was higher than other similar studies,
for example, response rates were 21% for Becot et al. (2012), 32% for Hultberg et al., (2012),
and 49% for Cohen et al. (2005). Table 3.2 shows the number of surveys mailed to harmonized
GAPs certified growers and respective response rate for each state. The majority of respondents
were from Pennsylvania (n=55) and New York (n=37); and the number of USDA audited
growers were relatively higher in these two states. The highest response rate was for
Pennsylvania with 61.1%.

48
Table 3.2
Certified Growers, Respondents, and Percentage
State Number of Surveys Mailed Number of Surveys Returned Response Rate (%)
Pennsylvania 90 55 61.1
New York 62 37 59.7
New Jersey 34 17 50.0
Maryland 13 5 38.5
Virginia 9 4 44.4
Delaware 4 2 50.0
Data analysis. Out of 120 returned surveys, four surveys were assessed as unusable for
data analysis purpose as those surveys were either incomplete or with highly skewed responses.
Therefore, 116 surveys were analyzed using statistical software IBM SPSS® version 24.
Reliability tests were performed and Cronbach’s alpha values were calculated for questions
related to growers’ challenge to comply with food safety standards. Descriptive statistical
analysis was utilized to examine the distribution of growers’ responses to each variable. Analysis
of data included calculation of frequencies and percentages of growers’ responses to individual
question. Cross-tabulations were also performed to determine the distribution of respondents by
the produce they grow, the market growers sell their produce, and source of GAP information
with respect to states. Such descriptive analyses utilized pair-wise deletion of cases.
For questions that measured growers’ challenges to implementing food safety standard
requirements on Likert-type scales, categories of “moderately challenging” and “very
challenging” combined to create a new category “moderate to very challenging.” Similarly, the
categories of “not challenging” and “slightly challenging” combined to create a new variable
“not to somewhat challenging.” Thus, the three new categories for data analysis were: (1) “not to

49
slightly challenging”; (2) “somewhat challenging”; and (3) “moderate to very challenging.” The
purpose of such combination was for the easiness of discrete data analysis and to increase the
number of count on each cell in cross-tabulation. Standards for which relatively higher
percentage (≥ 25%, a cut-off set for the study objective) of respondents indicated “moderate to
very challenging” were identified as most challenging standard requirements. The underlying
hypothesis of this study was that the growers are most likely to fail to comply with the standards
they rate as moderate to very challenging to comply. Descriptive analysis identified major GAP
barriers including barriers to perform risk assessments on the farms and major GAP information
sources.
Discrete analyses were performed that included z-test for proportional differences,
Pearson Chi-square test of association, linear-by-linear association, and non-parametric test for
correlation (Cramer’s V). In order to verify whether the most challenging standards were
consistent among the states, z-score test for proportions were performed for two states at a time.
Since the number of respondents were higher for Pennsylvania, New Jersey, and New York, z-
tests were performed specifically for these three states. In other words, z-tests of proportions
examined if the percentage of growers indicating a food safety standard as “moderate to very
challenge” was significantly differed in those three states.
The advantages of the proportional test are that: it minimizes the effect of sample size on
test statistics and assist in determining the direction of proportional difference. The assumption
of z- test statistics was that proportions were asymptotically normally distributed. The null
hypothesis under z-test was that the proportions of respondents rating a food safety standard as
moderate to very challenged was not significantly different between any two states. Pearson Chi-
square test of associations were used to examine the association between items measuring

50
growers’ challenges to meet the audit food safety standard requirements and farm commodity
type. Contingency tables were created for the food safety standards that were significantly
associated with produce type (at significant levels of .05 and .10).
GAP barriers were also tested for independence with questions on challenge to comply
with food safety requirement. Similarly, barriers to performing risk assessments were
specifically tested with questions on the challenge to comply with risk assessment standards.
Chi-square test of association does not take the ordering of the rows or columns into account.
Thus, linear by linear association values were calculated to examine linearity of relationships
taking the ordering of variables into consideration.
Furthermore, in order to test the strength of relationships between two variables
(nominal), Cramer’s V values were also calculated. All test statistics such as Pearson Chi-square
test of association, linear-by-linear association, and Cramer’s V were reported at significant level
of .05 and .10. Pairwise deletion procedure was followed for discrete data analysis.
Summary
The study adopted an across-method design to evaluate the implementation of
harmonized GAPs food safety standards on the farms of Mid-Atlantic and New York produce
farms. Produce USDA GAPs Harmonized audits were analyzed primarily as a qualitative method
to assess deficiencies in GAP compliances. On the other hand, a mail survey was administrated
as a primary quantitative method on USDA harmonized GAP certified produce growers of Mid-
Atlantic states and New York. Noncompliance to GAP standards were compared for different
states.

51
Survey questions were based on the findings from audit analysis. Survey collected
information related to challenging food safety requirements, barriers to complying with GAPs
and carrying out risk assessments, commodity type, produce marketing channels, source of GAP
information, and their intention to renew certificate annually.
Objectives 1 and 2 focused on the analysis of audits. Whereas, objectives 3 and 4 focused
on the analysis of mail surveys. Descriptive and correlational tests were utilized to analyze the
data depending on the study objectives. Correlational tests were primarily non-parametric. The
population of this study comprised of all produce growers of Mid-Atlantic states and New York
audited for field operations and harvesting harmonized food safety standards by various
certifying agencies. Results from audit and survey analysis were validated, interpreted, and
inferred to study population.
52
Chapter 4
Results
Chapter 4 presents results from the audit and survey analysis. Objectives 1 and 2 focus
audit analysis results. On the other hand, objectives 3 and 4 present mail survey analysis results.
Objective 1 identifies Good Agricultural Practices (GAPs) standards for which Corrective
Actions Needed (CAN) or Immediate Action Required (IAR) were frequently reported in
individual Mid-Atlantic state and New York. Additionally, objective 1 presents proportional
difference and risk ratios of GAP noncompliance. The overall frequency table for each standard
and state is presented in Appendix B.
Objective 2 determines the various aspects of GAP noncompliance. Instead of presenting
results separately for the individual state as in Objective 1, Objective 2 emphasizes each standard
and section of audit checklist and presents overall findings by combining audits from all the six
states. Objective 3 identifies most challenging food safety standards for growers. Whereas,
objective 4 determines obstacles to GAP implementation and carrying out risk assessments,
sources of GAP information, and growers’ intention to renew their GAP certificate annually.

53
Objective 1: Identify Areas of Frequent GAP Noncompliance Through Analysis of Produce
USDA Gaps Harmonized Audits for Field Operations and Harvesting of Mid-Atlantic
States and New York
Out of 166 farms audited for field operations and harvesting harmonized GAPs food
safety standards by the USDA in six states during 2013-14 growing season, 71 (42.8%) audits
reported at least one CAN or IAR (Table 4.1). Objective 1 focused specifically on these 71 audit
checklists to identify standards for which frequency of CANs and IARs were relatively higher.
In Virginia, none of the produce suppliers were asked to take corrective or immediate
action to meet the food safety standard requirements, therefore, not included in this study. In all
the audited farms of Maryland and around 80% farms of New Jersey required actions to comply
with food safety standards. Results are presented in an order of New Jersey, New York,
Pennsylvania, Delaware, and Maryland.
Table 4.1
Produce USDA GAPs Harmonized Audits for the Growing Season 2013-14
State Number of Audits Field
& Harvest Audits
Number of Audits with
CANs or IARs Percentage
New Jersey 36 29 80.6
New York 67 23 34.3
Pennsylvania 40 9 22.5
Delaware 6 4 66.7
Maryland 8 8 100.0
Virginia 9 0 0.0
Total States 166 71 42.8
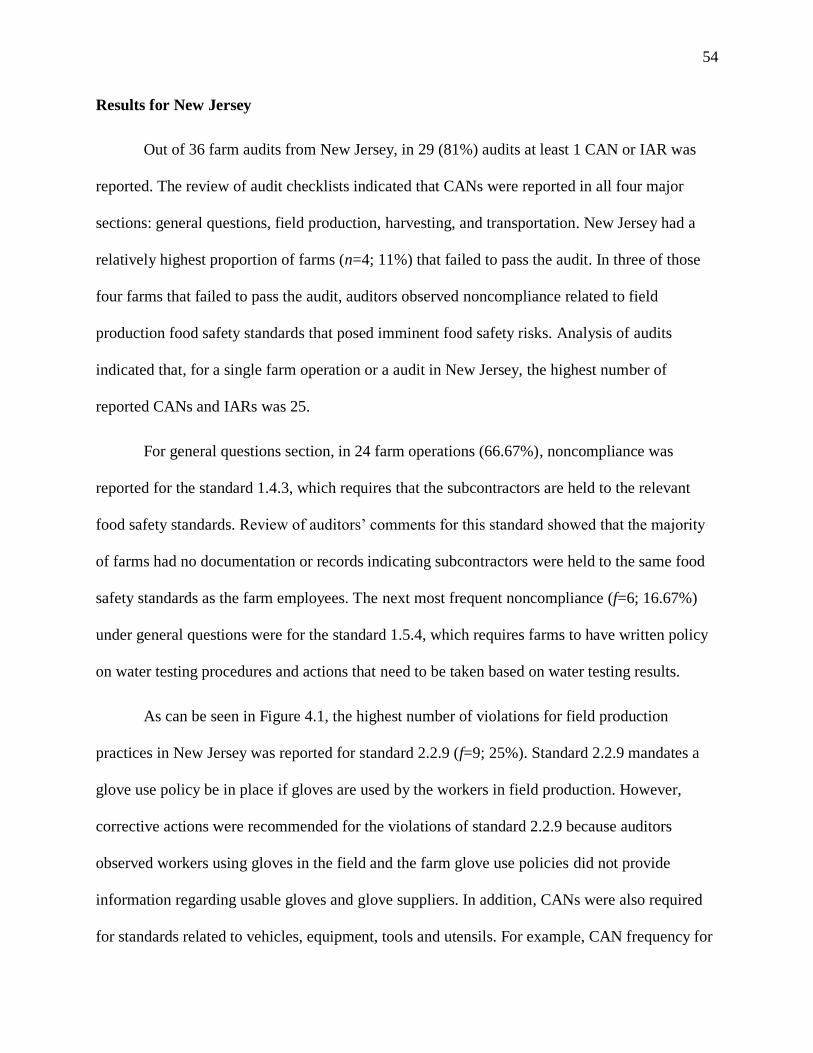
54
Results for New Jersey
Out of 36 farm audits from New Jersey, in 29 (81%) audits at least 1 CAN or IAR was
reported. The review of audit checklists indicated that CANs were reported in all four major
sections: general questions, field production, harvesting, and transportation. New Jersey had a
relatively highest proportion of farms (n=4; 11%) that failed to pass the audit. In three of those
four farms that failed to pass the audit, auditors observed noncompliance related to field
production food safety standards that posed imminent food safety risks. Analysis of audits
indicated that, for a single farm operation or a audit in New Jersey, the highest number of
reported CANs and IARs was 25.
For general questions section, in 24 farm operations (66.67%), noncompliance was
reported for the standard 1.4.3, which requires that the subcontractors are held to the relevant
food safety standards. Review of auditors’ comments for this standard showed that the majority
of farms had no documentation or records indicating subcontractors were held to the same food
safety standards as the farm employees. The next most frequent noncompliance (f=6; 16.67%)
under general questions were for the standard 1.5.4, which requires farms to have written policy
on water testing procedures and actions that need to be taken based on water testing results.
As can be seen in Figure 4.1, the highest number of violations for field production
practices in New Jersey was reported for standard 2.2.9 (f=9; 25%). Standard 2.2.9 mandates a
glove use policy be in place if gloves are used by the workers in field production. However,
corrective actions were recommended for the violations of standard 2.2.9 because auditors
observed workers using gloves in the field and the farm glove use policies did not provide
information regarding usable gloves and glove suppliers. In addition, CANs were also required
for standards related to vehicles, equipment, tools and utensils. For example, CAN frequency for
55
both 2.7.1 and 2.7.2 was 4 (11%). On those farms, auditors found no records listing equipment
and items used for harvesting, and/or records indicating farm equipment, vehicles, and utensils
were in good repair.
IAR Standard 2.2.2 2.2.5 2.2.6 2.7.5 2.2.15
f 1 1 1 1 2
Figure 4.1. CAN and IAR frequency chart for field production
Regarding agricultural water, in three farms there were no water management plans or
records indicating testing procedures were in compliance with the policy. As mentioned earlier, 3
farms failed to pass the audits because auditors assessed violations to field production standards
requirements that posed imminent food safety risk. In two separate farms, auditors reported
violations regarding standard 2.2.15 as they observed food handlers eating, spitting, drinking, or
smoking near harvested produce increasing the risk of produce contamination. In both the cases,
auditors asked farm operators to take immediate actions to prevent the risk of produce
contamination.
0
2
4
6
8
10
2
1 1 1 1 1
9
1
2
3
2
1 1
2
1
2
1
2
3
2
4 4
3
1
3
2
Standards
CAN and IAR Frequency of Standards for Field Production
n=36
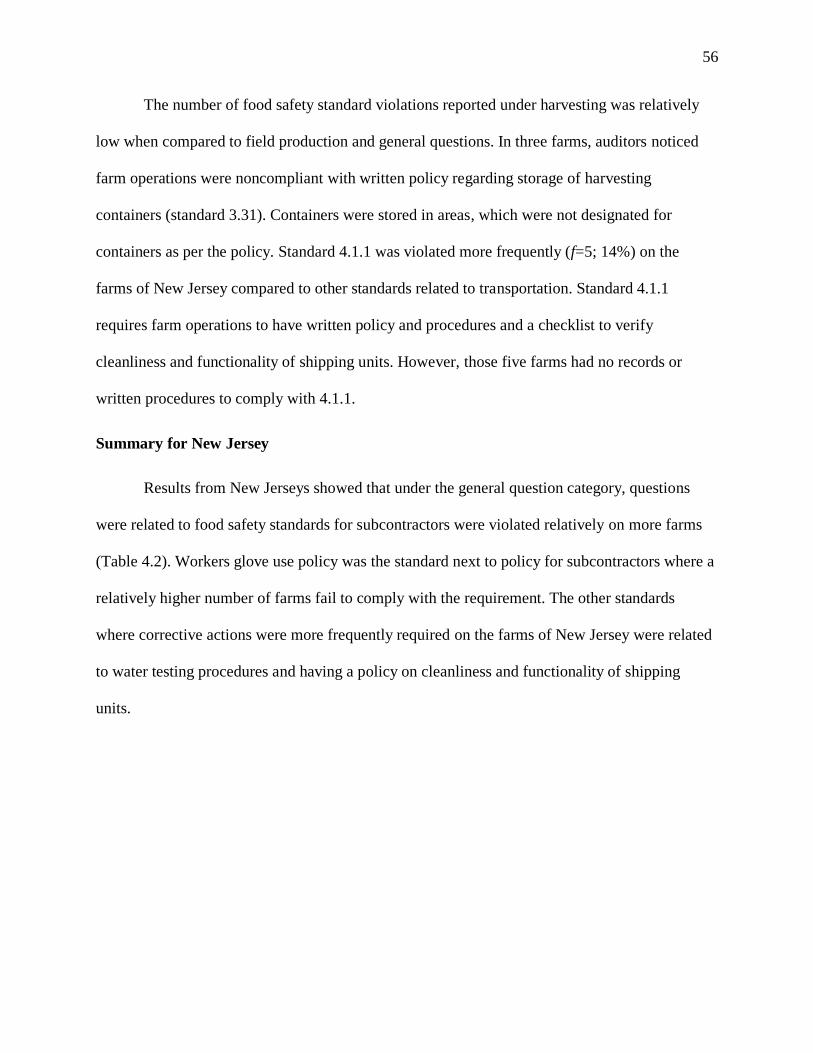
56
The number of food safety standard violations reported under harvesting was relatively
low when compared to field production and general questions. In three farms, auditors noticed
farm operations were noncompliant with written policy regarding storage of harvesting
containers (standard 3.31). Containers were stored in areas, which were not designated for
containers as per the policy. Standard 4.1.1 was violated more frequently (f=5; 14%) on the
farms of New Jersey compared to other standards related to transportation. Standard 4.1.1
requires farm operations to have written policy and procedures and a checklist to verify
cleanliness and functionality of shipping units. However, those five farms had no records or
written procedures to comply with 4.1.1.
Summary for New Jersey
Results from New Jerseys showed that under the general question category, questions
were related to food safety standards for subcontractors were violated relatively on more farms
(Table 4.2). Workers glove use policy was the standard next to policy for subcontractors where a
relatively higher number of farms fail to comply with the requirement. The other standards
where corrective actions were more frequently required on the farms of New Jersey were related
to water testing procedures and having a policy on cleanliness and functionality of shipping
units.

57
Table 4.2
Frequency of CAN and IAR by standards for New Jersey (n=36)
General Questions Field Production Harvesting Transportation
Standard f Standard f Standard f Standard f
1.3.1 1 2.1.1 2 3.3.1 3 4.1.1 5
1.4.1 2 2.2.2* 1 3.3.3 1 4.1.3 2
1.4.2 1 2.2.5* 1 3.4.1 1
1.4.3 24 2.2.6* 1 3.4.2 1
1.5.1 1 2.2.7 1 3.4.4 1
1.5.2 2 2.2.8 1 3.4.7 1
1.5.4 6 2.2.9 9 3.5.1 2
1.6.1 2 2.2.11 1 3.5.2 1
1.6.2 2 2.2.12 2
1.7.1 2 2.2.14 3
1.8.1 2 2.2.15* 2
1.9.1 2 2.2.16 1
2.2.17 1
2.2.21 2
2.3.4 1
2.4.2.1 2
2.4.3.1 1
2.4.3.2 2
2.4.3.3 3
2.5.2 2
2.7.1 4
2.7.2 4
2.7.3 3
2.7.4 1
2.7.5* 2+1
2.7.6 2
Note. *Indicates standards with reported IAR.

58
Results for New York
Produce USDA GAPs harmonized audits were reviewed to identify the most frequently
violated GAPs harmonized food safety standards in New York for the growing season of 2013-
14. Out of 67 audits, in 23 (34.3%) at least 1 CAN was reported. The frequency was relatively
higher for 1.4.3 (f=4; 6%) among the requirements under general questions (Table 4.3), but
significantly less frequent than farms of New Jersey. In three farms auditors asked growers to
take corrective actions as there were no records indicating farm personnel received food safety
training required as per 1.4.1.
Under field production section, the highest number of CANs and/or IARs were reported
for 2.2.5, 2.2.13 and 2.7.1, with a frequency of three for each standard (Table 4.3). Standard
2.2.5 requires that toilet and washing stations be maintained in a clean and sanitary condition. In
three farms, corrective actions were needed to comply with the requirements of 2.2.13, which
needed farm operations to have a policy on using of hair covering. Similarly, on three farms
auditors found no lists identifying equipment, vehicles, tools, utensils and other items that may
pose a produce contamination risk (standard 2.7.1).
Results showed that two farms failed to pass the audits where IARs were reported as
auditor observed noncompliance to standards 2.2.5 (f=1) and 2.2.17 (f=1). Standard 2.2.5 focuses
on proper maintenance of toilet and wash stations and 2.2.17 ensures availability of drinking
water for field employees. Moreover, those were the same farms with a maximum count of
CANs (f=7) for any single audited farm of New York.
As can be seen in Table 4.3, the CAN frequency was two for standards: 3.3.1, 3.4.1,
3.4.4, and 3.4.7 under the category of harvesting. Noncompliance with 3.3.1 and 3.4.1 was
because farm operators had no written policy regarding storage of harvest containers (standard

59
3.3.1) and managing damaged or decayed produce (standard 3.4.1). Standard 3.4.4 focuses on
cloth use policy to clean produce and whereas, 3.4.7 requires a written policy on packing
material contacting soil. On the other hand, 4.1.1 was the standard for which the frequency of
CAN was relatively higher (f=5) than any other standard in any category in the New York audits.
Standard 4.1.1 requires farm operations to have a policy, written procedures, and a checklist to
verify cleanliness and functionality of shipping units.
Table 4.3
Frequency of CAN and IAR by Standards for New York (n=67)
General Questions Field Production Harvesting Transportation
Standard f Standard f Standard f Standard f
1.1.3 2 2.2.5 2+1* 3.1.1 1 4.1.1 5
1.2.2 1 2.2.7 2 3.3.1 2
1.4.1 3 2.2.9 1 3.3.3 1
1.4.3 4 2.2.12 1 3.4.1 2
1.5.2 1 2.2.13 3 3.4.4 2
1.8.1 1 2.2.17 1* 3.4.7 2
1.9.1 1 2.3.4 2 3.5.1 1
2.4.1.1 1
2.4.1.2 1
2.4.2.1 1
2.4.3.2 1
2.4.3.3 1
2.5.2 1
2.6.2 1
2.7.1 3
2.7.2 2
2.7.6 2
Note. * Indicates reporting of IAR.

60
Summary for New York
The number of GAPs harmonized audited farms were less in New York than New Jersey.
In New York, around 34% of the audited farm operations, corrective actions were required to
meet the harmonized food safety standards. For the audited farms of New York, the most
frequently violated standards were 4.1.1 and 1.4.3. In other words, five out of 67 farms were
required to take corrective actions to ensure cleanliness and functionality of shipping units
(4.1.1) whereas in four out of 67 farms corrective actions were required farms to have a policy
on subcontractors’ compliance with farm food safety policy (1.4.3).
Results for Pennsylvania
Out of 40 farm audits from Pennsylvania, 7 (18%) corrective actions were required. None
of the audited farms in Pennsylvania for the growing season 2013-14 required immediate action
to comply with standards or failed to pass the audit. All the audited farms during that year were
in compliance with GAPs harmonized food safety standards acceptance criteria to pass the
audits. In other words, all the 40 audited farms meet the USDA acceptance criteria for GAPs
harmonized certification. For the seven audits where at least one CAN was reported, the highest
number of CANs identified from a single farm operation of Pennsylvania was six.
As can be seen in Table 4.4, the highest number of CANs for a single standard was
reported for 2.7.2 (f=3), which refers to a good condition of farm equipment, vehicles, tools, and
utensils that come into contact with produce. Such violations were primarily because of use of
wooden bins. The frequency of CAN for each food safety standards 1.9.2 and 2.4.1.1 was two. In
those cases, auditors asked growers to have procedures for self-audits (1.9.2) and have a written
description of the water system and its flow available on the farms (2.4.1.1). The CAN frequency
for other standards listed in Table 4.4 was one.
61
Table 4.4
Frequency of CAN and IAR by Standards for Pennsylvania (n=40)
General Questions Field Production Harvesting Transportation
Standard f Standard f Standard f Standard f
1.4.3 1 2.2.15 1 3.2.5 1 4.1.1 1
1.8.1 1 2.2.21 1 3.3.4 1
1.9.1 2 2.3.3 1
2.4.1.1 2
2.4.1.3 1
2.4.3.1 1
2.7.2 3
Summary for Pennsylvania
Results showed that the majority of the audited farms required no corrective action to
comply with field operation and harvesting harmonized food safety standards. However, on the
farms (n=7) where corrective actions were required, the most frequently violated standard was
2.7.2, which is related to maintenance of farm equipment, vehicle, utensils, and tools.
Results for Delaware
Out of six farm audits from Delaware, in four (67%) audits corrective actions were
required to meet the GAPs harmonized food safety standards. The frequency of standards where
corrective actions was required for a single farm operation ranged from five to 32 CANs. Two
out six farms failed to pass the audits, where IARs were reported for noncompliance to standards
2.2.6 and 2.2.15. Table 4.5 shows the list of GAPs harmonized standards and corresponding
CAN and IAR frequency identified from four audits. A single audit with 32 CANs and two IARs
contributed to the majority of standard noncompliance presented in Table 4.5.

62
Table 4.5
Frequency of CAN and IAR by Standards for Delaware (n=6)
General Questions Field Production Harvesting Transportation
Standard f Standard f Standard f Standard f
1.1.1 1 2.2.2 2 3.3.1 1 4.1.1 1
1.1.2 1 2.2.6* 2 3.4.4 1 4.1.3 1
1.2.1 1 2.2.9 2 3.4.6 1
1.3.1 1 2.2.10 3 3.4.7 1
1.3.2 1 2.2.11 3
1.4.1 1 2.2.12 1
1.4.2 1 2.2.14 2
1.4.3 2 2.2.15* 1+1
1.5.2 2 2.2.16 1
1.5.4 2 2.2.21 1
2.3.5 1
2.4.2.1 1
2.4.3.1 1
2.4.3.2 1
2.4.3.3 1
2.5.1 1
2.5.2 2
2.6.1 1
2.6.2 1
2.7.1 2
2.7.2 1
2.7.3 1
2.7.4 2
2.7.6 2
Note. *Indicates reporting of IAR.

63
The CAN and IAR frequency for most of the standards were either one or two, except for
2.2.10 and 2.2.11 (f=3). Standard 2.2.10 and 2.2.11 are related—and address protective cloth use
policy and storage of protective clothing and tools, respectively. For standards 1.4.3, 1.5.2, 1.5.4,
2.2.2, 2.2.6, 2.2.9, 2.2.14 2.5.2, 2.7.1, 2.7.4, and 2.7.6, the frequency of CAN and IAR was two;
and the noncompliance was largely for field production related requirements.
Summary for Delaware
Relatively fewer farms were audited in Delaware for the 2013-14 growing season.
Noncompliance with a majority of standards on the audit checklist from a single farm
significantly contributed to the overall findings from Delaware. Noncompliance was relatively
frequent (f=3) for standards 2.2.10 and 2.2.11 that ensure protective clothing be maintained and
stored properly. IARs were reported for 2.2.6 and 2.2.15.
Results for Maryland
In total, eight redacted harmonized GAP audits were accessed for Maryland and
analyzed. Results showed that out of eight audits, in six (75%) at least for one standard,
corrective action was required. In none of the audits from Maryland IAR was reported. The
number of food safety standard violations for a farm operation ranged from one to five. In three
out of eight farms, corrective actions were needed for farms to comply with the requirement of
the standard 1.8.1, which requires produce suppliers to document corrective action procedures
(Table 4.6).
In two audits, the auditors observed noncompliance with standard 2.4.3.2, which requires
farms to test water as directed by the water risk assessment plan and the prevailing regulation for
the commodity. Noncompliance regarding the written policy on water testing was because farm
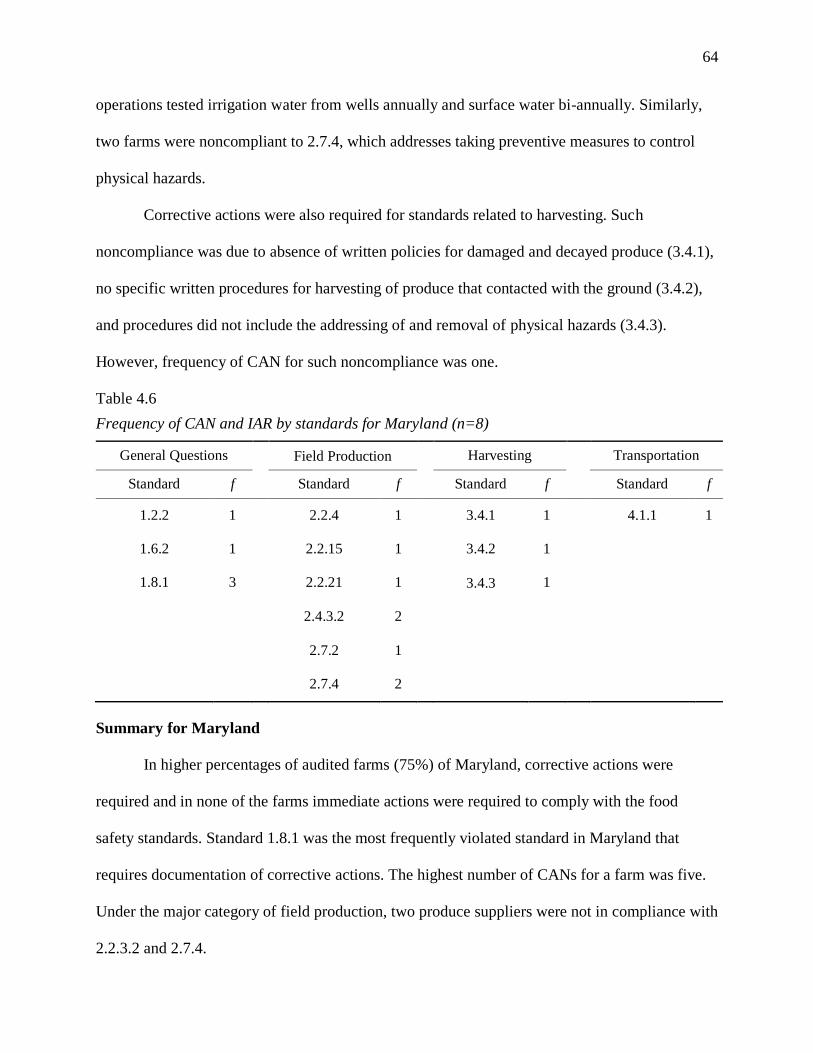
64
operations tested irrigation water from wells annually and surface water bi-annually. Similarly,
two farms were noncompliant to 2.7.4, which addresses taking preventive measures to control
physical hazards.
Corrective actions were also required for standards related to harvesting. Such
noncompliance was due to absence of written policies for damaged and decayed produce (3.4.1),
no specific written procedures for harvesting of produce that contacted with the ground (3.4.2),
and procedures did not include the addressing of and removal of physical hazards (3.4.3).
However, frequency of CAN for such noncompliance was one.
Table 4.6
Frequency of CAN and IAR by standards for Maryland (n=8)
General Questions Field Production Harvesting Transportation
Standard f Standard f Standard f Standard f
1.2.2 1 2.2.4 1 3.4.1 1 4.1.1 1
1.6.2 1 2.2.15 1 3.4.2 1
1.8.1 3 2.2.21 1 3.4.3 1
2.4.3.2 2
2.7.2 1
2.7.4 2
Summary for Maryland
In higher percentages of audited farms (75%) of Maryland, corrective actions were
required and in none of the farms immediate actions were required to comply with the food
safety standards. Standard 1.8.1 was the most frequently violated standard in Maryland that
requires documentation of corrective actions. The highest number of CANs for a farm was five.
Under the major category of field production, two produce suppliers were not in compliance with
2.2.3.2 and 2.7.4.

65
Proportional and Risk Ratio Tests
Proportional and relative risk (risk ratio) tests were performed to examine if reporting of
noncompliance to food safety standards statistically differ among states and also to determine the
strength of the association between those two variables. As can be seen in Table 4.7, the
proportional differences for three sections such as 1.4, 2.2, and 2.7 between New Jersey and New
York were statistically significant. In other words, the proportions of farms where
noncompliance were reported related to worker education and training, their health and hygiene,
farm equipment and other tools used for field production were significantly higher for New
Jersey compared to New York. However, no significant difference was observed in the
proportion of farms between those two states regarding noncompliance with standards related to
equipment sanitation and maintenance.
Table 4.7
Proportional Difference Test Table
Questions Section
New
Jersey
New
York
Proportional
Difference z
Score
p
Value
n1𝜋1 n1 n2𝜋2 n2 𝜋1- 𝜋2
Worker Education and
Training 1.4. 24 36 6 67
0.58 6.15 0.00*
Workers
Health/Hygiene and
Toilet/Hand Washing
Facility
2.2. 11 36 7 67
0.20 2.56 0.011*
Vehicles, Equipment,
Tools and Utensils 2.7. 15 36 5 67
0.34 4.18 0.00*
Equipment Sanitation
and Maintenance 4.1 6 36 5 67
0.09 1.44 0.15
Note. n1𝜋1 ≥ 5 and n2𝜋2 ≥ 5
*p <.05

66
Results from risk ratio tests showed that the chances of observing noncompliance to
standards related to worker education and training were significantly greater in New Jersey than
Pennsylvania (z=3.30, p<0.05) and New York (z=4.93, p<0.05) (Table 4.8). On the other hand,
when farms were compared between Pennsylvania and New York, the ratio was not significant.
Regarding standards related to sampling and testing, it was almost 13 times more likely to
observe noncompliance on the farms of New Jersey than in New York (Table 4.9).
Table 4.8
Worker Education and Training (Section 1.4)
Note. “+” indicates count noncompliance, “-” indicates count of compliance
* p <.01
Table 4.9
Risk ratio table for Sampling and Testing (Section 1.5)
Note. “+” indicates count noncompliance, “-” indicates count of compliance
Farm operations were compared regarding their noncompliance with standards related to
workers’ health and hygiene, and toilet and handwashing facility (section 2.2) and vehicle,
equipment, tools, and utensils (2.7). The results showed that for both the sections, the likelihood
State + - PA NY
Risk
Ratio z p CI
Risk
Ratio z p CI
NJ 24 12 26.67 3.30 0.00* 3.80 - 187.26 7.44 4.93 0.00* 3.35 - 16.53
PA 1 39 0.28 1.20 0.23 0.04 - 2.24
NY 6 61
State + -
NY
Risk Ratio z p CI
NJ 7 29 13.028 2.45 0.01 1.67 - 101.79
NY 1 66

67
of observing noncompliance was greater on the farms for New Jersey than on the farms of
Pennsylvania and New York. As can be seen in Table 4.10, the likelihood of observing
noncompliance with worker health and sanitation facility standards on the farms of New Jersey
was 12 times more than Pennsylvania and two times more than New York. Similarly, it was
approximately 5.5 and 3.6 times as likely to observe noncompliance with the standards related to
vehicle, equipment, tools, and utensils on the farms of New Jersey than Pennsylvania and New
York, respectively (Table 4.11).
Table 4.10
Workers Health/Hygiene and Toilet/Hand Washing Facility (Section 2.2)
Note. “+” indicates count noncompliance, “-” indicates count of compliance
Table 4.11
Vehicles, Equipment, Tools and Utensils (Section 2.7)
Note. “+” indicates count noncompliance, “-” indicates count of compliance
* p <.01
State + - PA NY
Risk
Ratio z p CI
Risk
Ratio z p CI
NJ 11 25 12.22 2.46 0.01 1.66- 90.04 2.93 2.46 0.01 1.24 - 6.89
PA 1 39 0.24 1.36 0.17 0.031 - 1.87
NY 7 60
State + - PA NY
Risk
Ratio z p CI
Risk
Ratio z p CI
NJ 15 21 5.56 2.91 0.00* 1.75-17.63 5.58 3.63 0.00* 2.21- 14.12
PA 3 37 1.01 0.01 0.99 0.25- 3.98
NY 5 62
68
Objective 2: Describe the Aspects of Field Operations and Harvesting Harmonized Food
Safety Standards and Criteria of Noncompliance
General Questions
Management responsibility. Standards on management responsibility were to ensure
that farm operations have a food safety policy in place, designated an individual with a primary
responsibility of implementing the plan, and also have a policy describing disciplinary actions
for food safety policy violations. Results showed that all the audited farm operations had a food
safety policy. Review of auditors’ comments provided multiple criteria of noncompliance with
management responsibility standards. They were as follow:
1. Food safety plan was not signed by senior management.
2. Management responsibility standard requires a 24-hour contact information of persons
responsible for food safety emergencies and provide resources needed to implement and
maintain the food safety plan. The written policy did not include provision for the
absence of key personnel on the farms and did not contain resources needed to implement
food safety plan on the farm.
3. Incomplete documentation of policy outlining disciplinary actions for personnel violating
food safety policies.
Food safety plan. The two standards under food safety plan focus on three aspects of
compliance. These aspects are: (1) identification of farm locations and products, (2) plan should
address all sort of hazards and preventive measures, and (3) periodic review of food safety plan
and documentation of procedures. Results from audits revealed that noncompliance was related
to keeping records showing annual review of the plan, documenting plan review process, and the
inclusion of potential food safety hazards and controlling measures.

69
Documentation and recordkeeping. Standards under the category require farm
operations to document and keep records for each food safety standard requirements, keep them
readily accessible, and also retain them for a minimum of two years. Violations of these
standards were because documents were not available for inspection or records were missing.
Worker education and training. Standards related to training and education ensure
personnel not only should receive food safety training, but also the training should be adequate to
their work responsibility, including the sub-contractors (if applicable for the operations). In other
words, standards confirm farm personnel training and adequate training. As described in
objective 1, education and training of workers was the area where numerous deficiencies were
reported. Records are the only evidence to ensure workers and subcontractors have received
adequate food safety training. However, review of audits showed that irrespective of workers
receiving of food safety training or not, corrective actions were proposed as the farm operations
were unable to present training records of their farm personnel at the time of inspections,
particularly for subcontractors.
Sampling and testing. The requirements under the section of sampling and testing focus
on four aspects. These aspects were: (1) a written sampling protocol for microbial testing, (2)
keeping of all test results, (3) documentation of testing procedures, and (4) actions to be taken
based on test results. In order to increase the credibility of test results, GAPs harmonized
standards requires tests should be performed in Good Laboratory Practices (GLP) certified labs.
Results showed the absence of sampling protocol, testing procedures, and post-test actions were
the criteria of noncompliance.
Traceability. The food safety standards related to traceability programs focus on two key
aspects, documentation of traceability program and a successful performance of a trace back and
70
trace forward exercise at least annually. Violation of documentation requirement was either due
to no traceability program in place or inconsistency in documentation and actual practice. For
example, an auditor stated that:
“Food Safety manual states index cards will be attached to pallets to enable traceability.
Auditee states nothing is kept with the product, …is told where the product is from when
it's delivered.”
Violations of trace back and trace forward exercise were due to farm operations having no
records indicating the exercises were performed.
Corrective actions. This standard requires farm operations to document corrective
actions as well as keep records as evidence to show what procedures were performed to comply
with the respective food safety standards. Review of comments to corrective actions showed that
operations had no written policy on corrective actions or incomplete documentation, or no
records were available showing corrective actions were taken.
Field Production
Field history and assessment (2.1). This standard ensures that farm operations should
carry out an assessment of adjacent land use or land use history and documented. Violations of
the standard on the two farms were primarily because risk assessments of land use were not
performed.
Worker health/hygiene and toilet/handwashing facilities (2.2). This is one of the most
important section of GAPs harmonized standards that covers multiple aspects of food safety
practices. These practices and standards are linked with works’ health and their hygienic
practices in the field, toilet and hand washing facilities on the farms, and their maintenance.

71
Corrective actions or immediate actions are required when farm operation have no policy or non-
adherence with the policy.
2.2.2. This policy requires farm employees as well as the visitors which include the
contractors and auditors in the field to comply with established hygienic practices. The reported
violations to the standard were due to non-compliance by the farm employees and the failure of
operations to reinforce the policy on farm visitors (including the auditors).
2.2.5. The sanitation standard requires farms to maintain the cleanliness and sanitation of
toilet and hand washing facilities. Noncompliance was related to maintenance of hand washing
facilities such as no wash water, no paper towel, or no hand washing soap, and water leakage
from basin.
2.2.9. This standard warrants farm operations to have a glove use policy if workers
should use gloves in the fields. As described in objective 1, violation to 2.2.9. was reported in 12
separate farms. Audits from those 12 farms were reviewed to study the various aspects of the
violations to glove use policy. Glove use policy is required to describe “how and when gloves
are to be used, cleaned, replaced and stored.”
Farm operations had either no glove use policy or the policy was incomplete. Auditors
also observed inconsistencies between the glove use policy and compliance by the workers. For
example, employees were wearing gloves, while there was no glove use policy available for
review. In a few cases, the policy did not specify the use and storage of gloves and workers used
reusable gloves whereas the policy required single use gloves.

72
2.2.10. This standard requires protective clothing to be managed in a way that to avoid
food products from the risk of contamination. The farm had no policy on maintenance of
protective clothing including gloves.
2.2.11. Under this policy, farm operations are required to designate an area for storage of
protective clothing. Corrective actions were required when auditors observed no specified
storage area. In one case, auditors observed worker take harvest knives home after the work day.
2.2.12. This standard requires workers to comply with company policy and regulation on
wearing or bringing personal items into production areas. However, the reported violations to
this standard were either due to the company had such policy or the worker did not comply with
the policy.
2.2.13. This policy entails company employees to comply with the policy on hair
covering. However, noncompliance with the standard was due to no such policy regarding hair
coverings.
2.2.14. Companies should have a policy on the storage of worker’ personal belonging and
their compliance with the policy. Auditors’ observations showed that the majority of such
violations were because workers’ non-compliance with the policy on storing personal belonging
at a designated storage area rather than not having a policy on this. In this case, it could be
argued that not having a policy on storage was not a problem on the farms, but workers’
compliance with the food safety policy was a concern.
2.2.15. This standard ensures workers in fields comply with hygienic practice policy that
restricts practices such as smoking, chewing, eating, drinking, urinating, defecating or spitting in
the field. Policies were in place. However, CANs were reported for signs of non-compliance of
the policy by the farm workers in the field.
73
2.2.16. Company policy should specify a break area situated at a place not posing a food
safety risk. The auditors observed that the break area was in the production areas and more
importantly violations were because employees violated policy related hygienic practices
(standard 2.2.15), increased the risk of the produce being contaminated with such practices.
2.2.17. Drinking water should be made available and easily accessible to farm personnel.
In addition, drinking water should meet drinking water standards. Produce suppliers had either
incomplete policy or they did not comply with the drinking water policy. In other words, auditors
observed that the drinking water policy did not state the source of water and sanitation
procedures for utensil used for drinking. In the other case, the water which was made available
for employees was assessed as non-potable.
2.2.21. This standard requires farm operations to make a first-aid kit accessible to farm
employees. The violations regarding the standards were reported as there were no first-aid kits
available in the field or in the vehicles used for farm operations and farm workers were unaware
of the location of the first-aid kit.
Agricultural chemicals/plant protection products (2.3). The food safety standards
under the category of agricultural chemical address various aspects of chemical use on farm
fields. Review of auditors’ observations showed that corrective actions were required for
violations in four areas such as the use of the chemical by uncertified personnel, incomplete
policy, no written procedures for chemical disposal, and non-compliance with the water use
policy. The incomplete water use policy applies to water use policy that did not clarify the source
of water. On the other hand, non-compliance with water use policy refers to cases where even
though the water testing results were inconsistent with the policy, water was still used for the
chemical application.
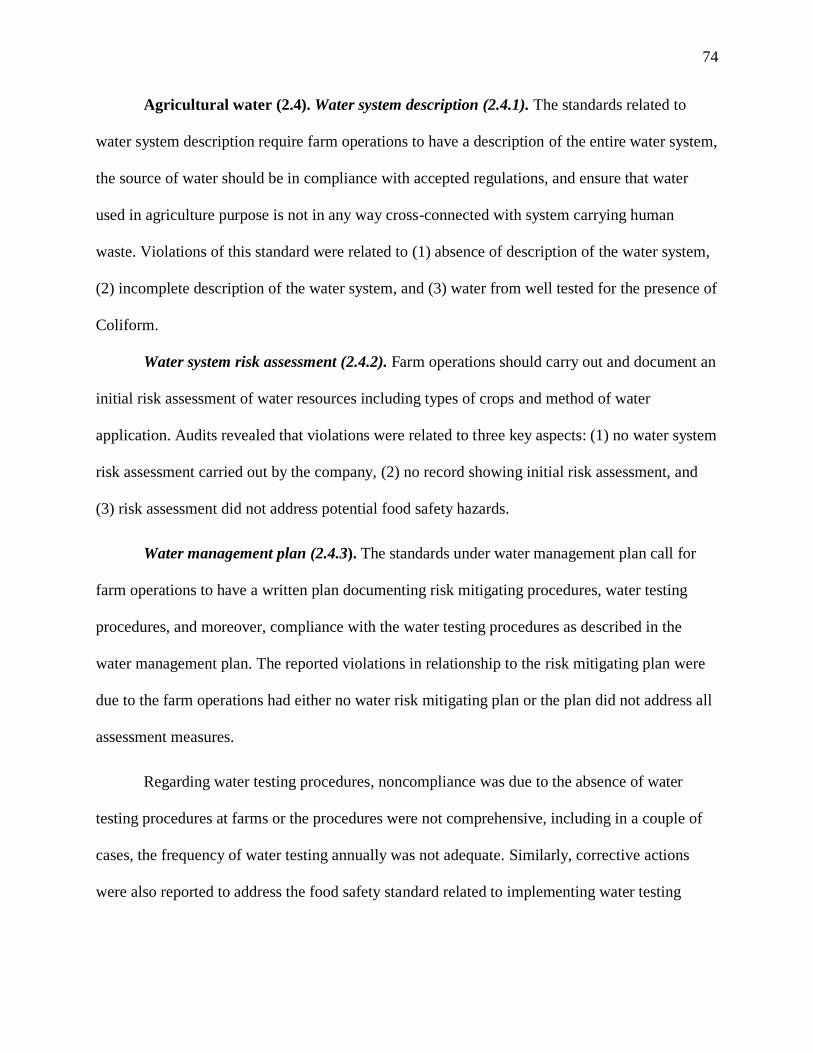
74
Agricultural water (2.4). Water system description (2.4.1). The standards related to
water system description require farm operations to have a description of the entire water system,
the source of water should be in compliance with accepted regulations, and ensure that water
used in agriculture purpose is not in any way cross-connected with system carrying human
waste. Violations of this standard were related to (1) absence of description of the water system,
(2) incomplete description of the water system, and (3) water from well tested for the presence of
Coliform.
Water system risk assessment (2.4.2). Farm operations should carry out and document an
initial risk assessment of water resources including types of crops and method of water
application. Audits revealed that violations were related to three key aspects: (1) no water system
risk assessment carried out by the company, (2) no record showing initial risk assessment, and
(3) risk assessment did not address potential food safety hazards.
Water management plan (2.4.3). The standards under water management plan call for
farm operations to have a written plan documenting risk mitigating procedures, water testing
procedures, and moreover, compliance with the water testing procedures as described in the
water management plan. The reported violations in relationship to the risk mitigating plan were
due to the farm operations had either no water risk mitigating plan or the plan did not address all
assessment measures.
Regarding water testing procedures, noncompliance was due to the absence of water
testing procedures at farms or the procedures were not comprehensive, including in a couple of
cases, the frequency of water testing annually was not adequate. Similarly, corrective actions
were also reported to address the food safety standard related to implementing water testing

75
program as there was no testing program (water management plan) or implementation of testing
program was not consistent with the plan.
Animal control (2.5). Food safety standards under the category of animal control
identify domestic and wild animal activities in the field and adjacent field as a food safety risk.
The standard requirement is that farm operations to comply with three key aspects of animal
control such as: (1) having a written assessment of animal activity, (2) routinely monitoring and
recording of animal activities, and (3) taking preventing or corrective actions to reduce the risk
of food contamination due to animal activities.
Documentation of corrective actions or preventing measures were violated in none of the
farms of Mid-Atlantic states or New York. However, the corrective actions were required in two
areas of animal control measures that included no written risk assessment and monitoring
schedule and no records for animal activities in and around the field. In other words,
noncompliance with monitoring of animal activities was due to either farms had no records
showing animal activities were routinely monitored or the records were not consistent with the
monitoring schedules.
Soil amendments (2.6). The requirements under soil amendments address the food safety
risks associated with handling and managing of animal-based amendment and soil amendments
with raw or incomplete treated manures. Both standards require farm operations to maintain
records showing the use of soil amendments were in compliance with prevailing regulations.
Results showed that absence of records showing compliance and incomplete records were two
criteria for noncompliance.

76
Vehicles, equipment, tools and utensils (2.7). This is another section under the major
category of field production with six sub-sections, where noncompliance was relatively more
frequent. Auditors’ observations were reviewed to assess all aspects of such noncompliance.
2.7.1. The standard entails farm operations to develop a list identifying all farm
equipment, tools, vehicles, utensils and other items that might pose a food safety risk. Corrective
actions were primarily required in those farm operations having no such list identifying farm
equipment or the lists were incomplete.
2.7.2. This standard requires the listed items under the sub-section of 2.7.1, which come
in contact with produce, should be maintained in good repair so that they would not become a
source of produce contamination. Farm operations are also required to maintain records as a
proof of compliance with the standards. Results showed required corrective actions in 11 farms,
one of standards with a major noncompliance concern.
Auditors’ comments were evaluated to determine the basic themes for classification of
violations. Those themes were as follows:
(1) No records were available on the farms showing compliance with the policy;
(2) Records were incomplete, for example, operation logs had no entries;
(3) No policy on cleaning and maintenance of certain farming items, for example, farm
operation policy did not address how frequently trucks and knives were cleaned;
(4) Farm equipment was not in good repair condition; and
(5) Improper use of equipment or utensils by the workers posed food safety threat (lack
of proper food safety assessment). For example, use of crates and wooden bins on the
farms were assessed by the auditors a food safety threat as wooden bins could not be
sanitized or farm utensils were used by workers for personal belongings.
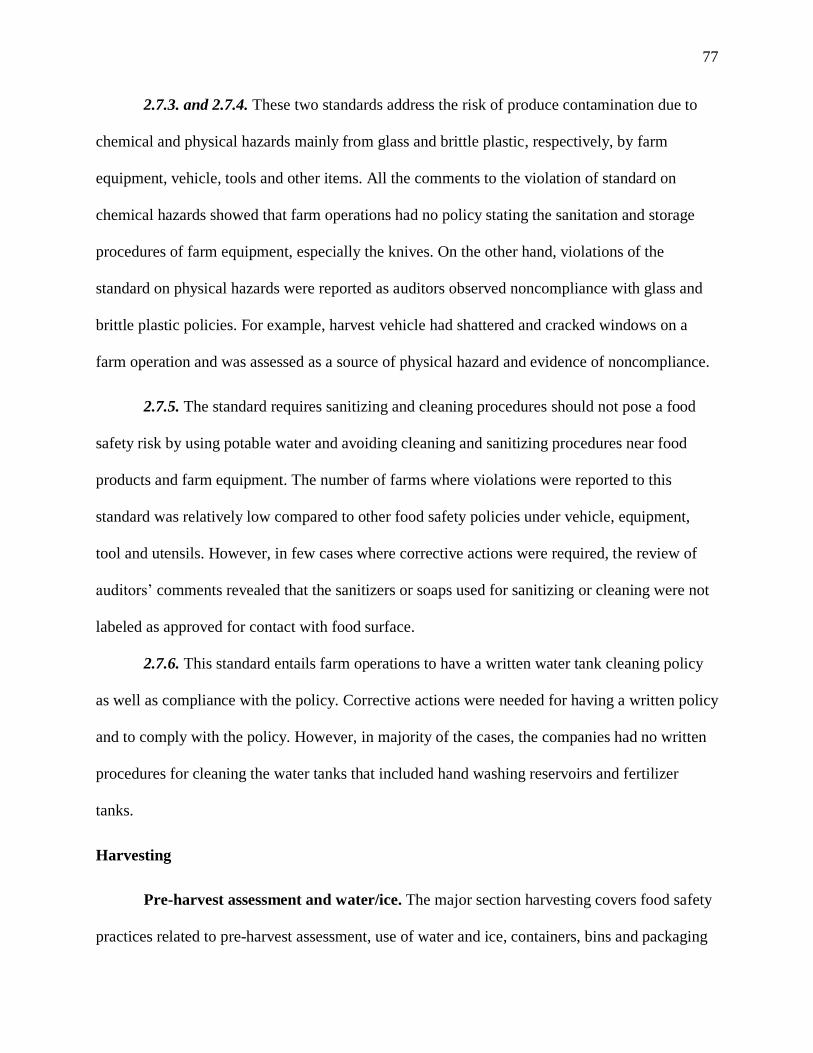
77
2.7.3. and 2.7.4. These two standards address the risk of produce contamination due to
chemical and physical hazards mainly from glass and brittle plastic, respectively, by farm
equipment, vehicle, tools and other items. All the comments to the violation of standard on
chemical hazards showed that farm operations had no policy stating the sanitation and storage
procedures of farm equipment, especially the knives. On the other hand, violations of the
standard on physical hazards were reported as auditors observed noncompliance with glass and
brittle plastic policies. For example, harvest vehicle had shattered and cracked windows on a
farm operation and was assessed as a source of physical hazard and evidence of noncompliance.
2.7.5. The standard requires sanitizing and cleaning procedures should not pose a food
safety risk by using potable water and avoiding cleaning and sanitizing procedures near food
products and farm equipment. The number of farms where violations were reported to this
standard was relatively low compared to other food safety policies under vehicle, equipment,
tool and utensils. However, in few cases where corrective actions were required, the review of
auditors’ comments revealed that the sanitizers or soaps used for sanitizing or cleaning were not
labeled as approved for contact with food surface.
2.7.6. This standard entails farm operations to have a written water tank cleaning policy
as well as compliance with the policy. Corrective actions were needed for having a written policy
and to comply with the policy. However, in majority of the cases, the companies had no written
procedures for cleaning the water tanks that included hand washing reservoirs and fertilizer
tanks.
Harvesting
Pre-harvest assessment and water/ice. The major section harvesting covers food safety
practices related to pre-harvest assessment, use of water and ice, containers, bins and packaging

78
materials, field packaging and handling, and postharvest handling and storage. Almost all the
audited farms of Mid-Atlantic states and New York were in compliance with the standards on
pre-harvest risk assessment and policy on water and ice use. In other words, review of audits
showed that all the audited farms performed a pre-harvest risk assessment on their farm as per
food safety plan and documented the procedures. There was one farm where corrective actions
were required since there was no documentation showing the assessment had been performed.
The policies on water and ice use for produce address multiple aspects of food
contamination. First and foremost, the operation should have a water use Standard Operating
Procedures (SOPs) showing: water that comes in contact with produce should meet potable water
quality standards; in cases where water is re-circulated, it should be treated with approved
antimicrobial; proper maintenance of water-delivery system; and if product is susceptible to
microbial infiltration, the SOP should also report monitoring of temperature of water used to
wash produce.
Corrective actions for the violation of standards related to water and ice use for produce
were not reported on the farms, except for one farm, where the company’s SOP did not address
monitoring of water temperature for produce, which was susceptible to microbial infiltration.
Containers, bins and packaging materials. The food safety standards regarding the use
of containers, bin and packaging material on the farms cover four key areas that could cause
produce contaminations. Those four areas are storage of containers, inspection of containers,
criteria for acceptable containers, and restriction of the use of harvesting containers for other
purposes.
Policies were violated relatively more on the farm in the area of storage of containers
than the other three areas. Policy on storage of harvesting containers requires farm operations to

79
have written policy on storing containers at an appropriate area. Review of auditors’ corrective
action comments showed that violations were majorly due to non-compliance with the written
policy and in a couple of cases there was no written policy citing storage areas for harvesting
containers. For example, citing CAN for non-compliance to storage standards, an auditor
commented as:
“policy states harvest containers will be stored off the ground and within the confines of
a pest control program. Bins are stored outside directly on the ground.”
In none of the farms of the Mid-Atlantic states and New York, corrective action was
required to comply with the standards on inspection of harvesting containers as farm operations
had container inspection policy in place and containers were maintained appropriately as per the
policy. Policy regarding the use of acceptable harvesting containers also needs a written policy
on types of containers appropriate for the product and on-farm compliance with the policy.
However, the violations were only reported for not having a written policy in place. On the other
hand, regarding the policy of prohibiting the use of harvest containers for other purposes all the
audited farm operations had a written policy except one.
Field packaging and handling. The seven requirements under the section of field
packaging and handling address issues related to decayed produce, harvesting of produce
contacting soil, assessing and removal of physical hazards, produce cleaning material, packaging
materials, storage of packaging, and policy on packing materials contacting soil. The standard on
the harvesting of decayed or culled produce focus on three aspects: (1) a written policy showing
that decayed produce is not harvested, (2) employees’ training, and (3) compliance with practice.
However, all the reported violations were related to the absence of a written policy citing
decayed produce should not be harvested or culled. Policy on the harvesting of non-root crop

80
contacting soil also requires a written policy, employee training, and compliance. Similar to the
violations of policy on decayed produce, corrective actions were also required when there was no
written policy on the procedures to be followed when on non-root crops come into contact with
the ground.
3.4.3. The standard requires farm operations to develop procedures to inspect and remove
physical hazards from fields. The only violation reported on the audits showed that farm
operation had no such procedures to address detection and removal of physical hazards.
3.4.4. The standard on the use of cleaning materials requires farms operations to have
procedures to reduce cross contamination if clothes, towels, or other cleaning materials are used
to wipe produce. Corrective actions were required in farms to have a policy on the type and
procedure on the use of cleaning materials such as cloths and paper towels. For example, paper
towels were used to wipe produce, and there was no policy stating paper towels were acceptable
and the procedure to prevent cross-contamination.
Packaging materials. In none of the farms, auditors observed the packaging materials
were either inappropriate or unsuitable for product increasing the food safety risk. In one
occasion noncompliance was observed, where the wooden crates were stored in a manner that
was assessed to increase the risk of food contamination.
Deficiencies were observed for policy on permitting packing material to contact with soil.
The standard requires farm operations to have written policies on whether or not packing
materials are permitted to come in contact with the ground, and also workers on the farm should
comply with the policies. Auditors’ observations to the standard were reviewed and the finding
showed that in all the cases where corrective actions were required had no written policies on
whether packing materials were allowed to contact with the ground.
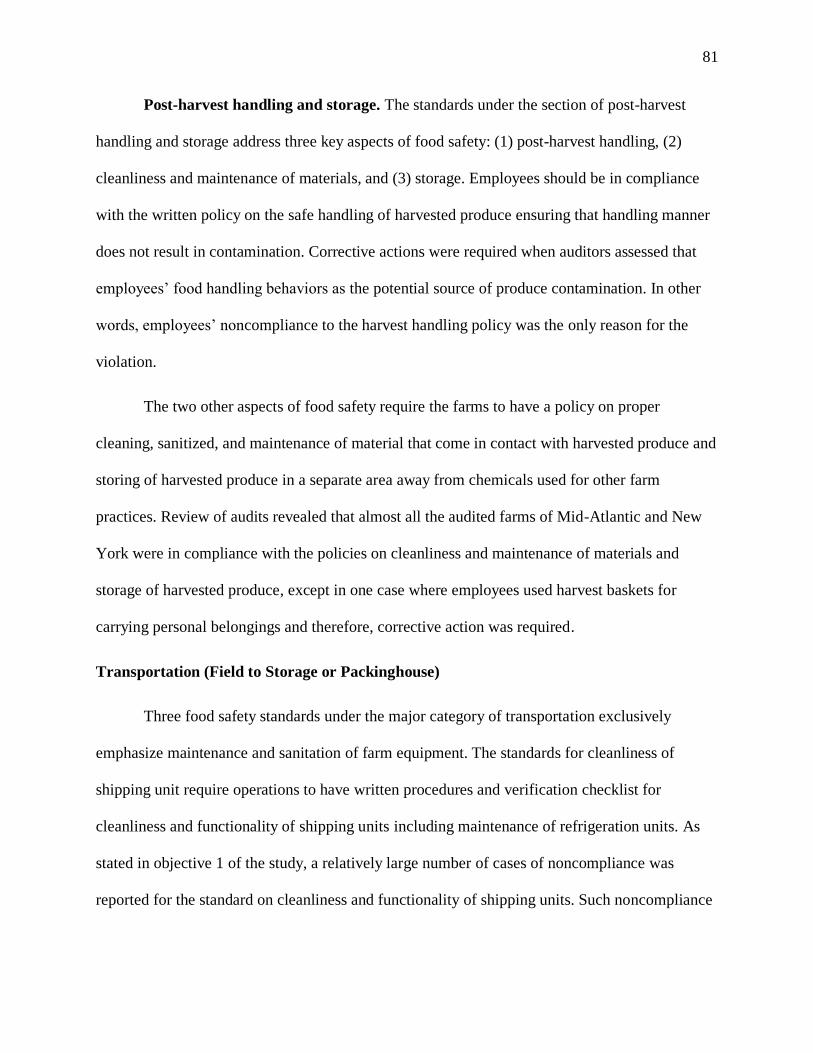
81
Post-harvest handling and storage. The standards under the section of post-harvest
handling and storage address three key aspects of food safety: (1) post-harvest handling, (2)
cleanliness and maintenance of materials, and (3) storage. Employees should be in compliance
with the written policy on the safe handling of harvested produce ensuring that handling manner
does not result in contamination. Corrective actions were required when auditors assessed that
employees’ food handling behaviors as the potential source of produce contamination. In other
words, employees’ noncompliance to the harvest handling policy was the only reason for the
violation.
The two other aspects of food safety require the farms to have a policy on proper
cleaning, sanitized, and maintenance of material that come in contact with harvested produce and
storing of harvested produce in a separate area away from chemicals used for other farm
practices. Review of audits revealed that almost all the audited farms of Mid-Atlantic and New
York were in compliance with the policies on cleanliness and maintenance of materials and
storage of harvested produce, except in one case where employees used harvest baskets for
carrying personal belongings and therefore, corrective action was required.
Transportation (Field to Storage or Packinghouse)
Three food safety standards under the major category of transportation exclusively
emphasize maintenance and sanitation of farm equipment. The standards for cleanliness of
shipping unit require operations to have written procedures and verification checklist for
cleanliness and functionality of shipping units including maintenance of refrigeration units. As
stated in objective 1 of the study, a relatively large number of cases of noncompliance was
reported for the standard on cleanliness and functionality of shipping units. Such noncompliance

82
was due to no written cleaning or maintenance procedures, records (checklist) of compliance
with procedures or both. For example, one observation on the farm states:
“operation uses designated trucks to transport product from field to storage, but does
not have written procedures or records to verify cleanliness and functionality of those
shipping units.”
During the auditing process, in none of the farms, the auditors assessed the unloading and
uploading procedures increased the chances of causing damage to the produce and infiltration of
the microbes to the damaged produce. Standard on trash handling and transporting require farm
operations to develop trash handling and transporting procedures in such a way that that the
procedures followed on the farm do not pose food safety risk. The absence of trash handling and
transporting procedures and more importantly, noncompliance with the procedures were found to
be the primary reasons for reported CAN.

83
Objective 3: Identify the Challenging Harmonized GAP Audit Standards for Growers of
Mid-Atlantic States and New York Using Mail Survey
Response Rate
The Table 4.12 presents the number of produce growers from each Mid-Atlantic state and
New York who responded to the mail survey. The highest number of respondents were from
Pennsylvania (n=53, 45.7%). Next to Pennsylvania was New York (n=35, 30.2%) and New
Jersey (n=17, 14.7%), respectively. Returned surveys from each of those three states were more
or less in proportion to the number of surveys mailed to produce USDA harmonized GAP
certified grower in those respective states. Respondents from the states of Maryland, Virginia,
and Delaware constituted 9% (n=11) of the total number of respondents.
Table 4.12
Certified Growers, Respondents, and Percentage
State Respondents Percentage
Pennsylvania 53 45.7
New York 35 30.2
New Jersey 17 14.7
Maryland 5 4.3
Virginia 4 3.4
Delaware 2 1.7
Total 116 100%
Characteristics of Produce Survey Respondents
Produce type. Table 4.13 shows a cross-tabulation of respondents from different states
and the type of produce they grow. The majority of the total respondents were vegetable growers

84
(n=53, 46.1%) and 55% (n=29) of those vegetable producers were from Pennsylvania.
Approximately 28% of the respondents (n=32) indicated that they only grow fruits, and around
40% (n=13) of them were from New York.
Around 24% (n=28) of the total respondents indicated that they grow both fruits and
vegetables and half of them (n=14; 50%) were from Pennsylvania. Two respondents indicated
that they neither grow fruits or vegetables, but grow herbs. For New Jersey, the majority of the
respondents were vegetable producers. Out of the four respondents from Virginia, half of them
(n=2) were vegetable producers, one fruit grower, and one produced both fruits and vegetables.
Three out of five respondents from Maryland were fruit producers and the remaining two
produced both fruits and vegetables.
Table 4.13
Characteristics of Produce Growers by the Produce they grow
Produce Type Pennsylvania New
York
New
Jersey Virginia Maryland Delaware Total
Fruits only 9 13 6 1 3 0 32
(27.8%)
Vegetables
only 29 10 10 2 0 2
53
(46.1%)
Fruits and
Vegetable 14 11 0 1 2 0
28
(24.4%)
Other 0 1 1 0 0 0 2
(1.7%)
Total 52 35 17 4 5 2 115
(100%)
Produce marketing channel. Answering the question related to how they sell their
produce, respondents indicated that they sell their produce directly to supermarkets, restaurants,
consumers at farm stands, at Farmers markets, at produce auctions, through cooperatives, and to

85
resellers. Respondents also sold their produce at multiple locations and through multiple
channels. As can be seen in Table 4.14, resellers and direct sales were the two most used
channels for growers to sell their produce. The majority of respondents (n=84, 73%) indicated
that they sell their produce through resellers and around 68% of the respondents (n=78) indicated
that they directly sell their produce. Five respondents mentioned that they also use other channels
to sell their produce that included food markets, retail store front, CSA, and farm sell “PYO” and
farm stand.
Table 4.14
Market Where Grower Sell Their Produce (Total = 115)
Sales Frequency Percentage (%)
Resellers 84 73.0
Direct Sale 78 67.8
Cooperatives 45 39.1
Produce auctions 38 33.0
Other 5 4.3
Challenging Food Safety Standards
Scale reliability. Growers were asked to rate GAPs harmonized food safety standards in
terms of how challenging it was for them to comply with the standards using a five-point Likert
scale. GAPs harmonized food safety standards were logically placed under eight topic areas of
harmonized audits. Each topic areas were represented by three items or standards. In order to
evaluate logical placement of standards under each section, tests were performed for scale
reliability and Cronbach’s α value was calculated for all eight topic areas. While calculating
Cronbach’s α values, data sub-setting was performed to exclude respondents who indicated that
the standards were not applicable “NA” to their farm operations. Cronbach’s alpha values for all
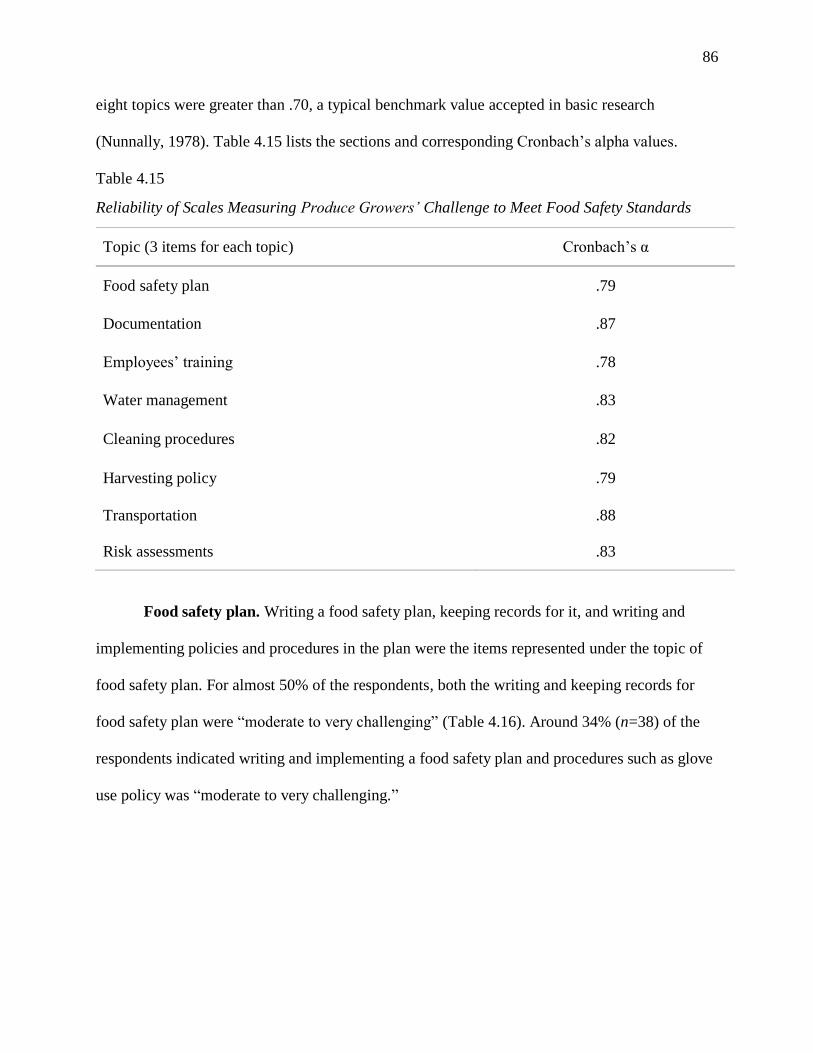
86
eight topics were greater than .70, a typical benchmark value accepted in basic research
(Nunnally, 1978). Table 4.15 lists the sections and corresponding Cronbach’s alpha values.
Table 4.15
Reliability of Scales Measuring Produce Growers’ Challenge to Meet Food Safety Standards
Topic (3 items for each topic) Cronbach’s α
Food safety plan .79
Documentation .87
Employees’ training .78
Water management .83
Cleaning procedures .82
Harvesting policy .79
Transportation .88
Risk assessments .83
Food safety plan. Writing a food safety plan, keeping records for it, and writing and
implementing policies and procedures in the plan were the items represented under the topic of
food safety plan. For almost 50% of the respondents, both the writing and keeping records for
food safety plan were “moderate to very challenging” (Table 4.16). Around 34% (n=38) of the
respondents indicated writing and implementing a food safety plan and procedures such as glove
use policy was “moderate to very challenging.”

87
Table 4.16
Challenging Food Safety Standards Related to Food Safety Plan
Food safety plan Total
Not to Slightly
Challenging
Somewhat
Challenging
Moderate to Very
Challenging
n % n % n %
Writing a food safety plan 112 23 20.5 34 30.4 55 49.1
Keeping records for a food
safety plan 116 29 25.0 30 25.9 57 49.1
Writing and implementing
policies and procedures in
plan (glove use policy)
112 39 34.8 35 31.2 38 33.9
Documentation.
Growers were asked to rate food safety standards related to documentations
documentation of corrective actions, self-audit procedures, and trace back and forward exercise.
Almost 34% (n=38) of the respondents rated documenting and carrying out trace back and
forward exercise as “moderate to very challenging” (Table 4.17). The percentage of respondents
that rated documenting corrections actions as “moderate to very challenging” (n=33, 29.2%) was
5% higher than documentation of self-audit procedures (n=28, 24.3%). In addition, a majority of
the respondents (n=64, 55.7%) indicated that documenting self-audit procedures were not to
slightly challenging.

88
Table 4.17
Challenging Food Safety Standards Related to Documentation
Documentation Total
Not to Slightly
Challenging
Somewhat
Challenging
Moderate to Very
Challenging
n % n % n %
Documenting corrective
actions 113 49 43.4 31 27.4 33 29.2
Documenting self-audit
procedures 115 64 55.7 23 20.0 28 24.3
Documenting and carrying
out a trace back and
forward exercise
113 46 40.7 29 25.7 38 33.6
Employees’ training. Food safety standards related to employees’ training such as
keeping records, documenting employees receiving food safety training and ensuring that
employees are adequately trained were least challenging. Approximately 70% and 63% of the
total respondents indicated that keeping employees’ training record and ensuring their employees
are sufficiently trained were not to slightly challenging, respectively (Table 4.18). Even though
more than half of the respondents (n=65, 56%) rated making sure their employees follow
hygienic practices as not to slightly challenging, around 27% of them (n=31) indicated such
requirement was “moderate to very challenging” to comply.

89
Table 4.18
Challenging Food Safety Standards Related to Employees’ Training
Employees’ training Total
Not to Slightly
Challenging
Somewhat
Challenging
Moderate to Very
Challenging
n % n % n %
Ensuring that employees
are adequately trained in
food safety
116 73 62.9 26 22.4 17 14.7
Making sure that
employees follow hygienic
practices
116 65 56.0 20 17.2 31 26.7
Keeping records that
document employees
received food safety
training
115 91 79.1 15 13.0 9 7.8
Water management. Among the three food safety standards related to water
management, the highest number of respondents (n=37, 34.9%) rated writing and implementing
a water management plan “moderate to very challenging” to comply (Table 4.19). Similarly,
28.3% of the respondents (n=30) indicated writing water testing procedures as “moderately to
very challenging.” However, for the majority of respondents (n=80, 72.7%) finding a Good
Laboratory Practices certified water testing lab was “not to slightly challenging.”
Cleaning procedures. Produce growers rated the challenge to implementing food safety
standards related to cleaning procedures. The majority of the respondents indicated that all the
three standards such as keeping equipment, vehicle, tools, and utensils in good repairs (n=83,
72.2%) and using proper cleaning and sanitizing procedures (n=72, 63.7%) not to slightly
challenging (Table 4.20). Around 21% (n=23) rated writing a disciplinary policy for food safety
violations as moderate to very challenging.
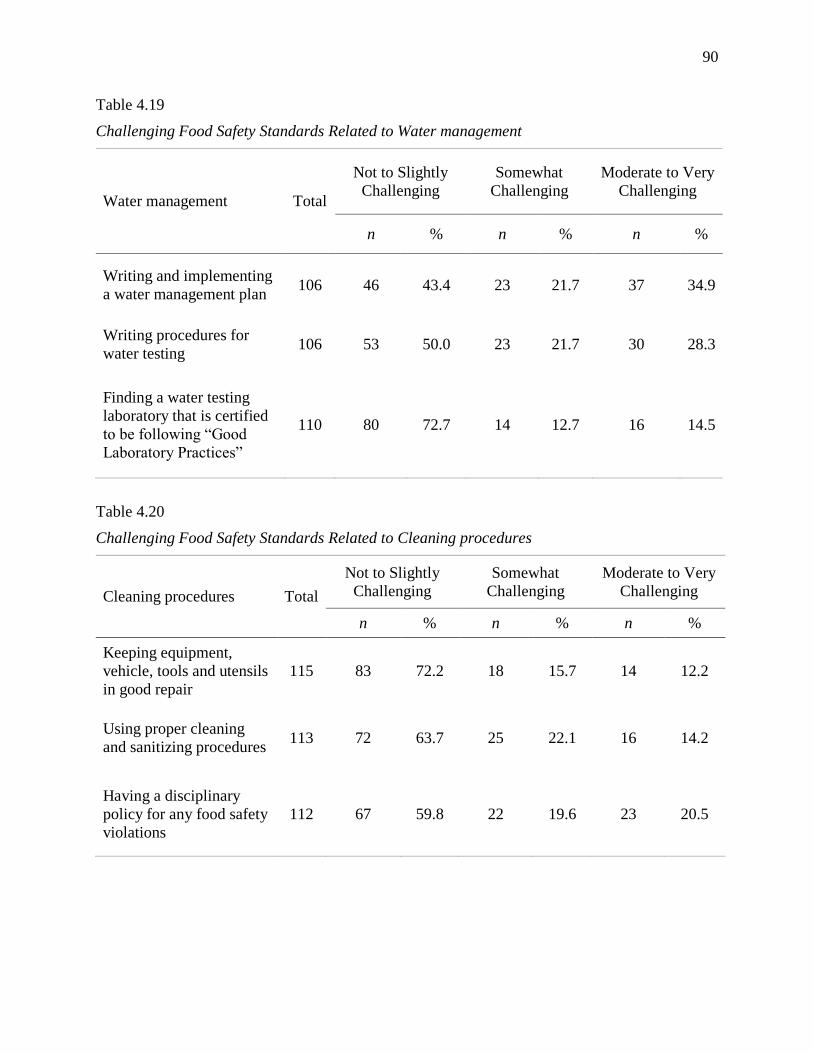
90
Table 4.19
Challenging Food Safety Standards Related to Water management
Water management Total
Not to Slightly
Challenging
Somewhat
Challenging
Moderate to Very
Challenging
n % n % n %
Writing and implementing
a water management plan 106 46 43.4 23 21.7 37 34.9
Writing procedures for
water testing 106 53 50.0 23 21.7 30 28.3
Finding a water testing
laboratory that is certified
to be following “Good
Laboratory Practices”
110 80 72.7 14 12.7 16 14.5
Table 4.20
Challenging Food Safety Standards Related to Cleaning procedures
Cleaning procedures Total
Not to Slightly
Challenging
Somewhat
Challenging
Moderate to Very
Challenging
n % n % n %
Keeping equipment,
vehicle, tools and utensils
in good repair
115 83 72.2 18 15.7 14 12.2
Using proper cleaning
and sanitizing procedures 113 72 63.7 25 22.1 16 14.2
Having a disciplinary
policy for any food safety
violations
112 67 59.8 22 19.6 23 20.5
91
Harvesting policy. Produce growers were asked to rate three food safety standards
related to harvesting policy based on how challenging it was for them to meet standard
requirements. The majority of the respondents indicated writing and implementing a policy
regarding the cleanliness of harvesting container (n=66, 58.4%) and a policy on preventing non-
root crop contacting ground (n=61, 63.5%) not to slightly challenging (Table 4.21). Compared to
those two harvesting policy requirements, relatively higher number of respondents (n=27,
24.5%) rated writing a policy on identifying potential food safety hazards and plan to control
them as moderate to very challenging.
Transportation. On the survey questionnaire three standards under the section of
transportation were rated. Growers rate how challenging it was for them to write procedures for
cleanliness and proper functioning of shipping units, preparing a checklist for cleanliness, and
writing a policy for trash handling procedures. For all the three standards, more than 65% of
respondents indicated meeting the standard requirements were not to slightly challenging (Table
4.22).
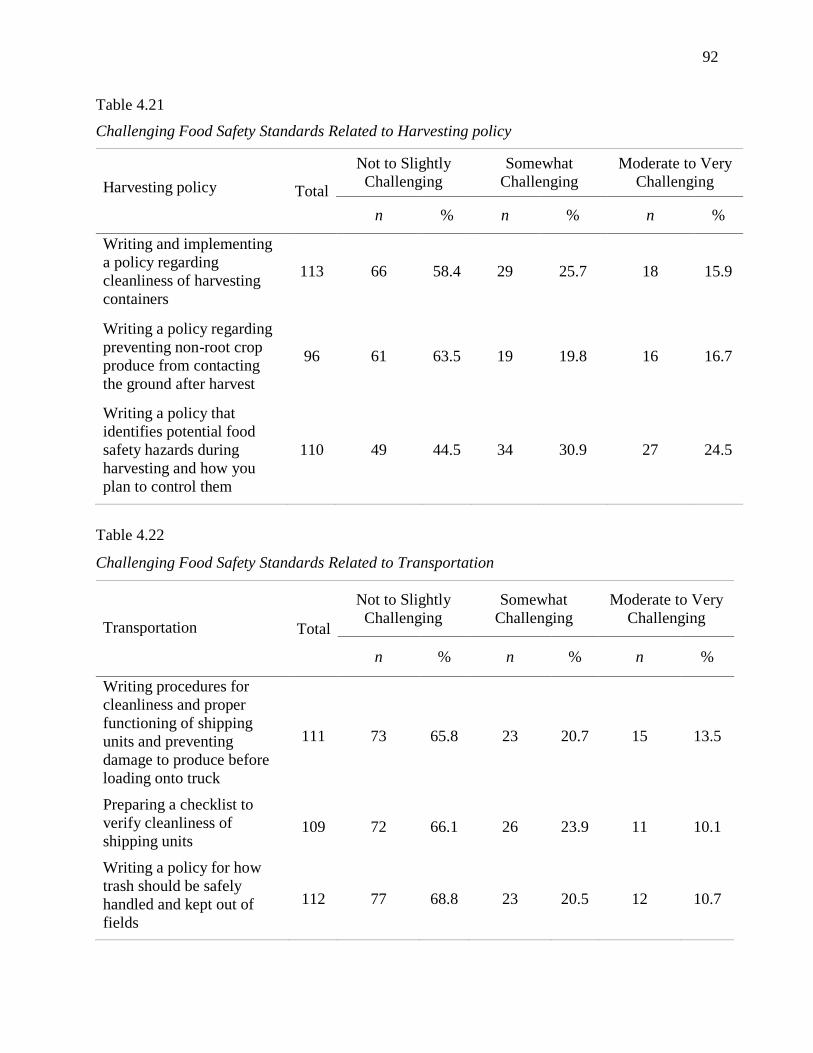
92
Table 4.21
Challenging Food Safety Standards Related to Harvesting policy
Harvesting policy Total
Not to Slightly
Challenging
Somewhat
Challenging
Moderate to Very
Challenging
n % n % n %
Writing and implementing
a policy regarding
cleanliness of harvesting
containers
113 66 58.4 29 25.7 18 15.9
Writing a policy regarding
preventing non-root crop
produce from contacting
the ground after harvest
96 61 63.5 19 19.8 16 16.7
Writing a policy that
identifies potential food
safety hazards during
harvesting and how you
plan to control them
110 49 44.5 34 30.9 27 24.5
Table 4.22
Challenging Food Safety Standards Related to Transportation
Transportation Total
Not to Slightly
Challenging
Somewhat
Challenging
Moderate to Very
Challenging
n % n % n %
Writing procedures for
cleanliness and proper
functioning of shipping
units and preventing
damage to produce before
loading onto truck
111 73 65.8 23 20.7 15 13.5
Preparing a checklist to
verify cleanliness of
shipping units 109 72 66.1 26 23.9 11 10.1
Writing a policy for how
trash should be safely
handled and kept out of
fields
112 77 68.8 23 20.5 12 10.7
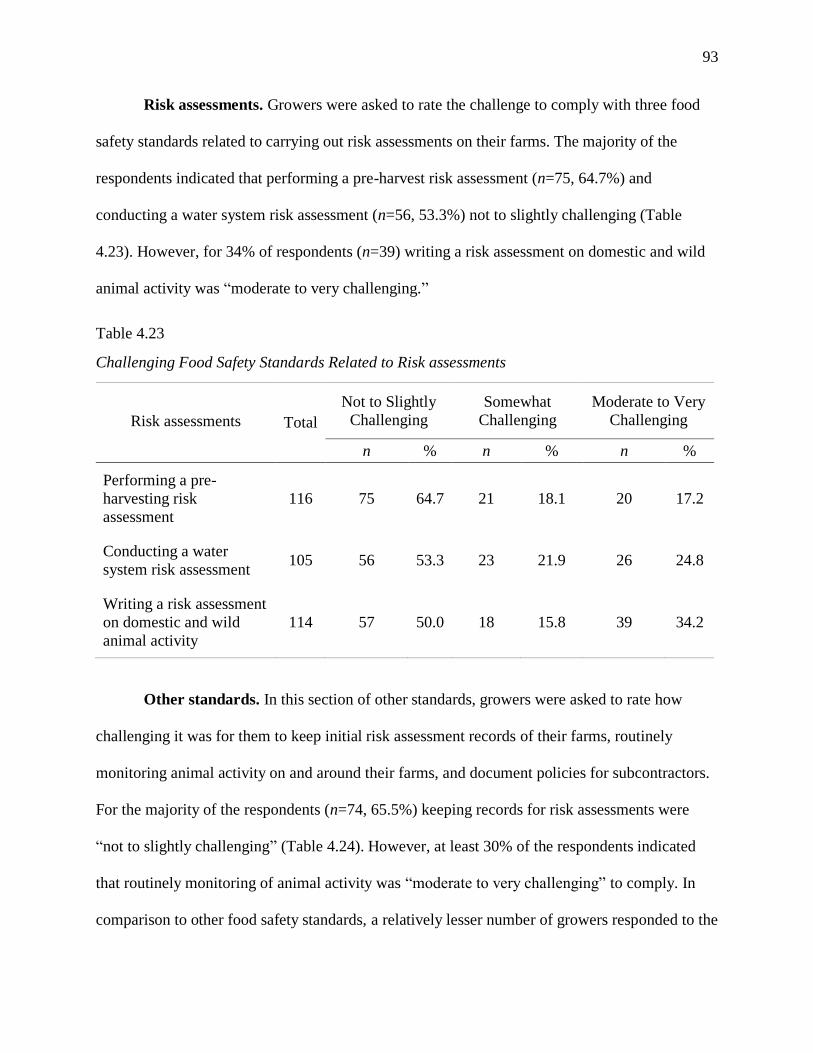
93
Risk assessments. Growers were asked to rate the challenge to comply with three food
safety standards related to carrying out risk assessments on their farms. The majority of the
respondents indicated that performing a pre-harvest risk assessment (n=75, 64.7%) and
conducting a water system risk assessment (n=56, 53.3%) not to slightly challenging (Table
4.23). However, for 34% of respondents (n=39) writing a risk assessment on domestic and wild
animal activity was “moderate to very challenging.”
Table 4.23
Challenging Food Safety Standards Related to Risk assessments
Risk assessments Total
Not to Slightly
Challenging
Somewhat
Challenging
Moderate to Very
Challenging
n % n % n %
Performing a pre-
harvesting risk
assessment
116 75 64.7 21 18.1 20 17.2
Conducting a water
system risk assessment 105 56 53.3 23 21.9 26 24.8
Writing a risk assessment
on domestic and wild
animal activity
114 57 50.0 18 15.8 39 34.2
Other standards. In this section of other standards, growers were asked to rate how
challenging it was for them to keep initial risk assessment records of their farms, routinely
monitoring animal activity on and around their farms, and document policies for subcontractors.
For the majority of the respondents (n=74, 65.5%) keeping records for risk assessments were
“not to slightly challenging” (Table 4.24). However, at least 30% of the respondents indicated
that routinely monitoring of animal activity was “moderate to very challenging” to comply. In
comparison to other food safety standards, a relatively lesser number of growers responded to the

94
questions on documentation of policy for subcontractors as for many growers that standard was
not applicable. Moreover, out of 75 respondents, 26 (34.7%) rated complying with that standard
as “moderate to very challenging.”
Table 4.24
Growers’ Rating of the Challenge to Comply with Other Food Safety Standards
Other standards Total
Not to Slightly
Challenging
Somewhat
Challenging
Moderate to Very
Challenging
n % n % n %
Keeping initial risk
assessment records 113 74 65.5 24 21.2 15 13.3
Routinely monitoring of
animal activity 113 55 48.7 24 21.2 34 30.1
Documentation to assure
that sub-contractors are
complying with food
safety standards
75 29 38.7 20 26.7 26 34.7
Overall Major Challenging Food Safety Standards
Table 4.16 ranks the most challenging GAPs harmonized food safety standards. Ranking
of standards was based on the overall percentage of respondents’ rating of standards as
“moderate to very challenging” to comply with. In total for 13 food safety standards,
approximately 25% or more respondents indicated to comply with them was either moderately or
very challenging (Table 4.25). With 49% writing a food safety plan and keeping records for food
safety plan top the list, most challenging of all standards. The most challenging food safety
standards included writing and implementing a water management plan, writing risk assessments
on the domestic and wild animal, writing a policy on glove uses on farms, and documenting and
carrying out trace back and trace forward exercise. A thorough review of these standards showed

95
that the majority of the most challenging food safety standards were related to writing and/or
documentation activities.
Table 4.25
Ranking of Overall Challenging Standards (Criteria ≥ 25% of total Respondents)
Food Safety Standard Total n %
1. Writing a food safety plan 112 55 49.1
2. Keeping records for a food safety plan 116 57 49.1
3. Writing and implementing a water management plan 106 37 34.9
4. Documentation to assure that sub-contractors are complying with
food safety standards 75 26 34.7
5. Writing a risk assessment on domestic and wild animal activity 114 39 34.2
6. Writing and implementing policies and procedures in your plan,
such as whether or not you require gloves when handling
produce
112 38 33.9
7. Documenting and carrying out a trace back and forward exercise 113 38 33.6
8. Routinely monitoring of animal activity 113 34 30.1
9. Documenting corrective actions 113 33 29.2
10. Writing procedures for water testing 106 30 28.3
11. Making sure that employees follow hygienic practices 116 31 26.7
12. Conducting a water system risk assessment 105 26 24.8
13. Writing a policy that identifies potential food safety hazards
during harvesting and how you plan to control them 110 27 24.5

96
Variation of Most Challenging Standards Across the States
In order to test if the most challenging standards were significantly varied for different
states, z-score proportional tests were performed. Tables showing results are presented in
Appendix C. As mentioned earlier in the methodology section, the most challenging food safety
standards were the standards for which more than or equal to 25% of the respondents indicated
either moderate or very challenging to comply (Table 4.25). Since the number of respondents
was higher for Pennsylvania, New Jersey, and New York, these three states were included for the
proportional tests.
z-test of proportional difference was performed between proportions of growers from
Pennsylvania and New Jersey who rated the food safety standards as moderate to very
challenging. For all the most challenging food safety standards, except one, the study failed to
reject the hypothesis (H0): There were no significant proportional differences in growers’
responses between the two states. Results showed that the proportional difference between
respondents indicating writing a food safety plan as “moderate to very challenging” was
significant (z=-2.12, p=.034). The negative value of proportional difference indicated that more
produce growers of New Jersey rated writing a food safety plan moderately to very challenging
than respondents of Pennsylvania.
Similar tests were performed between Pennsylvania and New York and between New
York and New Jersey. For none of the food safety standards the proportional differences between
the Pennsylvania and New York were statistically significant. The z-score test statistic results
support the hypothesis that there was no significant difference between the proportions of
growers from Pennsylvania and New York who rated food safety standards as moderate to very
challenging.

97
z-test of proportional difference was performed between proportions of growers from
New York and New Jersey who rated the food safety standards moderately to very challenging to
meet the requirements. Among the 13 standards, for 10 the proportional differences were not
statistically different and hence, the test failed to reject the hypothesis (H3). The proportional
differences were statistically different for writing food safety plan (z=-2.26, p= 0.024) and
writing a policy identifying and controlling physical food safety hazards during harvesting (z=-
2.02, p=0.043). The negative z-score values indicated that complying with standards related to
food safety plan and physical hazards were more challenging for produce growers of New Jersey
than New York. Additionally, for a higher proportion of growers from New Jersey ensuring
employees are following hygienic standards were challenging than growers of New York (z= -
1.88, p =.06).
Produce Type and Challenges to Implementing GAPs
In order to test if there were any associations exist between growers’ rating of challenges
to implementing food safety standards and type of produce they grow, Chi-Square test of
association was performed. Consistent with the GAPs harmonization parameter, the study
hypothesized that growers rating of challenges to implementing GAPs on their farm was
independent to the type of produce they grow (i.e., fruits, vegetables, or both). The Chi-Square
tests results indicated almost all the food safety standards were independent of the types of
produce, except for the standards related to transportation.
Chi-square tables were created for the two transportation harmonized standards for which
the association was significant at the level of .05. Table 4.26 displays the Chi-square 3 x 3
contingency table of produce type and the challenge to write procedures for cleanliness and
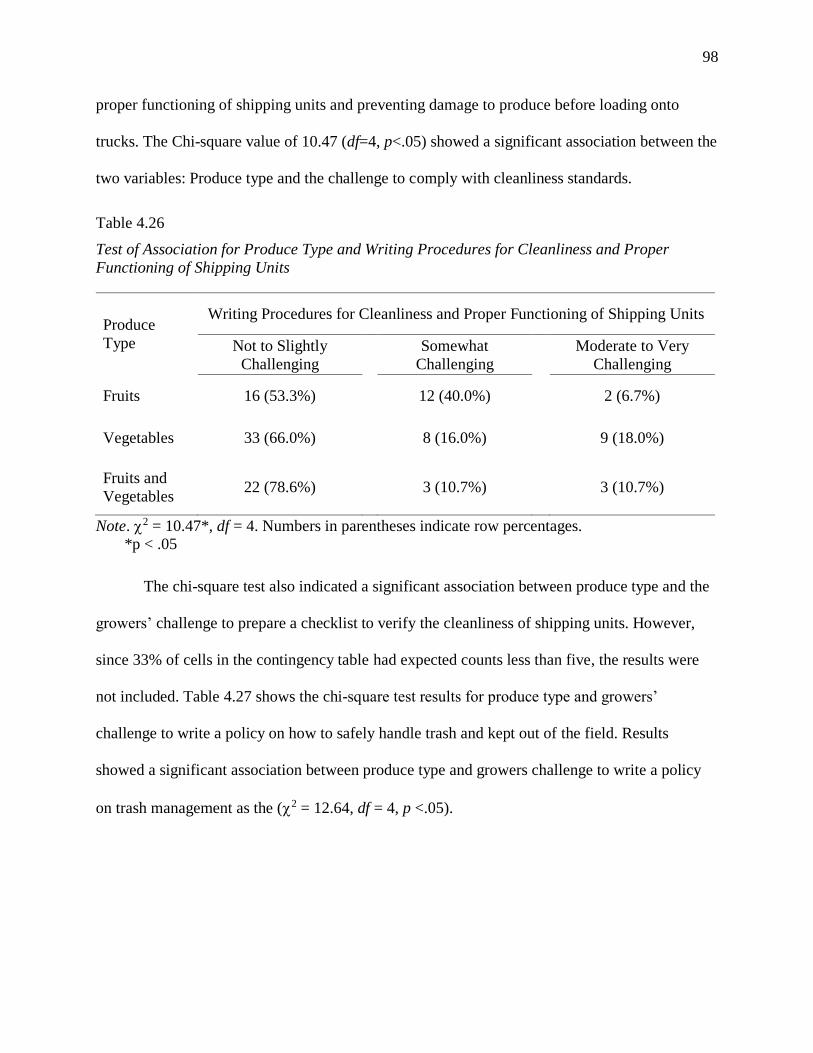
98
proper functioning of shipping units and preventing damage to produce before loading onto
trucks. The Chi-square value of 10.47 (df=4, p<.05) showed a significant association between the
two variables: Produce type and the challenge to comply with cleanliness standards.
Table 4.26
Test of Association for Produce Type and Writing Procedures for Cleanliness and Proper
Functioning of Shipping Units
Produce
Type
Writing Procedures for Cleanliness and Proper Functioning of Shipping Units
Not to Slightly
Challenging
Somewhat
Challenging
Moderate to Very
Challenging
Fruits 16 (53.3%) 12 (40.0%) 2 (6.7%)
Vegetables 33 (66.0%) 8 (16.0%) 9 (18.0%)
Fruits and
Vegetables 22 (78.6%) 3 (10.7%) 3 (10.7%)
Note. 2 = 10.47*, df = 4. Numbers in parentheses indicate row percentages. *p < .05
The chi-square test also indicated a significant association between produce type and the
growers’ challenge to prepare a checklist to verify the cleanliness of shipping units. However,
since 33% of cells in the contingency table had expected counts less than five, the results were
not included. Table 4.27 shows the chi-square test results for produce type and growers’
challenge to write a policy on how to safely handle trash and kept out of the field. Results
showed a significant association between produce type and growers challenge to write a policy
on trash management as the (2 = 12.64, df = 4, p <.05).
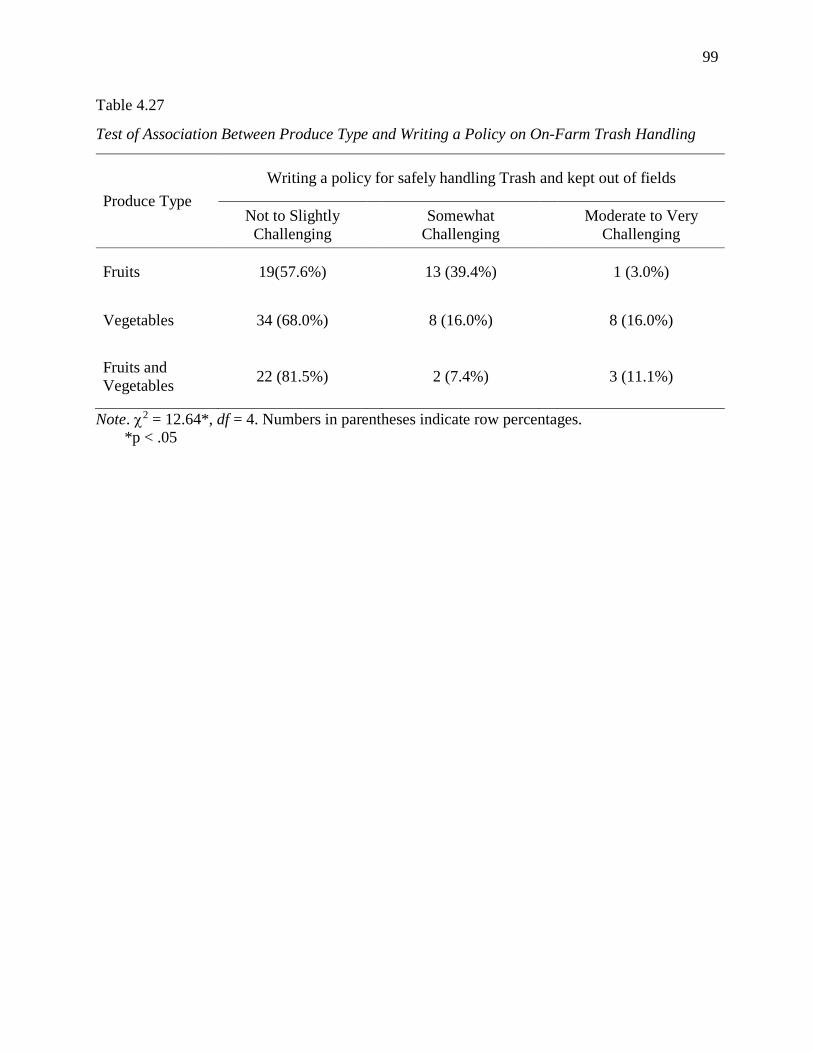
99
Table 4.27
Test of Association Between Produce Type and Writing a Policy on On-Farm Trash Handling
Produce Type
Writing a policy for safely handling Trash and kept out of fields
Not to Slightly
Challenging
Somewhat
Challenging
Moderate to Very
Challenging
Fruits 19(57.6%) 13 (39.4%) 1 (3.0%)
Vegetables 34 (68.0%) 8 (16.0%) 8 (16.0%)
Fruits and
Vegetables 22 (81.5%) 2 (7.4%) 3 (11.1%)
Note. 2 = 12.64*, df = 4. Numbers in parentheses indicate row percentages. *p < .05

100
Objective 4: Determine the Source of GAP Information, Barriers to Implementing Gaps
and Carry Out Risk Assessments on the Farms
Source of GAP Information
Produce growers were asked to rate the amount of GAP information they receive from
various sources. Table 4.28 shows the list of GAP information sources and the amount of
information that growers of Mid-Atlantic states and New York receive from those sources.
Results showed that Cooperative Extension (n=50, 43.9%), USDA GAPs user guide (n=38,
33.3%), and online (n=31, 27.2%) were the top three GAP sources from where produce growers
received “quite a bit to a great deal of information.” Respondents also indicated that they
received quite a bit or a great amount of GAP information from consultants (n=29, 25.4%) and
other farmers (n=26, 22.8%). Six growers mentioned that they received “quite a bit of to a great
amount of” GAP information from other sources. The other sources included Wegmans (n=2),
other certifying agencies such as Global GAP (n=1), and USDA meetings (n=1).
Table 4.28
Amount of Information from Various Sources (Total=114)
GAP-Information Sources None to a little A fair amount
Quite a bit to a
great deal of
n % n % n %
USDA GAPs user guide 44 38.6 32 28.1 38 33.3
Grower associations 72 63.2 20 17.5 22 19.3
Cooperative Extension 39 34.2 25 21.9 50 43.9
Consultants 70 61.4 15 13.2 29 25.4
Other farmers 67 58.8 21 18.4 26 22.8
Online sources 63 55.3 20 17.5 31 27.2
Agricultural industry
representatives 82 71.9 18 15.8 14 12.3
Other 108 94.7 - - 6 5.3

101
Crosstab of the amount of GAP information from various GAP sources and states
provided further insight into the major information source for produce growers in individual
states. Results showed that majority of growers of New Jersey (n=12, 70.6%), New York (n=26,
74.3%), and Maryland (n=4, 80%) received a fair to great amount of GAP information from
USDA users guide. Cooperative extension provided a fair to great amount of information to the
majority of respondents (≥ 50%) of all the Mid-Atlantic states and New York.
Three out of four respondents from Virginia and three out of five respondents from
Maryland received a fair to a great amount of information from consultants and other farmers,
respectively. Online sources provided a fair to a great amount of GAP information to the
majority of the respondents of all the states (≥ 50%), except Pennsylvania. The majority of the
respondents from New Jersey received a fair to great amount of information from agricultural
industry representatives.
Barriers to Implementing GAPs
Produce growers were asked to mention the barriers to implementing GAPs on their
farms. In total 112 produce growers answered the questions. Results showed that the major
barriers to implementing GAPs were time, cost to comply with food safety standards and clarity
in GAP guidelines (Table 4.29). Around 87% (97) of the respondents indicated time was a
barrier for them to adopt GAPs on their farms. Next to time, the other major barrier for GAP
implementation was cost as 53.6% (n=60) of the total respondents identified cost as a barrier.
The majority of growers from all the Mid-Atlantic States and New York identified cost as
a barrier, expect Virginia. None of the respondents from Virginia indicated cost a barrier for
them to adopt GAPs on their farms. Fifty-two respondents (46.4%) mentioned the lack of clarity
in GAP guidelines as a barrier. All the two respondents from Delaware mentioned clarity as a
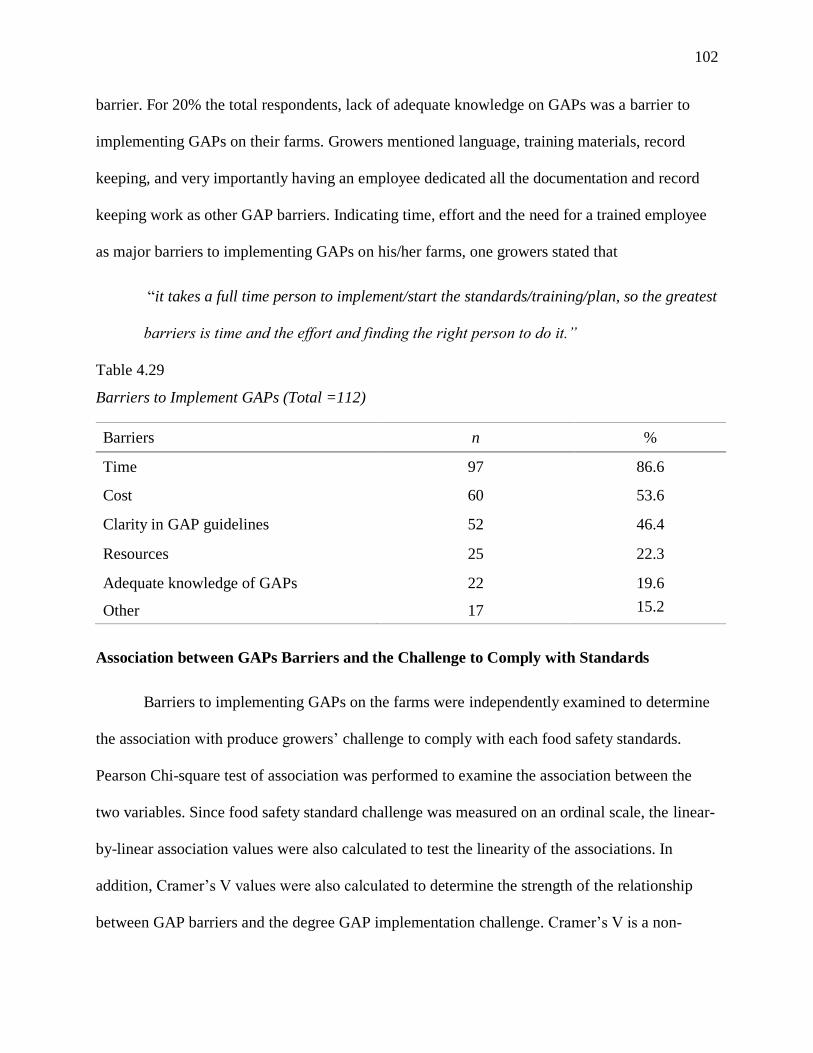
102
barrier. For 20% the total respondents, lack of adequate knowledge on GAPs was a barrier to
implementing GAPs on their farms. Growers mentioned language, training materials, record
keeping, and very importantly having an employee dedicated all the documentation and record
keeping work as other GAP barriers. Indicating time, effort and the need for a trained employee
as major barriers to implementing GAPs on his/her farms, one growers stated that
“it takes a full time person to implement/start the standards/training/plan, so the greatest
barriers is time and the effort and finding the right person to do it.”
Table 4.29
Barriers to Implement GAPs (Total =112)
Barriers n %
Time 97 86.6
Cost 60 53.6
Clarity in GAP guidelines 52 46.4
Resources 25 22.3
Adequate knowledge of GAPs 22 19.6
Other 17 15.2
Association between GAPs Barriers and the Challenge to Comply with Standards
Barriers to implementing GAPs on the farms were independently examined to determine
the association with produce growers’ challenge to comply with each food safety standards.
Pearson Chi-square test of association was performed to examine the association between the
two variables. Since food safety standard challenge was measured on an ordinal scale, the linear-
by-linear association values were also calculated to test the linearity of the associations. In
addition, Cramer’s V values were also calculated to determine the strength of the relationship
between GAP barriers and the degree GAP implementation challenge. Cramer’s V is a non-

103
parametric test to measure inter-correlation between two nominal variables. Tables 4.30-4.33
shows the results of Pearson Chi-square test of association with significant chi-square, linear-by-
linear association, and Cramer’s V values.
Time. The results showed that the barrier time was significantly associated with two food
safety standards related to documentation of corrective actions (2 = 10.37, p<.05) and routinely
monitoring of animal activity (2 = 4.95, p<.10) (Tables 4.30). Further analysis shows that only
documentation of corrective action was strongly (Cramer’ V value =.308) and linearly associated
(8.37: p<.05).
Table 4.30
Chi-Square Test of Association Between Time and Challenge to Comply Food Safety Standards
Food Safety Standard Chi-square Cramer’s V p Linear-by-linear
Association p
Documenting corrective actions 10.365 .308 <.05 8.370 <.05
Routinely monitoring of animal
activity 4.946 .213 <.10
Cost. GAP implementation cost was found to be significantly associated with a relatively
large number of food safety standards as indicated in Table 4.31. Among those food safety
standards, writing a policy to identify potential food safety hazards and control plan (2 =13.254,
p<.05) and documentation of corrective actions (2 =13.153, p<.05) were relatively strongly
associated with cost as the Cramer’s V values were .354 and .347, respectively. Significant
linear-by-linear association values further indicated a linear association between those two food
safety standards with cost.

104
Table 4.31
Chi-Square Test of Association Between Cost and Challenge to Comply Food Safety Standards
Food Safety Standard Chi-square Cramer’s
V p
Linear-by-linear
Association p
Writing a policy that identifies
potential food safety hazards 13.254 .354 <.05 8.827 <.05
Documenting corrective actions 13.153 .347 <.05 12.147 <.05
Ensuring that employees are
adequately trained in food safety 8.390 .274 <.05
Writing a food safety plan 7.936 .271 <.05
Having a disciplinary policy for any
food safety violations 7.163 .258 <.05 6.150 <.05
Documenting and carrying out a
trace back and forward exercise 6.568 .245 <.05 4.546 <.05
Writing and implementing a water
management plan 6.315 .249 <.05 3.884 <.05
Routinely monitoring of animal
activity 5.196 .218 <.10 5.018 <.05
Writing procedures for cleanliness
and proper functioning of shipping
units 5.021 .217 <.10 3.737 <.10
The other standard that were significantly and linearly associated with cost were having a
disciplinary policy for food safety violations (2 =7.163, p<.05), documenting and carrying out a
trace back and forward exercise (2 =6.568, p<.05), and writing and implementing water
management plan (2 =6.315, p<.05). These three policies related to food safety violations, trace
back and forward exercises and water management plan were moderately related to cost, as the
Cramer’s V values were .258, .245 and .249, respectively.

105
In addition, standards related to ensuring employees are adequately trained (2 =8.39,
p<.05) and writing a food safety plan (2 =7.936, p<.05) were significantly associated with cost.
However, such associations were not linear at a significant level of .05. Table 4.31 also shows
that routinely monitoring of animal activities and cleanliness and functioning of shipping units
were also associated with cost (p<.10).
GAP resources. Results showed that GAP resources found to be significantly associated
with relatively highest number of food safety standards. Challenges to routine monitoring of
animal activities (2 =11.381, p<.05) and preparing a checklist to verify the cleanliness of
shipping units (2 =9.297, p<.05) were moderate to strongly associated with GAP resources with
Cramer’s V values .323 and .298, respectively (Table 4.32). Such associations were further
found to be linear at a significant level of .05. Even though, the standard related to proper
cleaning and sanitizing procedures was significantly associated with GAP resources (2 =8.534,
p<.05), the association was not linear.
Furthermore, challenges to performing pre-harvest risk assessments, keeping records for
food safety plan, conducting water system risk assessments and documenting corrective actions
were significantly associated with GAP resource barriers. Such associations of GAP resource
barrier with food standards related to pre-harvest risk assessments, keeping records, and water
system risk assessments were linear and relationships were moderately strong. The challenge to
comply with documenting corrective actions was moderately related with GAP resources. The
table also listed three food safety standards related to trace-back and forward exercise, adequate
training of farm employees, and writing and implementation of food safety plan procedures,
which are associated with the barrier of GAP resources (p<.10).

106
Table 4.32
Chi-Square Test of Association Between GAP resources and Challenge to Comply Food Safety
Standards
Food Safety Standard Chi-
square
Cramer’s
V p
Linear-by-linear
Association p
Routinely monitoring of animal
activity 11.381 .323 <.05 9.973 <.05
Preparing a checklist to verify
cleanliness of shipping units 9.297 .298 <.05 7.166 <.05
Using proper cleaning and sanitizing
procedures 8.534 .280 <.05 3.326 <.10
Performing a pre-harvesting risk
assessment 8.332 .273 <.05 6.361 <.05
Keeping records for a food safety plan 8.149 .271 <.05 6.155 <.05
Conducting a water system risk
assessment 6.871 .261 <.05 6.214 <.05
Documenting corrective actions 6.328 .241 <.05 6.087 <.05
Documenting and carrying out a trace
back and forward exercise 5.783 .230 <.10
Ensuring that employees are
adequately trained in food safety 5.713 .226 <.10
Writing and implementing policies
and procedures 5.472 .225 <.10
GAP knowledge.
Pearson Chi-square test of association was performed for GAP knowledge barrier and
challenge to implement food safety standards. Table 4.33 shows the food safety standards that
were significantly associated with GAP knowledge. The same table also lists chi-square,
Cramer’s V and linear-by-linear values. The challenges to conduct a water system risk
107
assessment (2 =6.871, p<.05), t, writing and implementing food safety plan (2 =6.651, p<.05),
and documenting corrective actions (2 =6.524, p<.05) were significantly and linearly associated
with GAP knowledge. Furthermore, the Cramer’s V values for those three standards related to
water system risk assessment, food safety plan, and corrective actions were moderately related
with GAP knowledge.
The challenge to make sure farm employees were following hygienic practices (2
=9.715, p<.05) and writing a risk assessment on animal activities (2 =6.232, p<.05) were
significantly associated with knowledge barrier. However, the associations were not linear at a
significant level of .05. Additionally, challenges to comply with food safety standards such as
preparing a checklist for cleanliness of shipping unit, finding GLP, and keeping initial risk
assessment records were also associated with knowledge barrier (p<.10).
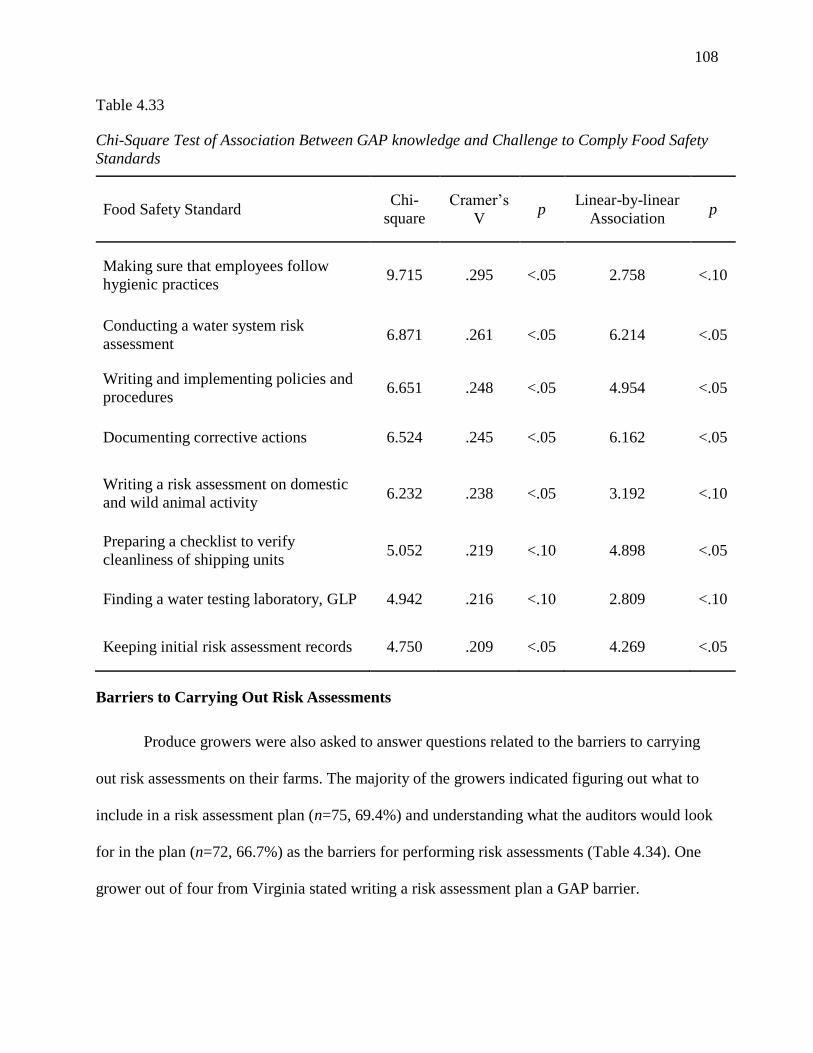
108
Table 4.33
Chi-Square Test of Association Between GAP knowledge and Challenge to Comply Food Safety
Standards
Food Safety Standard Chi-
square
Cramer’s
V p
Linear-by-linear
Association p
Making sure that employees follow
hygienic practices 9.715 .295 <.05 2.758 <.10
Conducting a water system risk
assessment 6.871 .261 <.05 6.214 <.05
Writing and implementing policies and
procedures 6.651 .248 <.05 4.954 <.05
Documenting corrective actions 6.524 .245 <.05 6.162 <.05
Writing a risk assessment on domestic
and wild animal activity 6.232 .238 <.05 3.192 <.10
Preparing a checklist to verify
cleanliness of shipping units 5.052 .219 <.10 4.898 <.05
Finding a water testing laboratory, GLP 4.942 .216 <.10 2.809 <.10
Keeping initial risk assessment records 4.750 .209 <.05 4.269 <.05
Barriers to Carrying Out Risk Assessments
Produce growers were also asked to answer questions related to the barriers to carrying
out risk assessments on their farms. The majority of the growers indicated figuring out what to
include in a risk assessment plan (n=75, 69.4%) and understanding what the auditors would look
for in the plan (n=72, 66.7%) as the barriers for performing risk assessments (Table 4.34). One
grower out of four from Virginia stated writing a risk assessment plan a GAP barrier.

109
Table 4.34
Barriers to Carry out Risk Assessment (Total=108)
Barriers n %
Figuring out what to include in a risk assessment plan 75 69.4
Understanding what the auditors would look for in the plan 72 66.7
Writing management procedures for reducing risks 46 42.6
Accessing and understanding the latest scientific information
on produce food safety 41 38.0
Preparing food safety plan verification checklists 26 24.1
Identifying sources of contamination 19 17.6
Other 7 6.5
The majority of respondents from the Mid-Atlantic states and New York stated
understanding of auditors’ specific requirements for the risk assessment plan as a barrier, except
respondents from Maryland. Since only two out of five respondents stated understanding of
“what auditors would look for in the risk assessment plan” as a risk assessment barrier. However,
unlike the respondent from other states, for most of the Maryland respondents (four out of five)
the writing management procedures for reducing risks was a major barrier. Overall 42.6% and
38% of the respondents pointed out writing risk assessment procedures and assessing and
understanding scientific food safety information were barriers to carrying out risk assessments,
respectively.
110
Barriers to Perform Risk Assessments Vs. Challenges to Comply Food Safety Standards
The questionnaire contained three questions relative to risk assessments. In order to
verify if there are any relationship and associate exist between risk assessment tasks and barriers
to performing a risk assessment on the farm. Pearson chi-square tests were performed and linear-
by-linear association and Cramer’s V values and calculated. Tables 4.35-4.37 show the
significant barriers that are significantly related to risk assessments of food safety standards.
Performing a pre-harvest risk assessment. The challenge to perform a pre-harvest risk
assessment was tested for its association with the potential barriers that the growers face in
carrying out risk assessments. Pearson chi-square test of association results showed that the
challenge to perform a pre-harvest risk assessment was significantly and linearly associated with
writing management procedures for reducing risk (2 =18.782, p<.05) and figuring out what to
include in a risk assessment plan (2 =6.05, p<.05) (Table 4.35). Furthermore, growers’
challenge to perform a pre-harvest risk assessment strongly related with writing risk management
procedures were (Cramer’s V=.417) and moderately related to developing risk assessment plan
(Cramer’s V=.237).
In addition to that, the barriers related to the identification of the source of contamination
and preparation of food safety plan verification checklists were also significantly associated with
the challenge to perform a pre-harvest risk assessment. For the 2x3 chi-square contingency tables
for the barriers and pre-harvest standard, in two (33%) cells of each table the expected count was
less than five, the minimum expected count required for a chi-square test of association.
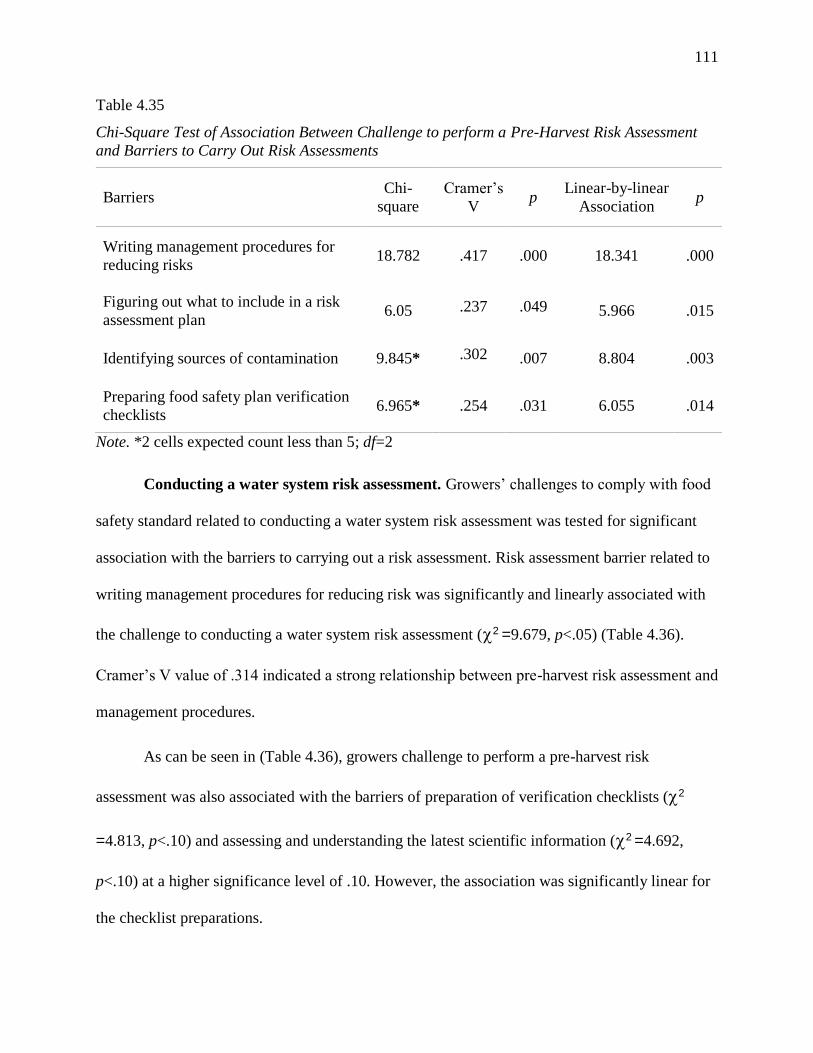
111
Table 4.35
Chi-Square Test of Association Between Challenge to perform a Pre-Harvest Risk Assessment
and Barriers to Carry Out Risk Assessments
Barriers Chi-
square
Cramer’s
V p
Linear-by-linear
Association p
Writing management procedures for
reducing risks 18.782 .417 .000 18.341 .000
Figuring out what to include in a risk
assessment plan 6.05 .237 .049 5.966 .015
Identifying sources of contamination 9.845* .302 .007 8.804 .003
Preparing food safety plan verification
checklists 6.965* .254 .031 6.055 .014
Note. *2 cells expected count less than 5; df=2
Conducting a water system risk assessment. Growers’ challenges to comply with food
safety standard related to conducting a water system risk assessment was tested for significant
association with the barriers to carrying out a risk assessment. Risk assessment barrier related to
writing management procedures for reducing risk was significantly and linearly associated with
the challenge to conducting a water system risk assessment (2 =9.679, p<.05) (Table 4.36).
Cramer’s V value of .314 indicated a strong relationship between pre-harvest risk assessment and
management procedures.
As can be seen in (Table 4.36), growers challenge to perform a pre-harvest risk
assessment was also associated with the barriers of preparation of verification checklists (2
=4.813, p<.10) and assessing and understanding the latest scientific information (2 =4.692,
p<.10) at a higher significance level of .10. However, the association was significantly linear for
the checklist preparations.
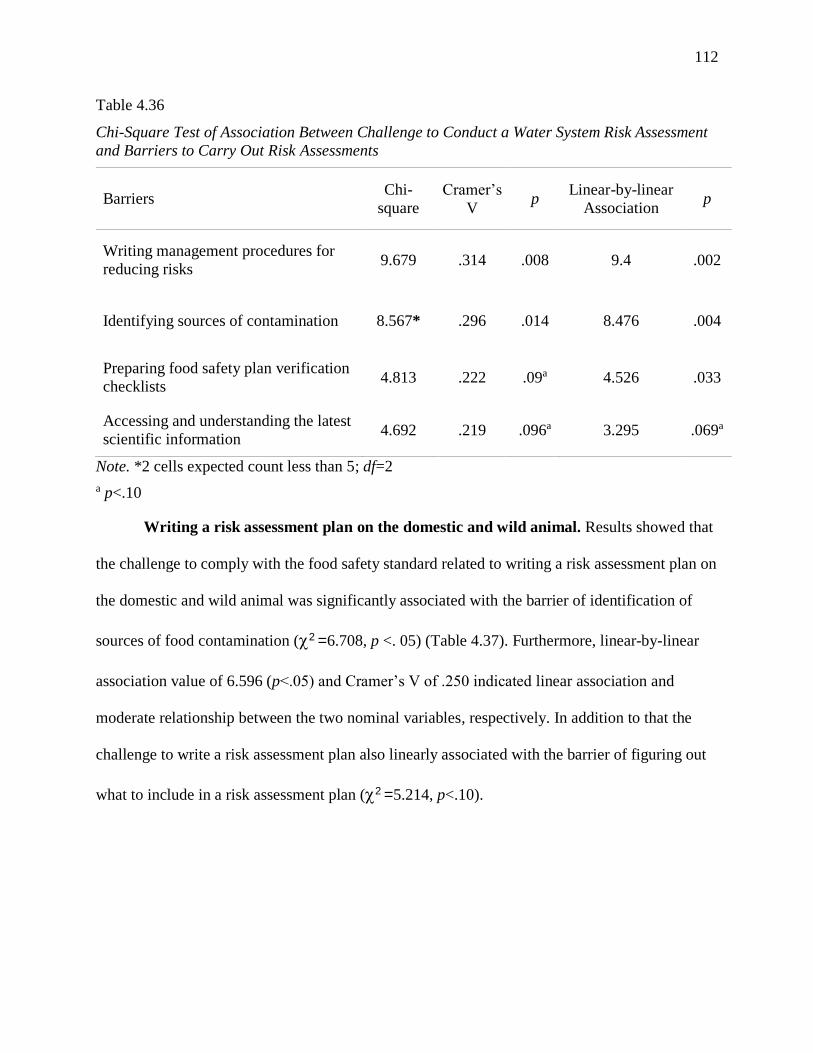
112
Table 4.36
Chi-Square Test of Association Between Challenge to Conduct a Water System Risk Assessment
and Barriers to Carry Out Risk Assessments
Barriers Chi-
square
Cramer’s
V p
Linear-by-linear
Association p
Writing management procedures for
reducing risks 9.679 .314 .008 9.4 .002
Identifying sources of contamination 8.567* .296 .014 8.476 .004
Preparing food safety plan verification
checklists 4.813 .222 .09a 4.526 .033
Accessing and understanding the latest
scientific information 4.692 .219 .096a 3.295 .069a
Note. *2 cells expected count less than 5; df=2
a p<.10
Writing a risk assessment plan on the domestic and wild animal. Results showed that
the challenge to comply with the food safety standard related to writing a risk assessment plan on
the domestic and wild animal was significantly associated with the barrier of identification of
sources of food contamination (2 =6.708, p <. 05) (Table 4.37). Furthermore, linear-by-linear
association value of 6.596 (p<.05) and Cramer’s V of .250 indicated linear association and
moderate relationship between the two nominal variables, respectively. In addition to that the
challenge to write a risk assessment plan also linearly associated with the barrier of figuring out
what to include in a risk assessment plan (2 =5.214, p<.10).

113
Table 4.37
Chi-Square Test of Association Between Challenge to Write a Risk Assessment Plan on Domestic
and Wild Animal and Risk Assessment Barriers
Barriers Chi-
square
Cramer’s
V p
Linear-by-linear
Association p
Identifying sources of contamination 6.708 .250 .035 6.596 .01
Figuring out what to include in a risk
assessment plan 5.214 .221 .074* 3.812 .051*
Note. * p<.10; df =2
Summary
Objective 1 identified the harmonized GAPs food safety standards for which the
frequency CAN or IAR were relatively higher. In total, 166 audits were analyzed, and
descriptive results were presented for individual states. On nine out of 36, farms in New Jersey
corrective actions or immediate actions required to meet the requirement of standard 2.2.6.
Analysis of the audits from New York revealed 4.1.1 as the standard for which noncompliance
was frequently reported. Whereas in the audits from Delaware, CAN frequency was relatively
higher for standards 2.2.10 and 2.2.11. Noncompliance to the standard 1.8.1 was frequently
reported in Maryland.
Proportional test and risk ratio test results were consistent. For the majority of the
sections, there was no significant difference in reporting of noncompliance between New Jersey
and New York. From the risk ratio tests it was concluded that for a few GAP areas the likelihood
of reporting of noncompliance was higher on the farms of New Jersey than on the farm of New
York and Pennsylvania. More specifically, those GAP areas were related to worker education
and training, their health and hygiene, testing and sampling, and condition of farm equipment
and vehicle than farms of either Pennsylvania and New York.

114
Objective 2 focused on the aspects of GAP noncompliance. Auditors’ comments were
reviewed to determine the various aspects of noncompliance. Documentation, writing corrective
actions, keeping records, and more importantly compliance with the established food policy were
the key areas for where noncompliance was reported.
On the other hand, objectives 3 and 4 presented results from descriptive and correlational
analysis of 116 surveys. Respondents from Pennsylvania constituted almost 47% of the survey
sample. Resellers and direct sales were found to be the two major produce marketing channels
for GAP certified growers of Mid-Atlantic states and New York. Objective 3 also identified the
most challenging food safety standards. Writing a food safety plan, keeping records for a food
safety plan, and writing and implementing water management plans were found to be
comparatively more challenging tasks that other certification requirements. Proportional test
results showed that growers did not differ significantly based on their experience in complying
with the food safety standards. Besides, Growers experience with meeting transportation
standards was significantly associated with the type of produce they grow.
Objective 4 provided results related to GAP information sources, barriers to complying
with GAPs and carry out risk assessments on the farms. Results showed that Cooperative
Extension and USDA GAPs user guide are the primary GAP information sources for certified
growers. Time and cost were identified as the significant barriers to GAP implementation, and
preparing a risk assessment plan and understanding auditors’ expectations were found to be the
key obstacles for carrying out risk assessments.

115
Chapter 5
Discussion, Conclusions, and Recommendations
Discussion
The study utilized a mixed-method approach in assessing the implementation of
harmonized Good Agricultural Practices (GAPs) food safety standards on Mid-Atlantic region
farms. Audits were treated as a principal evaluation tool in identifying standards as well as the
criteria for GAP noncompliance. The administered surveys intended to further validate findings
from the audit analysis.
The current study is arguably unique in two aspects. First, of previous studies that
targeted GAP certified growers, none or very few adopted audit analysis as a methodology for
identifying noncompliance. Second, rather than relying on growers’ self-reports of compliance to
standards, the survey asked growers to rate how challenging it was for them to meet standard
requirements. For example, in Hultberg et al. (2012), Rangarajan et al. (2002), Cohen et al.
(2005), and Jackson et al. (2007), growers self-reported their food safety practices. In self-
reporting, growers might be inclined to offer socially favorable answers.
The study objectives primarily focused on four aspects of GAP implementation: (1)
standards for which noncompliance was higher, (2) criteria for noncompliance, (3) standards that
are challenging for growers to meet, and (4) barriers to implementing GAPs and performing risk
assessments.
General questions. Findings from all five states—Pennsylvania (PA), New Jersey (NJ),
Maryland (MD), Delaware (DE), and New York (York)—were consolidated to determine the
most problematic harmonized GAP food safety standards in terms of noncompliance. The
majority of the farms audited for the year 2013–14 met the standard requirements for harmonized
116
audits. However, there were certain standards for which the frequency of noncompliance was the
higher and therefore evaluated as major food safety concerns. Growers largely met the general
requirements of having a food safety plan and documentation for that plan. However, developing
a food safety plan and keeping records it were challenging to almost half of the surveyed
growers. Such findings accorded with Bihn et al. (2013), which reported that the majority of their
surveyed farms had no food safety plan.
Under general questions, the two subsections having to do with growers’ most frequent
failure to comply with requirements were worker education and training, and sampling and
testing. The majority of the noncompliance on worker education and training were reported for
the standard 1.4.3 when farm operations had no food safety policy for sub-contractors. As per
1.4.3, subcontractors are required to hold to the same policy as farm employees. However, a
majority of New Jersey farms had no policy for subcontractors.
With regard to having the same policy for subcontractors same as for farm employees,
more than half of the survey participants rated compliance as somewhat to very challenging. This
standard was one of the more challenging standards for a relatively greater number of produce
growers than any other standards. Findings from the audits and the surveys on subcontractor
policy were consistent with one another. However, the survey appeared to show that not all farm
operations were required to have a subcontractor policy as a requirement to pass the audit.
Audits revealed that documentation for self-audits was not a major noncompliance issue
for a majority of farms; survey findings confirmed that further. Only a few farm operations did
not have corrective action procedures available for review during the audit process, and more
than half of the surveyed growers indicated that documenting corrective actions was somewhat
to very challenging for them. Similarly, results from the audits and survey were inconsistent

117
regarding documentation and carrying out a traceback and forward exercise. A very few farm
operators were unable to document and perform a traceability exercise. However, one-third of
survey respondents indicated such practices were “moderate to very challenging” for them.
Additionally, corrective actions were required more frequently to address standard 2.2.9,
which mandates a glove use policy— that is, workers are required to wear gloves if needed
during field production activities. Results appeared to show that growers were more likely not to
be sure about the exact policy requirements. In some occasions, the policies were incomplete—
in other cases, workers were not adhering to company policy. The assumption was that writing
and implementing a glove use policy might be challenging for the farm operations. In support of
the assumption, survey results revealed that having a glove use policy and complying with it was
one of the challenging food safety standards for Mid-Atlantic and New York growers. Therefore,
more clarity is required in developing a glove use policy and conveying the policy requirements
to suppliers as well as the farm workers in particular.
Corrective actions also were more frequently required to address standards related to
testing and sampling. Furthermore, in both cases, whether it was workers training or testing
procedures, the majority of farm operations were in New Jersey. In addition to policy on
subcontractors and testing and sampling, documentation on corrective procedures was another
area in which growers were required to take corrective actions, mostly because documentation
was either incomplete or not being followed.
Field production. Twenty-one questions on the audit checklist ensure that farm
operations are taking adequate precautions to address worker health and hygiene and provide
toilet and handwashing facilities. The policy requires farm operations to have an appropriate
number of well-maintained toilet and handwashing facilities for and accessible to the farm

118
workers. The workers’ health and hygiene category not only contained a higher number of
sections/questions but also reported a higher number of corrective actions for that category.
The survey questions focused on three key areas of employee training, such as adequate
training for farm workers, keeping records as proof of employees receiving food safety training
regularly, and making sure workers are following hygienic practices in the field. The unhygienic
behavior of field workers in produce-growing areas was one of the major reasons for produce
contamination with human pathogens. Although farm operations had policies for hygienic
practices, auditors observed unhygienic behaviors, such as smoking, eating, or spitting on the
field. Such unhygienic behavior of food handlers increase the chances of produce contamination
and led to the automatic failure of the audit as observed in a few cases. Those failures included
cases in which workers did not wash their hands before returning to work.
Survey results indicated that convincing workers to follow hygienic practices on the field
was often a challenging task for growers. Although only one-fourth of study respondents
confirmed that ensuring workers follow hygienic practices was challenging, it remains an on-
farm food safety concern. In addition, worker education and training, and documentation
emerged from the audit analysis as food safety concerns. Hamilton et al. (2015) also found a lack
of proper documentation in the audit process for Minnesota farm operations.
Furthermore, when produce growers were asked about compliance with worker-training
related standards, the majority stated that ensuring their farm employees were receiving adequate
training and documentation was either not or a slightly challenging task for them. Adequate
training of employees may not guarantee incorporation through behavioral change. Thus, an
effective monitoring procedure should be in place to ensure employees are following the
company’s food safety policies. Such situations call for a better and more efficient method of
119
communication between growers and farm workers to promote Good Hygienic Practices (GHP)
and a food safety culture within the operation.
Cohen et al. (2005) provided an indication that New England growers were unaware of
the need to test irrigation water for coliform. On the contrary, from the results, it appears that
audited growers in Mid-Atlantic states and New York were in compliance with water-testing
policies. Growers using municipal water are not required to test it for pathogen levels. If testing
is required, all tests should be performed at “Good Laboratory Practices” certified labs. Finding
such labs is not a challenge for growers. However, writing procedures for water testing, a water
management plan, and developing a procedure for implementing that plan were challenging for
more than one-fourth of survey respondents. Furthermore, there were cases in which farm
operations had no water management plan, or lacked a written policy regarding cleaning water
tanks at a sufficient frequency.
Harvesting. Harvesting policies also focus on pre-harvesting risk assessments, use of
water and ice, containers, bins and packing materials, field packing and handling, and post-
harvest handling and storage. Corrective actions were less frequently required for harvesting
standards than field production. In other words, correctives actions were needed to meet
harvesting harmonized policies in fewer farms compared to field production standards.
Food safety standards require growers to keep farm equipment and other tools that come
in contact with produce in good repair condition. Hultberg et al. (2012) identified deficiencies in
growers’ compliance with cleaning of harvesting tools and water treatment for washing and
cleaning. Confirming Hultberg et al. (2012), the results from audits showed noncompliance in
keeping records that verify proper and regular equipment maintenance activities— another major
area of food safety concern. On the contrary, survey results showed that complying with food
120
safety standards related to cleaning and sanitizing procedures was not challenging to most of
produce growers in the Mid-Atlantic states and New York. Similarly, only one out of five
produce growers noted that having a disciplinary policy for food safety violations was a
challenging task.
Field packing and handling requirements were identified as a major noncompliance issue
on the audited farms. For example, no written policy indicated that damaged or decayed produce
should not be harvested or should be culled. Analysis of audits concluded that growers
frequently failed to meet policy requirements on containers, bins, and packaging materials, and
field packaging and handling. Furthermore, in few audits there were no written policies
regarding storage of harvest containers; and in some cases, even though the policy was in place,
auditors witnessed non-adherence to it. Meeting the requirement of food safety standards related
to the cleanliness of harvesting containers and the policy on non-root crops was not challenging
for the majority of survey respondents. On the other hand, writing a policy on hazard
identification and control was a challenging area for growers.
Transportation. Growers were largely in compliance with transportation harmonized
standards. Keeping records and maintaining a verification checklist were areas in which growers
more frequently failed to comply with requirements—growers in New York and New Jersey
appeared especially less likely to meet these requirements. On the other hand, one out of ten
respondents mentioned that preparing a checklist to verify the cleanliness of shipping units was a
challenging practice.
Risk assessments. Assessment of risk associated with preharvest activities, water system
and wild and domestic animal activities on the field are the three top tasks under risk
assessments. Among these three activities, risk assessment of animal activities was the most
121
challenging task for the grower to perform. Audits also confirmed these results— auditors found
that documentation related to assessing animal activities in and around the field was incomplete
in some audited farms. Furthermore, one out of four producers indicated that conducting water
system risk assessment was a challenging standard for them.
Growers rated compliance with routine monitoring of animal activity in and around the
field as a difficult task. This finding was supported by Hultberg et al. (2012) and Hamilton et al.
(2015). These studies reported growers’ noncompliance with keeping animals out from the field,
packing or storage areas. On the other hand, the majority of participants in Lichtenberg and Page
(2016) reportedly inspected and monitored their field for wildlife activities. The major barrier in
performing a risk assessment was preparing a risk assessment plan.
Other survey findings. The study considered the state as a variable and tested whether
growers significantly varied based on their experience with GAP implementation. Hypotheses
were developed to test whether the challenge to implement harmonized standards varied among
New York, New Jersey, and Pennsylvania. Findings from the proportional tests accepted the test
hypothesis of no significant difference in produce growers experiences with implementing
harmonized GAPs. Regardless of the states to which produce growers belonged, their experience
with GAPs remained the same, except for a few standards that included:
Writing a food safety plan and hazard identification and writing control procedures were
challenging to significantly more produce growers in New Jersey than in New York;
When compared to growers in Pennsylvania, the growers in New Jersey were more likely
to find writing a food safety plan a challenging task;
For overall challenging standards, the study did not find any significant difference in the
proportions of growers in Pennsylvania and New York; and
122
For the majority of challenging standards, growers’ experience remained the same. In
other words, standards were equally challenging for growers in New York, Pennsylvania,
and New Jersey.
Except for standards related to transportation, study findings suggested that grower on-
farm food safety implementation experience was independent of the type of produce they grew.
Produce growers in Mid-Atlantic states and New York obtained GAP information from various
sources. However, the amount of information they received from those sources varied.
Cooperative Extension was among the top sources of GAP information. The majority of the
USDA-audited growers received a fair to significant amount of information from Extension.
Moreover, these study findings suggest that produce growers in the six states depend on
Cooperative Extension services and a USDA user’s guide for GAP information.
The study focused on the barriers to implementing GAPs. Time and cost were found to be
the major barriers to GAP implementation. Becot et al. (2012) and Korslund (2014) found
similar results and reported time and cost to be major GAP barriers. Hardesty and Kusunose
(2009) reported an overall increase in cost of due to LGMA compliance. In addition, other
studies such as Karaman et al. (2012) identified cost and knowledge as barriers in implementing
HACCP in the dairy industry; and Jackson et al. (2007) identified cost and GAP resources as
barriers to GAP implementation. The study revealed that the clarity in GAP guidelines could also
be an adoption barrier to many produce growers.
The other major concern was the burden of documentation or the amount of paperwork
that needed to be completed to meet standard requirements. Growers indicated a need for a
permanent employee for all documentation work; at the same time, small growers could not
afford an additional employee dedicated only to documentation work (Korslund, 2011). On the
123
other hand, growers also indicated that implementation of a GAP program was challenging only
in the beginning year. Once a food safety plan is written and growers go through the
documentation process to establish a GAP program at the beginning, the next year it becomes
easier to repeat the activities for certification. The survey showed that for some producers,
implementing the food safety plan is a more challenging task than documentation.
GAP barriers were tested for their association with the challenges to meet harmonized
food safety standards. Time also was an obstacle for more than 80% of respondents, was
independent of most of the food safety standards. On the other hand, the cost was significantly
associated with growers’ rating of how challenging it was for them to meet standard
requirements.
From the significant linear-by-linear association between cost and the challenge in
complying with standards, it appeared that: (1) many standards did not require direct costs, and
(2) the indirect cost associated with the activities might be the reason for the significant
association. The indirect cost might be employing a full-time person to take care of writing,
documenting and monitoring activities in compliance with a food safety plan, such as writing a
water management plan and policy for possible hazard identification or documentation on
corrective actions and a trace back and forward exercise.
Only 22% of the growers mentioned that a lack of resources was a barrier for them. On
the other hand, the test of association showed that GAP resources needed to comply with the
standard were significantly as well as linearly associated with a relative higher number of
standard requirements. For example, the challenge to routine monitoring of animal activities, use
of proper cleaning and sanitizing procedures, preparing a checklist to verify the cleanliness of
124
shipping units, performing a pre-harvest and water system risk assessment, and documenting
corrective actions were associated with resources.
Although GAP knowledge was reportedly a barrier to only 20% of survey respondents, it
was significantly associated with standards related to employees’ hygienic practices, writing
corrective actions, writing risk assessment on domestic and wild animal activities, and
conducting water system risk assessments. Clarity in GAP guidelines was identified as a major
GAP barrier that was, however, not associated to any of the harmonized standards.
Almost 70% of the surveyed producers indicated that identifying what to include in a risk
assessment plan was an obstacle in performing risk assessments. Such findings shed light on the
disconnect in communication between growers and auditors regarding a comprehensive risk
assessment plan. Thus, to ensure better implementation of a GAP certification program, there
needs to be effective and clear risk communication between the auditing agencies/auditors and
the producers. Future studies focusing on risk communication may consider adopting mental
models to determine how growers and auditors perceive risk associated with various on-farm
practices (Eggers et al., 2010).
The study showed that identification of potential sources of contamination was not a
major barrier for produce growers. However, writing a risk-mitigating plan was a challenging
task for four out of ten produce growers. Another major challenge for growers was accessing and
understanding the latest scientific information on produce safety. Effective implementation of a
GAP program requires growers not only to keep up-to-date on emerging food safety issues but
also to take measures to mitigate those risks. Therefore, it also becomes a responsibility of
outreach agencies to inform growers regarding recent developments in produce safety as well as
science-based methods of controlling emerging issues in a manner that enables growers to easily

125
access and understand them. USDA GAP-certified growers were able to identify the potential
source of contaminations on the farms and did not consider them a barrier in performing risk
assessments, according to study results.
The potential barriers to performing risk assessments on the farms were tested to examine
their associations and relationships with performing post-harvest, water system, and animal
activity risk assessments. Although identification of the source of contamination was not
assessed as a barrier by the majority of produce growers, results showed significant association
and positive relationships with carrying out pre-harvest, water system and animal activity risk
assessments. In other words, growers who rated complying with all three risk assessment
standards as challenging were also likely to find the identification of the source of contamination
to be a barrier.
Growers who reported pre-harvest and water system risk assessments to be challenging
compliance task were likely to find writing management procedures to reduce risks and prepare
food safety plan verification checklists to be risk assessment barriers. The barrier in preparing a
risk assessment plan was significantly and positively related to the challenge in performing a pre-
harvest risk assessment.
Conclusions
Conclusions are based on across-methodology validation through confirmation and
contradictions in the findings. The preconceived notion is that suppliers who decide to go
through the GAP auditing process and receive certifications do make the necessary modifications
in accordance with the guidelines. Growers stated that the first year of GAP implementation for
the audit was difficult compared to subsequent years. In other words, preparation for certification

126
is more challenging than subsequent years, when the growers know which modifications they
need to make to become certified, and all of the documentation is in place.
The study revealed that audited farm operations were largely in compliance with food
safety standards, except for a few with higher noncompliance rates. Examples include glove use
policy, worker education and training, policies about sub-contractors, and maintenance of
vehicles and equipment. Furthermore, noncompliance with standards varies from state to state.
The absence of written policy, incomplete documentation, absence of or incomplete records, and
workers’ nonadherence with company policies were the criteria in most cases requiring
corrective actions. The failure of a few farm operations to pass audits and obtain GAP
certifications highlighted their lack of preparation for complying with GAP standards.
Meeting the requirements of the harmonized standards about passing audits does not
necessarily reflect the fact that the standards may not be challenging due to numerous on-farm
constraints. Although growers are largely in compliance with general food standards, survey
findings showed that writing a food safety plan and keeping records on the plan were challenging
tasks for most produce growers. Writing a risk assessment plan and monitoring of domestic and
wild animal activities were also found to be challenging tasks.
The study indicated no significant differences in PA, NY, and NJ growers’ experiences in
implementing GAPs. Similarly, except for a couple of standards related to transportation, there
was no significant association or relationships between the type of produce grown by producers
and their challenge in meeting food safety standards. Therefore, the study may conclude that
growers’ experiences with incorporating the harmonized food safety standards were similar
irrespective of their farm location and the types of produce they grew.

127
The study, aligned with findings from other similar studies, revealed time and cost to be
the major barriers to GAP adoption. GAP knowledge and resources were also barriers for many
produce growers in this study. Survey results also showed that excessive documentation and
paperwork needed to be completed to pass an audit, necessitating an additional burden of
employing a worker for that purpose. Additionally, the lack of understanding of what to include
in a risk assessment plan and what the auditors would look for in a risk assessment plan was a
major obstacle for produce growers in carrying out risk assessments.
Produce growers in five Mid-Atlantic states and New York obtained GAP information
from various sources. This study identified Cooperative Extension as a major GAP information
provider along with a USDA GAP user guide for GAP-certified growers. Eggers et al. (2010)
also reported growers’ preference for GAP information and support from agricultural extension
agents and university experts. Certified growers in those states mostly sold their produce directly
to restaurants, supermarkets, consumers and resellers such as wholesaler distributors. The study
also concluded that certified growers complying with harmonized GAPs food safety standards
were more likely to stay in the harmonized program and renew their certification annually.
Implications for Extension. The Cooperative Extension Service has a mandate to serve
the farming community through non-formal education and assistance. Extension has been
offering workshops and training programs to produce growers to implement food safety practices
and prepare for GAP audits (Mahmoud, Stafne, Coker, Bachman, & Bell, 2016). These GAP
workshops were found to be effective in increasing growers’ knowledge and attitude changes on
the adoption of GAPs (Nayak, Tobin, Thomson, Radhakrishna, & LaBorde, 2015; Shaw,
Strohbehn, Naeve, Domoto, & Wilson, 2015).

128
One of the purposes of the study was to assist Cooperative Extension in developing and
improving on-farm food safety programming through the provision of valid evidence that better
serves and prepares growers. The study identified areas of GAP harmonized audits in which
growers are more likely to fail to meet requirements and standards found to be a compliance
challenge. Identification of these specific standards would be valuable to Extension as it seeks to
improve current programs, prioritize objectives, and design new programming interventions.
Figure 5.1 presents the overall findings of the audit and survey analyses. The figure
displays food safety standards that frequently lack compliance as well as challenging food safety
standards. Extension food safety programming should focus on these standards and prioritize
them in their curricula recognizing the barriers growers face in implementing GAPs and carrying
out risk assessments on their farms. Findings from this study have implications for Extension as
it works to improve current and tailor new programs to educate, train, assist, and prepare produce
growers to successfully incorporate GAP programs on farms and obtain GAP certification. The
study makes the following recommendations should be considered by Extension:
1. Training growers on writing a food safety plan for the operation and effective
communication of those policies to farm employees. More specifically, this would
include policies related to the use of gloves in the field by the workers and policies for
subcontractors., if applicable to the farm;
2. Educating growers about ways to efficiently identify and evaluate all potential food
safety hazards during field production and harvesting practices and writing an effective
hazard control plan (Bihn & Gravani, 2006);

129
3. Writing procedures for (1) testing and sampling, (2) corrective actions, (3) field
packaging and harvest containers, (4) non-root crop management practices, and (5)
handling and storage of harvest containers;
4. Training farm workers to adopt good hygienic practices;
5. Offer commodity-specific training to growers and more importantly educating growers
about past cases of outbreaks linked to particular fruits and vegetables and the traced
sources of contaminations (Rangarajan et al., 2002);
6. Working closely with stakeholders to establish an effective communication link between
auditing agencies and growers;
7. Offering training programs not only to growers who are newly establishing GAP
programs for their farms, but also producers who have been through the auditing process
already in past years; and
8. The promotion of food safety culture in farm operations.
Food safety culture. Powell, Jacob, and Chapman (2010) advocated the adoption of food
safety culture in food manufacturing, processing and service facilities to reduce the rate of
foodborne illness. Their main argument was that organizational culture change could more
effectively lead to practice change than only by educational training. Educational training models
that solely focus on knowledge dissemination in order to bring about change in practice are often
criticized for linearity in assumptions. Extension services can simultaneously promote and assist
growers and farm workers to adopt a food safety culture on their farms.

130
PA NY VA MD DE NJ
Figure 5.1. Overall result chart showing implications for Extension©
)
Target States
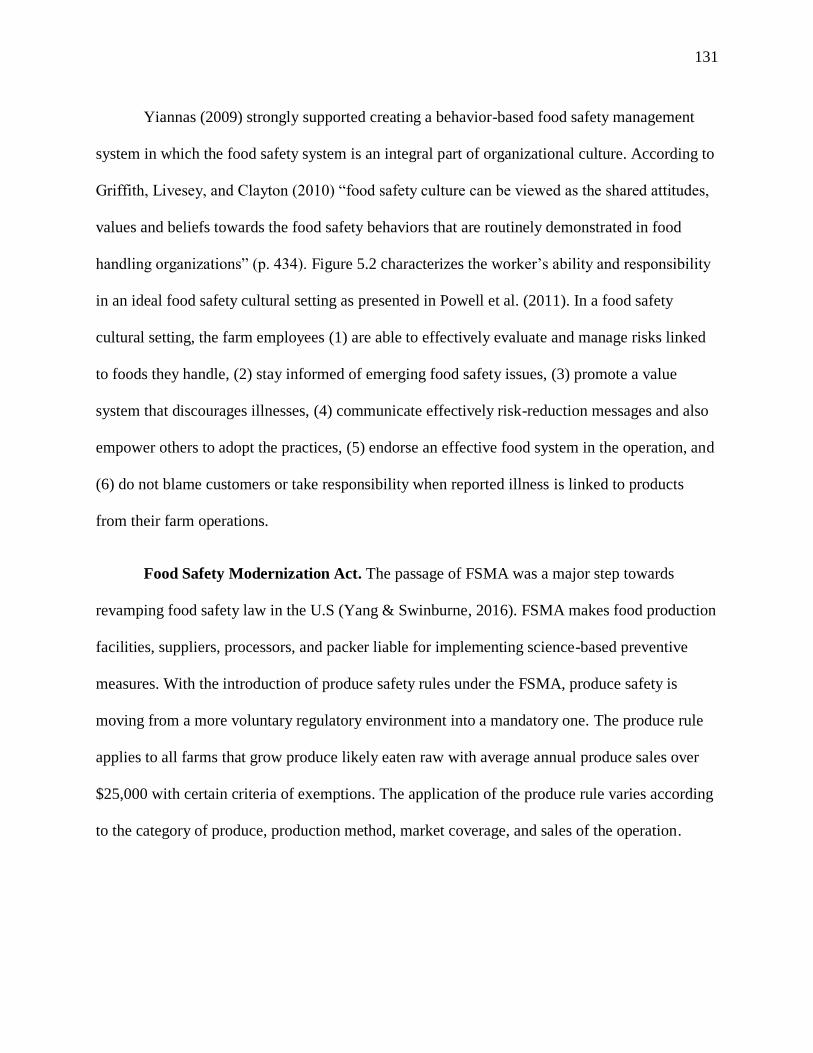
131
Yiannas (2009) strongly supported creating a behavior-based food safety management
system in which the food safety system is an integral part of organizational culture. According to
Griffith, Livesey, and Clayton (2010) “food safety culture can be viewed as the shared attitudes,
values and beliefs towards the food safety behaviors that are routinely demonstrated in food
handling organizations” (p. 434). Figure 5.2 characterizes the worker’s ability and responsibility
in an ideal food safety cultural setting as presented in Powell et al. (2011). In a food safety
cultural setting, the farm employees (1) are able to effectively evaluate and manage risks linked
to foods they handle, (2) stay informed of emerging food safety issues, (3) promote a value
system that discourages illnesses, (4) communicate effectively risk-reduction messages and also
empower others to adopt the practices, (5) endorse an effective food system in the operation, and
(6) do not blame customers or take responsibility when reported illness is linked to products
from their farm operations.
Food Safety Modernization Act. The passage of FSMA was a major step towards
revamping food safety law in the U.S (Yang & Swinburne, 2016). FSMA makes food production
facilities, suppliers, processors, and packer liable for implementing science-based preventive
measures. With the introduction of produce safety rules under the FSMA, produce safety is
moving from a more voluntary regulatory environment into a mandatory one. The produce rule
applies to all farms that grow produce likely eaten raw with average annual produce sales over
$25,000 with certain criteria of exemptions. The application of the produce rule varies according
to the category of produce, production method, market coverage, and sales of the operation.

132
Figure 5.2. Aspects of food safety culture (from Powell, Jacob, & Chapman, 2011)
Adherence to the requirements FSMA incurs additional costs for farm businesses.
Discussing the implications of FSMA for growers, Calvin (2013) stated that “those who were
proactive in adopting food safety practices may not face many additional requirements with
FSMA; others may face substantial new requirements” (p. 2). Concerns have been raised
regarding the performance and compliance of small farmers in this regulatory environment with
the additional burden of conformity. Large farms with established food safety programs are in
better position to meet the requirements relative to the small farms. Boys, Ollinger, and Geyer
(2015) studied the implications of the FSMA for small-scale farms in the U.S. However, through
the Tester-Hagan Amendment, small farms may be exempted from some of the provisions of
FSMA.
Food Safety Culture
Knowledge of Risk &
Management
No Blaming to Customers
Up-to-date with
Emerging Issues
Promote a Value System
Effective Communicati
on System
Effective Food Safety
System

133
At this point, the extent to which various criteria for exemptions would affect small farm
businesses is unclear. However, those buying produce from small farms may demand that
suppliers comply with their FSMA-like food safety requirements (Boys, Ollinger, & Geyer 2015;
Lichtenberg & Page, 2016). In other words, foodservice and retailers may still require their
suppliers to obtain GAP audits from various programs, even though they are exempt under the
FSMA. Gorny (n.d.) pointed out that produce GAPs Harmonized Food Safety Standards will
more likely incorporate the FSMA produce rules. In a regulatory setting, producers wanted to
utilize food safety audits as a tool for market access. However, after the passage of FSMA,
producers may want to use GAPs harmonized certification to show compliance with FSMA
requirements. Roland (2015) analyzed the effects of produce rules and the exemption criteria on
the farmers and argued that the regulations will ultimately impact the customers. With the
exemption of a large number of farms from FSMA, the exact impact of FSMA on controlling
foodborne illnesses cannot be assessed (Roland, 2015).
Recommendations for Future Studies
This study focused on USDA-audited farm operations for field operations and harvesting
harmonized standards in the Mid-Atlantic region of the U.S. Similar studies should be conducted
in other regions to assess growers compliance with food safety standards and to determine
whether variation in location has any effect on GAP compliance. The current study intended to
collect responses from all accessible USDA harmonized GAP-certified growers. Studies that
focus on a larger population and wider geographic region may consider using stratified random
sampling methods when selecting representative samples.
134
Future studies also may include farms that are being audited by other certifying agencies
such as GLOBAL G.A.P. and SCS Global Services. In this study, the sample size from
Maryland, Delaware, and Virginia was proportionally low in comparison with that from
Pennsylvania, New York, and New Jersey, and therefore, restricted the generalizability of study
findings. The addition of farm operations audited by other certifying agencies to the sample
frame will not only increase sample size but also increase the generalizability of findings.
Researchers also may find this an opportunity to assess the similarities and variations in
challenging food safety requirements, GAP information sources, and the amount of information
growers receive from those resources across different states and auditing agencies.
A typical produce harmonized GAPs audit checklist contains additional information
related to farm size, address, audit duration, and more importantly, commodity type. Since
information in the accessed audits on commodity type was redacted, no direct relationship
between products and food safety practices was examined. Information on product type in
assessing growers’ compliance with food safety standards might be useful to outreach agencies
seeking to better serve growers who wish to meet producers’ commodity-specific GAP
requirements. Thus, future studies should use audit analysis as a methodological approach when
considering commodity type as a variable and determining its relationship with farm practices.
Assessment studies that intend to understand the overall aspects of the adoption of
preventive measures on farms and barriers to their implementation may need to expand the study
questionnaire with additional questions. On the other hand, analysis of the effect of time, cost,
and resources and the relationship of produce marketing channels and farm size with GAP
adoption would be beneficial to outreach agencies seeking to tailor effective on-farm food safety
programs for produce growers. For example, a cost-benefit analysis would be useful in
135
determining the burden of cost on growers in modifying practices to incorporate food safety
programs and the return incentive for such changes. With regard to risk assessments on farms,
the study recognizes the significance of consistencies in growers’, experts,’ and auditors’
perceptions of food safety risks associated with various potential hazards. Therefore, further
research is necessary to determine areas of inconsistency in perceiving risks in establishing an
effective communication model for all major players.
Follow-up in-depth interviews with produce growers and auditors would be beneficial to
improving understanding of growers’ experience with GAP programs and commodity-specific
GAP needs. To enhance the rigor of the study design and collect more evidence on GAP
implementation, further research should be conducted that takes auditors’ perspectives into
account. Additional information provided by auditors would not only further validate findings
but also introduce auditors’ perspectives on on-farm implementation of GAPs. The inclusion of
auditors to the research design might help in establishing effective communication between the
growers’ and auditors’ expectations. Studies should also be conducted with packers and
distributors on their compliance with food safety standards to assess the adoption of post-harvest
harmonized standards. In addition to harmonized GAP audit programs, evaluation studies may
also focus on other produce GAP auditing programs to understand producers’ GAP experiences.
The study did not find any significant difference in growers’ experiences with complying
with challenging food safety standards. The study concluded that in general, the audited produce
growers in Delaware, Maryland, New Jersey, New York, Pennsylvania, and Virginia were in
compliance with the harmonized GAP standards except for a few farms that failed to obtain
certification. Produce growers in these states profoundly rely on Cooperative Extension for GAP
information. Therefore, findings have implications for Extension as it seeks to improve on-farm

136
farm food safety programming and assist growers in obtaining certifications. The study urges
Extension to promote food safety culture through educational and training programs.
Study conclusions were based on certain critical assumptions—e.g., auditors are equally
trained and there are no variations in their competency to assess of GAP compliance.
Assumptions were also made that supported no variations in auditors’ interpretations of food
safety standard requirements and perception of risks. The USDA (2011) user’s guide claims that
auditors undergo rigorous training before officially being licensed to conduct farm audits in
order to provide impartial assessments. Auditors receive formal classroom and job training, and
are evaluated by program management before they receive their license to audit. Auditors are
evaluated yearly and take yearly ethics and professional development training. The guide also
states that “USDA licensed auditors provide impartial, prompt third party services to the fruit
and vegetable industry and have no financial interest in the products and services they are
auditing” (USDA, 2011, p. 2). All USDA audit program auditors meet strict training and
evaluation criteria following AMS Auditor criteria (Petersen, 2015).
Even in the presence of claims made by the USDA, the possibility of variations among
auditors in interpreting and evaluating compliance with individual standard requirements cannot
be discarded. Gorny (n.d.) and Petersen (2015) stated that that produce GAPs harmonized food
safety standards purposely did not address auditor competence. The revelation that relatively
higher proportions of produce farms in New Jersey were not compliant with food safety
standards definitely opens a discourse in this regard. Relevant questions may include following:
are the New Jersey auditors more stringent than their counterparts in Delaware, Maryland, New
York, Pennsylvania, and Virginia? Do their personal traits and perceptions affect audit
outcomes? Is there any difference in audit outcomes when the audit process is carried out by an
137
individual auditor or by a group of auditors? Each of these questions seems relevant. Ho (2016)
used variation in code violations among food inspectors to study the effect of peer review. The
study found significant differences in reported code violations between restaurant inspectors
when inspected identical conditions. This likely applies to farm food safety auditors. The
different perceptions of the significance of farm food safety risks among auditors could be a
reason for variability between states and within states.
While engaging in discourses on auditors may likely shift the focus from variations in the
implementation of GAPs by produce growers to the legitimacy of the auditing process, it is
necessary to evaluate the food safety regulatory and enforcement system. Studies that focus on
deficiencies in GAP compliance should take both aspects of GAP implementation by growers
and certification process for auditors into consideration. This may be one of the limitations of the
study— not to including auditors as one of the mediating variables in assessing GAP
implementation on farms.
Summary
The analysis of audits helped in identifying standards as well as criteria for GAP
noncompliance. The mail surveys further validated findings from the audit analysis. Frequent
noncompliance was reported for standards related to having a food safety policy for
subcontractors and policy on glove use by the farm workers. Writing a food safety plan and
keeping records on it were found to be challenging tasks for growers.
Testing and sampling and hygienic practices by farm workers emerged as major food
safety concerns on farms in the Mid-Atlantic states and New York. Convincing workers to
follow hygienic practices in the field was challenging for growers. Furthermore, writing
procedures for water testing and water management plans, and implementing these plans are
138
areas in which where growers may need assistance in order to comply with audit requirements.
Time and cost were identified as major barriers to GAP implementation. On the other hand, lack
of knowledge on the content of risk assessment plans and deficiencies in communications with
auditors were found to be major barriers to carrying out risk assessments on farms.

139
References
Angelillo, I. F., Viggiani, N., Rizzo, L., & Bianco, A. (2000). Food handlers and foodborne
diseases: Knowledge, attitudes, and reported behavior in Italy. Journal of Food
Protection, 63(3), 381-385. Retrieved from
http://www.ingentaconnect.com/content/iafp/jfp/2000/00000063/00000003/art00015
Angelo, K. M., Chu, A., Anand, M., Nguyen, T., Bottichio, L., Wise, M., … Gieraltowski, L.
(2015, February). Outbreak of Salmonella Newport infections linked to cucumbers —
United States, 2014. Morbidity and Mortality Weekly Report, 64 (06), 144-147. Retrieved
from http://www.cdc.gov/mmwr/preview/mmwrhtml/mm6406a3.htm
Barkenbus, J. (1998). Expertise and the policy cycle. Dept. Energy, Environment, and Resources
Center, University of Tennessee. Retrieved from http://gdrc.org/decision/policy-cycle.pdf
Becot, F. A., Nickerson, V., Conner, D. S., & Kolodinsky, J. M. (2012). Costs of food safety
certification on fresh produce farms in Vermont. HortTechnology, 22(5), 705-714.
Retrieved from http://horttech.ashspublications.org/content/22/5/705.short
Beuchat, L. R., & Ryu, J. H. (1997). Produce handling and processing practices. Emerging
Infectious Diseases, 3(4), 459. doi:10.3201/eid0304.970407
Bihn, E. A., Smart, C. D., & Hoepting, C. A. (2013). Use of surface water in the production of
fresh fruits and vegetables: A survey of fresh produce growers and their water
management practices. Food Protection Trends, 33(5), 307-314.
Bowen, G. A. (2009). Document analysis as a qualitative research method. Qualitative Research
Journal, 9(2), 27-40.
140
Boys, K. A., Ollinger, M., & Geyer, L. L. (2015). The Food Safety Modernization Act:
Implications for U.S. small scale farms. American Journal of Law & Medicine, 41, 395-
405. doi: 10.1177/0098858815591524
Calvin, L. (2013). The Food Safety Modernization Act and the Produce Rule (Vegetables and
Pulses Outlook: Special Article No. VGS-353-SA2). Retrieved from
https://www.ers.usda.gov/webdocs/publications/vgs353/41022_vgs353sa2.pdf
Cary, J. W., & Wilkinson, R. L. (1997). Perceived profitability and farmers ‘conservation
behaviour. Journal of Agricultural Economics, 48(1‐3), 13-21. doi:10.1111/j.1477-
9552.1997.tb01127.x
Centers for Disease Control and Prevention. (2012a). Multistate outbreak of Listeriosis linked to
whole cantaloupes from Jensen Farms, Colorado. Retrieved from
http://www.cdc.gov/listeria/outbreaks/cantaloupes-jensen-farms/index.html
Centers for Disease Control and Prevention. (2012b). Multistate outbreak of Salmonella
Typhimurium and Salmonella Newport infections linked to cantaloupe. Retrieved from
http://www.cdc.gov/salmonella/typhimurium-cantaloupe-08-12/index.html
Centers for Disease Control and Prevention. (2013a). Cyclosporiasis outbreak investigations —
United States, 2013. Retrieved from
http://www.cdc.gov/parasites/cyclosporiasis/outbreaks/investigation-2013.html
Centers for Disease Control and Prevention. (2013b). Multistate outbreak of Salmonella
saintpaul infections linked to imported cucumbers. Retrieved from
http://www.cdc.gov/salmonella/saintpaul-04-13/index.html

141
Centers for Disease Control and Prevention. (2016a). CDC and food safety. Retrieved from
http://www.cdc.gov/foodsafety/cdc-and-food-safety.html
Centers for Disease Control and Prevention. (2016b). List of Selected Multistate Foodborne
Outbreak Investigations. Retrieved from
http://www.cdc.gov/foodsafety/outbreaks/multistate-outbreaks/outbreaks-list.html#year
Centers for Disease Control and Prevention. (2016c). Multistate outbreak of Salmonella Poona
infections linked to imported cucumbers. Retrieved from
http://www.cdc.gov/salmonella/poona-09-15/index.html
Centers for Disease Control and Prevention. (2016d). Multistate outbreak of Shiga toxin-
producing Escherichia coli o157 infections linked to Alfalfa Sprouts produced by Jack &
The Green Sprouts. Retrieved from http://www.cdc.gov/ecoli/2016/o157-02-
16/index.html
Center for Science in the Public Interest. (2014). A review of foodborne illness in America from
2002-2011. Retrieved from http://cspinet.org/reports/outbreakalert2014.pdf
Cohen, N., Hollingsworth, C. S., Olson, R. B., Laus, M. J., & Coli, W. M. (2005). Farm food
safety practices: A survey of New England growers. Food protection trends. 25(5), 363-
370.
Creswell, J. W., & Miller, D. L. (2000). Determining validity in qualitative inquiry. Theory into
Practice, 39(3), 124-130. doi:http://dx.doi.org/10.1207/s15430421tip3903_2

142
Critzer, F. & Wszelaki, A. (n.d.). Good Agricultural Practices Series. Good Agricultural
Practices (GAP) certification in Tennessee (SP746-B). Retrieved from University of
Tennessee, University Tennessee Extension website:
https://utextension.tennessee.edu/publications/Documents/SP746-B.pdf
Delazari, I., Riemann, H. P., & Hajmeer, M. (2006). Food safety. In H. P. Reimann & D. O.
Cliver (Eds.), Foodborne Infections and Intoxications (pp. 833-877). Retrieved from
http://www.123foodscience.com/food_microbiology/Food_safety.pdf
Denzin, N. K. (1978). Sociological methods: A sourcebook. McGraw-Hill Companies.
DeWaal, C. S. & K. Barlow. (2004). Outbreak Alert! Retrieved from Center for Science in the
Public Interest website: https://cspinet.org/resource/outbreak-alert-2004
Dillman, D. A. (1991). The design and administration of mail surveys. Annual Review of
Sociology, 17, 225-249. Retrieved from http://www.jstor.org/stable/2083342
Eggers, S., Ackerlund, S., Thorne, S., & Butte, G. (2010, June). Report on growers'
understanding and implementation of FDA's GAPS guidance. Retrieved from
http://www.fda.gov/Food/FoodborneIllnessContaminants/BuyStoreServeSafeFood/ucm2
18562.htm
Ellis, J. D., Strohbehn, C. H., & Henroid Jr, D. H. (2005). Assessing on-farm food handling
practices of Iowa-grown produce and eggs in regard to food safety. Food Protection
Trends, 25, 758–761.
Fisher, N., Bourne, A., & Plunkett, J. M. (2015). Outbreak Alert! 2015. Retrieved from Center
for Science in the Public Interest website:
https://cspinet.org/file/5854/download?token=RU8OAC6m

143
Food and Agriculture Organization of the United Nations. (2003). Development of a framework
for Good Agricultural Practices (COAG/2003/6). Retrieved from
http://www.fao.org/docrep/meeting/006/y8704e.htm#P53_14805
Food and Agriculture Organization of the United Nations. (2008). Good Agricultural Practices.
Retrieved from http://www.fao.org/prods/gap/
Fulponi, L. (2006). Private voluntary standards in the food system: The perspective of major
food retailers in OECD countries. Food policy, 31(1), 1-13.
doi:http://dx.doi.org/10.1016/j.foodpol.2005.06.006
Gilling, S. J., Taylor, E. A., Kane, K., & Taylor, J. Z. (2001). Successful hazard analysis critical
control point implementation in the United Kingdom: Understanding the barriers through
the use of a behavioral adherence model. Journal of Food Prot., 64(5), 710-715. Retrived
from http://www.ingentaconnect.com/content/iafp/jfp/
Gombas, E. D. (2010, August/September). Produce GAP standards: Harmonizing food safety.
Foodsafety Magazine. Retrieved from http://www.foodsafetymagazine.com/magazine-
archive1/augustseptember-2010/
Gombas, E. D. (2013, June/July). Produce GAPs Harmonization: The goal is in sight. Foodsafety
Magazine. Retrieved from http://www.foodsafetymagazine.com/magazine-
archive1/junejuly-2013/
Gorny. J. (n.d.). FSMA & food safety marketplace requirements: What’s next? [PDF document].
Retrieved from http://www.nasda.org/File.aspx?id=38009

144
Gravani, R. B. (2009). The role of good agricultural practices in produce safety. In X. Fan, B. A.
Niemira, C. J. Doona, F. E. Feeherry, & R. B. Gravani (Eds.), Microbial safety of fresh
produce (pp. 101-117). doi:10.1002/9781444319347.ch5
Griffith, C. J., Livesey, K. M., & Clayton, D. A. (2010). Food safety culture: the evolution of an
emerging risk factor? British Food Journal, 112(4), 426-438.
doi:http://dx.doi.org/10.1108/00070701011034439
Griffith, C. J., Mullan, B., & Price, P. E. (1995). Food safety: Implications for food, medical and
behavioural scientists. British Food Journal, 97(8), 23-28.
doi:http://dx.doi.org/10.1108/00070709510100082
Hajmeer & Crozier-Dodson. (2012). Safety of produce. In O. A. Oyarzabal & S. Backert (Eds.),
Microbial Food Safety: An introduction (pp. 95-107). doi:10.1007/978-1-4614-1177-2_7
Hamilton, K. E., Umber, J., Hultberg, A., Tong, C., Schermann, M., Diez-Gonzalez, F., &
Bender, J. B. (2015). Validation of Good Agricultural Practices (GAP) on Minnesota
vegetable farms. Foodborne Pathogens and Disease, 12(2), 145-150.
doi:10.1089/fpd.2014.1817
Hammoudi, A., Hoffmann, R., & Surry, Y. (2009). Food safety standards and agri-food supply
chains: An introductory overview. European Review of Agricultural Economics, 36(4),
469-478. doi:10.1093/erae/jbp044
Hardesty, S. D., & Kusunose, Y. (2009). Growers’ compliance costs for the leafy greens
marketing agreement and other food safety programs. UC small farm program brief, ANR
University of California. Retrieved from http://www.ucanr.org/sites/sfp/files/143911.pdf
145
Harmonized food safety standards revised for produce field operations and harvesting. (2013,
August 9). Food Safety Magazine. Retrieved from
http://www.foodsafetymagazine.com/news/harmonized-food-safety-standards-revised-
for-produce-field-operations-and-harvesting/
Harrison, J. A., Gaskin, J. W., Harrison, M. A., Cannon, J. L., Boyer, R. R., & Zehnder, G. W.
(2013). Survey of food safety practices on small to medium-sized farms and in farmers
markets. Journal of Food Protection, 76(11). doi: http://dx.doi.org/10.4315/0362-
028X.JFP-13-158
Harwood, J. (2000). Risk assessment and decision analysis in conservation. Biological
Conservation, 95(2), 219-226. doi:10.1016/S0006-3207(00)00036-7
Havelaar, A. H., Bräunig, J., Christiansen, K., Cornu, M., Hald, T., Mangen, M. J., ... &
Velthuis, A. (2007). Towards an integrated approach in supporting microbiological food
safety decisions. Zoonoses and Public Health, 54(3‐4), 103-117. doi:10.1111/j.1863-
2378.2007.01036.x
Havinga, T. (2006). Private regulation of food safety by supermarkets. Law & Policy, 28(4), 515-
533. doi: 10.1111/j.1467-9930.2006.00237.x
Hilborn, E.D, Mermin, J.H, Mshar, P.A., Hadler, J.L., Voetsch, A., Wojtkunski, C.,… Slutsker.
L. (1999). A multistate outbreak of Escherichia coli O157:H7 infections associated with
consumption of mesclun lettuce. Arch Intern Med.,159(15), 1758-1764.
doi:10.1001/archinte.159.15.1758.
Ho, D. E. (2016). Does peer review work? An experiment of experimentalism. Stanford Law
Review, 69. Retrieved from https://papers.ssrn.com/sol3/papers.cfm?abstract_id=2785927
146
Hultberg, A., Schermann, M., & Tong, C. (2012). Results from a mail survey to assess
Minnesota vegetable growers’ adherence to Good Agricultural Practices.
HortTechnology, 22(1), 83-88. Retrieved from
http://horttech.ashspublications.org/content/22/1/83.full
Hussein, A. (2009). The use of triangulation in social sciences research: Can qualitative and
quantitative methods be combined? Journal of Comparative Social Work, 4(1). Retrieved
from http://journal.uia.no/index.php/JCSW/article/viewFile/212/147
Isin, S., & Yildirim, I. (2007). Fruit-growers’ perceptions on the harmful effects of pesticides and
their reflection on practices: The case of Kemalpasa, Turkey. Crop Protection, 26(7),
917-922. doi:http://dx.doi.org/10.1016/j.cropro.2006.08.006
Jackson, C., Larcher, D., Goodrich-Schneider, R., Gravani, R. B., Bihn, E. A., & Schneider, K.
R. (2007). Determining the effect of Good Agricultural Practices awareness on
implementation: A multi-state survey. Food Protection Trends, 27(9), 684-693.
Jahn, G., Schramm, M., & Spiller, A. (2004, February). The quality of audits-a comparative
study of auditing and certification schemes in the food sector. Paper presented at the 84th
EAAE Seminar, Zeist.
Jann, W., & Wegrich, K. (2007). Theories of the policy cycle. In F. Fischer, G. J. Miller, & M. S.
Sidney (Eds.), Handbook of public policy analysis: Theory, politics, and methods (pp. 43-
62). Boca Raton: CRC Press.
Kaplan, S., & Garrick, B. J. (1981). On the quantitative definition of risk. Risk Analysis, 1(1), 11-
27. doi:10.1111/j.1539-6924.1981.tb01350.x

147
Karaman, A. D., Cobanoglu, F., Tunalioglu, R., & Ova, G. (2012). Barriers and benefits of the
implementation of food safety management systems among the Turkish dairy industry: A
case study. Food Control, 25(2), 732-739. doi:10.1016/j.foodcont.2011.11.041
Keraita, B., Drechsel, P., & Konradsen, F. (2008). Perceptions of farmers on health risks and risk
reduction measures in wastewater‐irrigated urban vegetable farming in Ghana. Journal of
Risk Research, 11(8), 1047-1061. doi:http://dx.doi.org/10.1080/13669870802380825
Koch, R. (n.d.). Audit fatigue. Retrieved from http://www.usappleleaf.com/docs/auditfatigue.pdf
Korslund, K. (2014). Food safety plans: Opportunities and barriers for small MN fruit and
vegetable producers (Professional paper). Hubert H. Humphrey School of Public Affairs,
Minneapolis. Retrieved from: http://conservancy.umn.edu/handle/11299/164847
LaBorder, L. (2011). HACCP and HACCP-Based programs for controlling food safety hazards
in the vegetable industry. In N. K. Sinha (Ed.), Handbook of vegetable preocessing.
Blackwell Publishing Ltd.
Lammerding, A. M., & Fazil, A. (2000). Hazard identification and exposure assessment for
microbial food safety risk assessment. International Journal of Food Microbiology,
58(3), 147-157. doi:http://dx.doi.org/10.1016/S0168-1605(00)00269-5
León, J. S., Jaykus, L. A., & Moe, C. L. (2008). Food safety issues and the microbiology of fruits
and vegetables. In N. Heredia, I. Wesley, & S. Gracia (Eds.), Microbiologically Safe
Foods (pp. 255-281). doi:10.1002/9780470439074.ch12
Lewis Ivey, M.L., LeJeune, J.T., and Miller, S.A. (2012). Vegetable producers’ perceptions of
food safety hazards in the Midwestern USA. Food Control, 26(2), 453-465.
doi:http://dx.doi.org/10.1016/j.foodcont.2012.01.065
148
Lichtenberg, E., & Page, E. T. (2016). Prevalence and cost of on-farm produce safety measures
in the Mid-Atlantic. Food Control, 69, 315-323.
doi:http://dx.doi.org/10.1016/j.foodcont.2016.04.054
Lynch, M. F., Tauxe, R. V., & Hedberg, C. W. (2009). The growing burden of foodborne
outbreaks due to contaminated fresh produce: Risks and opportunities. Epidemiology and
Infection, 137(03), 307-315. doi:http://dx.doi.org/10.1017/S0950268808001969
Mahmoud, B. S. M, Stafne, E. T., Coker, C. H., Bachman, G. R., & Bell, N. (2016).
Implementing good practices programs to encourage production of high-quality, safer
produce in Mississippi. Journal of Extension, 54(4), Article 4IAW5. Retrieved from
https://joe.org/joe/2016august/iw5.php
Marine, S. C., Martin, D. A., Adalja, A., Mathew, S., & Everts, K. L. (2016). Effect of market
channel, farm scale, and years in production on mid-Atlantic vegetable producers'
knowledge and implementation of Good Agricultural Practices. Food Control, 59, 128-
138. doi:http://dx.doi.org/10.1016/j.foodcont.2015.05.024
Mortimore, S., & Wallace, C. (2013). HACCP: A practical approach. doi:10.1007/978-1-4614-
5028-3
Nayak, R. K., Tobin, D., Thomson, J. S., Radhakrishna, R., & Laborde, L. (2013, December).
Produce growers’ challenges in implementing Good Agricultural Practices. Paper
presented at INSEE Conference, Bangalore.

149
Nayak, R. K., Tobin, D., Thomson, J. S., Radhakrishna, R., & Laborde, L. (2015). Evaluation of
on-farm food safety programming in Pennsylvania: Implications for Extension. Journal
of Extension, 53 (1). Article 1FEA9. Retrieved from
http://www.joe.org/joe/2015february/a9.php
Notermans, S., Gallhoff, G., Zwietering, M. H., & Mead, G. C. (1995). The HACCP concept:
Specification of criteria using quantitative risk assessment. Food Microbiology, 12, 81-
90.
Nunnally, J. C. (1978). Psychometric theory (2nd ed.). New York: McGraw-Hill.
Olsen, W. (2004). Triangulation in social research: Qualitative and quantitative methods can
really be mixed. In K. Holborn & U. Haralambos (Eds.), Developments in sociology.
United Kingdom: Causeway Press.
Panisello, P. J., & Quantick, P. C. (2001). Technical barriers to Hazard Analysis Critical Control
Point (HACCP). Food Control, 12(3), 165-173. doi:http://dx.doi.org/10.1016/S0956-
7135(00)00035-9
Pennings, J. M., Irwin, S. H., & Good, D. L. (2002). Surveying farmers: A case study. Appl.
Econ. Perspect. Pol., 24(1), 266-277. doi:10.1111/1467-9353.00096
Petersen, K. S. (2009). Third-party audit programs for the fresh-produce industry. In X. Fan, B.
A. Niemira, C. J. Doona, F. E. Feeherry, & R. B. Gravani (Eds.), Microbial safety of
fresh produce (pp. 321-329). doi:10.1002/9781444319347.ch17
Petersen, K. S. (2015, March). Harmonization of audit. Retrieved from
https://www.ams.usda.gov/sites/default/files/media/FVIAC%20Meeting%20March%202
015-Ken%20Petersen.pdf

150
Petrzelka, P., Korsching, P. F., & Malia, J. E. (1996). Farmers' attitudes and behavior toward
sustainable agriculture. The Journal of Environmental Education, 28(1), 38-44.
doi:10.1080/00958964.1996.9942814
Pollack, S. L. (2001). Consumer demand for fruit and vegetables: The US example. In A. Regmi
(Ed.), Changing structure of global food consumption and trade, (pp. 49-54). Washington
DC.
Powell, D. A., Jacob, C. J., & Chapman, B. J. (2011). Enhancing food safety culture to reduce
rates of foodborne illness. Food Control, 22(6), 817-822.
doi:10.1016/j.foodcont.2010.12.009
Rangarajan, A., Pritts, M. P., Reiners, S., & Pedersen, L. H. (2002). Focusing food safety
training based on current grower practices and farm scale. HortTechnology, 12(1), 126-
131.
Rejesus, R. (2009). Good Agricultural Practices: GAP certification: is it worth It? (North
Carolina Cooperative Extension Publicatiion No. AG-709). Retrieved from
http://www4.ncsu.edu/~rmrejesu/Food_Safety_Risk/ag-709%20final%20printed.pdf
Roland, S. (2015). Food Safety Modernization Act's Produce Rules: Is the increased flexibility
actually a burden on the farmer. Drake J. Agric. L. 20(3), 437-452. Retrived from
http://heinonline.org/
Sapers, G. M. (2001). Efficacy of washing and sanitizing methods for disinfection of fresh fruit
and vegetable products. Food Technol. Biotechnol., 39(4), 305-311. Retrived from
http://www.ftb.com.hr/images/pdfarticles/2001/October-December/39-305.pdf
151
Shaw, A., Strohbehn, C., Naeve, L., Domoto, L., & Wilson, L. (2015). Knowledge gained from
Good Agricultural Practices courses for Iowa growers. Journal of Extension, 53 (5),
Article 5RIB3. Retrieved from https://joe.org/joe/2015october/rb3.php
Tauxe, R. V. (2002). Emerging foodborne pathogens. International Journal of Food
Microbiology, 78(1-2), 31-41. doi:http://dx.doi.org/10.1016/S0168-1605(02)00232-5
Tobin, D., Thomson, J., LaBorde, L., & Bagdonis, J. (2011). Developing GAP training for
growers: Perspectives from Pennsylvania supermarkets. Journal of Extension, 49(5),
Article 5RIB7. Retrieved from https://joe.org/joe/2011october/pdf/JOE_v49_5rb7.pdf
Tobin, D., Thomson, J., LaBorde, L., & Radhakrishna, R. (2013). Factors affecting growers' on-
farm food safety practices: Evaluation findings from Penn State Extension programming.
Food Control, 33(1), 73-80. doi:http://dx.doi.org/10.1016/j.foodcont.2013.02.015
Tucker, M., & Napier, T. L. (1998). Perceptions of risk associated with use of farm chemicals:
implications for conservation initiatives. Environmental Management, 22(4), 575-587.
doi:http://dx.doi.org/10.1007/s002679900129
USDA (2011, April). Good Agricultural Practices and Good Handling Practices audit
verification program: User’s guide. Retrieved from
https://www.ams.usda.gov/sites/default/files/media/GAP-GHP-Audit-Users-Guide.pdf
USDA. (2013, May). Field operations and harvesting harmonized food safety standard.
Retrieved from https://www.ams.usda.gov/sites/default/files/media/GAP-GHP-
FieldHarvesting-Harmonized-Food-Safety.pdf
USDA. (2016). Companies that meet USDA GAP&GHP acceptance criteria. Retrieved from
https://apps.ams.usda.gov/GAPGHP/reportG01.aspx

152
United States Food and Drug Administration. (1998). Guidance for industry: guide to minimize
microbial food safety hazards for fresh fruits and vegetables. Retrieved from Food and
Drug Administration website:
http://www.fda.gov/downloads/Food/GuidanceRegulation/UCM169112.pdf
United States Food and Drug Administration. (2008). Guide to minimize microbial food safety
hazards of fresh cut fruits and vegetables. Retrieved from Food and Drug Administration
website:
http://www.fda.gov/Food/GuidanceRegulation/GuidanceDocumentsRegulatoryInformati
on/ProducePlantProducts/ucm064458.htm
van Tongeren, F. (2008). Agricultural policy design and implementation: A synthesis (OECD
Food, Agriculture and Fisheries Papers No. 7). Paris: OECD Publishing.
Vilsack, T. (2016, July 5). Safer food and greater consumer confidence. Retrived from
https://medium.com/usda-results/ch7-a940f28456a9#.soo565973
Wachtel, M. R., Whitehand, L. C., & Mandrell, R. E. (2002). Prevalence of Escherichia coli
associated with a cabbage crop inadvertently irrigated with partially treated sewage
wastewater. Journal of Food Protection, 65(3), 471-475. Retrieved from
http://www.ingentaconnect.com/content/iafp/jfp
Woods, M., & Thornsbury, S. (2005). Costs of adopting Good Agricultural Practices (GAPs) to
ensure food safety in fresh strawberries (Agricultural Economics Report No. 624). East
Lansing, MI: Michigan State University.
World Health Organization. (2014). Regional food safety strategy (SEA-NUT-186). Retrieved
from www.searo.who.int/entity/foodsafety/regional-food-strategy.pdf

153
World Health Organization. (2015). WHO estimates of the global burden of foodborne diseases:
Foodborne disease burden epidemiology reference group 2007-2015. Retrieved from
http://apps.who.int/iris/bitstream/10665/199350/1/9789241565165_eng.pdf
Yang, Y. T., & Swinburne, M. (2016). New produce safety regulations: Promises and challenges.
Public Health Reports, 10, 1-4. doi:10.1177/0033354916669495
Yiannas, F. (2009). Food Safety culture: Creating a behavior-based food safety management
system. 10.1007/978-0-387-72867-4
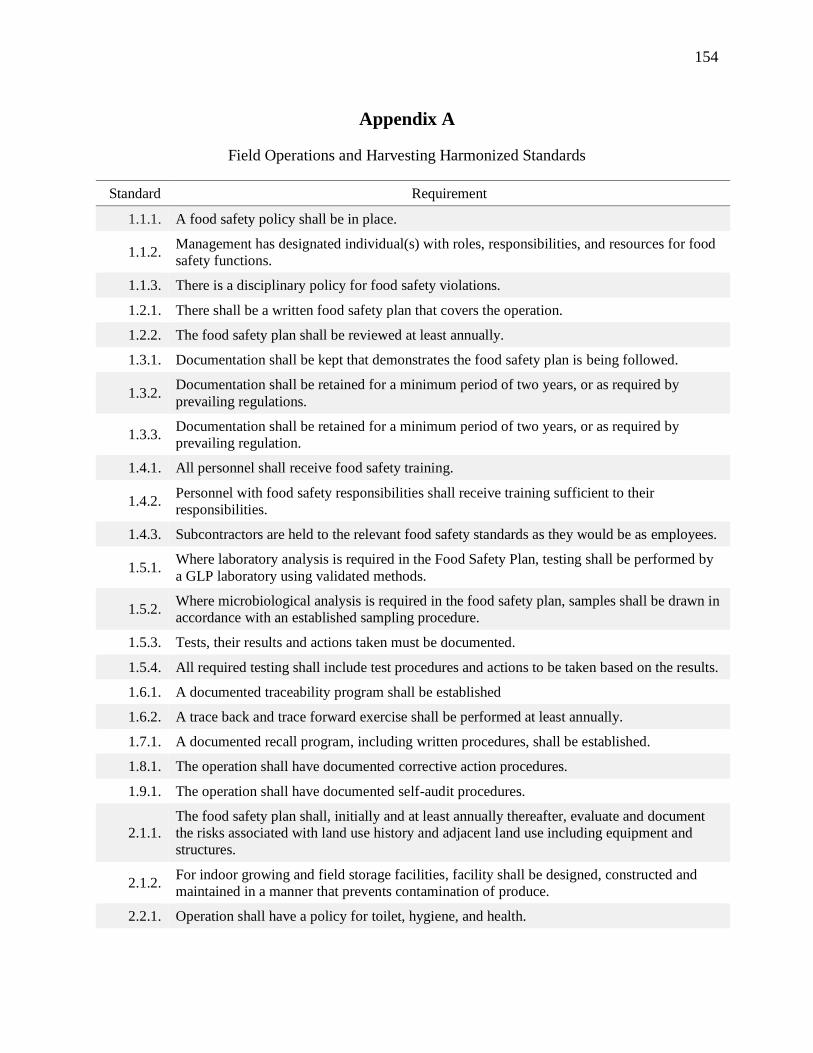
154
Appendix A
Field Operations and Harvesting Harmonized Standards
Standard Requirement
1.1.1. A food safety policy shall be in place.
1.1.2. Management has designated individual(s) with roles, responsibilities, and resources for food
safety functions.
1.1.3. There is a disciplinary policy for food safety violations.
1.2.1. There shall be a written food safety plan that covers the operation.
1.2.2. The food safety plan shall be reviewed at least annually.
1.3.1. Documentation shall be kept that demonstrates the food safety plan is being followed.
1.3.2. Documentation shall be retained for a minimum period of two years, or as required by
prevailing regulations.
1.3.3. Documentation shall be retained for a minimum period of two years, or as required by
prevailing regulation.
1.4.1. All personnel shall receive food safety training.
1.4.2. Personnel with food safety responsibilities shall receive training sufficient to their
responsibilities.
1.4.3. Subcontractors are held to the relevant food safety standards as they would be as employees.
1.5.1. Where laboratory analysis is required in the Food Safety Plan, testing shall be performed by
a GLP laboratory using validated methods.
1.5.2. Where microbiological analysis is required in the food safety plan, samples shall be drawn in
accordance with an established sampling procedure.
1.5.3. Tests, their results and actions taken must be documented.
1.5.4. All required testing shall include test procedures and actions to be taken based on the results.
1.6.1. A documented traceability program shall be established
1.6.2. A trace back and trace forward exercise shall be performed at least annually.
1.7.1. A documented recall program, including written procedures, shall be established.
1.8.1. The operation shall have documented corrective action procedures.
1.9.1. The operation shall have documented self-audit procedures.
2.1.1.
The food safety plan shall, initially and at least annually thereafter, evaluate and document
the risks associated with land use history and adjacent land use including equipment and
structures.
2.1.2. For indoor growing and field storage facilities, facility shall be designed, constructed and
maintained in a manner that prevents contamination of produce.
2.2.1. Operation shall have a policy for toilet, hygiene, and health.

155
2.2.2. Employees and visitors shall follow all personal hygiene practices as designated by the
operation.
2.2.3.
Toilet facilities shall be designed, constructed, and located in a manner
that minimizes the potential risk for product contamination and are directly
accessible for servicing.
2.2.4. Toilet facilities shall be of adequate number, easily accessible to employees and in
compliance with applicable regulation.
2.2.5. Toilet and wash stations shall be maintained in a clean and sanitary condition.
2.2.6. Personnel shall wash their hands at any time when their hands may be a source of
contamination.
2.2.7. Signage requiring handwashing is posted.
2.2.8. Clothing, including footwear, shall be effectively maintained and worn so as to protect
product from risk of contamination.
2.2.9. If gloves are used, the operation shall have a glove use policy.
2.2.10. Protective clothing, when required, shall be maintained, stored, laundered and worn so as to
protect product from risk of contamination.
2.2.11. When appropriate, racks and/or storage containers or designated storage area for protective
clothing and tools used by field employees shall be provided.
2.2.12. The wearing of jewelry, body piercings and other loose objects (e.g. false nails) shall be in
compliance to company policy and applicable regulation.
2.2.13. The use of hair coverings shall be in compliance to company policy and applicable
regulation.
2.2.14. Employees' personal belongings shall be stored in designated areas.
2.2.15. Smoking, chewing, eating, drinking (other than water), urinating, defecating or spitting is not
permitted in any growing areas.
2.2.16. Operation shall have a written policy that break areas are located so as to not be a source of
product contamination.
2.2.17. Drinking water shall be available to all field employees.
2.2.18. Workers and field personnel who show signs of illness shall be restricted from direct contact
with produce or food-contact surfaces.
2.2.19. Personnel with exposed cuts, sores or lesions shall not be engaged in handling product.
2.2.20. Operation shall have a blood and bodily fluids policy.
2.2.21. First Aid Kits shall be accessible to all personnel.
2.3.1. Use of agricultural chemicals shall comply with label directions and prevailing regulation.
2.3.2. If product is intended for export, agricultural chemical use, including postharvest chemicals,
shall consider requirements in the intended country of destination.
2.3.3. Agricultural chemicals shall be applied by trained, licensed or certified application
personnel, as required by prevailing regulation.

156
2.3.4. Water used with agricultural chemicals shall not be a source of product or field
contamination.
2.3.5. Agricultural chemical disposal shall not be a source of product or field contamination.
2.4.1.1. A water system description shall be available for review.
2.4.1.2. The water source shall be in compliance with prevailing regulations.
2.4.1.3. Agricultural water systems shall not be cross-connected with human or animal waste
systems.
2.4.2.1.
An initial risk assessment shall be performed and documented that takes into consideration
the historical testing results of the water source, the characteristics of the crop, the stage of
the crop, and the method of application.
2.4.3.1. There shall be a water management plan to mitigate risks associated with the water system
on an ongoing basis.
2.4.3.2.
Water testing shall be part of the water management plan, as directed by the water risk
assessment and current industry standards or prevailing regulations for the commodities
being grown.
2.4.3.3. The testing program shall be implemented consistent with the water management plan.
2.5.1. The operation has a written risk assessment on animal activity in and around the production
area.
2.5.2. The operation routinely monitors for animal activity in and around the growing area during
the growing season.
2.5.3. Based on the risk assessment, there shall be measures to prevent or minimize the potential
for contamination from animals, including domestic animals used in farming operations.
2.6.1. The food safety plan shall address soil amendment risk, preparation, use, and storage.
2.6.2. If a soil amendment containing raw or incompletely treated manure is used, it shall be used
in a manner so as not to serve as a source of contamination of produce.
2.7.1. Equipment, vehicles, tools utensils and other items or materials used in farming operations
that may contact produce are identified.
2.7.2. Equipment, vehicles, tools and utensils used in farming operations which come into contact
with product are in good repair, and are not a source of contamination of produce.
2.7.3. Vehicles, equipment, tools and utensils shall be controlled so as not to be a source of
chemical hazards.
2.7.4. Vehicles, equipment, tools and utensils shall be controlled so as not to be a source of
physical hazards.
2.7.5. Cleaning and sanitizing procedures do not pose a risk of product contamination.
2.7.6. Water tanks are cleaned at a sufficient frequency so as not to be a source of contamination.
3.1.1. A pre-harvest risk assessment shall be performed.
3.2.1. Operation has procedures for water used in contact with product or food contact surfaces.
3.2.2. Water use SOPs address the microbial quality of water or ice that directly contacts the
harvested crop or is used on food-contact surfaces.

157
3.2.3. Water use SOPs address treatment of re-circulated water, if used.
3.2.4. Water use SOPs address condition and maintenance of water-delivery system.
3.2.5. If applicable to the specific commodity, water use SOPs address control of wash water
temperature.
3.3.1. Operation has written policy regarding storage of harvesting containers.
3.3.2. Operation has written policy regarding inspection of food contact containers prior to use.
3.3.3. Operation has written policy regarding acceptable harvesting containers.
3.3.4. Operation has written policy prohibiting use of harvest containers for non-harvest purposes.
3.4.1. Operation shall have a written policy that damaged or decayed produce is not harvested, or is
culled.
3.4.2. Product that contacts the ground shall not be harvested unless the product normally grows in
contact with the ground.
3.4.3. Harvest procedures shall include measures to inspect for and remove physical hazards.
3.4.4. Cloths, towels, or other cleaning materials that pose a risk of cross-contamination shall not
be used to wipe produce.
3.4.5. Packaging materials shall be appropriate for their intended use.
3.4.6. Packaging shall be stored in a manner that prevents contamination.
3.4.7. Operation has written policy regarding whether packing materials are permitted in direct
contact with the soil.
3.5.1. Harvested produce is handled in a manner such that it is not likely to become contaminated.
3.5.2. Materials that come in contact with the produce shall be clean and in good repair.
3.5.3. Harvested produce shall be stored separately from chemicals which may pose a food safety
hazard.
4.1.1. The operation shall have a policy, written procedures, and a checklist to verify cleanliness
and functionality of shipping units (e.g., trailer).
4.1.2. Loading/unloading procedures and equipment shall minimize damage to and prevent
contamination of produce.
4.1.3. Trash shall not come in contact with produce.

158
Appendix B
Overall Count Tables for PA, DE, MD, NJ and NY
State 1.1.1. 1.1.2. 1.1.3. 1.2.1. 1.2.2. 1.3.1 1.3.2. 1.4.1. 1.4.2. 1.4.3. 1.5.1. 1.5.2. 1.5.4. 1.6.1. 1.6.2. 1.7.1. 1.8.1. 1.9.1.
PA 0 0 0 0 0 0 0 0 0 1 0 0 0 0 0 0 1 2
DE 1 1 0 1 0 1 1 1 1 2 0 2 2 0 0 0 0 0
MD 0 0 0 0 1 0 0 0 0 0 0 0 0 0 1 0 3 0
NJ 0 0 0 0 0 1 0 2 1 24 1 2 6 2 2 2 2 2
NY 0 0 2 0 1 0 0 3 0 4 0 1 0 0 0 0 1 1
Total 1 1 2 1 2 2 1 6 2 31 1 5 8 2 3 2 7 5
State 2.1.1. 2.2.2 2.2.4 2.2.5 2.2.6 2.2.7 2.2.8 2.2.9 2.2.10 2.2.11 2.2.12 2.2.13 2.2.14 2.2.15 2.2.16 2.2.17 2.2.21
PA 0 0 0 0 0 0 0 0 0 0 0 0 0 1 0 0 1
DE 0 2 0 0 2 0 0 2 3 3 1 0 2 2 1 0 1
MD 0 0 1 0 0 0 0 0 0 0 0 0 0 1 0 0 1
NJ 2 1 0 1 1 1 1 9 0 1 2 0 3 1 1 1 2
NY 0 0 0 3 0 2 0 1 0 0 1 3 0 0 0 1 0
Total 2 3 1 4 3 3 1 12 3 4 4 3 5 5 2 2 5
State 2.3.3 2.3.4 2.3.5 2.4.1.1 2.4.1.2 2.4.1.3 2.4.2.1 2.4.3.1 2.4.3.2 2.4.3.3 2.5.1 2.5.2 2.6.1 2.6.2 2.7.1 2.7.2 2.7.3 2.7.4 2.7.5 2.7.6
PA 1 0 0 2 0 1 0 1 0 0 0 0 0 0 0 3 0 0 0 0
DE 0 0 1 0 0 0 1 1 1 1 1 2 1 1 2 1 1 2 0 2
MD 0 0 0 0 0 0 0 0 2 0 0 0 0 0 0 1 0 2 0 0
NJ 0 1 0 0 0 0 2 1 2 3 0 2 0 0 4 4 3 1 3 2
NY 0 2 0 1 1 0 1 0 1 1 0 1 0 1 3 2 0 0 0 2
Total 1 3 1 3 1 1 4 3 6 5 1 5 1 2 9 11 4 5 3 6
State 3.1.1. 3.2.5. 3.3.1. 3.3.3. 3.3.4. 3.4.1. 3.4.2. 3.4.3. 3.4.4. 3.4.6. 3.4.7. 3.5.1. 3.5.2. 4.1.1. 4.1.3.
PA 0 1 0 0 1 0 0 0 0 0 0 0 0 1 0
DE 0 0 1 0 0 0 0 0 1 1 1 0 0 1 1
MD 0 0 0 0 0 1 1 1 0 0 0 0 0 1 0
NJ 0 0 3 1 0 1 1 0 1 0 1 2 1 5 2
NY 1 0 2 1 0 2 0 0 2 0 2 1 0 5 0
Total 1 1 6 2 1 4 2 1 4 1 4 3 1 13 3

159
Appendix C
H0: There were no statistical differences in proportions of growers in Pennsylvania and New Jersey who rated
food safety standards as moderately to very challenging.
Table 4.21
Proportional Differences for Most Challenging Food Safety Standards for Growers of PA and NJ
Most Challenging Standards Pennsylvania
New
Jersey
Prop.
Difference z Score p
Value n1𝜋1 n1 n2𝜋2 n2 𝜋1- 𝜋2
Writing a food safety plan 20 49 12 17 -0.298 -2.12* 0.034
Keeping records for a food safety
plan 23 53 10 17 -0.154 -1.11 0.267
Writing and implementing a
water management plan 19 48 7 16 -0.042 -0.29 0.772
Documentation to assure that
sub-contractors’ compliance 11 27 6 16 0.032 0.21 0.834
Writing a risk assessment on
domestic and wild animal activity 22 52 5 17 0.129 0.95 0.342
Writing and implementing
policies and procedures in plan,
such as use of gloves
16 49 6 17 -0.085 -0.64 0.522
Documenting and carrying out a
trace back and forward exercise 20 51 4a 16 0.142 1.03 0.303
Routinely monitoring of animal
activity 17 52 3a 16 0.139 1.07 0.285
Documenting corrective actions 18 51 4a 16 0.103 0.77 0.447
Writing procedures for water
testing 15 50 5 16 -0.012 -0.10 0.928
Making sure that employees
follow hygienic practices 12 53 7 17 -0.186 -1.50 0.134
Conducting a water system risk
assessment 14 49 5 16 -0.026 -0.20 0.841
Writing a policy identifying and
controlling potential food safety
hazards during harvesting 11 48 7 16 -0.209 -1.61 0.107
Note. *p<.05;
𝑛𝜋 = The number participants indicated the standard is moderately or very challenging; a𝑛𝜋<5
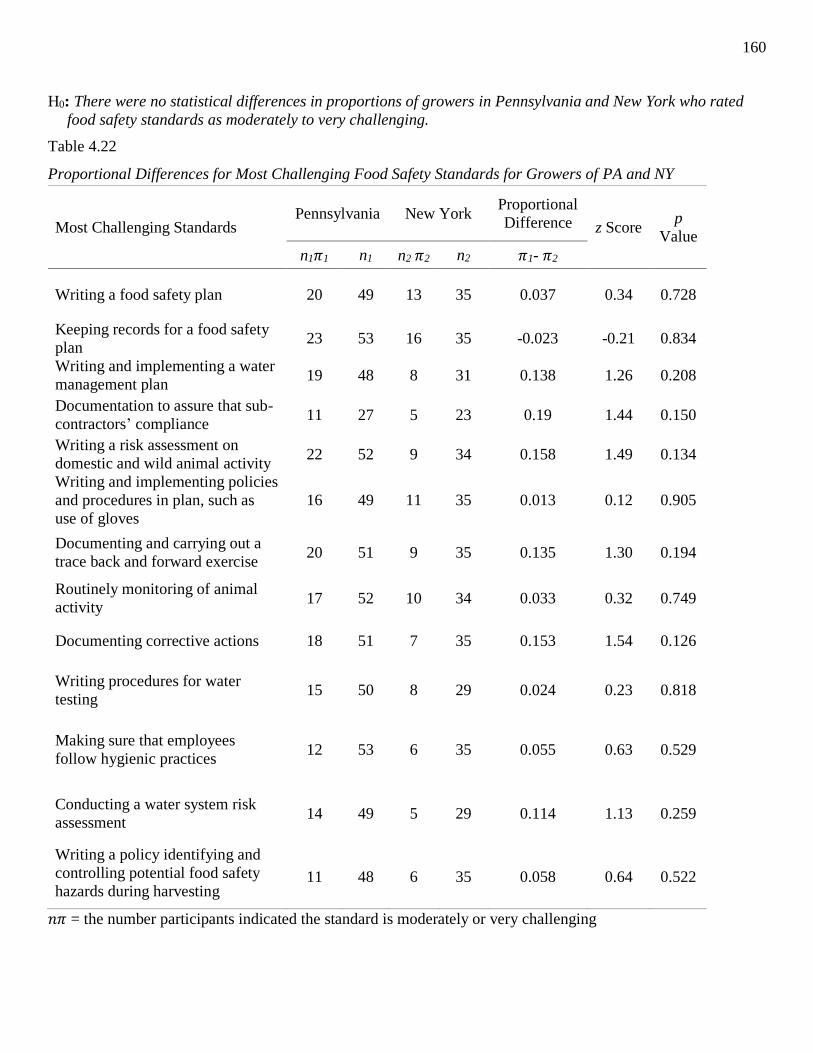
160
H0: There were no statistical differences in proportions of growers in Pennsylvania and New York who rated
food safety standards as moderately to very challenging.
Table 4.22
Proportional Differences for Most Challenging Food Safety Standards for Growers of PA and NY
Most Challenging Standards Pennsylvania New York
Proportional
Difference z Score p
Value
n1𝜋1 n1 n2 𝜋2 n2 𝜋1- 𝜋2
Writing a food safety plan 20 49 13 35 0.037 0.34 0.728
Keeping records for a food safety
plan 23 53 16 35 -0.023 -0.21 0.834
Writing and implementing a water
management plan 19 48 8 31 0.138 1.26 0.208
Documentation to assure that sub-
contractors’ compliance 11 27 5 23 0.19 1.44 0.150
Writing a risk assessment on
domestic and wild animal activity 22 52 9 34 0.158 1.49 0.134
Writing and implementing policies
and procedures in plan, such as
use of gloves
16 49 11 35 0.013 0.12 0.905
Documenting and carrying out a
trace back and forward exercise 20 51 9 35 0.135 1.30 0.194
Routinely monitoring of animal
activity 17 52 10 34 0.033 0.32 0.749
Documenting corrective actions 18 51 7 35 0.153 1.54 0.126
Writing procedures for water
testing 15 50 8 29 0.024 0.23 0.818
Making sure that employees
follow hygienic practices 12 53 6 35 0.055 0.63 0.529
Conducting a water system risk
assessment 14 49 5 29 0.114 1.13 0.259
Writing a policy identifying and
controlling potential food safety
hazards during harvesting 11 48 6 35 0.058 0.64 0.522
𝑛𝜋 = the number participants indicated the standard is moderately or very challenging
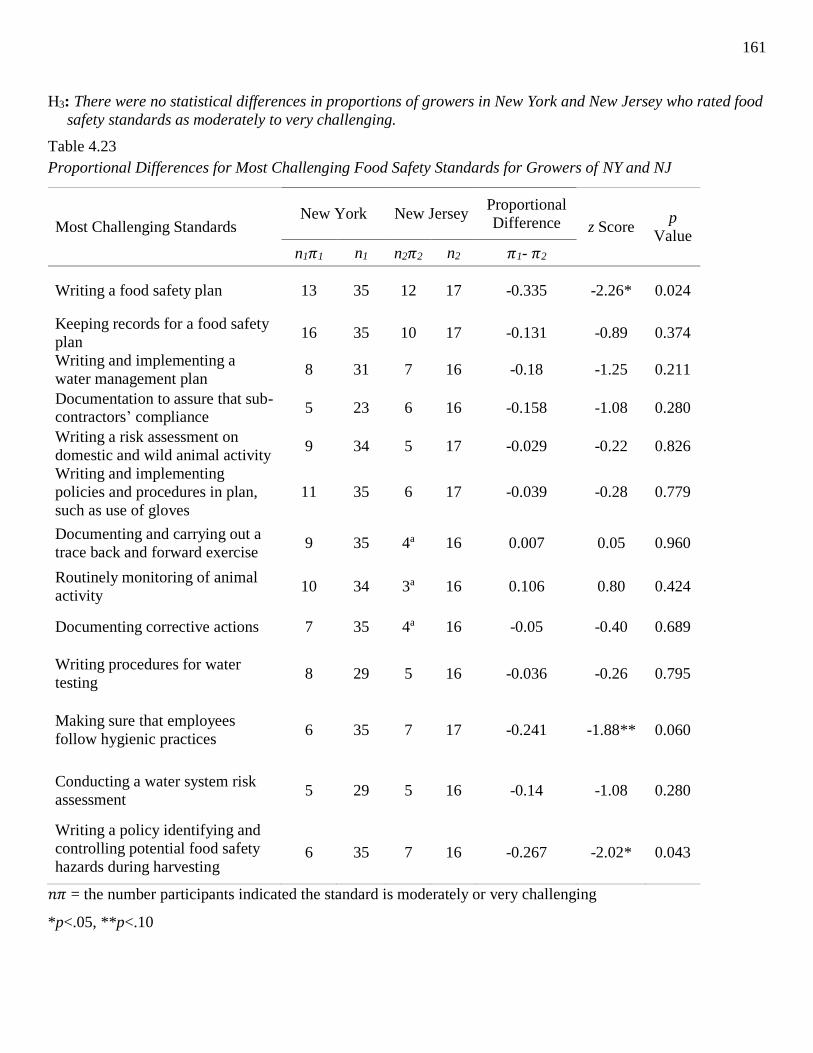
161
H3: There were no statistical differences in proportions of growers in New York and New Jersey who rated food
safety standards as moderately to very challenging.
Table 4.23
Proportional Differences for Most Challenging Food Safety Standards for Growers of NY and NJ
Most Challenging Standards New York New Jersey
Proportional
Difference z Score p
Value n1𝜋1 n1 n2𝜋2 n2 𝜋1- 𝜋2
Writing a food safety plan 13 35 12 17 -0.335 -2.26* 0.024
Keeping records for a food safety
plan 16 35 10 17 -0.131 -0.89 0.374
Writing and implementing a
water management plan 8 31 7 16 -0.18 -1.25 0.211
Documentation to assure that sub-contractors’ compliance
5 23 6 16 -0.158 -1.08 0.280
Writing a risk assessment on
domestic and wild animal activity 9 34 5 17 -0.029 -0.22 0.826
Writing and implementing
policies and procedures in plan,
such as use of gloves
11 35 6 17 -0.039 -0.28 0.779
Documenting and carrying out a
trace back and forward exercise 9 35 4a 16 0.007 0.05 0.960
Routinely monitoring of animal
activity 10 34 3a 16 0.106 0.80 0.424
Documenting corrective actions 7 35 4a 16 -0.05 -0.40 0.689
Writing procedures for water
testing 8 29 5 16 -0.036 -0.26 0.795
Making sure that employees
follow hygienic practices 6 35 7 17 -0.241 -1.88** 0.060
Conducting a water system risk
assessment 5 29 5 16 -0.14 -1.08 0.280
Writing a policy identifying and
controlling potential food safety
hazards during harvesting 6 35 7 16 -0.267 -2.02* 0.043
𝑛𝜋 = the number participants indicated the standard is moderately or very challenging
*p<.05, **p<.10
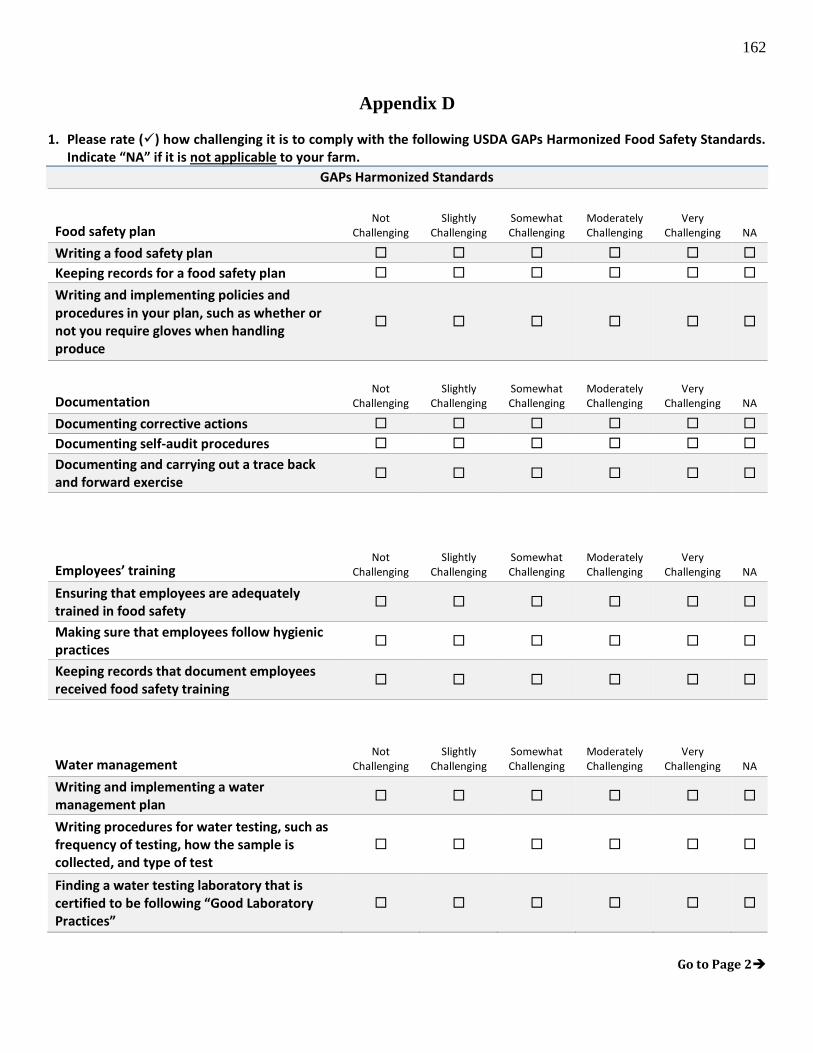
162
Appendix D
1. Please rate () how challenging it is to comply with the following USDA GAPs Harmonized Food Safety Standards. Indicate “NA” if it is not applicable to your farm.
GAPs Harmonized Standards
Food safety plan
Not
Challenging
Slightly
Challenging
Somewhat Challenging
Moderately Challenging
Very
Challenging NA
Writing a food safety plan
Keeping records for a food safety plan
Writing and implementing policies and procedures in your plan, such as whether or not you require gloves when handling produce
Documentation
Not
Challenging
Slightly
Challenging
Somewhat Challenging
Moderately Challenging
Very
Challenging NA
Documenting corrective actions
Documenting self-audit procedures
Documenting and carrying out a trace back and forward exercise
Employees’ training
Not
Challenging
Slightly
Challenging
Somewhat Challenging
Moderately Challenging
Very
Challenging NA
Ensuring that employees are adequately trained in food safety
Making sure that employees follow hygienic practices
Keeping records that document employees received food safety training
Water management
Not
Challenging
Slightly
Challenging
Somewhat Challenging
Moderately Challenging
Very
Challenging NA
Writing and implementing a water management plan
Writing procedures for water testing, such as frequency of testing, how the sample is collected, and type of test
Finding a water testing laboratory that is certified to be following “Good Laboratory Practices”
Go to Page 2

163
2. Please rate () how challenging it is to comply with the following USDA GAPs Harmonized Food Safety Standards. Indicate “NA” if it is not applicable to your farm.
GAPs Harmonized Standards
Cleaning procedures
Not
Challenging
Slightly
Challenging
Somewhat Challenging
Moderately Challenging
Very
Challenging NA
Keeping equipment, vehicle, tools and utensils in good repair
Using proper cleaning and sanitizing procedures
Having a disciplinary policy for any food safety violations
Harvesting policy
Not
Challenging
Slightly
Challenging
Somewhat Challenging
Moderately Challenging
Very
Challenging NA
Writing and implementing a policy regarding cleanliness of harvesting containers
Writing a policy regarding preventing non-root crop produce from contacting the ground after harvest
Writing a policy that identifies potential food safety hazards during harvesting and how you plan to control them
Transportation
Not
Challenging
Slightly
Challenging
Somewhat Challenging
Moderately Challenging
Very
Challenging NA
Writing procedures for cleanliness and proper functioning of shipping units and preventing damage to produce before loading onto truck
Preparing a checklist to verify cleanliness of shipping units, such as a trailer
Writing a policy for how trash should be safely handled and kept out of fields
3. Out of the following items, which is/are the major barrier/s to implement GAPs on your farm? (Check all that apply)
Time
Cost
Resources
Adequate knowledge of GAPs
Clarity in GAP guidelines
Other, please specify__________________________________________________
Not Applicable
Go to Page 3

164
4. Please rate () how challenging it is to comply with the following USDA GAPs Harmonized Food Safety Standards. Indicate “NA” if it is not applicable to your farm.
GAPs Harmonized Standards
Risk assessments
Not
Challenging
Slightly
Challenging
Somewhat Challenging
Moderately Challenging
Very
Challenging NA
Performing a pre-harvesting risk assessment
Conducting a water system risk assessment
Writing a risk assessment on domestic and wild animal activity
Other standards
Not
Challenging
Slightly
Challenging
Somewhat Challenging
Moderately Challenging
Very
Challenging NA
Keeping initial risk assessment records
Routinely monitoring of animal activity
Documentation to assure that sub-contractors are complying with food safety standards
5. Out of the following activities, indicate the major barrier/s you faced when writing or carrying out risk assessments on your farm? (Check all that apply)
Figuring out what to include in a risk assessment plan
Identifying sources of contamination
Writing management procedures for reducing risks
Understanding what the auditors would look for in the plan
Preparing food safety plan verification checklists
Accessing and understanding the latest scientific information on produce food safety
Other, please specify__________________________________________________
Not Applicable
If there are any other concerns regarding risk assessments that you wish to share with us, please write them below.
__________________________________________________________________________________________________
__________________________________________________________________________________________________
__________________________________________________________________________________________________
Go to Page 4
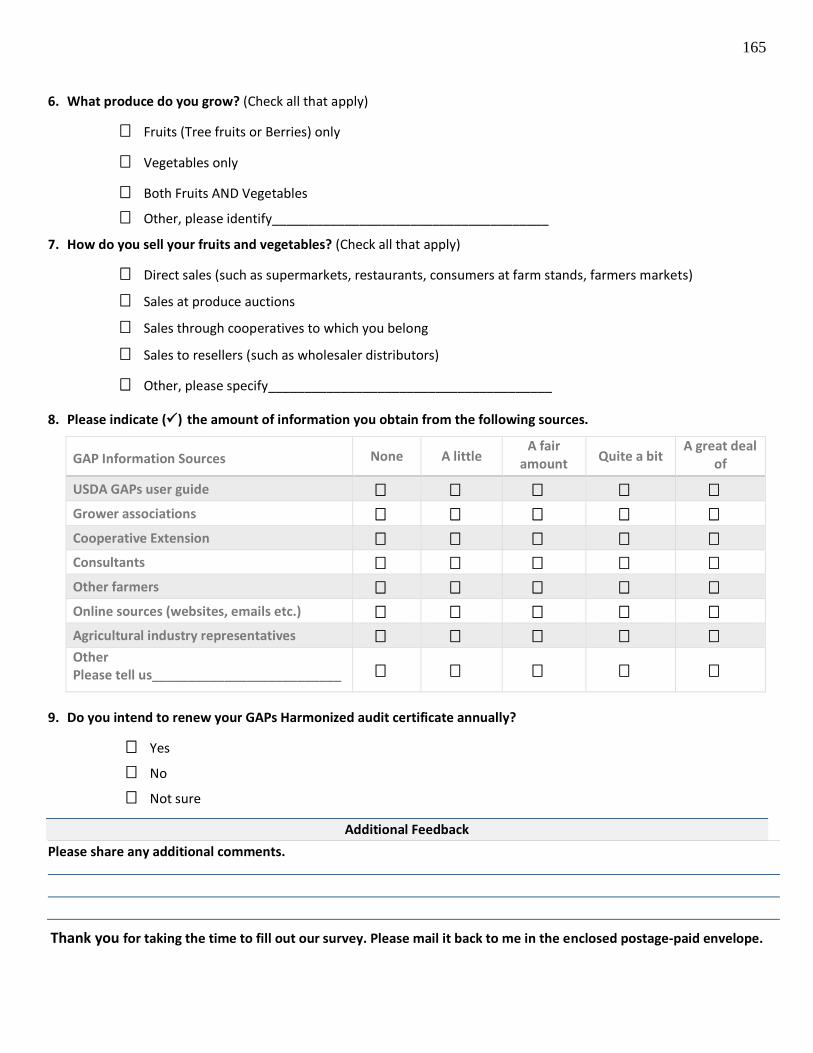
165
6. What produce do you grow? (Check all that apply)
Fruits (Tree fruits or Berries) only
Vegetables only
Both Fruits AND Vegetables
Other, please identify______________________________________
7. How do you sell your fruits and vegetables? (Check all that apply)
Direct sales (such as supermarkets, restaurants, consumers at farm stands, farmers markets)
Sales at produce auctions
Sales through cooperatives to which you belong
Sales to resellers (such as wholesaler distributors)
Other, please specify_______________________________________
8. Please indicate () the amount of information you obtain from the following sources.
GAP Information Sources None A little A fair
amount Quite a bit
A great deal of
USDA GAPs user guide Grower associations Cooperative Extension Consultants Other farmers Online sources (websites, emails etc.) Agricultural industry representatives Other Please tell us__________________________
9. Do you intend to renew your GAPs Harmonized audit certificate annually?
Yes
No
Not sure
Additional Feedback
Please share any additional comments.
Thank you for taking the time to fill out our survey. Please mail it back to me in the enclosed postage-paid envelope.

166
Appendix E
Growers’ Comments on GAP Barriers
A. Cost cost cost
B. Finding employees to document + record keep
C. Interpretation for aeroponic system
D. It takes a full-time person to implement/start the standards/training/plan, so the greatest
barrier is time and effort and finding the right person to do it.
E. Language barriers
F. Making record keeping an un-cumbersome routine so that it gets done consistently also
having potable water for hand washing & post-harvest wash
G. Need better training material for farm
H. Paper work - Typical Gov.
I. Reuse of flume water. We treat the water with chlorine but we are being told that FSMA
wasn't allow the reuse of the water. After the flume our potatoes go through a chlorinated
wash with potable well water.
J. Smaller producers cannot devote the time required and still manage their business.
K. Some rules are stupid. Employees recognize this and do not respect them. Best example is
"no drinking anything except water." If it’s okay to drink water, what's the difference if
you're drinking coffee? For example
L. Still a lot of "grey areas" without difficult numerical values to follow ie - sanitizer rate-
no approved GAPs cleaning/chemical list
M. Time
N. Time is the biggest challenge we can do all this and cost is not that bad. But the time
involved is more than small operators can bear
O. Time to document everything
P. Trained and knowledgeable personnel that have the time to ensure that all the protocol
and records are completed
Q. Very expensive for small farms
R. Water testing is the biggest cost. 40 Wells x $70=$2800; 40 wells x $120=$4800. 2) Not
all guidelines are straight forward and can be interpreted multiple ways. I have had

167
many disagreements with auditors and have challenged them. Often I have won once they
researched it.
S. We have no employees so many items (checklists) don't apply but have to be included.
Growers’ Comments on Risk Assessment Barriers
A. Excessive management time (No attempt to streamline)
B. Finding time away from farming and managing business
C. Grow indoors - what to do about what does not apply
D. Requirements are still not finalized
E. Writing easy to understand + follow SOPs
F. Writing it all down
G. You really don't know everything you need until you go through an audit
Comments on Risk Assessment
A. Food safety is basically using common sense.
B. Many times we have to guess on what companies look for. It is apparent that the main
concern is liability on food retailers - We are approaching this in a backwards manner.
C. Once in place, I feel complying with GAPs food safety standards is easy. Training all
employees would be the most challenging aspect in my opinion.
D. Pretty straight forward only you know what your
E. Prior building impacts; determining what employee hygiene wear is best suited to cooler
and other areas
F. So far no one has gotten sick from fresh apples due to on-farm practices. So we've
minimize risks that may not exist
G. Some risks are sill. Takes too much time. Manager/operators do not have extra time to
perform these added tasks
H. There are numerous risks involving in a farm operation especially tree fruit so that # of
employees + Machines operator in packing house and orchards complicate f
I. Time +Personnel=cost
J. We as a family farm operation are dedicated to raising food that is safe to eat for ourself
and others regardless of GAP. Thank you.
K. We have encountered varied opinions among auditors as to what consists sufficient
measures to address risk (specifically to irrigation water).
168
Appendix F
Manuscript Prepared in Partial Fulfilment
of the Requirements
for INTAD
169
1
Assessment of Farm Science Centre’s Involvement in Offering Food Safety 2
Training to Farmers of India 3
Roshan Nayak 4
John Ewing 6
Edgar Yoder 8
Luke LaBorde 10
The Pennsylvania State University 12
University Park, PA 16801 13
The United States of America 14
15
16
17
18
19

170
Assessment of Farm Science Centre’s Involvement in Offering Food Safety 1
Training to Farmers of India 2
Abstract 3
Foodborne illness due to consumption of contaminated food and water is a public health 4
concern in India. This study is primarily intended to contribute to the discourse on engaging 5
Krishi Vigyan Kendras-KVKs (Farm Science Centre) in training farmers to adopt food safety 6
practices on their farms. The study objectives focused on current involvement of KVK in food 7
safety training, Programme Coordinators (PCs) of the KVKs provided information regarding 8
food safety training and programming needs. An online questionnaire was developed, validated, 9
and administered to PCs to collect data. The results showed that excessive use of pesticides, lack 10
of hygienic practices in food processing, and improper washing of vegetables were the major 11
food safety concerns. PCs were familiar with Good Agricultural Practices (GAPs) and valued the 12
importance of food safety training for farmers. KVKs with food safety subject matter specialist 13
(SMS) were more likely to offer food safety training to farmers than KVKs without food safety 14
SMSs. PCs expressed the need for having a food safety (SMS) to provide food safety training. 15
KVKs need to find ways to accommodate and prioritize on-farm food safety awareness programs 16
in their annual action plans. As one of the major component of public Extension system and with 17
its wide presence in India, KVKs should take a lead role in training Extension professionals and 18
farmers regarding on-farm food safety practices. 19
20
21
Keywords: Farm Science Centre, Krishi Vigyan Kendra, Food Safety, Extension, Assessment 22
23

171
Introduction 1
Public Health and Food Safety 2
Foodborne diseases attributed to contaminated food and water affect millions of people 3
worldwide. The World Health Organization (WHO) report documents that each year about 2.2 4
million people die due to illness caused by microbial food and water contamination (WHO, 5
2014). For example, diarrhea is one the top five causes of death in India (WHO, 2012b). The 6
impact of foodborne diseases on society can be estimated in terms of economic and social costs. 7
The economic cost includes the cost of treatment, investigation, and businesses losses; whereas, 8
the social cost includes the reduction in human productivity, pain, grief, and disability (Griffith, 9
Mullan, & Price, 1995). Foodborne diseases in India further worsen the state of poverty for 10
families as diseases affect their ability to work and add extra health costs. 11
Lack of food safety awareness coupled with untrained food handlers across the food 12
supply chain, inadequate laboratory testing facilities (Chakrabarti, 2013), and poor enforcement 13
of food safety regulations (Umali-Deininger & Sur, 2007) have contributed to an inefficient food 14
control system in India. In this fragmented system food in the supply chain is exposed to a 15
multitude of food handlers as well as the risk of exposing food to an unhygienic environment and 16
food safety hazards. In 2003, the Food and Agriculture Organization (FAO) and WHO jointly 17
published guidelines for strengthening national food control systems. This document emphasized 18
potential food safety hazards along with factors that contribute to these hazards. Potential major 19
food safety hazards include microbiological and chemical contaminants, pesticide residues, and 20
allergens (FAO & WHO, 2003). Food at the farm level when exposed to disease-causing 21
pathogens when supplied to local markets immediately impact consumers’ health. “Improper 22
agricultural practices; poor hygiene at all stages of the food chain; lack of preventive controls in 23

172
food processing and preparation operations; misuse of chemicals; contaminated raw materials, 1
ingredients and water; and inadequate or improper storage” (FAO and WHO, 2003, p. 3) promote 2
food contamination. 3
Despite the increasing concern over foodborne illness, addressing on-farm food safety 4
issues has either been neglected or marginalized in the political and academic discourses in India. 5
The Indian focus on food quality and safety standards has been largely confined to standards and 6
regulations for the export market rather than the domestic food supply (Chakrabarti, 2013). 7
Jairath and Purohit (2013) emphasized the need for food safety awareness programs to educate 8
and train farmers regarding hygiene practices. This study urges that aware and motivated farmers 9
for improving their food safety practices and the subsequent impact on consumers’ health will 10
result in farmers being likely to adopt food safety practices. Educational programs to promote 11
food safety and motivate farmers to adopt Good Agricultural Practices (GAPs) are vital in 12
addressing on-farm food safety concerns and building consumer confidence in the domestic food 13
supply. 14
GAPs represent a set of on-farm preventive measures that address microbial water 15
quality, cleaning and sanitation, worker health and hygiene, animal and pest management, and 16
manure and composting (Bihn & Gravani, 2006). Therefore, GAPs are effective preventive 17
control measures for controlling food contamination by disease-causing hazards (FAO, 2003), 18
including mycotoxins (Bhat & Vasanthi, 2003). Kaferstein (2003) in assessing the implications 19
of food safety practices on public health in developing countries, described the principles of 20
GAPs as the first line of defense to prevent contamination of food. The Quality Council of India 21
(QCI), which promotes the implementation of on-farm food safety practices, has also stated that 22
adoption of GAPs not only ensure the safety of food products but also promote sustainable 23

173
farming practices (QCI, 2014). The QCI calls for “cooperation and active partnerships with all 1
stakeholders that include farmers, industry, and consumers" to create an efficient food control 2
system (QCI, 2014, p. 4). 3
Extension and Food Safety Education 4
The study positioned public Extension as a potential stakeholder in strengthening the 5
food control system in India. The Extension service is mandated to work for welfare of farming 6
community and the society and is primarily focused on production agriculture. Farm Science 7
Centre (Krishi Vigyan Kendra-KVK) along with the State Department of Agriculture, 8
Agricultural Technology Management Agency, State Agricultural Universities are the major 9
components of the public Extension system in India (Glendenning, Babu, & Asenso-Okyere, 10
2010). First established in 1974, the primary purpose of KVK was to provide vocational training 11
to the farmers, school dropout youth, and Extension field workers. 12
At present, KVKs are functioning in 642 locations in eight zones (Zone I-VIII) of India 13
(ICAR, 2016). KVKs receive funding and technical supervision from the Indian Council of 14
Agricultural Research (ICAR) and are administered by ICAR institutes, State Agricultural 15
Universities (SAUs), Central Agricultural University (CAU), Non-Governmental Organizations 16
(NGOs) or State Agriculture Departments (Glendenning et al., 2010; ICAR, 2016). KVKs 17
prepare their yearly action plans in coordination with other stakeholders such as government 18
personnel, progressive farmers and the zonal coordinators (Glendenning et al., 2010). 19
Programme Coordinators (PCs) are the head of the KVKs, and their multifold 20
responsibilities include decision making and planning, implementing, supervising, assessment of 21
new technologies and establishing links with clientele (Chauhan, 2011). KVK functions on the 22
mandates of on-farm demonstration and evaluation of production technologies, capacity 23

174
development of farmers and extension personnel, work as a knowledge and resource center for 1
agricultural technology, and offer farm advisories to clientele on varied topics of interest (ICAR, 2
2016). Subject Matter Specialists (SMS) are multi-disciplinary extension professionals; and they 3
work with the PC in achieving the mandate of KVK (Patil & Kokate, 2011). Gowda (2012) 4
stated that “KVKs have significantly contributed in educating farmers in improved practices and 5
enhancing productivity levels” (p. 6). With a presence in almost all districts of India and 6
considering the KVK expertise and clientele base, KVK is well-positioned to take a leading role 7
in training farmers and Extension professionals regarding on-farm food safety practices. 8
Theoretical Framework 9
The study utilized an integrated approach that supports Extension’s intervention in 10
emerging areas and development of programs based on Tone’s Health Action Model (THAM) for 11
food hygienic education (Rennie (1995). Lindner and Dolly (2012) proposed a conceptual 12
framework consisting of ten areas on which Extension must focus on outreach programs. One of 13
the ten focus areas states that Extension must “address important and contemporary 14
issues/problems.” Adopting the same focus area for effective outreach, Roberts, Ganpat, Narine, 15
Heinert, and Rodriguez (2015) assessed the training needs of Trinidad food producers. 16
Extension programs with a goal of translating farmer’s knowledge gained as a result of 17
food safety training into sustained behavior change may employ knowledge deficit models such 18
as KAP models focusing knowledge, aspirations, and practice change. However, the assumption 19
of linearity of behavior change process in knowledge deficit models is often questionable, since 20
behavior change as a result of food safety training may be subject to the influence of other 21
factors such as social and environmental factors. The present study supports Extension efforts to 22
develop and offer food safety training in the context of THAM as applied to food hygienic 23
175
education by Rennie (1995). Nieto-Montenegro, Brown, and LaBorde (2006) developed food 1
safety education materials using THAM. Tone’s model incorporates Health Belief Model (HBM) 2
and Theory of Reasoned Action and also emphasizes social and environmental factors (Rennie, 3
1995). Extension programming on food safety should not only disseminate food safety 4
knowledge among farmers but also motivate them to bring changes in their farm practices. 5
Knowledge gain and motivations are key constructs of THAM, and therefore, this study assessed 6
it’s use as an appropriate model for food safety educational program development. 7
Purpose and Objectives 8
The study purpose was to determine KVKs’ involvement in offering food safety training 9
to farmers. The four objectives were to: 10
1. Identify major food safety concerns related to farming practices in KVK districts; 11
2. Determine Programme Coordinators’ (PCs) attitudes towards public health issues, food 12
safety training and familiarity with GAPs; 13
3. Assess the current status of food safety programming and the perceived need for food 14
safety subject matter specialists (SMS); and 15
4. Determine PCs’ area of specializations, affiliations, experience, and responsibility 16
including the characteristics of KVKs’ clientele. 17
Methodology 18
The study used descriptive survey research methodology to answer study objectives. An 19
assessment questionnaire was developed at the [State] University. Survey questions measured 20
PCs’ attitudes toward public health issues and food safety training, their familiarity with GAPs, 21
the status of current food safety programs, the need for food safety SMS and the level of food 22
safety concerns related to on-farm food production practices. The survey also collected PCs’ as 23

176
well as farmers’ interest in participating in food safety programs and information about the 1
involvement of other organizations in providing food safety education. A final section included 2
questions related to PCs’ areas of specialization, work experience, job responsibilities and 3
affiliation, KVK zones, and characteristics of clientele. In an open-ended question, PCs were 4
asked to identify topics and concerns related to food safety programming in their districts. 5
An expert panel assessed content validity, and feedback from PCs and experts in India 6
were incorporated to improve the quality and readability of the survey questions. The 7
Institutional Review Board (IRB) at the [State] University approved the study protocol. 8
Electronic mailing addresses of 629 PCs (from each of the eight zones) were accessed from the 9
ICAR’s 2016 KVK directory (ICAR, 2016). Email messages consisting of a description of study 10
purpose and a web link to the survey were sent in January 2016 to all 629 PCs. 11
Online surveys were designed in such a way that participants would read the informed 12
consent letter before responding to the survey. To increase the response rate reminder emails 13
were sent to non-respondents requesting them to complete the questionnaire. The survey was 14
open for participants from January through June 2016. In total, 117 PCs responded to the online 15
survey for a response rate of 18.6%. States and corresponding zones of were identified for 105 16
survey respondents. Table 1 displays the number of surveys completed from different zones 17
along with the list of states and union territories under each zone. The highest number of 18
respondents (N=20, 19.05%) were located in zone V. 19
20
21
22
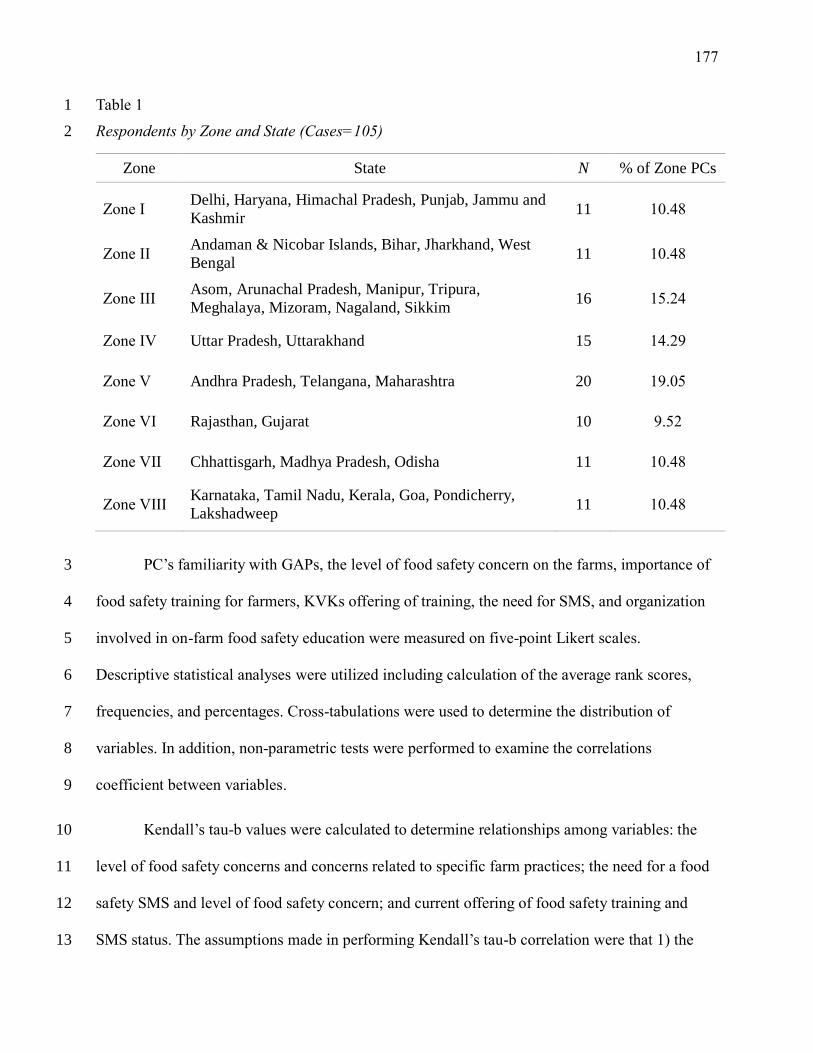
177
Table 1 1
Respondents by Zone and State (Cases=105) 2
Zone State N % of Zone PCs
Zone I Delhi, Haryana, Himachal Pradesh, Punjab, Jammu and
Kashmir 11 10.48
Zone II Andaman & Nicobar Islands, Bihar, Jharkhand, West
Bengal 11 10.48
Zone III Asom, Arunachal Pradesh, Manipur, Tripura,
Meghalaya, Mizoram, Nagaland, Sikkim 16 15.24
Zone IV Uttar Pradesh, Uttarakhand 15 14.29
Zone V Andhra Pradesh, Telangana, Maharashtra 20 19.05
Zone VI Rajasthan, Gujarat 10 9.52
Zone VII Chhattisgarh, Madhya Pradesh, Odisha 11 10.48
Zone VIII Karnataka, Tamil Nadu, Kerala, Goa, Pondicherry,
Lakshadweep 11 10.48
PC’s familiarity with GAPs, the level of food safety concern on the farms, importance of 3
food safety training for farmers, KVKs offering of training, the need for SMS, and organization 4
involved in on-farm food safety education were measured on five-point Likert scales. 5
Descriptive statistical analyses were utilized including calculation of the average rank scores, 6
frequencies, and percentages. Cross-tabulations were used to determine the distribution of 7
variables. In addition, non-parametric tests were performed to examine the correlations 8
coefficient between variables. 9
Kendall’s tau-b values were calculated to determine relationships among variables: the 10
level of food safety concerns and concerns related to specific farm practices; the need for a food 11
safety SMS and level of food safety concern; and current offering of food safety training and 12
SMS status. The assumptions made in performing Kendall’s tau-b correlation were that 1) the 13

178
variables were measured on ordinal scales and 2) there was a monotonic relationship between the 1
variables. Pearson chi-square test of association was performed between KVK offering of food 2
safety training and SMS status with Cramer’s V calculated to assess the strength of association. 3
Results 4
PC Attitudes Toward Public Health Issues, Food Safety Training, and Knowledge of GAPs 5
In order to determine PCs’ attitudes toward issues affecting public health in India, they 6
were asked to rank seven issues. as per the importance to public health. Results Revealed that 7
showed that PCs ranked food security and climate change as the top two major issues affecting 8
public health in India (Figure 1). PCs further ranked public health issues related to excessive use 9
of chemicals (ranked 3), food adulteration on farms (ranked 4) and health awareness about 10
infection (ranked 5). 11
12
Figure 1. Mean rank value of issues related to public health (N=112) 13
2.49
3.87
4.43
4.46
4.72
4.79
5.51
1 2 3 4 5 6 7
Genetically modified food
Food contamination on farms
Health awareness about infection
Food adulteration
Excessive chemical use on farms
Climate change
Food security
Mean rank valueHighest
Importance Lowest
Importance
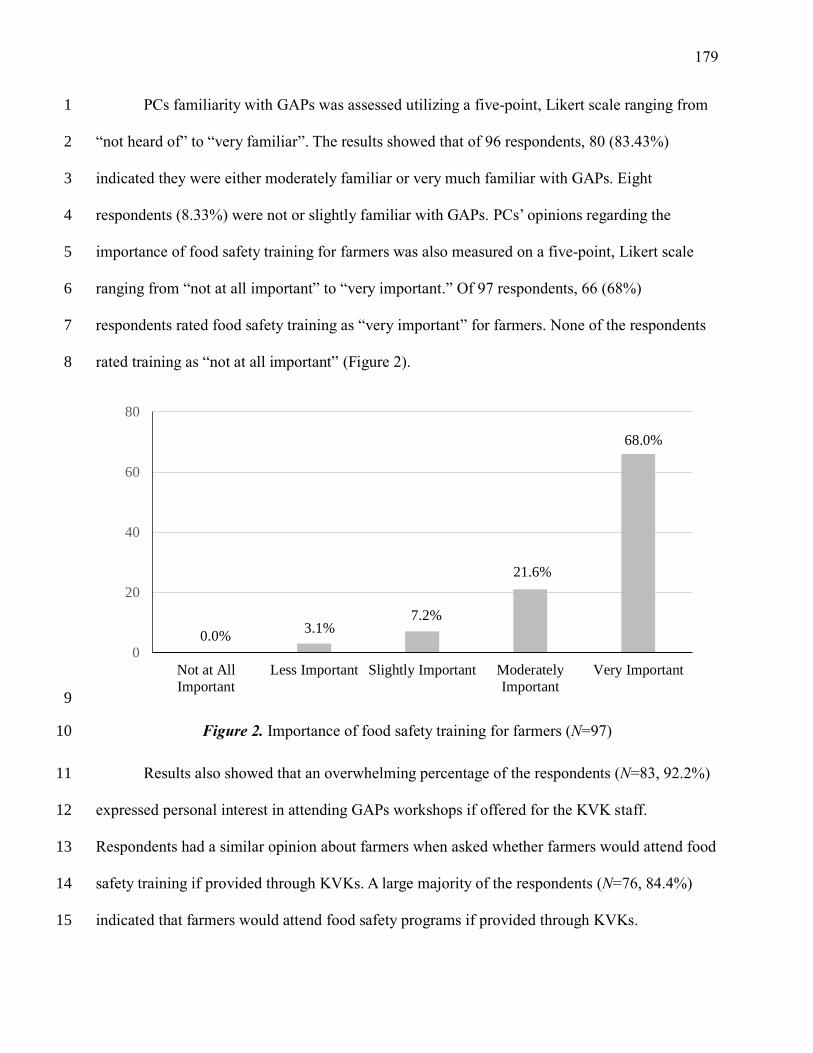
179
PCs familiarity with GAPs was assessed utilizing a five-point, Likert scale ranging from 1
“not heard of” to “very familiar”. The results showed that of 96 respondents, 80 (83.43%) 2
indicated they were either moderately familiar or very much familiar with GAPs. Eight 3
respondents (8.33%) were not or slightly familiar with GAPs. PCs’ opinions regarding the 4
importance of food safety training for farmers was also measured on a five-point, Likert scale 5
ranging from “not at all important” to “very important.” Of 97 respondents, 66 (68%) 6
respondents rated food safety training as “very important” for farmers. None of the respondents 7
rated training as “not at all important” (Figure 2). 8
9
Figure 2. Importance of food safety training for farmers (N=97) 10
Results also showed that an overwhelming percentage of the respondents (N=83, 92.2%) 11
expressed personal interest in attending GAPs workshops if offered for the KVK staff. 12
Respondents had a similar opinion about farmers when asked whether farmers would attend food 13
safety training if provided through KVKs. A large majority of the respondents (N=76, 84.4%) 14
indicated that farmers would attend food safety programs if provided through KVKs. 15
03
7
21
66
0
20
40
60
80
Not at All
Important
Less Important Slightly Important Moderately
Important
Very Important
21.6%
7.2%3.1%
0.0%
68.0%

180
On-Farm Food Safety Concerns 1
PCs were asked to indicate their level of food safety concern on the farms in their 2
districts by responding to a five-point, Likert-scale. The scale ranged from “not at all a concern” 3
to “very much a concern.” A slight majority of PCs (N=58, 59.8%) rated food safety on the farms 4
of their districts as a moderate to very much of a concern. Eighteen respondents (18.6%) rated 5
on-farm food safety as “not at all a concern” or “slightly a concern.” Additional questions were 6
asked for further insight into food safety concerns linked with farmers’ on-farm practices and 7
other factors. Respondents rated these practices and factors on a similar five-point, Likert-scale 8
ranging from “not at all a concern” to “very much a concern.” 9
Results showed a slight majority of respondents indicated excessive use of pesticide on 10
the farms (N=53, 58.9%), improper washing of vegetables (N=49, 54.4%), and lack of hygiene in 11
food processing (N=45, 50.6%) were moderate to very much a food safety concern on the farms 12
(Table 2). On the other hand, 27% of the respondents indicated that crop irrigation with 13
contaminated water was moderate to slightly a food safety concern. Additionally, the 14
respondents rated lack of awareness (81%) and high cost of implementing food safety practices 15
(75%) as somewhat to very much of a concern, respectively. 16
17
18
19
20
21
22
23
24
25
26
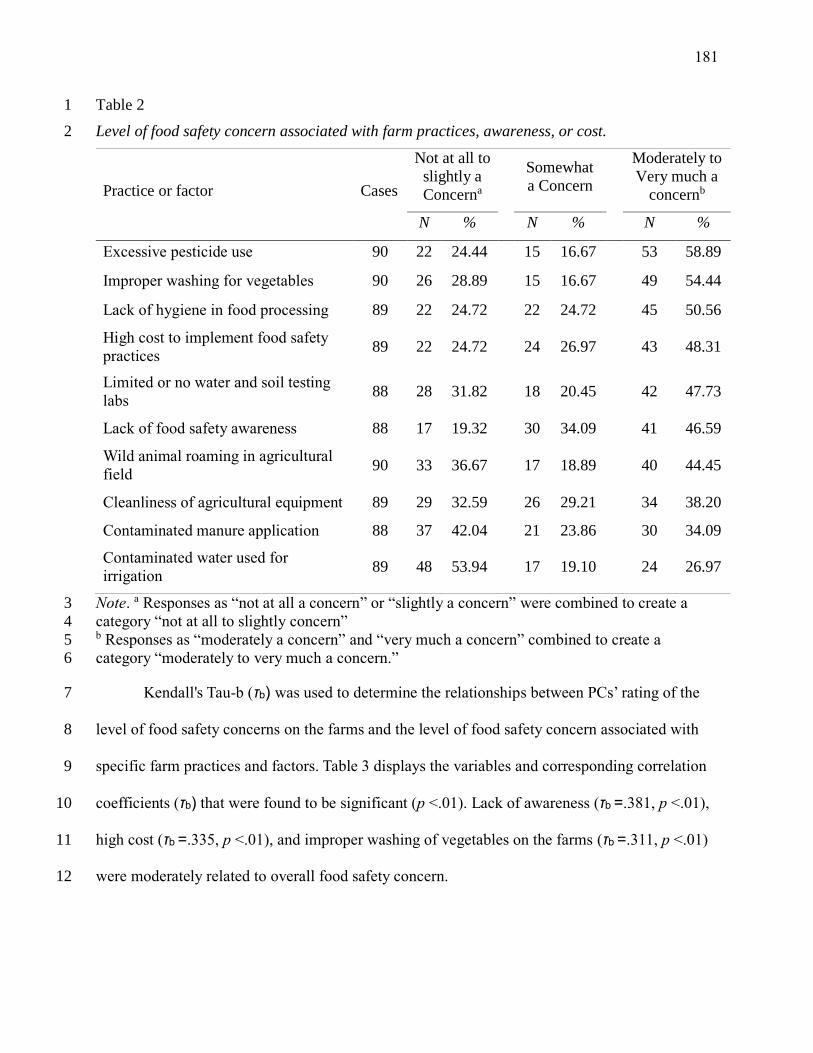
181
Table 2 1
Level of food safety concern associated with farm practices, awareness, or cost. 2
Practice or factor Cases
Not at all to
slightly a
Concerna
Somewhat
a Concern
Moderately to
Very much a
concernb
N % N % N %
Excessive pesticide use 90 22 24.44 15 16.67 53 58.89
Improper washing for vegetables 90 26 28.89 15 16.67 49 54.44
Lack of hygiene in food processing 89 22 24.72 22 24.72 45 50.56
High cost to implement food safety
practices 89 22 24.72 24 26.97 43 48.31
Limited or no water and soil testing
labs 88 28 31.82 18 20.45 42 47.73
Lack of food safety awareness 88 17 19.32 30 34.09 41 46.59
Wild animal roaming in agricultural
field 90 33 36.67 17 18.89 40 44.45
Cleanliness of agricultural equipment 89 29 32.59 26 29.21 34 38.20
Contaminated manure application 88 37 42.04 21 23.86 30 34.09
Contaminated water used for
irrigation 89 48 53.94 17 19.10 24 26.97
Note. a Responses as “not at all a concern” or “slightly a concern” were combined to create a 3
category “not at all to slightly concern” 4 b Responses as “moderately a concern” and “very much a concern” combined to create a 5
category “moderately to very much a concern.” 6
Kendall's Tau-b (τb) was used to determine the relationships between PCs’ rating of the 7
level of food safety concerns on the farms and the level of food safety concern associated with 8
specific farm practices and factors. Table 3 displays the variables and corresponding correlation 9
coefficients (τb) that were found to be significant (p <.01). Lack of awareness (τb =.381, p <.01), 10
high cost (τb =.335, p <.01), and improper washing of vegetables on the farms (τb =.311, p <.01) 11
were moderately related to overall food safety concern. 12
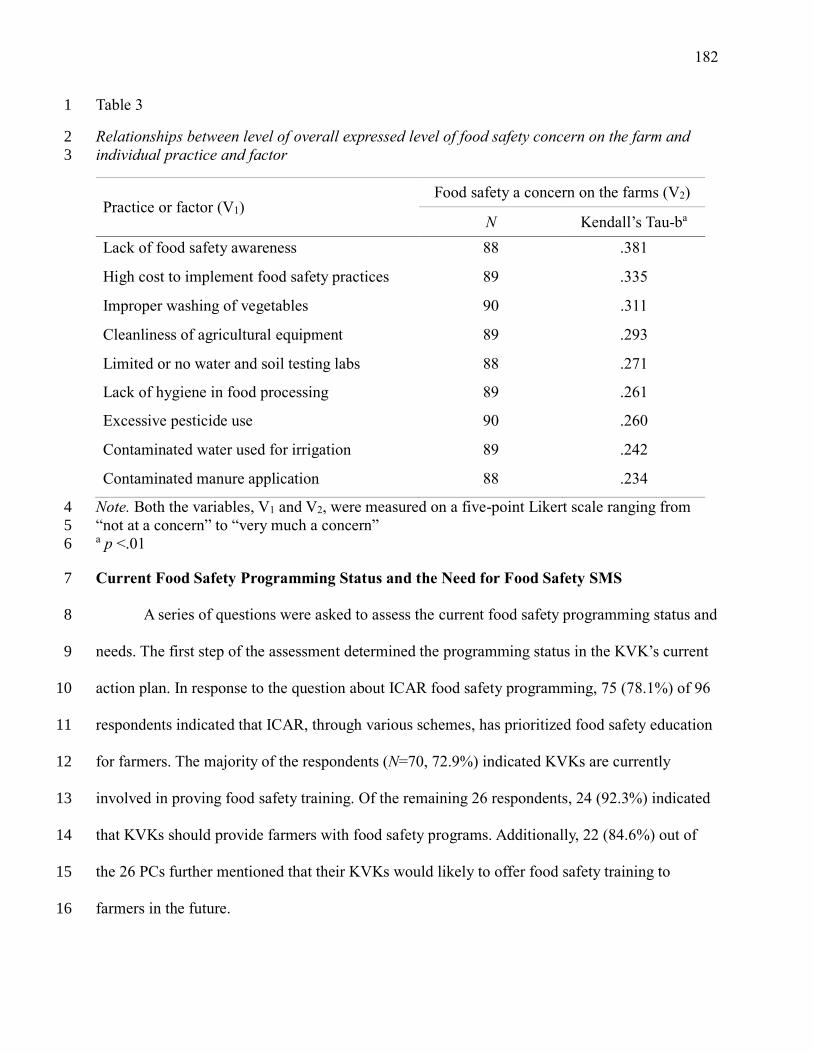
182
Table 3 1
Relationships between level of overall expressed level of food safety concern on the farm and 2
individual practice and factor 3
Practice or factor (V1) Food safety a concern on the farms (V2)
N Kendall’s Tau-ba
Lack of food safety awareness 88 .381
High cost to implement food safety practices 89 .335
Improper washing of vegetables 90 .311
Cleanliness of agricultural equipment 89 .293
Limited or no water and soil testing labs 88 .271
Lack of hygiene in food processing 89 .261
Excessive pesticide use 90 .260
Contaminated water used for irrigation 89 .242
Contaminated manure application 88 .234
Note. Both the variables, V1 and V2, were measured on a five-point Likert scale ranging from 4
“not at a concern” to “very much a concern” 5 a p <.01 6
Current Food Safety Programming Status and the Need for Food Safety SMS 7
A series of questions were asked to assess the current food safety programming status and 8
needs. The first step of the assessment determined the programming status in the KVK’s current 9
action plan. In response to the question about ICAR food safety programming, 75 (78.1%) of 96 10
respondents indicated that ICAR, through various schemes, has prioritized food safety education 11
for farmers. The majority of the respondents (N=70, 72.9%) indicated KVKs are currently 12
involved in proving food safety training. Of the remaining 26 respondents, 24 (92.3%) indicated 13
that KVKs should provide farmers with food safety programs. Additionally, 22 (84.6%) out of 14
the 26 PCs further mentioned that their KVKs would likely to offer food safety training to 15
farmers in the future. 16

183
PCs were asked if any other organizations are currently involved in offering food safety 1
educational programs to farmers in their districts. Of 90 respondents, 16 (17.8%) indicated other 2
organizations in their districts offering food safety programs, and 59% of the participants 3
indicated having no other organization(s) in their district that offered food safety educational 4
programs. Five PCs indicated government organizations and universities, and three PCs 5
indicated NGOs as the organizations other than KVK currently offering food safety education for 6
farmers. None of the respondents indicated the involvement of private corporations or Farmers 7
Cooperatives in such food safety program efforts. 8
Twenty-two PCs (22.7%) out of 97, indicated currently having a food safety SMS at their 9
KVK. The 74 KVKs that mentioned either not having a food safety SMS or did not answer the 10
question on SMS status were further asked to rate the need for a food safety SMS at their KVK. 11
Out of those 74 KVKs, the majority of KVKs (N=49, 66.2%) expressed the need of a food safety 12
SMS as moderate to high. A Kendall’s tau-b correlation was used to determine the relationship 13
between the level of food safety concerns on the farms and the need for a food safety SMS. 14
There was a significant, positive (although low) relationship between the level of food safety 15
concerns in KVK districts and the need for an SMS (τb =.199, p <.05). 16
Pearson chi-square test of association was performed to examine the association between 17
KVKs currently offering a food safety education program and currently having a food safety 18
SMS at the KVK (Table 4). There was a significant association between the current offering of 19
training and having an SMS at the KVK (2 = 5.16, df=1). The Cramer’s V correlation 20
coefficient of .244 (p <.05) indicated a moderate relationship between the two variables. The 21
correlation analysis showed that KVKs with a food safety SMS are more likely to currently 22
offering food safety training programs. 23

184
Table 4 1
Descriptive Statistics and Chi-square Test for food safety SMS status by the current status of food 2
safety training (Total=87). 3
Current status of food safety
training
SMS Status at KVK
Yes No
Yes 21 (95.5%) 47 (72.3%)
No 1 (4.5%) 18 (27.7%)
Note. 2 = 5.16, df = 1. Numbers in parentheses indicate column percentages. 4 *p < .05 5
Characteristics of KVK Clientele and Respondents 6
KVKs work with farmers of varied land sizes, including landless farmers to large-scale 7
farmers having more than four hectares of land. Almost 75% of the respondents (N=59) 8
identified small-scale farmers, having less than two hectares of land as their primary clientele. 9
Indian farmers grow various types of crops including cereals, legumes, fruits and vegetables, 10
aromatic and medicinal plants, and commercial crops. Around 86% of the respondents (N=69) 11
reported that the majority of the farmers in their district grow cereals. At the same time, 50% of 12
the respondents also indicated that the majority of the farmers of their areas grow produce. 13
Respondents indicated having specialization in either one or multiple areas of agriculture 14
and allied subjects. Results showed that 46% (N=37) of the respondents specialized in 15
horticulture and 43% (N=34) in agronomy. In addition, a relatively high number of respondents 16
specialized in animal husbandry, home science, crop production, plant pathology, and soil 17
science as compared to specializing in agricultural economics, engineering, fishery, and plant 18
breeding. Twenty-one (26.2%) respondents had a specialization in agricultural extension with or 19
without combined specialization in any other areas. 20

185
Regarding work responsibility, PCs can have a single job responsibility or combined 1
responsibilities across multiple work areas. More than 80% of the respondents indicated that 2
their main job responsibility was to train farmers. Linkage with line departments, training of field 3
workers, and administrative tasks were found to be the other major areas of job responsibility. A 4
rather lower number of respondents indicated research (N=36, 45.6%) and training of 5
government employees (N=37, 46.8) as their job responsibilities. 6
Respondents were affiliated with either one or more than one organization which 7
included KVK, Agricultural Technology Mobilizing Agency (ATMA), ICAR, SAU, Central 8
Agricultural Universities, and other agencies. The majority of the PCs indicated their affiliation 9
with KVK itself (N=56, 70%). The other two major organizations to which more than 50% of the 10
total respondents were affiliated with were ICAR (N=47, 58.8%) and SAUs (N=51, 63.8%). 11
Twenty-eight respondents (35%) were affiliated with ATMA and four percent with Central 12
Agricultural Universities. Out of the 80 PCs who responded to question related to their 13
experience at KVK, 37 (46.3%) were associated with KVK for more than ten years and 22 14
respondents (27.5%) for five to ten years. Twenty-one (26.3%) survey participants worked in 15
KVK for five years or less. 16
Conclusions and Recommendations 17
The study assessed the food safety concerns related to various farm practices by the 18
farmers in KVK districts. Not only PCs acknowledged the importance of food safety training, but 19
also mentioned that ICAR schemes prioritize food safety training for farmers. PCs recognized 20
on-farm food safety as a concern in the majority of districts, especially regarding contamination 21
from toxic agrochemicals. In addition, lack of hygienic practices during food processing and 22
improper washing of vegetables were also found to be major food safety concerns; whereas, 23

186
application of contaminated manure or water used for irrigation were of a relatively lower level 1
of concern. Based on the findings, on-farm food safety training programs should prioritize 2
hygienic practices including proper washing of vegetables and cleaning of agricultural 3
equipment. 4
The majority of the PCs indicated that their KVKs offered some food safety training to 5
farmers. Analysis of respondents’ comments to an open-ended question revealed a multitude of 6
food safety concerns, particularly excessive use of agrochemicals on the farms and the need for 7
awareness programs for hygienic practices. Furthermore, KVKs that currently are not offering 8
any food safety training acknowledged that they should train farmers and also indicated a greater 9
likelihood to provide such programs in the future. 10
The majority of KVKs have no SMS specialized in food safety. However, they are 11
offering some types of food safety programs. The study results indicated that KVKs with a food 12
safety SMS were more likely to provide food safety programs. SMS with a specialization in 13
home science appeared to be involved in training farm and rural women about hygienic 14
practices. For KVKs without a specialized food safety SMS, the majority expressed the need for 15
an SMS. The findings indicated the need for recruiting a greater number of field workers and 16
SMS. 17
This study concludes that PCs value the importance of food safety education for farmers 18
and Extension workers. The value of food safety education by the PCs was further supported by 19
the findings that more than the overwhelming majority of the respondents indicated their interest 20
in attending workshops on GAPs. PCs also indicated the farmers of their districts would attend 21
food safety workshops if the KVKs offer such training. A robust public health system calls for a 22
greater food safety awareness among food handlers at the farms, processing industry, food 23
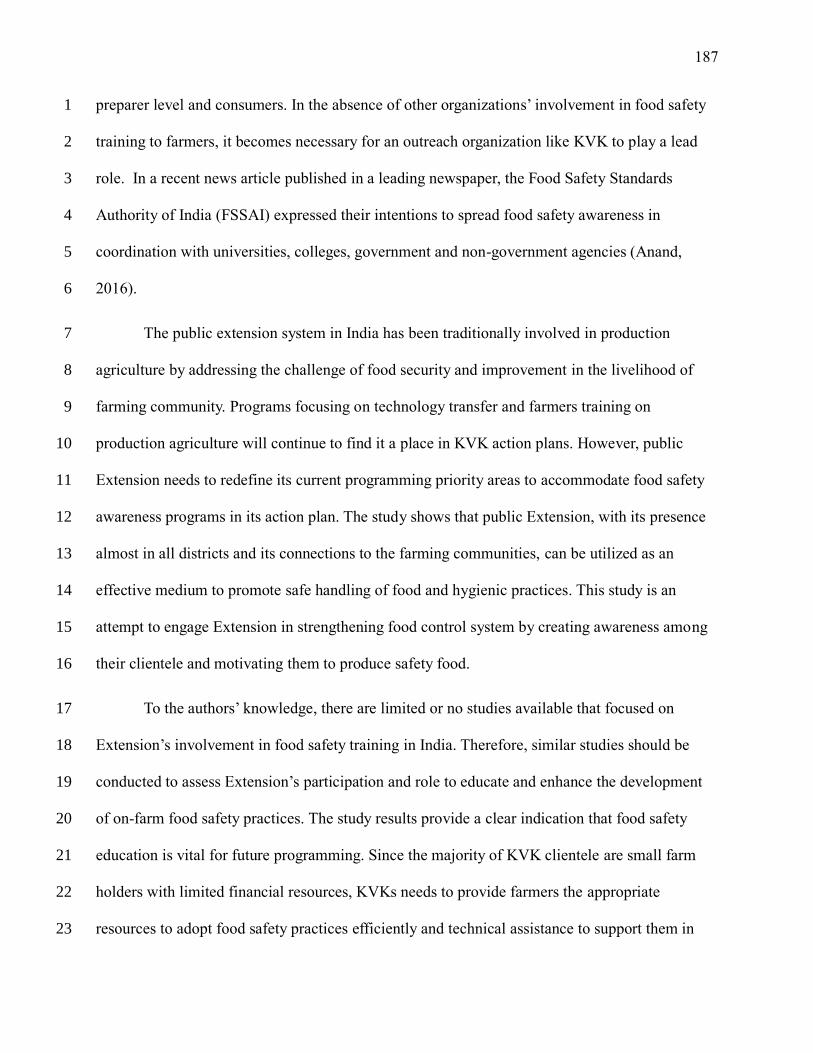
187
preparer level and consumers. In the absence of other organizations’ involvement in food safety 1
training to farmers, it becomes necessary for an outreach organization like KVK to play a lead 2
role. In a recent news article published in a leading newspaper, the Food Safety Standards 3
Authority of India (FSSAI) expressed their intentions to spread food safety awareness in 4
coordination with universities, colleges, government and non-government agencies (Anand, 5
2016). 6
The public extension system in India has been traditionally involved in production 7
agriculture by addressing the challenge of food security and improvement in the livelihood of 8
farming community. Programs focusing on technology transfer and farmers training on 9
production agriculture will continue to find it a place in KVK action plans. However, public 10
Extension needs to redefine its current programming priority areas to accommodate food safety 11
awareness programs in its action plan. The study shows that public Extension, with its presence 12
almost in all districts and its connections to the farming communities, can be utilized as an 13
effective medium to promote safe handling of food and hygienic practices. This study is an 14
attempt to engage Extension in strengthening food control system by creating awareness among 15
their clientele and motivating them to produce safety food. 16
To the authors’ knowledge, there are limited or no studies available that focused on 17
Extension’s involvement in food safety training in India. Therefore, similar studies should be 18
conducted to assess Extension’s participation and role to educate and enhance the development 19
of on-farm food safety practices. The study results provide a clear indication that food safety 20
education is vital for future programming. Since the majority of KVK clientele are small farm 21
holders with limited financial resources, KVKs needs to provide farmers the appropriate 22
resources to adopt food safety practices efficiently and technical assistance to support them in 23
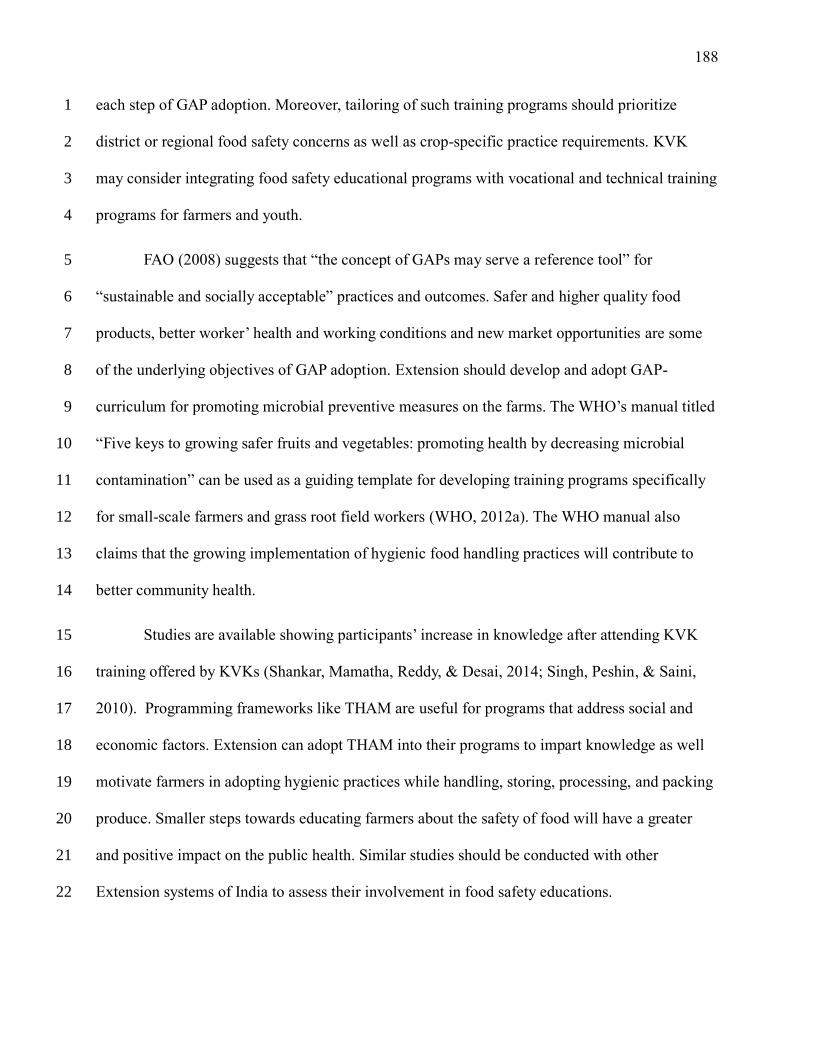
188
each step of GAP adoption. Moreover, tailoring of such training programs should prioritize 1
district or regional food safety concerns as well as crop-specific practice requirements. KVK 2
may consider integrating food safety educational programs with vocational and technical training 3
programs for farmers and youth. 4
FAO (2008) suggests that “the concept of GAPs may serve a reference tool” for 5
“sustainable and socially acceptable” practices and outcomes. Safer and higher quality food 6
products, better worker’ health and working conditions and new market opportunities are some 7
of the underlying objectives of GAP adoption. Extension should develop and adopt GAP-8
curriculum for promoting microbial preventive measures on the farms. The WHO’s manual titled 9
“Five keys to growing safer fruits and vegetables: promoting health by decreasing microbial 10
contamination” can be used as a guiding template for developing training programs specifically 11
for small-scale farmers and grass root field workers (WHO, 2012a). The WHO manual also 12
claims that the growing implementation of hygienic food handling practices will contribute to 13
better community health. 14
Studies are available showing participants’ increase in knowledge after attending KVK 15
training offered by KVKs (Shankar, Mamatha, Reddy, & Desai, 2014; Singh, Peshin, & Saini, 16
2010). Programming frameworks like THAM are useful for programs that address social and 17
economic factors. Extension can adopt THAM into their programs to impart knowledge as well 18
motivate farmers in adopting hygienic practices while handling, storing, processing, and packing 19
produce. Smaller steps towards educating farmers about the safety of food will have a greater 20
and positive impact on the public health. Similar studies should be conducted with other 21
Extension systems of India to assess their involvement in food safety educations. 22
189
It is recommended that international food safety certification agencies such as Global 1
G.A.P should be involved with KVK personnel on their programs and train them on international 2
food safety standards and regulations. In the absence of strict food safety regulations and 3
enforcement, food safety has emerged as one of the major public health concern that needs to be 4
dealt with effectively. To strengthen the public health system, Extension can contribute by 5
educating and motivating farmers to adopt food safety practice as a social responsibility. Such 6
intervention not only helps farmers but also build confidence among consumers that farmers are 7
increasing adopting food safety practices to provide them safer food. Food safety is a shared 8
responsibility of all the stakeholders of food supply chain. Therefore, a consensus among the key 9
stakeholders is crucial to engage and bring all the major Extension systems together to address 10
public health issues. 11
12
13
14
15
16
17
18
19
20
21
22
23
24

190
References 1
Anand, S. (2016, February 22). FSSAI to work with other government agencies to spread 2
awareness on food safety. The Economics Times. Retrieved from 3
http://economictimes.indiatimes.com/ 4
Bihn E, & Gravani R. (2006). Role of Good Agricultural Practices in fruit and vegetable safety. 5
In K. Matthews and M. Doyle (Eds), Microbiology of Fresh Produce (pp. 21-53). 6
doi:10.1128/9781555817527.ch2 7
Bhat, R.V. & Vasanthi, S. (2003). Mycotoxin Food Safety Risk in Developing Countries. In L. J. 8
Unnevehr (Ed.) Food Safety in Food Security and Food Trade (Brief 3 of 17). Retrieved 9
from http://ageconsearch.umn.edu/bitstream/16033/1/vf030010.pdf 10
Chakrabarti, A. (2013). Attitude and practices towards food safety in domestic consumption: A 11
case study from India. Journal of International Development, 25(5), 696-713. 12
doi:10.1002/jid.2878 13
Chauhan, N. M. (2011). Aptitude of the Programme Coordinators of Krishi Vigyan Kendras of 14
India. Indian Research Journal of Extension Education, 11(3), 19-24. Retrieved from 15
http://seea.org.in/ojs/index.php/irjee/article/download/534/529 16
Food and Agriculture Organization of the United Nations. (2003). Committee on agriculture 17
development of a framework for Good Agricultural Practices. Seventeenth Session 18
(COAG/2003/6). Retrieved from ftp://ftp.fao.org/docrep/fao/meeting/006/y8704e.pdf 19
Food and Agriculture Organization of the United Nations. (2008). Good Agricultural Practices. 20
Retrieved from http://www.fao.org/prods/gap/ 21
22
23

191
Food and Agriculture Organization of the United Nations & World Health Organization. (2003). 1
Assuring food safety and quality: Guidelines for strengthening national food control 2
systems (FAO Food and Nutrition Paper No. 76). ISSN 0254-4725. Retrieved from 3
ftp://ftp.fao.org/docrep/fao/006/y8705e/y8705e00.pdf 4
Glendenning, C. J., Babu, S., & Asenso-Okyere, K. (2010). Review of Agricultural Extension in 5
India: Are farmers’ information needs being met? (IFPRI Discussion Paper 01048). 6
Retrieved from www.ifpri.org/publication/review-agricultural-extension-india 7
Gowda, K. N. (2012). Agricultural Extension systems in India. Roundtable on agricultural 8
Extension in Asia, Beijing, 15-17. Retrieved from 9
www.syngentafoundation.org/__temp/Gowda_Extension_Systems_India.pdf 10
Griffith, C. J., Mullan, B., & Price, P. E. (1995). Food safety: implications for food, medical and 11
behavioural scientists. British Food Journal, 97(8), 23-28. 12
doi:http://dx.doi.org/10.1108/00070709510100082 13
ICAR. (2016). KVK Telephone directory 2016. Retrieved from http://www.icar.org.in/files/KVK-14
Telephone-Directory.pdf 15
Jairath, M. S., & Purohit, P. (2013). Food safety regulatory compliance in India: A challenge to 16
enhance agri-businesses. Ind. Jn. of Agri. Econ., 68(3), 431-448. Retrieved from 17
http://ageconsearch.umn.edu/bitstream/206346/2/Jairath_Purohit68_3.pdf 18
Kaferstein, F. (2003): Food safety as a public health issue for developing countries. In L. J. 19
Unnevehr (Ed.) Food Safety in Food Security and Food Trade (Brief 2 of 17). Retrieved 20
from http://ageconsearch.umn.edu/bitstream/16033/1/vf030010.pdf 21

192
Lindner, J. R., & Dolly, D. (2012). Extension and outreach: Not a question of if, but how. 1
Journal of International Agricultural and Extension Education, 19(3), 6-14. 2
doi:10.5191/jiaee.2012.19301 3
Nieto-Montenegro, S., Brown, J. L., & LaBorde, L. F. (2006). Using the Health Action Model to 4
plan food safety educational materials for Hispanic workers in the mushroom industry. 5
Food Control, 17(10), 757-767. doi:10.1016/j.foodcont.2005.04.017 6
Patil, S. S., & Kokate, K. D. (2016). Training need assessment of subject matter specialists of 7
Krishi Vigyan Kendras. Indian Res. J. Ext. Edu., 11(21), 18-22. Retrieved from 8
http://www.seea.org.in/vol11-1-2011/04.pdf 9
QCI. (2014). INDIA Good Agriculture Practices (INDGAP) certification scheme. Retrieved from 10
http://www.qcin.org/CAS/INDGAP/ 11
Rennie, D. M. (1995). Health education models and food hygiene education. The Journal of the 12
Royal Society for the Promotion of Health, 115(2), 75-79. 13
doi:10.1177/146642409511500203 14
Roberts, T. G., Ganpat, W. G., Narine, L., Heinert, S. B., & Rodriguez, M. T. (2015). Trinidad 15
food producers’ training needs for food security and implications for Extension. Journal 16
of International Agricultural and Extension Education, 22(1), 7-20. 17
doi:10.5191/jiaee.2015.22102 18
Shankara, M., Mamatha, H., Reddy, K. S., & Desai, N. (2014). An evaluation of training 19
programmes conducted by Krishi Vigyan Kendra, Tumkur, Karnataka. International 20
Journal of Farm Sciences, 4(2), 240-248. Retrieved from 21
http://www.inflibnet.ac.in/ojs/index.php/IJFS/article/view/2380/1944 22
193
Singh, K., Peshin, R., & Saini, S. K. (2010). Evaluation of the agricultural vocational training 1
programmes conducted by the Krishi Vigyan Kendras (Farm Science Centres) in Indian 2
Punjab. Journal of Agriculture and Rural Development in the Tropics and Subtropics, 3
111(2), 65-77. Retrived from 4
http://www.jarts.info/index.php/jarts/article/view/2010091334536 5
Umali-Deininger, D. & Sur, M. (2007). Food safety in a globalizing world: opportunities and 6
challenges for India. Agricultural Economics, 37(1), 135-147. 7
doi:10.1111/j.1574-0862.2007.00240.x 8
World Health Organization. (2012a). Five keys to growing safer fruits and vegetables: Promoting 9
health by decreasing microbial contamination. Retrieved from 10
www.who.int/foodsafety/publications/5keys_growing_safer/en/ 11
World Health Organization. (2012b). India: WHO statistical profile. Retrieved from 12
www.who.int/gho/countries/ind.pdf?ua=1 13
World Health Organization. (2014). Regional food safety strategy (SEA-NUT-186). Retrieved 14
from www.searo.who.int/entity/foodsafety/regional-food-strategy.pdf 15

194
Appendix G
Survey Questionnaire for INTAD Study
Title of Project: Role of Krishi Vigyan Kendra to Promote On-Farm Food Safety Practices in India
Principal Investigator: Roshan Kumar Nayak, Ferguson Building, Penn State University, University Park, PA 16802 United States of America Telephone: +1 (814) 777-7650
Purpose of the Study:This study assesses the significance of food safety educational programming in the current KVK’saction plans including the scope and obstacles to offer food safety programs.
Procedures to be followed:You will be asked to answer a series of questions related to the role that your KVK can play inpromoting food safety practices such as Good Agricultural Practices among farmers, food safetyprogramming needs and challenges in your districts. Discomforts and Risks:There are no risks to participating in this research beyond those experienced in everyday life. Some of the questions may appear personal but answers will be held in strict confidentiality.
Benefits:By participating in this study, you will be providing information that will help in assessing thesignificance of food safety educational programming scopes and challenges, which will benefitKVKs to design and implement effective food safety programs for farmers.
Duration: Survey will take about 12-15 minutes.
Statement of Confidentiality:Only the person in charge (Roshan Nayak) and members of his immediate research team will knowyour identity. You may be assured of complete confidentiality. Your name will never be associatedwith your answers or any of your statements. Only the overall results of the survey will be reported.If this research is published, no information that would identify you will be written. Yourconfidentiality will be kept to the degree permitted by the technology used. No guarantees can bemade regarding the interception of data sent via the Internet by any third parties. The PennsylvaniaState University’s Office for Research Protections and Institutional Review Board, and the Office forHuman Research Protections in the Department of Health and Human Services may review recordsrelated to this project.
1. INFORMED CONSENT
KVK's Role on Food Safety Programming
1

Security of Data: The project investigator (Roshan Nayak) and members of his immediate research team will be theonly persons who will have access to the survey data. These materials will be secured in lockedoffices and computers, when not being analyzed. All materials will be destroyed upon completion ofthe project. Right to Ask Questions:You can ask questions about the research. The person in charge will answer your questions. Please contact Dr. John Ewing at +1 (814) 863-7463 or via email at [email protected] with questionswith questions, complaints or concerns about this research. If you have any questions, concerns,problems about your rights as a research participant or would like to offer input, please contact ThePennsylvania State University’s Office for Research Protections (ORP) at +1 (814) 865-1775. TheORP cannot answer questions about research procedures. Questions about research procedurescan be answered by the research team.
Voluntary Participation:You do not have to participate in this research. You can end your participation at any time by tellingthe person in charge. You do not have to answer any questions you do not want to answer.Refusing to participate or withdrawing early from the study will involve no penalty or loss ofbenefits you would be entitled to otherwise.
Please Click Next to Start the Survey
2. Opinion on Public Health
KVK's Role on Food Safety Programming
2

1. Please rank the following six issues with respect to their importance to public health in India, where rank1= Most important and 6 = Less important.
Climate change
Food security
Food adulteration
Food contamination in farms
Health awareness about infection
Excessive chemical use on farms
Genetically Modified Food
Good Agricultural Practices (GAPs) are "practices that address environmental, economic and socialsustainability for on-farm processes, and result in safe and quality food and non-food agriculturalproducts" (FAO Definition). GAPs are ways that farmers can prevent contamination of fruits andvegetables on their farm.
3. On-Farm Food Safety
KVK's Role on Food Safety Programming
Never heard of Slightly familiar Somewhat familiar Moderately familiar Very much familiar
2. Please rate how familiar you are with Good Agricultural Practices (GAPs). By familiarity, we mean howwell you know about GAPs.
Not at all a concern Slightly a concern Somewhat a concern A moderate concern Very much a concern
3. In your view, how much is food safety a concern in the farms of your district?
Not at all important Low important Slightly important Moderately important Very Important
4. In your opinion, how important is food safety training for farmers of your KVK district?
3
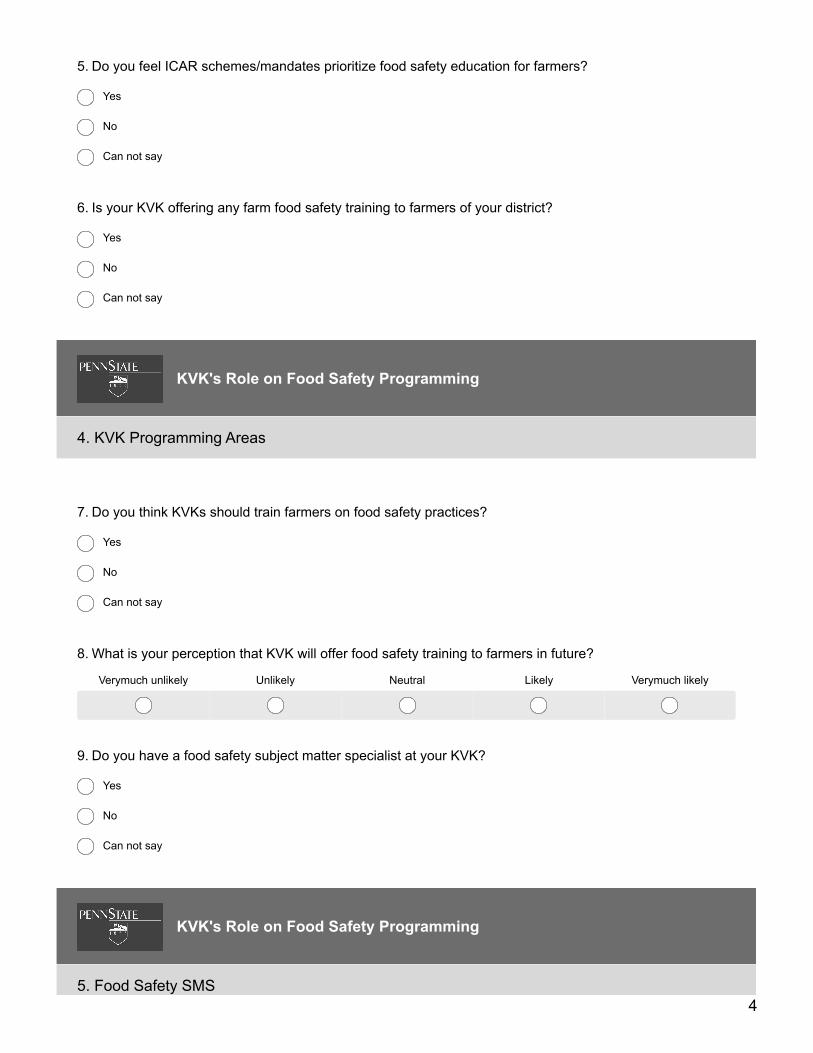
5. Do you feel ICAR schemes/mandates prioritize food safety education for farmers?
Yes
No
Can not say
6. Is your KVK offering any farm food safety training to farmers of your district?
Yes
No
Can not say
4. KVK Programming Areas
KVK's Role on Food Safety Programming
7. Do you think KVKs should train farmers on food safety practices?
Yes
No
Can not say
Verymuch unlikely Unlikely Neutral Likely Verymuch likely
8. What is your perception that KVK will offer food safety training to farmers in future?
9. Do you have a food safety subject matter specialist at your KVK?
Yes
No
Can not say
5. Food Safety SMS
KVK's Role on Food Safety Programming
4

Not at all needed Somewhat needed Neutral Moderately needed Highly needed
10. Please rate the need for a food safety Subject Matter Specialist (SMS) at your KVK.
6. Farm Level Food Safety Concerns
KVK's Role on Food Safety Programming
5

1=Not at all a
concern 2=Slightly a concern3=Somewhat a
concern4=Moderately a
concern5=Very much
a concern
Improper washing forvegetables
Wild animal roaming inagricultural field
Excessive pesticide use
Cleanliness ofagricultural equipment
Lack of hygiene in foodprocessing
Contaminated manureapplication
Contaminated waterused for irrigation
Lack of food safetyawareness
Lack of awarenessamong consumers
High cost to implementfood safety practices
Limited or no water andsoil testing labs
Other
Other (please specify)
11. On a scale of 1 - 5, where 1= Not at all a concern and 5= Extremely a concern, please rate thelevel of food safety concern associated with the following farming practices on farms of yourdistrict.
7. Food Safety Training
KVK's Role on Food Safety Programming
6
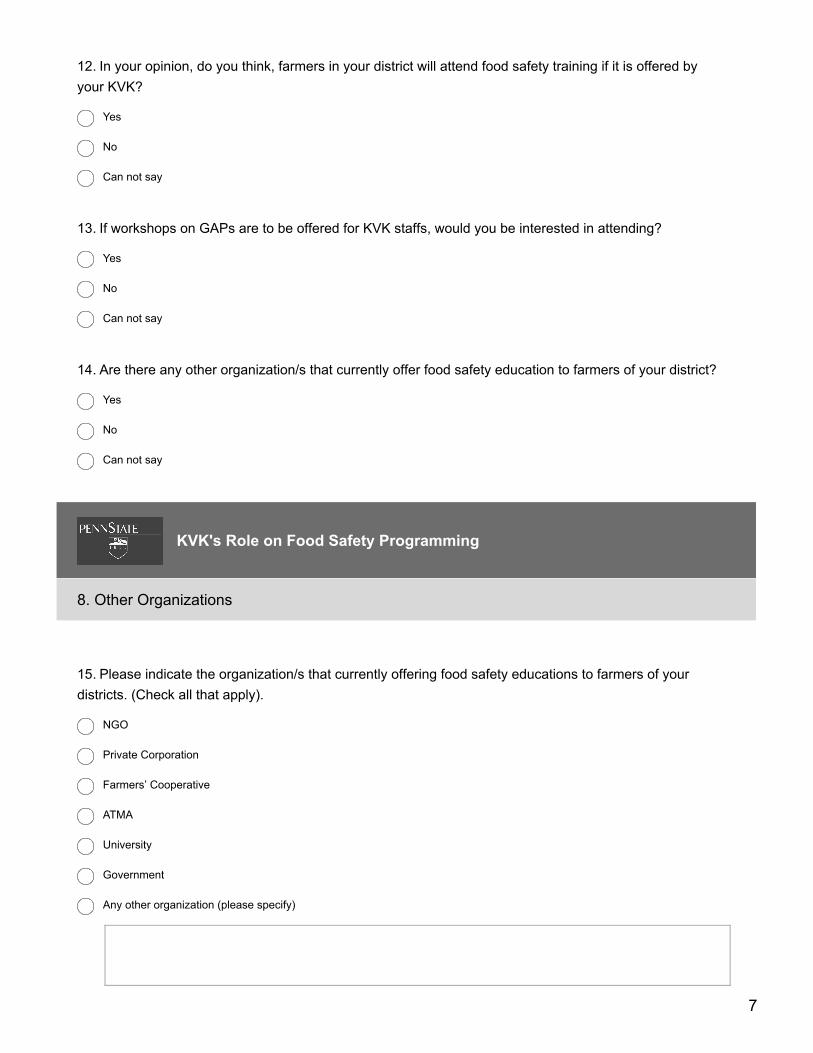
12. In your opinion, do you think, farmers in your district will attend food safety training if it is offered byyour KVK?
Yes
No
Can not say
13. If workshops on GAPs are to be offered for KVK staffs, would you be interested in attending?
Yes
No
Can not say
14. Are there any other organization/s that currently offer food safety education to farmers of your district?
Yes
No
Can not say
8. Other Organizations
KVK's Role on Food Safety Programming
15. Please indicate the organization/s that currently offering food safety educations to farmers of yourdistricts. (Check all that apply).
NGO
Private Corporation
Farmers’ Cooperative
ATMA
University
Government
Any other organization (please specify)
7
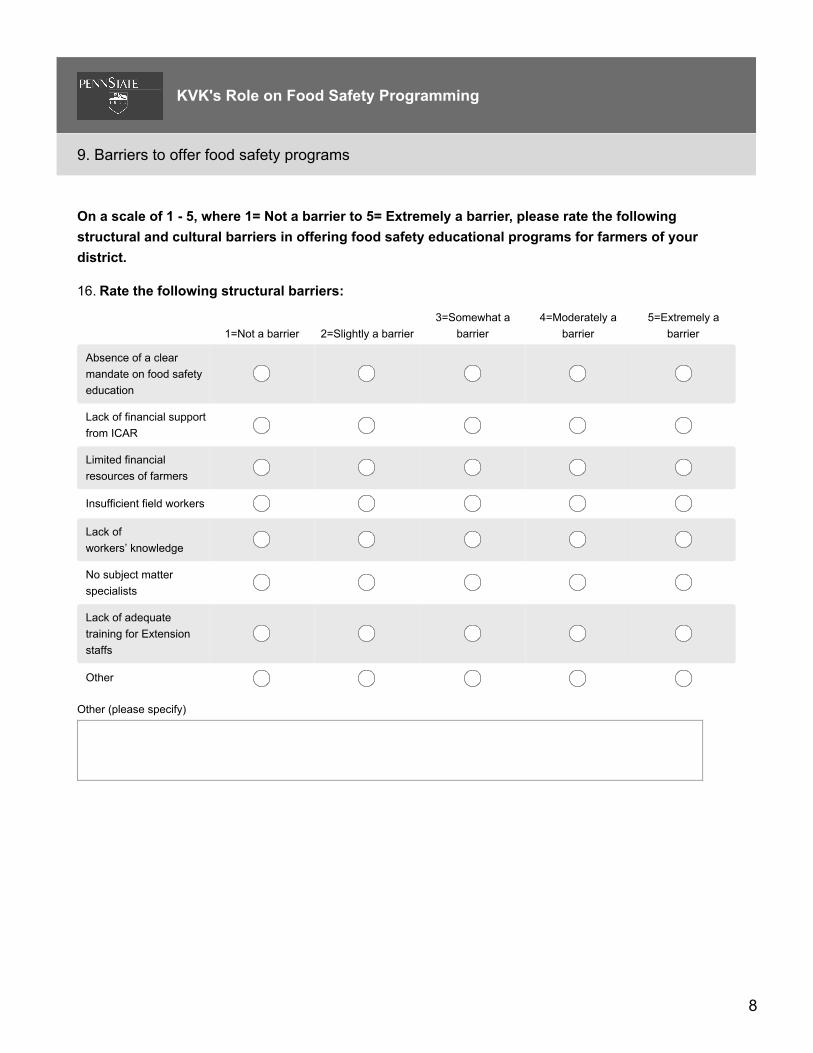
On a scale of 1 - 5, where 1= Not a barrier to 5= Extremely a barrier, please rate the followingstructural and cultural barriers in offering food safety educational programs for farmers of yourdistrict.
9. Barriers to offer food safety programs
KVK's Role on Food Safety Programming
1=Not a barrier 2=Slightly a barrier3=Somewhat a
barrier4=Moderately a
barrier5=Extremely a
barrier
Absence of a clearmandate on food safetyeducation
Lack of financial supportfrom ICAR
Limited financialresources of farmers
Insufficient field workers
Lack ofworkers’ knowledge
No subject matterspecialists
Lack of adequatetraining for Extensionstaffs
Other
Other (please specify)
16. Rate the following structural barriers:
8
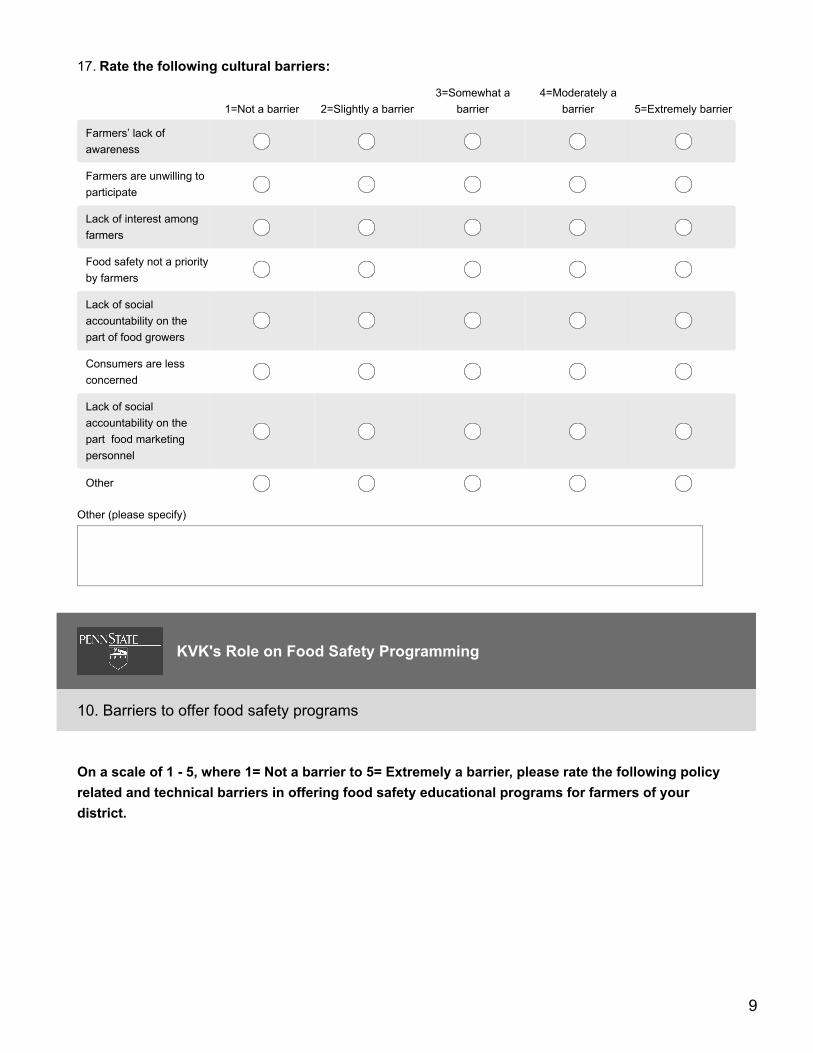
1=Not a barrier 2=Slightly a barrier3=Somewhat a
barrier4=Moderately a
barrier 5=Extremely barrier
Farmers’ lack ofawareness
Farmers are unwilling toparticipate
Lack of interest amongfarmers
Food safety not a priorityby farmers
Lack of socialaccountability on thepart of food growers
Consumers are lessconcerned
Lack of socialaccountability on thepart food marketingpersonnel
Other
Other (please specify)
17. Rate the following cultural barriers:
On a scale of 1 - 5, where 1= Not a barrier to 5= Extremely a barrier, please rate the following policyrelated and technical barriers in offering food safety educational programs for farmers of yourdistrict.
10. Barriers to offer food safety programs
KVK's Role on Food Safety Programming
9

1=Not a barrier 2=Slightly a barrier3=Somewhat a
barrier4=Moderately a
barrier5=Extremely a
barrier
Food safety not a priorityon KVK's action plan
No clear policy fromICAR on food safety
Lack of adequateconcern on the part ofICAR
No strict food safetyregulations
Lack of awarenessamong farmers
Other
Other (please specify)
18. Rate the following policy related barriers:
1=Not a barrier 2=Slightly a barrier3=Somewhat a
barrier4=Moderately a
barrier5=Extremely a
barrier
Lack of infrastructure totrain farmers
Limited funds to supporttraining
Limited staff members
Inadequate recruitmentof womenscientists/officers atgrass-root level
Inadequate in-servicetraining
Inadequate involvementof women farmerstraining programmes
Other
Other (please specify)
19. Rate the following technical barriers:
10
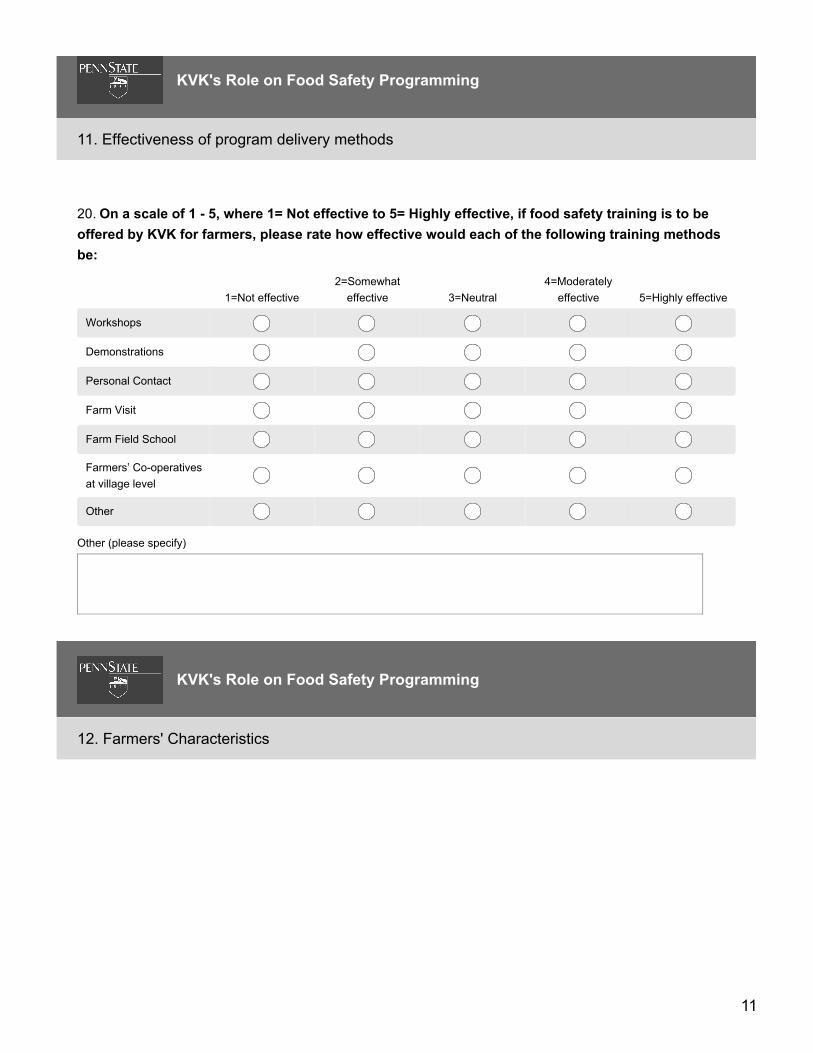
11. Effectiveness of program delivery methods
KVK's Role on Food Safety Programming
1=Not effective2=Somewhat
effective 3=Neutral4=Moderately
effective 5=Highly effective
Workshops
Demonstrations
Personal Contact
Farm Visit
Farm Field School
Farmers’ Co-operativesat village level
Other
Other (please specify)
20. On a scale of 1 - 5, where 1= Not effective to 5= Highly effective, if food safety training is to beoffered by KVK for farmers, please rate how effective would each of the following training methodsbe:
12. Farmers' Characteristics
KVK's Role on Food Safety Programming
11

21. Majority of the farmers you primarily work with are (Check all that apply)
Small (less than 2ha)
Medium (medium (2-4ha)
Large (more than 4ha)
Landless (no land)
Other (please specify)
22. Indicate the crops that the majority of farmers in your district grow? (Check all that apply)
Cereals
Legumes
Vegetables mostly eaten raw (example Cucumbers, Tomatoes etc.)
Vegetables mostly cooked (example potatoes, Brinjal, Cabbage etc.)
Fruits
Aromatic and Medicinal plants
Other (please specify)
13. Demographic Information
KVK's Role on Food Safety Programming
12
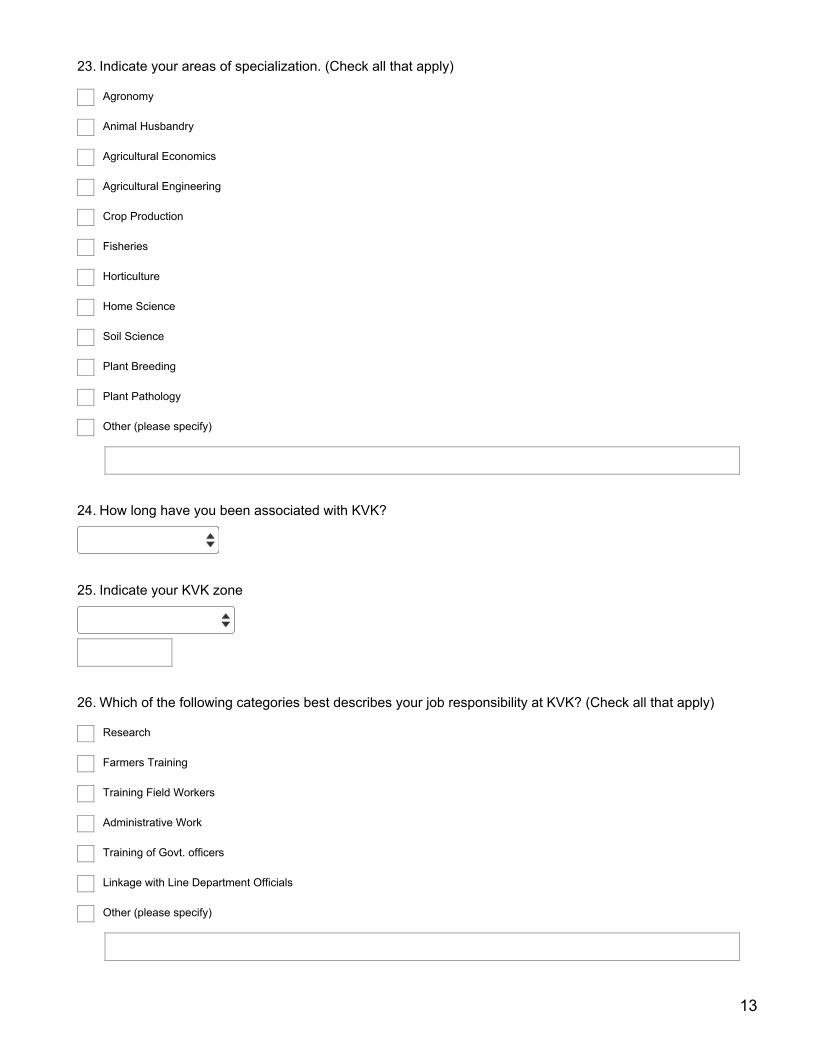
23. Indicate your areas of specialization. (Check all that apply)
Agronomy
Animal Husbandry
Agricultural Economics
Agricultural Engineering
Crop Production
Fisheries
Horticulture
Home Science
Soil Science
Plant Breeding
Plant Pathology
Other (please specify)
24. How long have you been associated with KVK?
25. Indicate your KVK zone
26. Which of the following categories best describes your job responsibility at KVK? (Check all that apply)
Research
Farmers Training
Training Field Workers
Administrative Work
Training of Govt. officers
Linkage with Line Department Officials
Other (please specify)
13
27. Are you affiliated with? (Check all that apply)
KVKs
ATMA
ICAR
State Agricultural University
Central Agricultural University
Central Institutions
Other (please specify)
28. Please write down any other topic that you would like to share with us related to food safety trainingprogramming in you district.
14
VITA
Roshan Nayak
Education
The Pennsylvania State University
Ph.D. Agricultural and Extension Education
Dual Title in International Agriculture and Development
University Park, PA
December 2016
Tarleton State University
M.S. Agriculture and Consumer Resources
Stephenville, TX
August 2012
Banaras Hindu University
B.Sc. Agricultural Science
National Talent Scholarship
Varanasi, India
May 2009
Selected Awards and Recognitions
2nd Place Award at 29th Penn State Graduate Exhibition in Social and Behavioral
Science Category
2016
Graduate Research Grant of $1000 from the Office of the International Programs 2015
2nd Place Award at 27th Penn State Graduate Exhibition in Social and Behavioral
Science Category
2014
International Travel Award from the Office of the International Programs 2013
2nd Place Award at Gamma Sigma Delta Research Expo, Penn State University 2013
Davidson Presidential Scholarship, Tarleton State University 2011-12
Dr. Dennis P. McCabe Student Endowment award, Tarleton State University 2011-12
Selected Publications and Conference Papers
Nayak, R., Tobin, D., Radhakrishna, R., Thomson, J.S., Laborde, L. (2015). Evaluation of on-farm
food safety programming in Pennsylvania: Implications for Extension. Journal of
Extension [On-line], 53(1). Article 1FEA9. Available at
http://www.joe.org/joe/2015february/a9.php
Nayak, R.K., Radhakrishna, R., Foley, C., Thompson, G., & Hawthorne, A. (2015, May). The
Relationship of Graduate Program Satisfaction with Student Learning Ability, Department
Collegiality, and Adequacy of Student Support. Paper Presented at AAAE Conference, San
Antonio, TX.
Radhakrishna, R., Nayak, R. K., Chaudhary, A. K., Gill, T., & Paudel, S. (2014, November). Pre-
needs Assessment Tool for Program Design, Delivery, and Evaluation. Paper presented at
American Evaluation Association, Denver, CO.
Nayak, R. K., Tobin, D., Thomson, J., Radhakrishna, R., & Laborde, L., (2013, December).
Produce Growers’ Challenges in Implementing Good Agricultural Practices. Paper
presented at INSEE Conference, Bangalore.