Implementation of a National Near-Road NO 2 Monitoring Network
11
1 Implementation of a National Near-Road NO 2 Monitoring Network Extended Abstract 2011-A-117-AWMA Anna Ciesielski, Nealson Watkins, Timothy Barzyk and Richard Baldauf* U.S. Environmental Protection Agency, Research Triangle Park, NC 27711 *corresponding author: 109 TW Alexander Dr., Research Triangle Park, NC 27711; [email protected] ABSTRACT In recent years, a large number of health studies have identified increased risks of adverse health effects for populations spending significant time near major roads. These studies indicate that populations living, working or going to school near major roads may be subjected to an increased risk for adverse effects including respiratory, cardiovascular, premature mortality, birth and developmental effects, and cancer. Emission inventories reveal that mobile sources significantly contribute to local and national concentrations of a number of air pollutants. Air quality monitoring studies near large roadways have measured pollutant concentrations that are elevated above overall urban background concentrations. The EPA recently published monitoring requirements in support of the revision to the primary NO 2 National Ambient Air Quality Standards (NAAQS). As part of the rulemaking, certain state and local air agencies are required to operate near-road NO 2 monitors. EPA committed to prepare near-road monitoring assistance documents and assist state and local air monitoring agencies as they conduct pilot studies to further aid in the implementation of required near-road monitoring stations. This presentation will provide an update on the monitoring requirements, technical assistance document, and preliminary pilot study results. INTRODUCTION On February 9 th , 2010 new minimum monitoring requirements for the Nitrogen Dioxide (NO 2 ) monitoring network were promulgated in support of a revised Oxides of Nitrogen National Ambient Air Quality Standard (NAAQS). 1 The new NO 2 NAAQS was revised from an annual standard to a 1-hour standard with a threshold concentration of 100 ppb, intending to protect against peak 1-hour exposures that may occur anywhere in an area. In the NO 2 rulemaking, the EPA recognized that roadway-associated exposures account for a majority of ambient exposures to peak NO 2 concentrations. In particular, the EPA recognized that the combination of increased mobile source emissions and increased urban population densities lead to increased potential for exposure and associated risks. As a result, the EPA promulgated requirements for near-road NO 2 monitors in urban areas near heavily-trafficked roads where peak 1-hour NO 2 concentrations are expected to occur. The rule requires state and local air agencies to operate one near-road NO 2 monitor in any Core Based Statistical
Transcript of Implementation of a National Near-Road NO 2 Monitoring Network
1
Implementation of a National Near-Road NO2 Monitoring Network
Extended Abstract 2011-A-117-AWMA
Anna Ciesielski, Nealson Watkins, Timothy Barzyk and Richard Baldauf*
U.S. Environmental Protection Agency, Research Triangle Park, NC 27711
*corresponding author: 109 TW Alexander Dr., Research Triangle Park, NC 27711; [email protected]
ABSTRACT In recent years, a large number of health studies have identified increased risks of adverse health effects for populations spending significant time near major roads. These studies indicate that populations living, working or going to school near major roads may be subjected to an increased risk for adverse effects including respiratory, cardiovascular, premature mortality, birth and developmental effects, and cancer. Emission inventories reveal that mobile sources significantly contribute to local and national concentrations of a number of air pollutants. Air quality monitoring studies near large roadways have measured pollutant concentrations that are elevated above overall urban background concentrations.
The EPA recently published monitoring requirements in support of the revision to the primary NO2 National Ambient Air Quality Standards (NAAQS). As part of the rulemaking, certain state and local air agencies are required to operate near-road NO2 monitors. EPA committed to prepare near-road monitoring assistance documents and assist state and local air monitoring agencies as they conduct pilot studies to further aid in the implementation of required near-road monitoring stations. This presentation will provide an update on the monitoring requirements, technical assistance document, and preliminary pilot study results.
INTRODUCTION
On February 9th, 2010 new minimum monitoring requirements for the Nitrogen Dioxide (NO2) monitoring network were promulgated in support of a revised Oxides of Nitrogen National Ambient Air Quality Standard (NAAQS).1 The new NO2 NAAQS was revised from an annual standard to a 1-hour standard with a threshold concentration of 100 ppb, intending to protect against peak 1-hour exposures that may occur anywhere in an area. In the NO2
rulemaking, the EPA recognized that roadway-associated exposures account for a majority of ambient exposures to peak NO2 concentrations. In particular, the EPA recognized that the combination of increased mobile source emissions and increased urban population densities lead to increased potential for exposure and associated risks. As a result, the EPA promulgated requirements for near-road NO2 monitors in urban areas near heavily-trafficked roads where peak 1-hour NO2 concentrations are expected to occur. The rule requires state and local air agencies to operate one near-road NO2 monitor in any Core Based Statistical
2
Area (CBSA) with a population of 500,000 or more persons. In addition, those CBSAs with 2,500,000 or more persons, or those CBSAs with one or more roadway segments carrying traffic volumes of 250,000 or more vehicles, as measured by Annual Average Daily Traffic (AADT) counts, shall have two near-road NO2 monitors. The required near-road NO2 network is to be implemented and operational by January 1, 2013. State and local ambient air monitoring agencies are required to submit their plans for any required near-road NO2 stations in their annual monitoring network plan due July 1, 2012.
This paper provides an overview of the proposed methodology for state and local agencies to identify and install NO2 near-road monitoring stations. The process described is only intended as technical assistance since unique factors may influence the siting process in a given CBSA. A case study is also included. Further details on the rationale and research supporting the proposed process will be provided in EPA’s Near-Road Monitoring Technical Assistance Document (TAD).
METHODOLOGY Once a CBSA has determined the number of NO2 near-road monitoring stations required under the revised NAAQS, the procedures described in the following sections may be followed to identify candidate monitoring sites and decide upon the final location for the permanent NO2 monitoring station. The flowchart shown in Figure 1 provides a methodology to develop a prioritized list of candidate sites for evaluation as part of implementing a near-road NO2 monitoring network.
Figure 1. Flowchart for selection of ranked candidate segments.
3
Identifying Candidate Sites
The first step in the siting process is to develop a list of candidate monitoring sites prioritized based on the potential for maximum emissions and peak NO2 concentrations. Local traffic data, including Annual Average Daily Traffic (AADT), fleet mix, and congestion indicators, provide the primary information for establishing a list of candidate sites for NO2 near-road monitoring.
Step 1. Annual Average Daily Traffic - AADT measures the total volume of traffic on a given road segment divided by the number of days a year. This parameter provides a simple way to identify and compare the relative activity and likely pollutant emissions experienced along the identified roadways. Two primary sources of traffic data can be consulted in order to obtain this information for present traffic volumes and estimated future road volumes. The 2010 Highway Performance Monitoring System (HPMS) provides data on 2008 road segment traffic volumes, while metropolitan area urban travel demand models (TDMs) can be consulted to estimate future traffic volumes on these segments.2 In addition, state Departments of Transportation (DOTs) and city-level Metropolitan Planning Organizations (MPOs) may have more updated AADT counts. As shown in Figure 1, road segments are initially ranked based on total AADT counts, with road segments ranked from highest to lowest total volume in descending order.
Step 2. Fleet Mix - While AADT describes the total traffic volume on a road, different vehicle types can emit different amounts of pollutants even for the same activity. For example, heavy-duty trucks can have emissions of nitrogen oxides much greater than light-duty passenger cars. For this reason, gathering information on the types of vehicles operating on a given road segment can also be important for identifying locations of maximum NO2 concentrations.
Step 3. Fleet-Equivalent AADT - If data exists on the number of heavy-duty vehicles on a given road segment, this information can be used to further prioritize candidate sites. Since heavy-duty vehicles emit more NOx on a per vehicle basis than light-duty vehicles, the following equation can be used to determine a Fleet-Equivalent AADT value for each road segment:
Fleet-Equivalent AADT = (AADT – HDc) + (HDm * HDc) (Eq. 1)
where:
HDc = total number of heavy-duty vehicles
HDm = multiplier to represent the increased emissions from a heavy-duty vehicle
The HDm multiplier can be obtained from national average motor vehicle emission factors, or from local estimates obtained in a given CBSA. Details on the national default HDm value,
4
as well as guidance for local municipalities to calculate their own HDm value, will be provided in the TAD. After calculating the Fleet-Equivalent AADT values, each road segment can be re-prioritized with highest Fleet-Equivalent AADT ranked first.
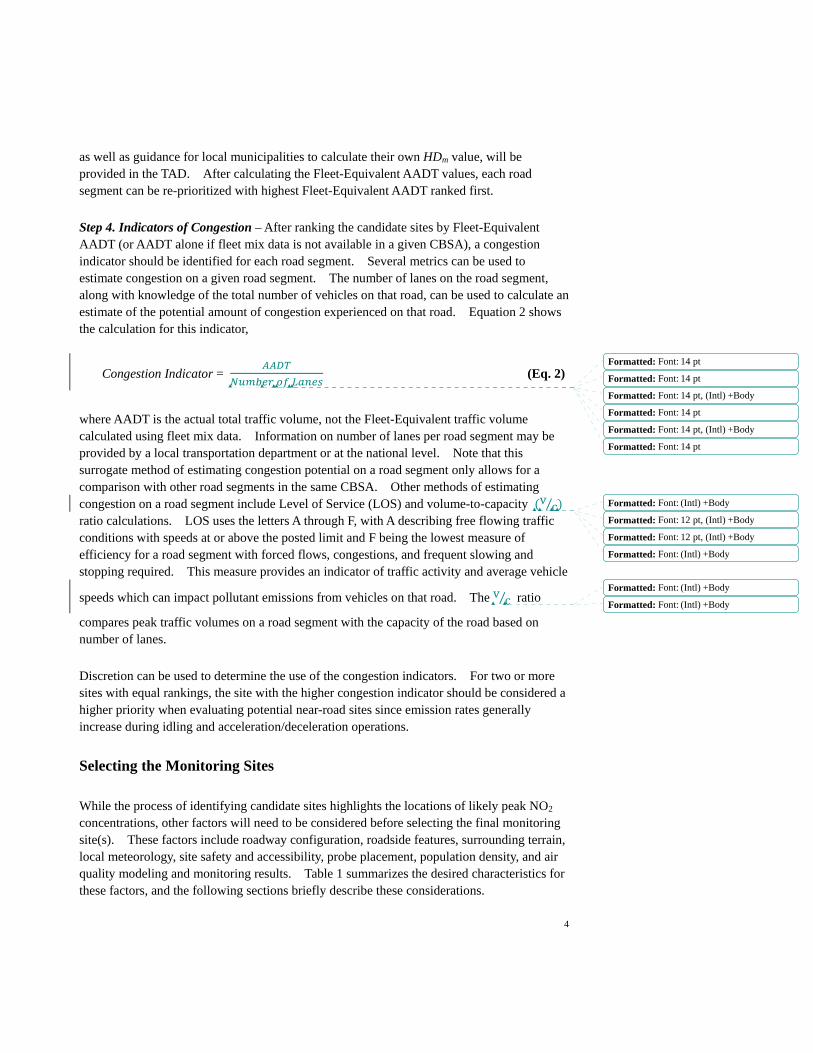
Step 4. Indicators of Congestion – After ranking the candidate sites by Fleet-Equivalent AADT (or AADT alone if fleet mix data is not available in a given CBSA), a congestion indicator should be identified for each road segment. Several metrics can be used to estimate congestion on a given road segment. The number of lanes on the road segment, along with knowledge of the total number of vehicles on that road, can be used to calculate an estimate of the potential amount of congestion experienced on that road. Equation 2 shows the calculation for this indicator,
Congestion Indicator =
(Eq. 2)
where AADT is the actual total traffic volume, not the Fleet-Equivalent traffic volume calculated using fleet mix data. Information on number of lanes per road segment may be provided by a local transportation department or at the national level. Note that this surrogate method of estimating congestion potential on a road segment only allows for a comparison with other road segments in the same CBSA. Other methods of estimating congestion on a road segment include Level of Service (LOS) and volume-to-capacity v c⁄ ratio calculations. LOS uses the letters A through F, with A describing free flowing traffic conditions with speeds at or above the posted limit and F being the lowest measure of efficiency for a road segment with forced flows, congestions, and frequent slowing and stopping required. This measure provides an indicator of traffic activity and average vehicle
speeds which can impact pollutant emissions from vehicles on that road. The v c⁄ ratio
compares peak traffic volumes on a road segment with the capacity of the road based on number of lanes.
Discretion can be used to determine the use of the congestion indicators. For two or more sites with equal rankings, the site with the higher congestion indicator should be considered a higher priority when evaluating potential near-road sites since emission rates generally increase during idling and acceleration/deceleration operations.
Selecting the Monitoring Sites While the process of identifying candidate sites highlights the locations of likely peak NO2 concentrations, other factors will need to be considered before selecting the final monitoring site(s). These factors include roadway configuration, roadside features, surrounding terrain, local meteorology, site safety and accessibility, probe placement, population density, and air quality modeling and monitoring results. Table 1 summarizes the desired characteristics for these factors, and the following sections briefly describe these considerations.
Formatted: Font: 14 pt
Formatted: Font: 14 pt
Formatted: Font: 14 pt, (Intl) +Body
Formatted: Font: 14 pt
Formatted: Font: 14 pt, (Intl) +Body
Formatted: Font: 14 pt
Formatted: Font: (Intl) +Body
Formatted: Font: 12 pt, (Intl) +Body
Formatted: Font: 12 pt, (Intl) +Body
Formatted: Font: (Intl) +Body
Formatted: Font: (Intl) +Body
Formatted: Font: (Intl) +Body
5
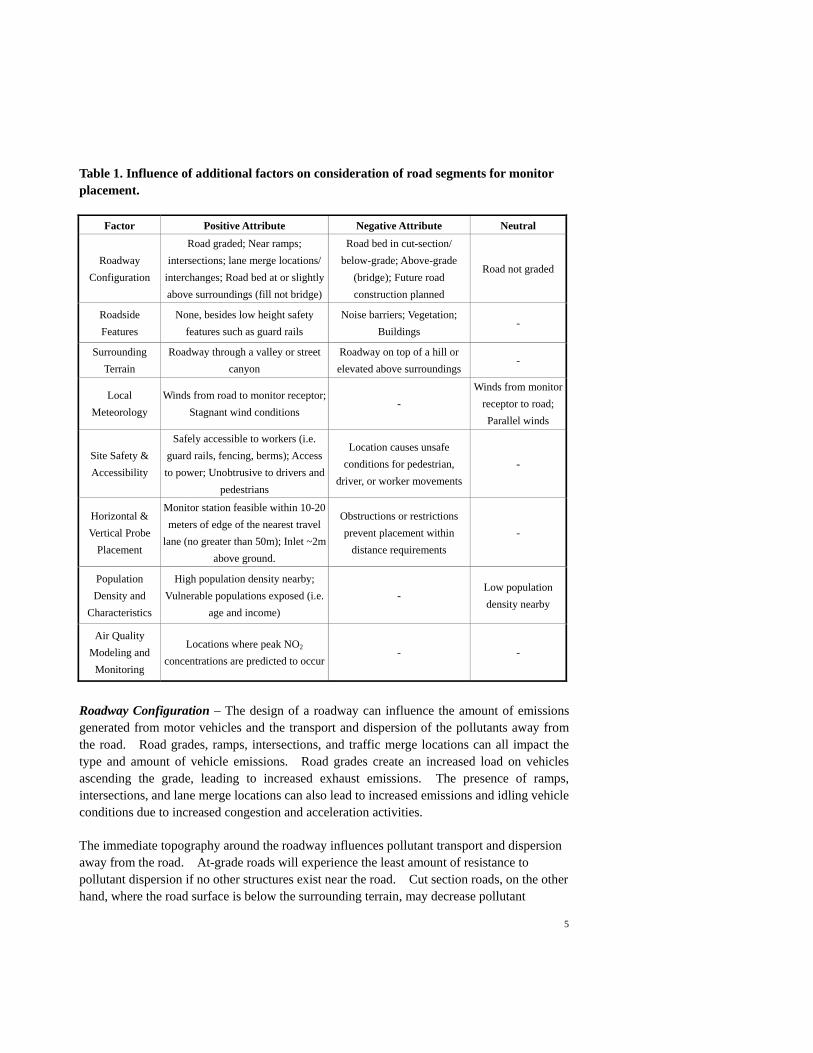
Table 1. Influence of additional factors on consideration of road segments for monitor placement.
Factor Positive Attribute Negative Attribute Neutral
Roadway
Configuration
Road graded; Near ramps;
intersections; lane merge locations/
interchanges; Road bed at or slightly
above surroundings (fill not bridge)
Road bed in cut-section/
below-grade; Above-grade
(bridge); Future road
construction planned
Road not graded
Roadside
Features
None, besides low height safety
features such as guard rails
Noise barriers; Vegetation;
Buildings -
Surrounding
Terrain
Roadway through a valley or street
canyon
Roadway on top of a hill or
elevated above surroundings -
Local
Meteorology
Winds from road to monitor receptor;
Stagnant wind conditions -
Winds from monitor
receptor to road;
Parallel winds
Site Safety &
Accessibility
Safely accessible to workers (i.e.
guard rails, fencing, berms); Access
to power; Unobtrusive to drivers and
pedestrians
Location causes unsafe
conditions for pedestrian,
driver, or worker movements
-
Horizontal &
Vertical Probe
Placement
Monitor station feasible within 10-20
meters of edge of the nearest travel
lane (no greater than 50m); Inlet ~2m
above ground.
Obstructions or restrictions
prevent placement within
distance requirements
-
Population
Density and
Characteristics
High population density nearby;
Vulnerable populations exposed (i.e.
age and income)
- Low population
density nearby
Air Quality
Modeling and
Monitoring
Locations where peak NO2
concentrations are predicted to occur - -
Roadway Configuration – The design of a roadway can influence the amount of emissions generated from motor vehicles and the transport and dispersion of the pollutants away from the road. Road grades, ramps, intersections, and traffic merge locations can all impact the type and amount of vehicle emissions. Road grades create an increased load on vehicles ascending the grade, leading to increased exhaust emissions. The presence of ramps, intersections, and lane merge locations can also lead to increased emissions and idling vehicle conditions due to increased congestion and acceleration activities. The immediate topography around the roadway influences pollutant transport and dispersion away from the road. At-grade roads will experience the least amount of resistance to pollutant dispersion if no other structures exist near the road. Cut section roads, on the other hand, where the road surface is below the surrounding terrain, may decrease pollutant
6
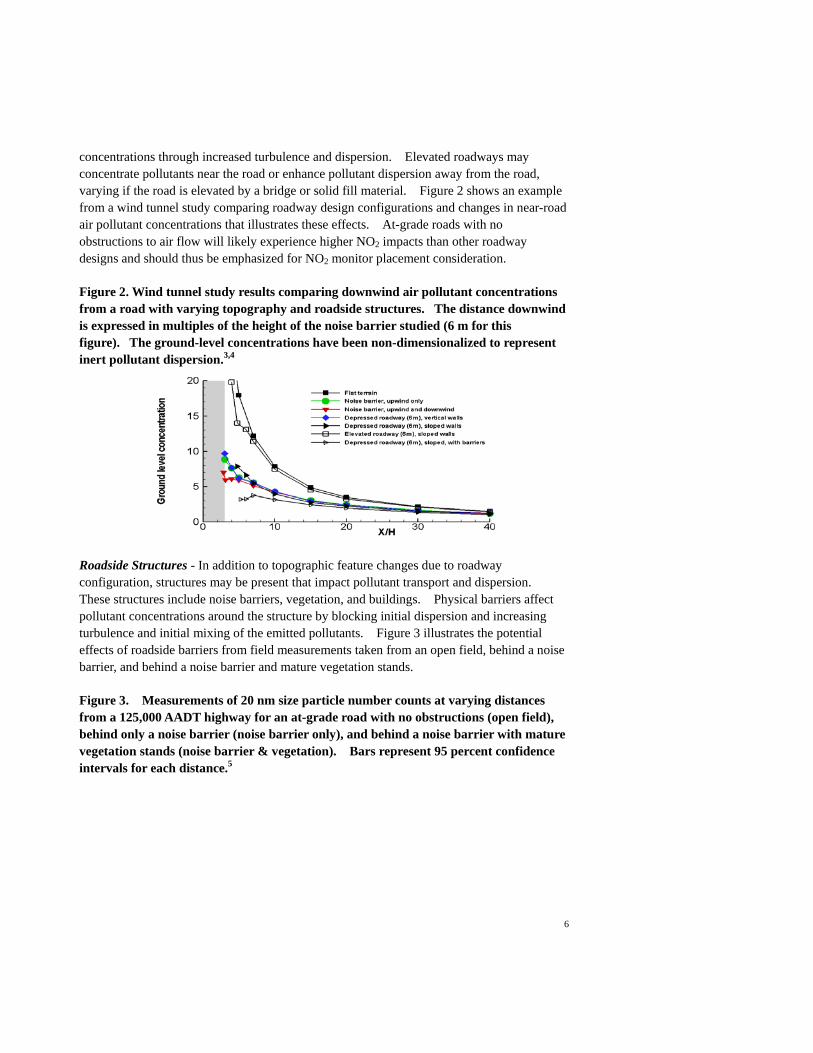
concentrations through increased turbulence and dispersion. Elevated roadways may concentrate pollutants near the road or enhance pollutant dispersion away from the road, varying if the road is elevated by a bridge or solid fill material. Figure 2 shows an example from a wind tunnel study comparing roadway design configurations and changes in near-road air pollutant concentrations that illustrates these effects. At-grade roads with no obstructions to air flow will likely experience higher NO2 impacts than other roadway designs and should thus be emphasized for NO2 monitor placement consideration.
Figure 2. Wind tunnel study results comparing downwind air pollutant concentrations from a road with varying topography and roadside structures. The distance downwind is expressed in multiples of the height of the noise barrier studied (6 m for this figure). The ground-level concentrations have been non-dimensionalized to represent inert pollutant dispersion.3,4
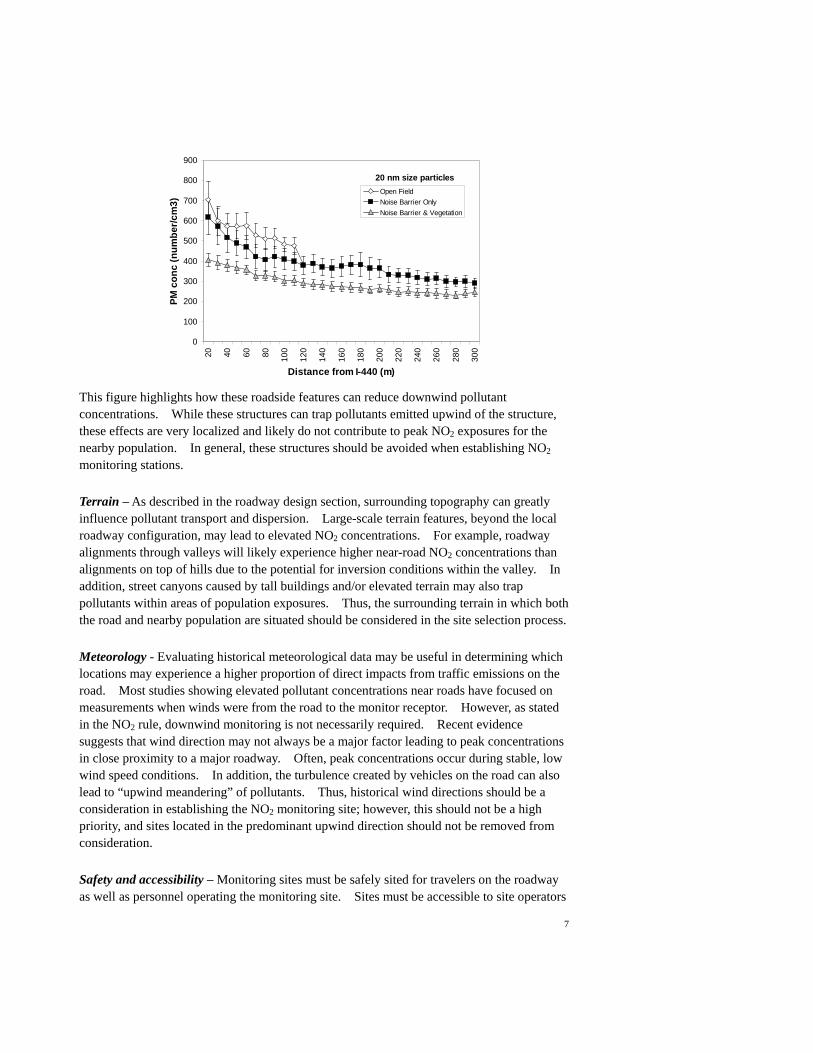
Roadside Structures - In addition to topographic feature changes due to roadway configuration, structures may be present that impact pollutant transport and dispersion. These structures include noise barriers, vegetation, and buildings. Physical barriers affect pollutant concentrations around the structure by blocking initial dispersion and increasing turbulence and initial mixing of the emitted pollutants. Figure 3 illustrates the potential effects of roadside barriers from field measurements taken from an open field, behind a noise barrier, and behind a noise barrier and mature vegetation stands.
Figure 3. Measurements of 20 nm size particle number counts at varying distances from a 125,000 AADT highway for an at-grade road with no obstructions (open field), behind only a noise barrier (noise barrier only), and behind a noise barrier with mature vegetation stands (noise barrier & vegetation). Bars represent 95 percent confidence intervals for each distance.5
7
This figure highlights how these roadside features can reduce downwind pollutant concentrations. While these structures can trap pollutants emitted upwind of the structure, these effects are very localized and likely do not contribute to peak NO2 exposures for the nearby population. In general, these structures should be avoided when establishing NO2 monitoring stations.
Terrain – As described in the roadway design section, surrounding topography can greatly influence pollutant transport and dispersion. Large-scale terrain features, beyond the local roadway configuration, may lead to elevated NO2 concentrations. For example, roadway alignments through valleys will likely experience higher near-road NO2 concentrations than alignments on top of hills due to the potential for inversion conditions within the valley. In addition, street canyons caused by tall buildings and/or elevated terrain may also trap pollutants within areas of population exposures. Thus, the surrounding terrain in which both the road and nearby population are situated should be considered in the site selection process.
Meteorology - Evaluating historical meteorological data may be useful in determining which locations may experience a higher proportion of direct impacts from traffic emissions on the road. Most studies showing elevated pollutant concentrations near roads have focused on measurements when winds were from the road to the monitor receptor. However, as stated in the NO2 rule, downwind monitoring is not necessarily required. Recent evidence suggests that wind direction may not always be a major factor leading to peak concentrations in close proximity to a major roadway. Often, peak concentrations occur during stable, low wind speed conditions. In addition, the turbulence created by vehicles on the road can also lead to “upwind meandering” of pollutants. Thus, historical wind directions should be a consideration in establishing the NO2 monitoring site; however, this should not be a high priority, and sites located in the predominant upwind direction should not be removed from consideration.
Safety and accessibility – Monitoring sites must be safely sited for travelers on the roadway as well as personnel operating the monitoring site. Sites must be accessible to site operators
20 nm size particles
0
100
200
300
400
500
600
700
800
900
20 40 60 80 100
120
140
160
180
200
220
240
260
280
300
Distance from I-440 (m)
PM
co
nc
(n
um
be
r/c
m3
)
Open Field
Noise Barrier Only
Noise Barrier & Vegetation

8
in a safe and legal manner, with a preference for sites having guard rails, fencing, or a berm between the roadway and the site. They also must not pose a safety hazard to drivers, pedestrians, and nearby residents. Safety hazards to drivers can include accidents, obstructions to sight lines, and distractions, while obstructions to pedestrians include blocking safe movement along the road. Establishing NO2 monitoring stations will require working with state Departments of Transportation (DOTs) and local planning and zoning authorities to ensure a safe and accessible site. Additionally, existing access to power at the site location is a considerable asset.
Horizontal and Vertical Probe Placement – Two requirements related to horizontal and vertical probe placement were specified by the EPA in siting the NO2 monitoring sites. First, the sites are “required to have the sampler inlet between 2 and 7 meters above ground level.” Second, the horizontal placement of the monitor probe with respect to the target roadway states that “in siting near-road NO2 monitors as required…the monitor probe shall be as near as practicable to the outside nearest edge of the traffic lanes of the target road segment; but shall not be located at a distance greater than 50 meters, in the horizontal, from the outside nearest edge of the traffic lanes of the target road segment.” When evaluating candidate sites, locations which can support a station close to the road (within 10 to 20 meters of the edge of the nearest travel lane) with a sampling inlet near human breathing height (approximately 2 meters above ground) should be prioritized. These requirements are subject to the factors described previously in this section. For example, if a station is being considered next to an elevated fill section of road, the sampler inlet should be as close to the elevation of the road as possible, and the station may need to be located further from the nearest travel edge to avoid the plume passing over the probe. In addition, if a station will be located in the predominately upwind direction of a road segment, the station should be as close as feasible to the road.
Population Density and Characteristics - If more than one site is identified as having a high potential for peak NO2 concentrations, demographic and socioeconomic data for the populations living near these sites should be considered in the final site selection. A site that measures ambient exposures to the most vulnerable populations should be considered, in particular. The identification of vulnerable populations may be based on factors such as age (children/elderly) and income level. Census-level demographic information can be freely accessed and downloaded from a number of websites.
Air Quality Modeling and Monitoring – In addition or in lieu of the methodology described above, state and local air agencies may elect to conduct air quality emissions and dispersion modeling and/or air quality monitoring to assist in the determination of locations where peak NO2 concentrations are likely to occur. Detailed assistance on conducting a modeling or monitoring assessment for the purposes of siting an NO2 near-road monitor station is beyond the scope of this paper. However, EPA will provide this guidance in the NO2 monitoring TAD.
9
Preliminary Pilot Study: Tampa CBSA
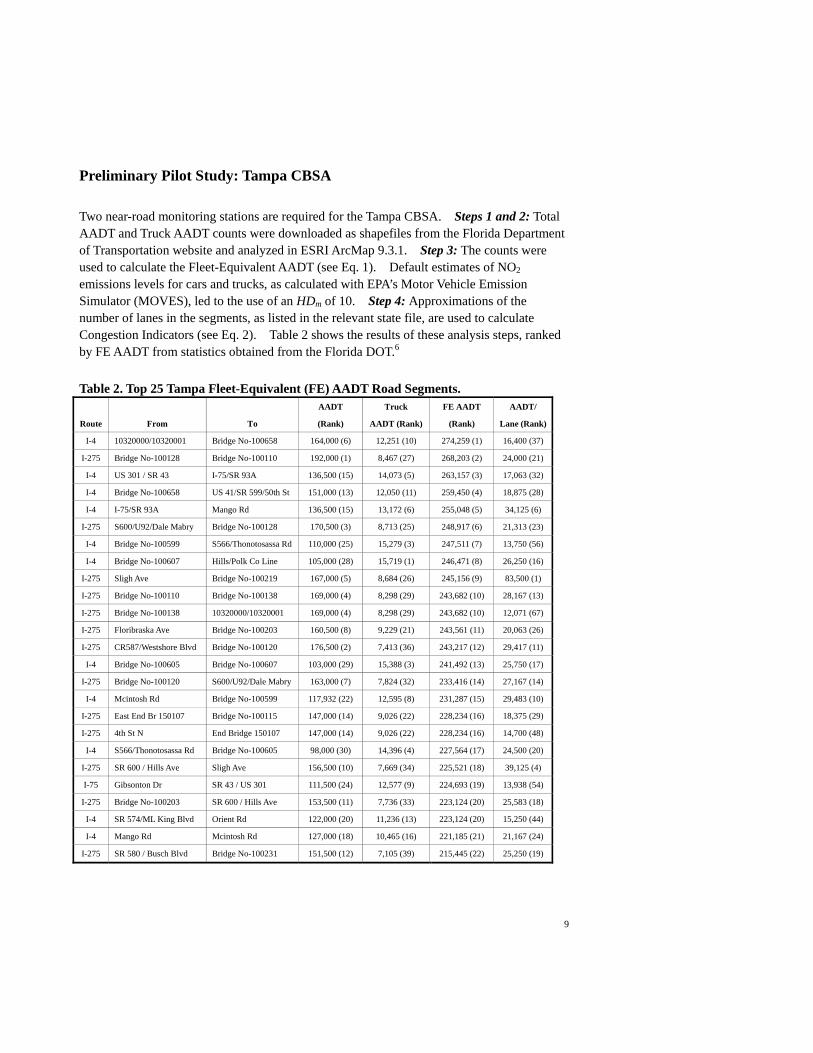
Two near-road monitoring stations are required for the Tampa CBSA. Steps 1 and 2: Total AADT and Truck AADT counts were downloaded as shapefiles from the Florida Department of Transportation website and analyzed in ESRI ArcMap 9.3.1. Step 3: The counts were used to calculate the Fleet-Equivalent AADT (see Eq. 1). Default estimates of NO2 emissions levels for cars and trucks, as calculated with EPA’s Motor Vehicle Emission Simulator (MOVES), led to the use of an HDm of 10. Step 4: Approximations of the number of lanes in the segments, as listed in the relevant state file, are used to calculate Congestion Indicators (see Eq. 2). Table 2 shows the results of these analysis steps, ranked by FE AADT from statistics obtained from the Florida DOT.6
Table 2. Top 25 Tampa Fleet-Equivalent (FE) AADT Road Segments.
Route From To
AADT
(Rank)
Truck
AADT (Rank)
FE AADT
(Rank)
AADT/
Lane (Rank)
I-4 10320000/10320001 Bridge No-100658 164,000 (6) 12,251 (10) 274,259 (1) 16,400 (37)
I-275 Bridge No-100128 Bridge No-100110 192,000 (1) 8,467 (27) 268,203 (2) 24,000 (21)
I-4 US 301 / SR 43 I-75/SR 93A 136,500 (15) 14,073 (5) 263,157 (3) 17,063 (32)
I-4 Bridge No-100658 US 41/SR 599/50th St 151,000 (13) 12,050 (11) 259,450 (4) 18,875 (28)
I-4 I-75/SR 93A Mango Rd 136,500 (15) 13,172 (6) 255,048 (5) 34,125 (6)
I-275 S600/U92/Dale Mabry Bridge No-100128 170,500 (3) 8,713 (25) 248,917 (6) 21,313 (23)
I-4 Bridge No-100599 S566/Thonotosassa Rd 110,000 (25) 15,279 (3) 247,511 (7) 13,750 (56)
I-4 Bridge No-100607 Hills/Polk Co Line 105,000 (28) 15,719 (1) 246,471 (8) 26,250 (16)
I-275 Sligh Ave Bridge No-100219 167,000 (5) 8,684 (26) 245,156 (9) 83,500 (1)
I-275 Bridge No-100110 Bridge No-100138 169,000 (4) 8,298 (29) 243,682 (10) 28,167 (13)
I-275 Bridge No-100138 10320000/10320001 169,000 (4) 8,298 (29) 243,682 (10) 12,071 (67)
I-275 Floribraska Ave Bridge No-100203 160,500 (8) 9,229 (21) 243,561 (11) 20,063 (26)
I-275 CR587/Westshore Blvd Bridge No-100120 176,500 (2) 7,413 (36) 243,217 (12) 29,417 (11)
I-4 Bridge No-100605 Bridge No-100607 103,000 (29) 15,388 (3) 241,492 (13) 25,750 (17)
I-275 Bridge No-100120 S600/U92/Dale Mabry 163,000 (7) 7,824 (32) 233,416 (14) 27,167 (14)
I-4 Mcintosh Rd Bridge No-100599 117,932 (22) 12,595 (8) 231,287 (15) 29,483 (10)
I-275 East End Br 150107 Bridge No-100115 147,000 (14) 9,026 (22) 228,234 (16) 18,375 (29)
I-275 4th St N End Bridge 150107 147,000 (14) 9,026 (22) 228,234 (16) 14,700 (48)
I-4 S566/Thonotosassa Rd Bridge No-100605 98,000 (30) 14,396 (4) 227,564 (17) 24,500 (20)
I-275 SR 600 / Hills Ave Sligh Ave 156,500 (10) 7,669 (34) 225,521 (18) 39,125 (4)
I-75 Gibsonton Dr SR 43 / US 301 111,500 (24) 12,577 (9) 224,693 (19) 13,938 (54)
I-275 Bridge No-100203 SR 600 / Hills Ave 153,500 (11) 7,736 (33) 223,124 (20) 25,583 (18)
I-4 SR 574/ML King Blvd Orient Rd 122,000 (20) 11,236 (13) 223,124 (20) 15,250 (44)
I-4 Mango Rd Mcintosh Rd 127,000 (18) 10,465 (16) 221,185 (21) 21,167 (24)
I-275 SR 580 / Busch Blvd Bridge No-100231 151,500 (12) 7,105 (39) 215,445 (22) 25,250 (19)
10
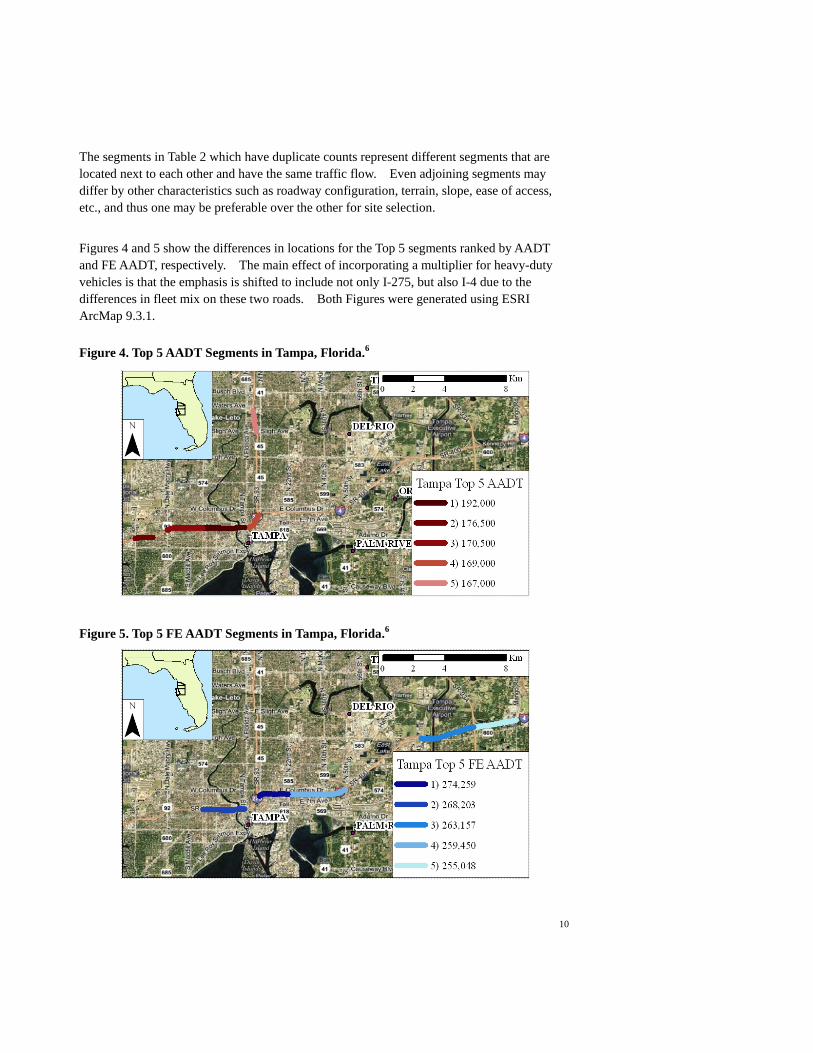
The segments in Table 2 which have duplicate counts represent different segments that are located next to each other and have the same traffic flow. Even adjoining segments may differ by other characteristics such as roadway configuration, terrain, slope, ease of access, etc., and thus one may be preferable over the other for site selection.
Figures 4 and 5 show the differences in locations for the Top 5 segments ranked by AADT and FE AADT, respectively. The main effect of incorporating a multiplier for heavy-duty vehicles is that the emphasis is shifted to include not only I-275, but also I-4 due to the differences in fleet mix on these two roads. Both Figures were generated using ESRI ArcMap 9.3.1.
Figure 4. Top 5 AADT Segments in Tampa, Florida.6
Figure 5. Top 5 FE AADT Segments in Tampa, Florida.6

11
SUMMARY With new requirements for near-road NO2 monitoring, guidance is needed on identifying and selecting the locations where peak concentrations are likely to occur. A simple method has been proposed to assist state and local agencies in identifying these potential locations based on metrics of traffic activity. Guidance is also given on how other factors may influence the site selection process. This information is important for state and local agencies required to establish these monitoring sites, as well as other professionals who will be evaluating and interpreting the data from this new monitoring network.
REFERENCES 1 Environmental Protection Agency. Minimum NO2 Monitor Requirements.
http://www.epa.gov/oaqps001/nitrogenoxides/pdfs/MinimumNO2MonitorRequirements.pdf
2 National Transportation Atlas Database. Bureau of Transportation Statistics. http://www.bts.gov/publications/national_transportation_atlas_database/2010/ (Accessed January 2011).
3 Heist, D.K.; Perry, S.G; Brixey L.A. A wind tunnel study on the effect of roadway configurations on the dispersion of traffic-related pollution. Atmos. Env. 2009, 43, 5101-5111.
4 Baldauf, R.; Watkins, N.; Heist, D.; Bailey, C.; Rowley, P.; Shores, R. Near-road air quality monitoring: Factors affecting network design and interpretation of data. Air Qual. Atmos. Health, 2009, 2, 1-9.
5 Baldauf, R.W., A. Khlystov, V. Isakov, E. Thoma, G.E. Bowker, T. Long, R. Snow. Impacts of Noise Barriers on Near-Road Air Quality. Atmos Environ, 2008, 42, 7502–7507.
6 Florida Department of Transportation. Traffic Data. http://www.dot.state.fl.us/planning/statistics/gis/trafficdata.shtm. Publication Date 1-29-2011.
KEYWORDS Air Quality, Nitrogen dioxide, Near-road, Motor Vehicle Emissions