Implementation and Evaluation of an SDN Management System on the SAVI ... · Virtualized...
124
IMPLEMENTATION AND EVALUATION OF AN SDN MANAGEMENT SYSTEM ON THE SAVI TESTBED by Thomas Ken-Hsing Lin A thesis submitted in conformity with the requirements for the degree of Master of Applied Science Edward S. Rogers Sr. Department of Electrical and Computer Engineering University of Toronto © Copyright 2014 by Thomas Ken-Hsing Lin
-
Upload
nguyencong -
Category
Documents
-
view
217 -
download
0
Transcript of Implementation and Evaluation of an SDN Management System on the SAVI ... · Virtualized...

IMPLEMENTATION AND EVALUATION OF AN SDN MANAGEMENT
SYSTEM ON THE SAVI TESTBED
by
Thomas Ken-Hsing Lin
A thesis submitted in conformity with the requirements for the degree of Master of Applied Science
Edward S. Rogers Sr. Department of Electrical and Computer Engineering
University of Toronto
© Copyright 2014 by Thomas Ken-Hsing Lin

Abstract
Implementation and Evaluation of an SDN Management System on the SAVI Testbed
Thomas Ken-Hsing Lin Master of Applied Science
Edward S. Rogers Sr. Department of Electrical and Computer Engineering University of Toronto
2014
Distributed computing applications often require a variety of infrastructure components,
such as storage, computing power, and network access, in order to be deployed. In recent
years, the IaaS model of cloud computing has significantly reduced the cost of storage
and computing power, thus lowering barriers for developers who wish to deploy such
applications. However, allowing administrators and users to exercise fine-grained control
over the network fabric itself has been an elusive feature. The Smart Applications on
Virtualized Infrastructure (SAVI) testbed is an IaaS cloud aimed at empowering
researchers to deploy novel applications and experiments. One of the key traits of the
testbed is its attempt to virtualize the entire infrastructure, including non-conventional
resources such as FPGAs and wireless access points, while enabling researchers the
ability to carry out fine-grained traffic control. This thesis documents the
implementation and evaluation of an SDN management system for the SAVI testbed,
using a novel infrastructure management concept known as software-defined
infrastructure.
ii

Acknowledgements
It’s been a long 3.5 years completing this Masters, and I’ve grown so much both academically and as a person. Too many people to thank for helping me get through these past years, and too little time. Here’s the short list, and much apologies for anyone I forgot to mention.
To my parents, for their unwavering support and belief in me. To my supervisor, Prof. Leon-Garcia, for believing and taking a chance in me, and for his continual advice, guidance, and support. To my project manager, Hadi Bannazadeh, for his continual technical support and pushing me to find my new limits. To the original SAVI testbed team, Eliot, Hesam, Mo, and Eric, for the great experience working with such smart individuals. To Prof. Liebeherr, for teaching me all the fundamentals of networking, which gave me a solid background for my Masters work, and for serving in my thesis committee. To the staff in the ECE graduate office, and to Vladi, for their administrative support. To my colleagues within the ALG group, for some fascinating conversations and memories, an interesting bunch indeed. To the SAVI team in McGill, for their technical help with the wireless virtualization work. To all the friends I made during my time at UofT, for helping keep me sane and preventing me from becoming a lonely hermit. To the workers in the food industry (specifically, Canton Chili, Tim Hortons, Ideal Catering truck, Wokking on Wheels truck, the no-name white Chinese food truck, 7-11, Subway, and Cora’s Pizza), for helping nourish me with sustenance and caffeine which fuelled my Master’s degree work. To the barkeeps… for you-know-what. Thank you all so much.
On to the next one.
iii

Contents
1 Introduction & Background ................................................................. 1
1.1 From Traditional Networking to Software-Defined Networking .................... 3
1.1.1 OpenFlow ............................................................................................ 5
1.1.2 FlowVisor ............................................................................................ 6
1.2 SAVI Project .................................................................................................. 7
1.2.1 OpenStack ......................................................................................... 10
1.2.2 Testbed Management Requirements ................................................. 12
1.3 Software-Defined Infrastructure ................................................................... 13
1.3.1 Infrastructure-Aware Network Manager ........................................... 14
1.4 Thesis Organization ...................................................................................... 16
2 Design of the SAVI SDI Manager ...................................................... 17
2.1 Design of the SDI Modular Framework........................................................ 18
2.1.1 Requirement Analysis ........................................................................ 19
2.1.2 API Servers ....................................................................................... 20
2.1.3 Central Database ............................................................................... 21
2.1.4 Shared Events Channel ..................................................................... 21
2.1.5 External Component Drivers ............................................................. 22
2.2 Design of SDI Network Control Module ....................................................... 22
2.2.1 Requirements Analysis ...................................................................... 23
2.2.2 SDN Controller Drivers ..................................................................... 24
2.2.3 Event Notifications ............................................................................ 24
2.2.4 Network State Context ...................................................................... 25
2.2.5 Network Control Logic ...................................................................... 26
2.3 Network Slicing ............................................................................................ 26
iv

3 Implementation of Janus .................................................................... 28
3.1 Programming Language Alternatives ........................................................... 28
3.1.1 C/C++ .............................................................................................. 29
3.1.2 Java ................................................................................................... 29
3.1.3 Python ............................................................................................... 30
3.1.4 Discussion and Conclusion ................................................................ 31
3.2 Janus Framework Implementation ............................................................... 32
3.2.1 RESTful Service ................................................................................ 32
3.2.2 External Component Drivers ............................................................. 33
3.2.3 MySQL Database .............................................................................. 34
3.2.4 Module Manager ................................................................................ 35
3.3 Network Control Module .............................................................................. 37
3.3.1 Initial Network Manager Implementation ......................................... 38
3.3.2 OpenFlow Interface Layer ................................................................. 39
3.3.3 RESTful APIs and Events ................................................................ 40
3.3.4 FlowVisor Driver & Network Slicing ................................................. 43
3.4 Janus-Plugin for Quantum & Nova .............................................................. 44
3.5 Current SAVI SDN Application ................................................................... 45
3.6 Preliminary Evaluation ................................................................................ 48
3.6.1 Scope and Methodology ..................................................................... 48
3.6.2 Results and Discussion ...................................................................... 52
3.6.3 Conclusion ......................................................................................... 60
4 Scaling of Janus SDN System ............................................................ 62
4.1 Analysis of Initial Implementation ............................................................... 62
4.1.1 CPU Frequency Scaling Governor..................................................... 63
4.1.2 Python Global Interpreter Lock ........................................................ 64
4.1.3 Greenthreading .................................................................................. 66
v

4.1.4 Discussion .......................................................................................... 69
4.2 Stabilizing Performance ................................................................................ 70
4.3 Web Service Scaling Techniques .................................................................. 74
4.3.1 Multi-Processing Versions of Janus and Ryu .................................... 75
4.3.2 Load Balancing .................................................................................. 78
4.4 Distribution of FlowVisor ............................................................................. 78
4.4.1 Design and Implementation of FlowVisor Agent .............................. 79
4.5 Re-evaluation ................................................................................................ 80
4.5.1 Results and Discussions ..................................................................... 80
4.6 Future Scalability Work ............................................................................... 82
5 Control of E2E Network Virtualization ............................................. 85
5.1 Integration of WAPs into SAVI ................................................................... 85
5.2 Traffic Control Demonstration ..................................................................... 87
5.2.1 Demonstration Setup ......................................................................... 87
5.2.2 Results and Discussions ..................................................................... 89
6 Conclusion .......................................................................................... 92
6.1 Future Work ................................................................................................. 93
References .............................................................................................. 94
Appendix A: Network Control Module APIs ...................................... 103
Appendix B: Ryu OpenFlow APIs ....................................................... 108
Appendix C: Network Control Module Database Schemas ................. 110
vi

List of Tables
Table 3.1: Ryu Forwarding Throughput Comparison (HAProxy vs No Proxy) .......... 56
Table 3.2: Web Server Performance Measurements ..................................................... 58
Table 4.1: Updated Web Server Performance Measurements ...................................... 70
vii

List of Figures
Figure 1.1: Supported packet header fields in OpenFlow 1.0 ......................................... 5
Figure 1.2: FlowVisor virtualizes network hardware for multiple network controllers .. 6
Figure 1.3: Multi-tier SAVI Testbed .............................................................................. 8
Figure 1.4: Current SAVI Testbed Deployment ............................................................. 9
Figure 1.5: SAVI SDI Resource Management System (RMS) ...................................... 14
Figure 1.6: Pre-SDI SAVI Architecture ........................................................................ 15
Figure 2.1: High-level architecture of SDI modular framework .................................... 20
Figure 3.1: Pseudo-code for Janus start-up procedure ................................................. 36
Figure 3.2: The SDI manager with OpenStack and OpenFlow proxy controllers ........ 37
Figure 3.3: OpenFlow Interface (OFI) layer OFI abstracts the network from Janus .. 39
Figure 3.4: Overview of the Network Control Module ................................................. 42
Figure 3.5: Packet Handling Logic of the SAVI Edge Isolation Application ............... 46
Figure 3.6: Pseudo-code for flow installation involving bonded ingress & egress ports 47
Figure 3.7: Experimental Setup of Throughput Measurement ..................................... 50
Figure 3.8: Packet processing latency vs. Increasing # of switches Single Janus SDN system; Cbench in latency mode .................................................................................. 52
Figure 3.9: Throughput vs. Increasing # of switches Single Janus SDN system; Cbench in throughput mode ...................................................................................................... 53
Figure 3.10: Constant # of switches. Throughput vs. # of Janus SDN systems ......... 54
Figure 3.11: Packet Throughput vs. # of Network Control Modules Running SAVI Edge Isolation application on each module .................................................................. 57
viii

Figure 3.12: Packet-In Requests to the network control module in the SAVI Core node .............................................................................................................................. 59
Figure 4.1: Setup for isolating and benchmarking Janus ............................................. 64
Figure 4.2: Janus Web Server Rx. Rate vs # of Concurrent ApacheBench Tx. ......... 65
Figure 4.3: Benchmarking Ryu API server with simultaneous OpenFlow packet forwarding ..................................................................................................................... 69
Figure 4.4: Updated Janus Throughput Measurements Janus Web Server Rx. Rate vs # of Concurrent ApacheBench Tx. .............................................................................. 71
Figure 4.5: Psuedo-code of packet forwarding rate limiter & Output queue checkpoint ...................................................................................................................................... 73
Figure 4.6: Updated Throughput vs Increasing # of switches Single Janus SDN system; Cbench in throughput mode ............................................................................ 74
Figure 4.7: Multi-Process API Servers (Top: Janus APIs; Bottom: Ryu APIs) .......... 76
Figure 4.8: Fully Multi-Proc Ryu and Janus ............................................................... 77
Figure 4.9: Packet processing latency vs. Increasing # of switches Single Janus SDN system; Cbench in latency mode .................................................................................. 81
Figure 4.10: Throughput vs. Increasing # of switches Single Janus SDN system; Cbench in throughput mode ......................................................................................... 82
Figure 5.1: Process Flow of Mobile Client Joining/Leaving Testbed ........................... 86
Figure 5.2: Traffic Control Demonstration Setup ........................................................ 88
Figure 5.3: Video Profile ............................................................................................... 89
Figure 5.4: Video Profile /w No Traffic Control .......................................................... 89
Figure 5.5: Video Profile /w Traffic Control ................................................................ 90
ix
List of Appendices
Appendix A: Network Control Module APIs .............................................................. 103
Appendix B: Ryu OpenFlow APIs .............................................................................. 108
Appendix C: Network Control Module Database Schemas ......................................... 110
x

Acronyms and Abbreviations
AMD Advanced Micro Devices
AMQP Advanced Message Queuing Protocol
ANSI American National Standards Institute
API Application Programming Interface
ARPA Advanced Research Projects Agency
BM Baremetal
BSSID Basic Service Set Identification
C&M Control and Management
CANARIE Canadian Network for the Advancement of Research, Industry, and Education
CPU Central Processing Unit
DHCP Dynamic Host Configuration Protocol
E2E End to End
GENI Global Environment for Network Innovations
GIL Global Interpreter Lock
GSM Global System for Mobile Communications
HDD Hard Drive
HTB Hierarchical Token Bucket
HTTP Hypertext Transfer Protocol
xi

I/O Input and Output
IaaS Infrastructure as a Service
IAM Identity and Access Management
ICMP Internet Control Message Protocol
IP Internet Protocol
IPC Inter-Process Communication
ISO International Organization for Standardization
ITU International Telecommunication Union
JSON JavaScript Object Notation
MAC Media Access Control
NGN Next Generation Network
NTT Nippon Telegraph and Telephone
OFI OpenFlow Interface
ORION Ontario Research and Innovation Optical Network
OS Operating System
OVS Open vSwitch
PCI Peripheral Component Interconnect
QoS Quality of Service
RAM Random Access Memory
REST Representation State Transfer
RMS Resource Management System
xii

RPC Remote Procedure Call
SAVI Smart Applications on Virtual Infrastructure
SDI Software-Defined Infrastructure
SDN Software-Defined Network
SQL Structured Query Language
SSD Solid State Drive
SSID Service Set Identification
TCP Transmission Control Protocol
UDP User Datagram Protocol
URL Uniform Resource Locator
VM Virtual Machine
VPN Virtual Private Network
WAP Wireless Access Point
xiii

1
Chapter 1
Introduction & Background
What we know today as the Internet has revolutionized our world, much like past communication milestones such as the telegraph, telephone, radio, and the telephone. Within the last two decades, the Internet has played a key role in the development of new applications and services, especially those offered via methods of “cloud computing” [1]. Cloud computing is a general term which describes the delivery of a service over a networked connection (i.e. the service comes from “the cloud”), whereby the user need not be concerned with how the service is implemented or operated, just that it is transparently available. While the terms “cloud computing” and “the cloud” may not have been in the public vernacular until sometime within the last decade, it is important to note that the concept itself has been around for much longer. One of the key drivers of cloud computing is the concept of virtualization, wherein a single resource may be partitioned into several virtual resources to be shared amongst different users in a way that is transparent to them. From the user’s point of view, the resource is fully theirs to utilize, and they are blind to the existence of the other virtual resources. Cloud computing is often broken down into three types of service models, each reflecting a different level of virtualization: Software as a Service (SaaS), Platform as a Service (PaaS), and Infrastructure as a Service (Iaas) [1]. The SaaS model virtualizes and delivers software and software resources over the Internet to end-users. PaaS, on the other hand, is the virtualization and delivery of platform level resources (e.g. application development and deployment tools) over the Internet. Finally, IaaS aims to virtualize and deliver infrastructure-level services such as storage, computing, and some aspects of networking for users who are not able to purchase their own physical infrastructure. The PaaS and IaaS models support application enablement by offering the tools and resources necessary for users to develop and deploy their own distributed computing applications.

2
The proper operation of distributed computing applications often relies on several types of resources. At a high level, these resources can be grouped into three categories: data storage, networking, and computing. A truly flexible application platform should ideally present the ability to elastically provision and decommission each of these resource types on-the-fly, and offer them as a virtualized service to users who wish to use them in the development and delivery of new contents, applications, and services. Such a virtualized application platform would also be ideal as a testbed for researchers engaging in experimentation regarding Future Internet protocols, architectures, and applications. The Smart Applications on Virtualized Infrastructure (SAVI) [2] project includes an attempt to realize such a testbed. The SAVI testbed aims to provide researchers in both academia and industry the ability to conduct their exploratory research on a virtualized infrastructure at scale. While there currently exists other research testbeds that also aim to facilitate at-scale experimentation by researchers [3] [4] [5] [6], the SAVI testbed aims to fully virtualize the infrastructure to enable the flexible and elastic use of the available resources.
The SAVI project postulates that a virtualized application platform requires an effective converged management system that is constantly aware of the state and allocation of all resources of all types, either physical or virtual, in order to leverage the full flexibility and advantages of a virtualized infrastructure. Consider an application, such as a streaming video service, whose efficient and effective performance is influenced by both the state of the underlying compute resources, as well as the network conditions. The application must be able to satisfy certain quality of service metrics, and meet the service level agreements negotiated with the customers of the video service. Thus, there exists a need for a system which enables the users of the application platform to manage not only their computing resources, but also the interconnecting network elements as well.
The purpose of this thesis is to document the design, implementation, and deployment of an infrastructure-aware network management system on cloud infrastructures. The rest of this chapter will be dedicated to covering a brief history of network control and management, the SAVI project which this work directly contributes towards, the description of a novel infrastructure management concept, and finally concluding with an overall outline for this thesis.

3
1.1 From Traditional Networking to Software-Defined Networking
The global interconnection of networks that comprise the Internet is nothing short of a technological sensation. The mere idea that with just a pocket-sized access device, such as a smartphone, a person today can access a large bulk of the repository of human knowledge would have seemed ridiculous to the average man just a quarter of a century ago. The history of the Internet can be traced back to the research efforts of the Advanced Research Projects Agency (ARPA), an agency within the United States Department of Defense, to build a packet-switched network to interconnect various universities and research laboratories throughout the continental United States [7]. At the time, many of these sites had their own existing networks, and ARPA’s aim was to interconnect these individual network “islands” to enable end-to-end communication for researchers and applications [8]. The idea was that since each network island should be open to evolve independently, there would be no global centralized control over the overall end-to-end pathways. Additionally, since an intermediary island and links could go offline or suffer from intermittent failure, the network protocols that were eventually developed utilized distributed computation as a strategy to mitigate this risk. This meant that each individual packet forwarding element can compute and re-compute the packet paths through itself by communicating with its immediate neighbours, achieving a sense of self-management. This decision to use distributed computations ultimately resulted in the first version of the Internet Protocol Suite (TCP/IP) [9], which improved the robustness, reliability, and survivability of the entire network.
As the Internet continued to evolve over the next several decades, the TCP/IP suite has remained ingrained in its design. In the recent decade, under the general term of Next Generation Network (NGN), there has been efforts to consolidate all telecommunication services under a single packet-based network transport architecture. In fact, the ITU-T’s official definition declares that one of the fundamental aspects of an NGN is to be able to resolve different identification schemes to traditional Internet Protocol (IP) addresses such that they may be routed in IP networks [10]. While this may mean that the existing distributed routing protocols that control the traffic over much of the Internet may be utilized in these NGNs, they may not be able to use the link capacities in an efficient manner due to the fact that they make routing decisions on a local level. With the explosive growth of traffic on the Internet in the past decade due to the introduction of new types of services, and the continued growth forecasted in

4
the next few years [11] [12], the efficient use of the network’s capacity is growing ever more important. It is clear that continuing to use the current set of protocols and allowing the IP networks to manage themselves is not ideal in the long run.
Researchers in the field of networking have been trying to tackle these issues for a long time through the development of new traffic engineering techniques and/or new network protocols. Both methods face some sense of difficulty in being adopted and tested in wide area networks. In the case of traffic engineering, the network managers must be able to take appropriate action when the network conditions indicate that the existing paths for packet flows in the network are inefficient, which involves dynamically configuring and re-configuring static flows within the switches and routers of the network infrastructure. This requires having direct access to the packet forwarding elements within the network, something network infrastructure administrators may be reluctant to grant to researchers. With the approach of implementing new protocols, the ubiquity of the TCP/IP stack in existing systems makes the adoption of new standards both difficult and expensive. Researchers have thus turned to smaller scale testbeds and datacentres to properly test and hone their novel network management methodologies. However, the task of network management remains difficult.
Many modern day datacentre communication networks are still based on the TCP/IP protocol suite. The forwarding logic of the network are still often based on the traditional distributed protocols that come supported by the forwarding element vendor’s operating systems, which are pre-installed within each forwarding element. This makes it increasingly difficult to manage large scale datacentre networks as a datacentre can easily be comprised of switches and routers belonging to different vendors. Creating an end-to-end path for a new service may involve interacting with different interface systems with different configuration settings. In the case of a network testbed, being locked into the protocols that only the forwarding element vendor’s proprietary operating system supports makes it nearly impossible for researchers involved in Future Internet [13] protocols to experiment directly on the physical network, which would offer the most realistic environment for their experimentations. To address these issues, the emerging concept of Software-Defined Networking (SDN) [14], which decouples the network control plane from the data forwarding plane, claims to be able to simplify and improve network management. The separation of the packet forwarding elements from the management plane means that the packet forwarding logic (implemented in the management plane) can evolve separately, without the need to update/replace each
5
forwarding element. In addition, the decoupling enables the centralization of the management plane. A centralized manager has the advantage of having a global view of all the forwarding elements in the network, enabling it to see what the best end-to-end paths are, as well as quickly detect and work around any network failures. SDN has often been said to be causing a paradigm shift in the field of networking, changing how networks are planned, deployed, and operated.
1.1.1 OpenFlow
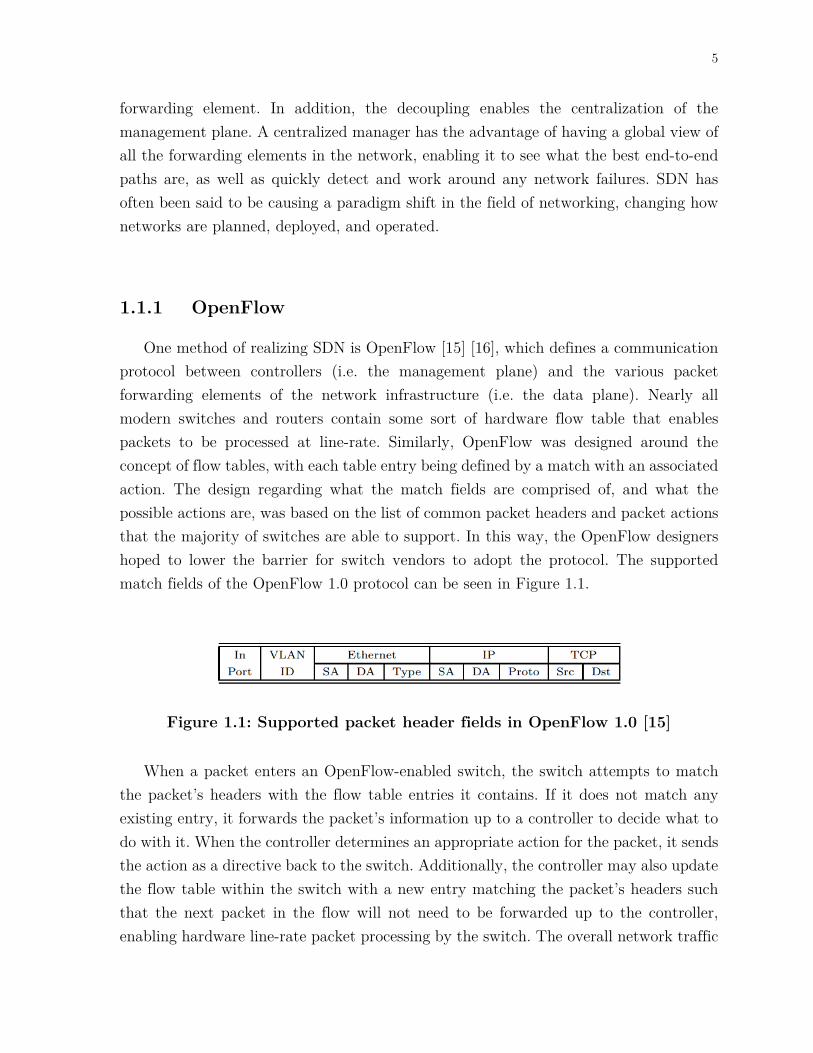
One method of realizing SDN is OpenFlow [15] [16], which defines a communication protocol between controllers (i.e. the management plane) and the various packet forwarding elements of the network infrastructure (i.e. the data plane). Nearly all modern switches and routers contain some sort of hardware flow table that enables packets to be processed at line-rate. Similarly, OpenFlow was designed around the concept of flow tables, with each table entry being defined by a match with an associated action. The design regarding what the match fields are comprised of, and what the possible actions are, was based on the list of common packet headers and packet actions that the majority of switches are able to support. In this way, the OpenFlow designers hoped to lower the barrier for switch vendors to adopt the protocol. The supported match fields of the OpenFlow 1.0 protocol can be seen in Figure 1.1.
When a packet enters an OpenFlow-enabled switch, the switch attempts to match the packet’s headers with the flow table entries it contains. If it does not match any existing entry, it forwards the packet’s information up to a controller to decide what to do with it. When the controller determines an appropriate action for the packet, it sends the action as a directive back to the switch. Additionally, the controller may also update the flow table within the switch with a new entry matching the packet’s headers such that the next packet in the flow will not need to be forwarded up to the controller, enabling hardware line-rate packet processing by the switch. The overall network traffic
Figure 1.1: Supported packet header fields in OpenFlow 1.0 [15]

6
management strategy is thus implemented as software algorithms within the controller. With SDN and OpenFlow, the management of multiple switches can be centralized, and the management interface becomes uniform across all the switches in the network that support the protocol, irrespective of the switch vendor.
1.1.2 FlowVisor
To help facilitate the goal of simultaneous experimentation on the same network infrastructure, FlowVisor [17] [18] was developed as a way to help virtualize OpenFlow-enabled networks into “slices”. Similar to an operating system hypervisor, which supports the execution of multiple guest operating systems over the physical host, FlowVisor allows multiple OpenFlow controllers to co-exist as controllers over the same set of physical network resources, with each controller controlling a slice of the network (see Figure 1.2). FlowVisor is able to virtualize the network in a manner that is transparent to both the data plane as well as the management plane, by using the same OpenFlow protocol to communicate with both planes. In essence, FlowVisor serves as a transparent OpenFlow controller proxy. Each controller may then implement their own unique network management strategy within their slice of the network.
As FlowVisor enables concurrent experimentation over the shared network infrastructure, it is also responsible for ensuring strong isolation between the various slices. It achieves this by partitioning the 12-dimensional space of all possible packet
Figure 1.2: FlowVisor virtualizes network hardware for multiple network controllers [18]

7
header combinations into subspaces, called FlowSpaces. The FlowSpaces are defined by a set of FlowSpace rules, where each rule resembles an OpenFlow flow table entry, in that they match packets based on header information. However, rather than having the match be associated with an action, it is instead associated with a controller and a policy. The policy dictates what the controller is able to do within its slice of the network infrastructure. For example, it is possible to just have a controller that does passive monitoring of network statistics, but not be able to modify the flow table entries within the network. Similar to OpenFlow flow table rules, FlowSpace rules have a priority ID in the event that points within the 12-dimensional space are overlapped by two or more subspaces. This slicing mechanism determines which controller OpenFlow messages are destined for in the northbound path (from the data plane to the management plane). In the southbound path, FlowVisor is similarly responsible for ensuring the flow attempting to be installed, or the action that the controller is attempting to execute, doesn’t violate the FlowSpace partitions. If necessary, FlowVisor will re-write southbound flow installation messages in order to enforce slice isolation. This method of network virtualization contributes to the transparency of FlowVisor, and eases the development for researchers and experimenters as they will not need to be concerned with explicitly programming their controller to avoid interference with other people’s slices.
1.2 SAVI Project
The Smart Applications on Virtual Infrastructure (SAVI) [2] project is a partnership between Canadian academic, industry, and research institutes that aim to address key challenges in designing a future applications platform and Future Internet protocols. This work is separated into five research themes:
1. Smart Applications
2. Extended Cloud Computing
3. Smart Converged Edge
4. Integrated Wireless/Optical Access
5. SAVI Application Platform Testbed

8
Key to this work is the building of the testbed (theme 5), upon which the work from the other themes, and more, may be implemented and tested. As an enabler of innovation, the SAVI application platform testbed will be designed and built as a flexible IaaS cloud, supporting the ability to virtualize all aspects of the infrastructure in order to rapidly deploy, maintain, and retire large-scale distributed applications [19]. In addition, the SAVI testbed is to support computing resources beyond that of traditional virtual machines (VMs), which are available in many IaaS clouds.
The SAVI testbed is designed to be a multi-tier cloud, comprising Core nodes, Edge nodes, and Access nodes (see Figure 1.3), each of which may be virtualized to support experiments, applications, and services belonging to different tenants [19] [20]. We define a tenant as an isolated slice of the testbed, dedicated to a single project. We note that for the purposes of this thesis, the terms tenant and project may be used interchangeably. A project may involve one or more active users, and a user may belong to several projects simultaneously.
The Core nodes are envisioned to be massive-scale datacentres, capable of supporting many resources. These massive datacentres may be strategically located at sites with renewable energy resources. By comparison, the Edge nodes are small scale datacentres. While similar in design to the Core nodes, the Edge nodes offer a wider range of available
Figure 1.3: Multi-tier SAVI Testbed [20]

9
resources. These Edge nodes are to be strategically located closer to the end-users conducting the experiments, thus facilitating applications that have low-latency requirements with more specialized resources. At the time of writing this thesis, the specialized heterogeneous computing resources available in the Edge nodes include traditional VMs, baremetal servers, general purpose graphics processing units (GPGPUs), BEE2 FPGAs [21], NetFPGAs [22] (both 1GE and 10GE), BEEcube miniBEEs [23], Terasic DE5-Net FPGAs [24], and programmable Software-Defined Radio chipsets. Finally, the Access nodes are sites connected to the Edge nodes that enable the inclusion of end-user clients into the SAVI testbed. The connection between an Access node and an Edge node is over a dedicated and secure link. Access nodes may contain a variety of connectivity options for application end-users (e.g. RJ45 Ethernet jack, Wi-Fi, GSM, and etc.) to connect and associate their client devices with a testbed project.
Figure 1.4 shows the current deployment of the SAVI testbed at the time of writing this thesis. As observed in the figure, the deployment of the SAVI testbed spans 7 operational nodes with an upcoming 8th node at Calgary (denoted by a dotted-line border). Within the province of Ontario, the nodes are interconnected via the ORION [25] network, which provides a dedicated Layer 2 optical link between the various sites. Between Ontario and other sites, the connection currently utilizes a virtual private network (VPN) over the Internet, though there are plans in the works to connect to them via the CANARIE [26] network in the near future.
The control and management of the Core and Edge datacentre nodes is a major topic of ongoing research in SAVI. As mentioned earlier in this chapter, a virtualized application platform such as the SAVI testbed would benefit greatly from having a
Figure 1.4: Current SAVI Testbed Deployment [27]

10
converged management system aware of all the resources, regardless of their type and vendor. Such a system would be simultaneously aware of the entire infrastructure, which would enable efficient resource utilization while exposing APIs to application developers to leverage the information gleamed from this global view.
1.2.1 OpenStack
To facilitate the building of an IaaS cloud infrastructure, the SAVI testbed team has leveraged the continuously evolving OpenStack [27] set of projects. OpenStack is a collection of open source projects, each aiming to deliver a different aspect of cloud service. Working together as a whole, the various OpenStack projects can be deployed to deliver an IaaS-type cloud. The various project components are interrelated and users can interact with each of them either directly through RESTful APIs [28], or through a front-end project called Horizon [29], which enables users to use a web interface as an alternative. Hundreds of companies, large and small, have joined the OpenStack project to help in its development, and many more use one or more of its projects in their IT infrastructure. One of the benefits of having a continuously evolving project as part of the open source community means that it is very likely to utilize the latest ideas and incorporate the latest technologies. In addition, bugs can be quickly root caused and fixed in a joint effort by the user community at large.
The current deployment of the SAVI testbed utilizes the following OpenStack components:
• Nova: Controller for virtualized computing resources. Considered to be the core project to a functioning IaaS system [30];
• Swift: Object storage manager, offering cloud storage of data. It was designed to store unstructured data that can grow arbitrarily large [31];
• Cinder: Provides a service for block storage, enabling the provisioning of storage devices that can be connected to a VM to act as an external hard drive [32];
• Neutron (formerly named Quantum): A project that aims to provide Networking as a Service. It was designed to be technology-agnostic by functioning

11
as a mere database, relying on vendor-specific plug-ins acting as the actuators for managing the infrastructure’s network fabric [33];
• Glance: A service providing the storage of VM images, enabling users to upload newly created images or take snapshots of existing VMs to serve as a new images [34];
• Horizon: OpenStack’s dashboard, providing a web browser-based graphical user interface (GUI) to the various OpenStack projects [29];
• Keystone: A component which provides Identity, Token, Policy, and Catalogue services for the APIs of the various OpenStack projects. It is essentially responsible for implementing Authentication and Authorization [35];
In the months prior to the completion of this thesis, the following three components were also added to expand the SAVI testbed’s capabilities:
• Ceilometer: Converged monitoring and metering component for collecting statistics on different types of resources in the infrastructure. It is designed to be extendable to enable the collection of other statistics, or even on new infrastructure resource types [36];
• Heat: An orchestration project designed to enable management over the lifecycle of applications. It relies on human-readable templates to describe the infrastructure resources necessary for an application, and allows users to boot up, modify, or retire applications in one shot [37];
• Sahara: Enables the quick provisioning and configuration of entire Apache Hadoop clusters in OpenStack, to the benefit of those engaging in big data analytics [38].
While OpenStack enables an easy deployment of an IaaS-type cloud, having central management over the entire system still presents a challenge due to the fact that some projects were designed to be able to function as a stand-alone component. In recent releases of OpenStack, there has been a shift to centralize some of the APIs for various components through the Nova component. In this way, Nova acts as a proxy for various other projects such as the Neutron networking project and the Cinder block storage project. This strategy, however, assumes that the cloud or IT administrators have

12
deployed the Nova component. Thus, there is a need for a central management system whose role is dedicated to simply communicating with the various cloud components, while offering APIs that enable users to orchestrate the services provided by said components.
1.2.2 Testbed Management Requirements
Many IaaS systems primarily offer APIs related to the computing resources of the infrastructure, such as virtual machines (VMs). This focus is understandable as hypervisor technology has made VMs ubiquitous in IaaS-type clouds as an easy and cheap way to provide computing capabilities. However, the ability for users to directly control the network is often limited, and is often offered as high level functions and services. In the case of Amazon, for example, users may allocate themselves a pool of IP addresses, configure firewall rules, or obtain load balancers [39]. Allowing users to do fine-grained network management is rare in such systems. Consider the streaming video service application mentioned at the beginning of this chapter. Having a user management system focused on just the compute with little control over the network may increase the difficulty of achieving optimal performance for such an application, as it is clear the application is inherently dependent on both resources working well in tandem. For example, if link congestion occurs in the network, the user should be able to immediately migrate any affected resources to an unaffected part of the network. Likewise, if for example a new compute resource (e.g. video server) is allocated, the user should be able to immediately install end-to-end paths through the network to deliver them to the closest customers without waiting for the network’s distributed protocols to converge. The user thus should be able to achieve some type of fine-grained control via SDN principles.
As explained in [19], the SAVI testbed aims to be a future application platform upon which distributed applications can be deployed, maintained, and retired. Since a future application platform might very well be run on novel Future Internet protocols, another stated goal of the SAVI testbed is to be flexible enough such that it can be shared amongst network researchers while granting the level of control over the network infrastructure that researchers require. This dual requirement requires a control and management system that can provide combined management of compute, network, and other types of resources. Due to the heterogeneity of the resources in the testbed, as well

13
as the desire to support the continuous evolution of the testbed infrastructure, the management system envisioned will likely need to be flexible enough to support future extensions. Finally, as an application enablement platform that aims to support innovation, the management system will have to provide open interfaces for external entities and users to interact with it. These interfaces should ideally be flexible enough to abstract the testbed infrastructure’s details (e.g. operational metrics, physical hardware specifications, performance characteristics, etc.) from those wishing to deploy simple applications and experiments. For developers of smart applications, there should also be a set of interfaces available that enable them to query the detailed infrastructure information. For the various testbed components to communicate with each other, there should also be internal interfaces which are restricted from outside users. We summarize these high level requirements of the SAVI testbed management system as follows:
• Converged management over different types of virtualizable resources, including, but not limited to, computing resources and networking resources;
• Extendable management system that allows the infrastructure to evolve;
• Open interfaces for communicating with users and external entities, as well as internal interfaces for inter-component communication.
1.3 Software-Defined Infrastructure
While OpenStack offers many of the desirable features that SAVI envisions to be part of its applications platform testbed, it does not have the capabilities to provide the converged control and management over heterogeneous resources described in subsection 1.2.2 and [19]. In response to this niche, Software-Defined Infrastructure (SDI) was conceived by the SAVI testbed team as a way to meet these converged management needs [40]. SDI is seen as a way to bridge the management of various resource types, defining a top-level manager that communicates with the individual resource controllers (e.g. compute, networking, etc.) in order to orchestrate and coordinate the management of the entire infrastructure. Alongside this top-level SDI manager would be a topology manager responsible for storing the up-to-date information regarding all the resources in throughout the infrastructure, both physical and virtual. The combination of both

14
the SDI manager and the topology manager is termed the SDI Resource Management System (RMS) in [41], and a depiction can be seen in Figure 1.5.
The SDI manager would also have open interfaces to enable interaction for users and other external entities. A user who wishes to deploy an application on the infrastructure may use the SDI manager to query an overall view of the infrastructure’s resources and their associated attributes. The information returned should give the user not only the resource information, but also a topological map of where the resources are located in relation to one another. The user can thus use this information to make appropriate deployment decisions and, again via the SDI manager, allocate the resources for their application. While SDI was conceived for the needs of the SAVI testbed, the SAVI project envisions SDI as having the potential to manage a variety of different infrastructures, including but not limited to: enterprise networks, sensor networks, power grids, transportations networks, and etc. This new concept of SDI has motivated us to design and implement a novel SDI management system that can meet the needs of the virtualized application platform testbed that SAVI is building.
1.3.1 Infrastructure-Aware Network Manager
As previously mentioned in section 1.2.1, the SAVI project will leverage some of the existing OpenStack components to aid in building the testbed. In the initial stages of
Figure 1.5: SAVI SDI Resource Management System (RMS) [27]
15
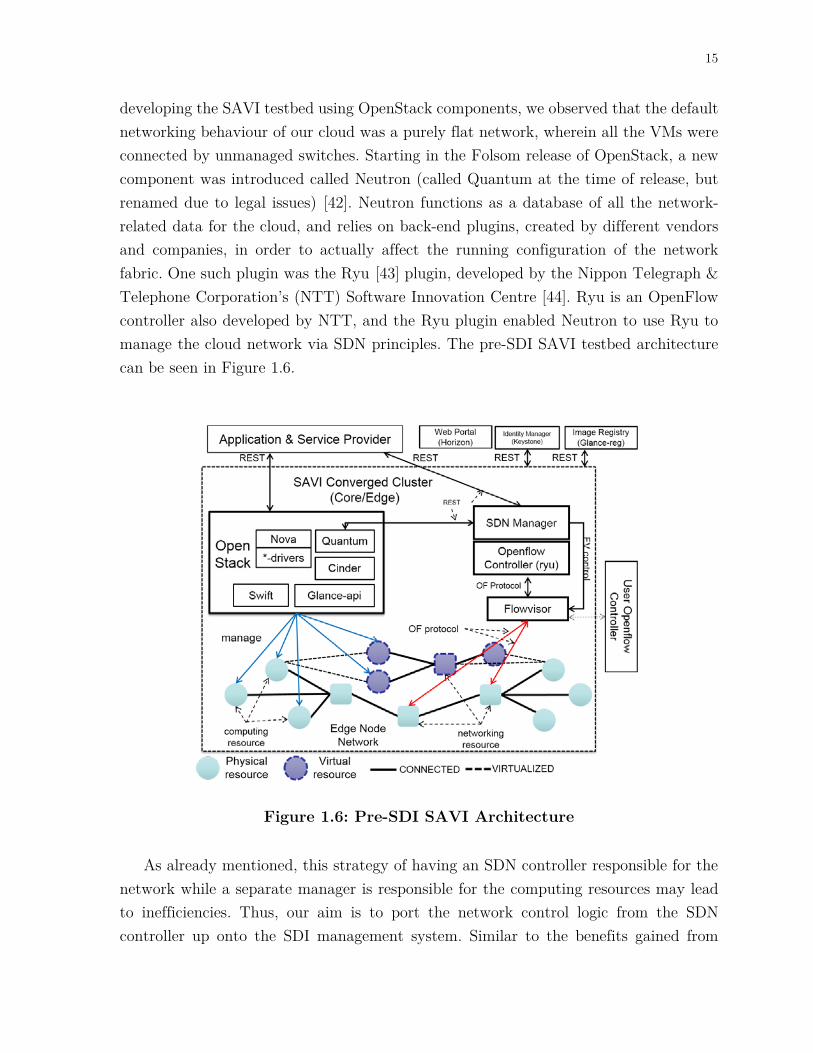
developing the SAVI testbed using OpenStack components, we observed that the default networking behaviour of our cloud was a purely flat network, wherein all the VMs were connected by unmanaged switches. Starting in the Folsom release of OpenStack, a new component was introduced called Neutron (called Quantum at the time of release, but renamed due to legal issues) [42]. Neutron functions as a database of all the network-related data for the cloud, and relies on back-end plugins, created by different vendors and companies, in order to actually affect the running configuration of the network fabric. One such plugin was the Ryu [43] plugin, developed by the Nippon Telegraph & Telephone Corporation’s (NTT) Software Innovation Centre [44]. Ryu is an OpenFlow controller also developed by NTT, and the Ryu plugin enabled Neutron to use Ryu to manage the cloud network via SDN principles. The pre-SDI SAVI testbed architecture can be seen in Figure 1.6.
As already mentioned, this strategy of having an SDN controller responsible for the network while a separate manager is responsible for the computing resources may lead to inefficiencies. Thus, our aim is to port the network control logic from the SDN controller up onto the SDI management system. Similar to the benefits gained from
Figure 1.6: Pre-SDI SAVI Architecture
16
having a global network view when the network control is centralized in SDN, we expect to gain further benefits when the infrastructure control is centralized, giving the network control logic access to a global infrastructure view. To do this, we will need to design and implement a network control functionality for the SDI management system. In addition, we will also need to design and implement a new plugin for Neutron that can be compatible with our new SDI-based network management system. In essence, we are aiming to create an infrastructure-aware network manager.
1.4 Thesis Organization
In this section we will outline the composition of the rest of this thesis. Chapter 2 will discuss the high level design of three items: the proposed SDI management system, the SDI-based network manager, and the network slicing strategy. Chapter 3 will then focus on the software implementation details of the same three items, and finish off with a preliminary evaluation of the system. Chapter 4 will analyze the results of the preliminary evaluation, investigate methods to improve the system, and finish with a re-evaluation. In addition, chapter 4 will also include points on potential future work to be done to further improve the system. We then go into a real use case example in chapter 5, where we demonstrate how the SDI-based network management system can be used to influence the end-to-end network traffic of an application deployed on the SAVI testbed. The thesis is then concluded in chapter 6 with a summary of the work and the results.

17
Chapter 2
Design of the SAVI SDI Manager
In our effort to design a solution to fulfill the desirable features presented in subsection 1.2.2 of the previous chapter, we strive to keep the high-level architectural design as technologically neutral as possible. Details of our implementation will be presented in the next chapter. The design and implementation of the topology manager mentioned in section 1.3 is out of the scope of this thesis, as our focus here is purely on realizing the converged infrastructure management capabilities mentioned in [19] [40]. In this initial design iteration, we simplify our task by focusing on the design of an SDI manager for a single Core or Edge node, rather than tackling the problem of designing a testbed-wide converged infrastructure manager head-on. In keeping with the vision of a generalized manager that can interoperate with diverse infrastructures, we set some high level design principles for the proposed SDI manager:
• Modularity: The SDI manager should be modular by design, with its control and management (C&M) functions defined by pluggable modules. This modularity means that the SDI manager can be quickly re-purposed by simply adding or removing certain modules. This design choice enables the continuous evolution of the infrastructure as well as opens the door for the management of other distributed infrastructures. In addition, this de-coupling between the manager and its functions enables the independent evolution of a module’s implementation (as management requirements changes) as well as that of the SDI manager’s core system.
• Centralized Interfaces: The SDI manager should act as a central point of contact for infrastructure administrators and users alike. Having a centralized set of open interfaces not only makes it easier for the users of the SDI manager, but it also simplifies the upgrading or downgrading of a person’s level of access (i.e.

18
if a user is to be “promoted” to have more access, the interface points will remain the same). It is expected that unifying the interface will result in an acceleration of the time for developing applications and experiments, as users will not need to individually interface with several different resource controllers.
• Proxy Controllers: The SDI manager should liaise with resource managers in order to affect the infrastructure state or its resources (see Figure 1.5). In other words, the SDI manager should never engage in direct control over the infrastructure elements themselves. This de-couples the infrastructure management logic from the implementation details of the physical infrastructure, thus allowing each to evolve independent from one another.
• Global Infrastructure View: The SDI manager should have a persistent and up-to-date topological view of the entire testbed’s resources. This point is key to the success of the SDI manager, as its C&M modules will need to be able to access a global view of the infrastructure in order to effectively control and manage the entire system. This last task is aided by the topology manager, which is being developed separately.
This chapter will present the high-level architectural design of the SDI manager as implemented in SAVI. We have designated the SAVI SDI project, as well as the component itself, as Janus, named from the ancient Roman god of beginnings, translations, gates, doors, passages, endings, and time (the month of January was aptly named after Janus). In addition, this chapter will also describe the design of the SAVI network control module, which runs on top of Janus. In order to frame the design discussion, a brief requirement analysis will be presented for both designs. While the requirement analysis will be conducted with the goals of the SAVI project kept in mind, we aim for the design to be general enough such that it may also be applicable for other datacentre, testbeds, and enterprise networks.
2.1 Design of the SDI Modular Framework
The SDI manager is seen as a way to realize integrated resource C&M functions for datacentres with heterogeneous resources. We envision the SDI manager as a flexible platform upon which different cloud C&M functionalities can be “plugged in” as different

19
modules. For this reason, at its very core, the SDI manager is a module manager whose job is to instantiate and enable the various C&M modules. Without any modules enabled, the SDI manager itself effectively does nothing.
2.1.1 Requirement Analysis
We first identify the types or groups of people who will be actively interacting with the SDI manager. The following three groups will comprise the primary stakeholders of the design:
• The Physical Infrastructure Administrators: The owners and administrators of the physical infrastructure will be concerned about how their equipment is being controlled and used by their tenants. The administrators may use the SDI manager in their administrative tasks, and it is also up to the administrators to define and place limitations onto the degree of flexibility granted to the users of the testbed to control and manage their slice of the infrastructure;
• The C&M Module Developers: It is likely that the initial developers of the modules will be from the SAVI testbed team. However it is also possible that modules developed by other users will eventually be granted permission to be hosted on the SDI manager itself, perhaps for the purposes of testing novel infrastructure C&M schemes;
• The Testbed Users: Testbed users are the owners of the applications and experiments. They may need to occasionally interact with the SDI manager in order to achieve customized resource deployment, control, monitoring, measurement, and management over their slice of the infrastructure.
Any module related to control and management will require some way of communicating with external components, such as the proxy resource controllers. The modules will likely also require access to some type of persistent memory for state-aware control and management. Thus, in addition to enabling modules, the SDI manager will offer the following services for each module:
20
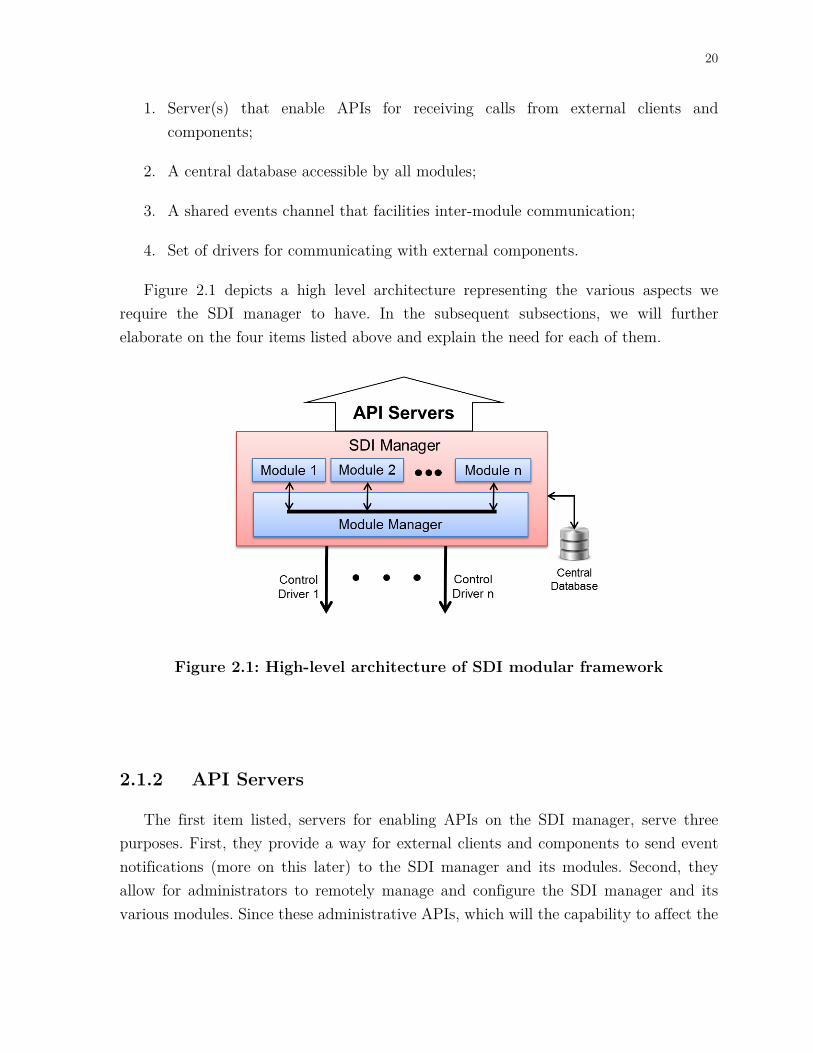
1. Server(s) that enable APIs for receiving calls from external clients and components;
2. A central database accessible by all modules;
3. A shared events channel that facilities inter-module communication;
4. Set of drivers for communicating with external components.
Figure 2.1 depicts a high level architecture representing the various aspects we require the SDI manager to have. In the subsequent subsections, we will further elaborate on the four items listed above and explain the need for each of them.
2.1.2 API Servers
The first item listed, servers for enabling APIs on the SDI manager, serve three purposes. First, they provide a way for external clients and components to send event notifications (more on this later) to the SDI manager and its modules. Second, they allow for administrators to remotely manage and configure the SDI manager and its various modules. Since these administrative APIs, which will the capability to affect the
Figure 2.1: High-level architecture of SDI modular framework

21
state of the SDI manager, are a potential vector for attackers, they should be protected and wrapped by an authentication and authorization mechanism. However, the design of such protection mechanisms is out of the scope of this discussion. Finally, the API servers will enable the converged point of contact for both administrators and users to manage their applications and experiments running on the testbed. It is up to each module to define its own set of APIs and implement the back-end for handling them; the APIs can be registered with the SDI manager's main servers which will route the calls to their respective back-ends.
2.1.3 Central Database
The second item listed above, the central database accessible by all modules, is a key element for realizing the integrated nature of the SDI manager's C&M capabilities. While different modules are responsible for writing to and updating various sections of the database, they may all jointly read from it and thus glean information from other modules. As an example, consider a Fault Tolerance module whose job it is to keep the various resources running when a fault is detected within the testbed. In a scenario where a network fault is detected, the fault tolerance module would need to identify the virtual resources affected by such a failure and, if possible, migrate those virtual resources (e.g. VMs) to another area of the testbed unaffected by the network fault. Such a module would require access to information within the shared database regarding the current network configuration and state, as well as the current placement of existing virtual resources. Additionally, the database serves as a back-up of vital infrastructure state information in the event that the SDI manager goes offline or crashes, enabling it to recover any lost state or configuration information.
2.1.4 Shared Events Channel
Another key element towards realizing integrated C&M capabilities is the shared events channel listed as the third item above. It is the responsibility of each module to define its own set of unique events. Those developing new modules will have the ability to register callback functions (i.e. code to be run upon the reception of an event, essentially a back-end) for any event, even those which were not defined by the modules
22
themselves. Upon the receipt of a shared event, the SDI manager performs a lookup to identify all the modules that have registered to receive the event, and a call to each callback function is made. The shared events channel can thus be interpreted as a bus amongst the various modules, used to send inter-module notifications to each other. External clients and entities may also initiate events by having the SDI manager define an API whose back-end action simply inserts an event into the shared channel.
2.1.5 External Component Drivers
The final and fourth item listed above describes a set of drivers for communicating with external components. This can be thought of as the converse to the API servers mentioned earlier. One of the high level design principles presented at the beginning of this chapter states that the SDI manager should never engage in direct control over the infrastructure elements, and should instead liaise with specific resource controllers instead. These resource controllers are examples of external components. For each external component that the SDI manager is able to take action upon, it requires a driver in order to interact with said component. In essence, these drivers are meant for implementing remote procedure calls (RPCs). Many base driver types may exist for each type of RPC (e.g. Raw TCP/UDP, HTTP, AMQP, etc.), and can be inherited and extended depending on the specifics of the external component's own APIs. Module developers creating new C&M functions for the SDI manager are expected to use these drivers in order to exact control over the infrastructure elements.
2.2 Design of SDI Network Control Module
The primary purpose of the network control module is to enable multiple network control applications to run concurrently, where each application realizes a set of functions regarding SDN control and management. Hence, the network control module is designed foremost as an applications manager. Network control applications, a.k.a. SDN applications, define the behaviour of the network itself. Some examples of SDN applications include a Hub application, a Learning Switch application, a Topology Discovery application, and etc. Without SDN applications, the module is unable to make choices on how to control the network, and thus serves no purpose. The SDN

23
applications are able to interact with the various networking devices throughout the infrastructure using a programmatic interface (i.e. a set of APIs) defined within an external component driver designed for SDN controllers. In this way, the SDN applications are agnostic to the SDN controllers being utilized below the SDI manager. From the point of view of the network control module, the SDN controller simply becomes an interface layer used to communicate with the networking devices within the testbed.
2.2.1 Requirements Analysis
In order to design a solution for network control, we must first fully understand what the requirements are. It is vital throughout the design process that we keep the goals of the SAVI testbed in mind. We will begin by identifying the functions that the network control module must support, and then identify any desirable objectives for the module.
Functions
The SAVI network manager shall provide the following functionalities:
• The network manager shall be able to control the networking devices within the testbed;
• The network manager shall be able to define the switching and routing logic over the testbed network;
• The network manager shall support the ability for users to simultaneously exert control over a slice of the network.
Objectives
The design of the SAVI network manager will aim to achieve the following objectives:
• The network manager should be able to load and unload SDN applications on-the-fly;
• The network manager should be able to interact with different types of SDN controllers;

24
• The network manager's state should be resilient against software crashes;
• The network manager's state should be open for query to ease debugging efforts.
2.2.2 SDN Controller Drivers
As the SDN applications are written without regard to the SDN controller used to interface with the network below, a common set of APIs must be available to them. Thus, a set of SDN controller drivers, each designed specifically for a certain type of SDN controller, will serve to translate the API calls made by the SDN applications to calls that the SDN controllers can recognize. These SDN controller drivers are an example of the external component drivers described in subsection 2.1.5. Since most SDN controllers available today are based on the OpenFlow [16] protocol, the initial set of APIs available to the SDN applications will mimic the commands that can be taken on OpenFlow-enabled switches. For example, the APIs available to the SDN applications will include commands to install flow rules based on a match-action scheme, and queries for statistics ranging from switch-level, port-level, or flow-level granularities. It is expected that the introduction of any non-OpenFlow SDN protocols that may come in the future will force a review of the available APIs for the applications. The use of these drivers will fulfill the first and second functions mentioned above, while also meeting the second objective.
2.2.3 Event Notifications
The network control module must be constantly aware of any changes to the network configuration in order to make the appropriate control and management decisions. Thus, the network control module implements a set of APIs for external components to communicate and inform the module of network-related events. Network configuration changes may not be limited to just the physical network, but may include changes to virtual networks as well. A few examples of network configuration changes include, but are not limited to:
• Addition or removal of switches;

25
• Creation or deletion of virtual networks;
• Creation or deletion of ports;
• Changes to port configurations (e.g. Line speed, port up/down status, etc.).
Other network-related events that are unrelated to the network configuration, but which may trigger a configuration change, are events relating to the network traffic. An example taken from OpenFlow is the “PacketIn” event, which informs the network control module of a packet which the network switch does not know how to handle. Another OpenFlow example is the “Flow Removed” event which informs the module of expiring flows within the network switch’s flow table. Depending on the implementation of the SDN application running atop the network control module, some action(s) may be taken to address these events. While it is likely that the majority of these event notifications will originate from the external components, such as the SDN controller, we also envision the possibility that another network-related C&M module (e.g. green networking, fault tolerance, etc.) initiates a change in the network and thus will need to send out notifications to other modules (i.e. through the shared events channel described in subsection 2.1.4) regarding this change.
2.2.4 Network State Context
When the network control module receives network-related event notifications, the information from each notification should be stored within the central database described in subsection 2.1.3. Over time, the aggregation of network event notifications are used to build an up-to-date state view of the network. This state information serves as the primary context upon which the SDN applications may rely on for making accurate control and management decisions. Similarly, the network state context can also be queried by external clients or read by other modules needing information regarding the current network configuration.

26
2.2.5 Network Control Logic
The network control is provided by the SDN applications running on top of the network control module. The SDN application is a collection of back-end callback functions that can be registered directly with either the APIs or shared events. These functions will be called upon if and when certain event notifications or APIs are received, and are used to define how the application wishes to handle different events. An OpenFlow-related example is that of a “PacketIn” event, which will trigger some network control logic to decide what to do with the packet.
2.3 Network Slicing
As one of the stated goals of the SAVI testbed is to enable experimentation in Future Internet protocols, users and experimenters will need a way to control the network themselves. Our desire is to design a testbed network that can be sliced at a level low enough such that users can implement any new protocols they wish on top. However the network is sliced, when shared and used by multiple users and experiments, their traffic should remain isolated from one another. The isolation of traffic is needed so as to prevent packets originating from hosts within one experiment from ending up at a host or resource dedicated to another experiment, thus potentially confusing or corrupting the system.
The slicing and isolation mechanisms must be, at all times, directed by the network control module itself. Our policy is to not permit users and external components the ability to directly define network traffic flows. Users wishing to control the traffic within their own slice of the network must make requests via the network control module’s APIs. The reason for this is two-folds:
1. Slicing Accuracy: As the network control module is constantly aware of the network state and configuration, it is well suited to make the decisions on how to slice the network. Any changes to the network configuration which may affect the existing slices or the isolation between the slices (e.g. connecting a new VM to a virtual network) will immediately be known and the appropriate slicing alterations made.

27
2. Security: While the network control module provides APIs for users and external components to query its information, and thus can be argued that these external components can make the adequate slicing decisions with this information, there is no guarantee that these external components can be trusted. There is also the possibility that the external components may have been improperly implemented, corrupted, or hijacked by malicious users. Thus, we require any and all attempts by users and external components to define network traffic flows to be vetted by the network control module.

28
Chapter 3
Implementation of Janus
This chapter will focus on the implementation details of Janus, the SAVI SDI manager. In addition, implementation details regarding the network control module will also be discussed. Both implementations will be based off of the high level architectural design as presented in the previous chapter. Where appropriate, a brief discussion regarding the design alternatives and a justification of the implementation choices made will also be presented.
We begin this chapter with a brief discussion on the different programming languages which can be used for implementation. Careful consideration must be given as the minutiae of the chosen language will likely affect many factors including ease of development, ease of maintenance, time to deployment, and most importantly, the implementation details themselves. A preliminary evaluation of the initial implementation will also be conducted towards the end of the chapter in order to understand the limits of the prototype system. Tests and measurements will also be done within the SAVI testbed’s production network so as to see whether the initial implementation of Janus and the network controller can adequately handle the network traffic load.
3.1 Programming Language Alternatives
In regards to the selection of a programming language to use for the task of implementing the SAVI SDI manager, there were three primary candidates: C/C++, Java, and Python. Each of these has their advantages and disadvantages, which will be discussed in the subsections below.

29
3.1.1 C/C++
C/C++ is a low-level procedural programming language, designed for general purpose application and systems programming. It offers low-level access to memory and requires explicit memory management, thus providing very fine grain control over how memory resources are accessed and utilized. As C/C++ code is compiled down directly into binary machine instructions, which is executed directly on the CPU, it is more efficient (in terms of CPU-cycle utilization) than languages that rely on intermediary interpreters or virtual machines to translate the user’s code into machine instructions at run-time. However, the explicit memory management also makes development a more strenuous task on the part of the developer, as they must be careful not to access areas of the memory not belonging to the program and remember to release memory that are no longer used. In the event of a program crash, it is often difficult to trace as the system provides limited information regarding the root cause of the error, which results in much time spent debugging for inexperienced debuggers or anyone unfamiliar with the structure of the source code. A major downside for developers is the fact that any code written and developed on one system is not assured to work on a system with a different OS or a different CPU architecture, as the code itself (as well as the compiler) may be tailored for each environment. Despite these caveats, the explicit memory management and environment-sensitive nature of the code, as well as the compiler, results in C/C++ being the best choice as far as performance is concerned.
3.1.2 Java
Java is one of the most popular programming languages used in enterprise systems due to the cross-platform nature of the language. Compiled Java code, called byte-code, can easily be used and run directly on machines with different computer architectures. Its cross-platform nature is due to the fact that the byte-code is executed on an intermediary layer, the Java virtual machine, whose job is to translate the compiled Java byte-code to the machine instructions understood by the host system’s CPU architecture. In essence, the Java virtual machine can be considered an interpreter for the Java byte-code, and this type of run-time translation from byte-code to machine instructions is called “just-in-time” compilation. In the event of a program crash, the error will be caught by the Java virtual machine and prevented from potentially corrupting the host system. The Java virtual machine also explicitly controls the amount

30
of memory the program is allowed to consume on the host system, and in addition, implements automatic garbage collection, thus not burdening the programmer with explicit memory management. Java’s downsides are primarily related to its performance. As the compiled Java instructions require the Java virtual machine to run, its memory utilization is much more significant compared to C/C++. Not only do Java objects and data structures include an overhead (used by the Java virtual machine), the Java virtual machine itself is a memory-intensive application. Many classes which the programmer may utilize are not compiled into the Java executable but are instead loaded at program start-up time, thus taking a hit on program speed. Finally, the just-in-time compilation of the program byte-code may also hinder the program execution speed.
3.1.3 Python
The last programming language candidate is Python. Python is high-level programming language considered to be easier to read and easier to code with. The language syntax enforces strict indentation, and was designed to use English words and sentence-like structure where possible, thus contributing to its ease of reading. Unlike C or Java, which require some type of compilation prior to the execution of the program, Python relies on an interpreter to read the code at run-time. One of the reasons for this is to enable Python as an on-the-fly scripting language, useable in a shell environment much like Matlab, enabling quick development of algorithms for solving mathematical and scientific problems, as well as quickly prototyping snippets of code. Similar to Java, the interpreter has an automatic garbage collection mechanism, which frees the developer from having to focus on memory management. Variables in Python are not constrained to a single type, and can change dynamically. The intention for this is to enable developers to reuse variables quickly and easily. In the event of a program crash, the interpreter catches the error and automatically prints out a stack trace, indicating the line of failure, thus facilitating debugging efforts. The program execution speed of Python is often slower than C/C++ or Java, due to the fact that the program is interpreted on-the-fly. Another drawback of Python is that since the variables don’t contain static types, and there is no compilation stage, any type mismatch errors or typos will not be detected until the program is executed and it crashes. The use of an interpreter and reliance on garbage collection also means that it will use up more system memory than C/C++, but depending on the application, may use less than Java due to the Java virtual machine. An interesting thing to note regarding Python is that it is
31
able to be bound to C/C++ code, meaning that any time-sensitive critical sections can be implemented in C/C++ and called from within Python, thus improving performance.
3.1.4 Discussion and Conclusion
The previous three subsections presented three alternative programming languages that can be used for implementing the SAVI SDI manager. Much of the discussion involved the performance differences between the languages, the overhead required for running programs in each language, and the ease of implementing and debugging said programs. Each of these contribute to the decision making process, but the environment in which the SAVI SDI manager will be running in must also be considered.
The SAVI testbed is mostly comprised of servers built from commercially available components. As of late 2012, the newest SAVI servers utilize multi-core Intel CPUs with hyperthreading technology, effectively doubling the number of CPU cores from the view of the operating system [45]. Installed in each server are a minimum of 32 GBs of RAM, a 160 GB SSD for the primary OS, with a 2 TB HDD for extra storage. Given these specifications, and with the knowledge that future servers will likely have more processing power and memory as the technology becomes available, concerns regarding a language’s performance and overhead are of minimal priority.
Thus, the discussion over which programming language to utilize for implementing the SAVI SDI manager becomes one focused on the speed at which it can be prototyped, and the ability to debug issues as they appear. As described in section 3.1.3, Python is designed to be extremely developer-friendly, and program crashes automatically print stack traces to help narrow down the cause of failures. Section 2.1.5 also mentions the need for the SDI manager to have mechanisms to interact with external components. OpenStack provides a Python-based command-line client (implemented using Python version 2.x) with each of their components. The command-line interfaces are merely front-ends for users while the back-end communicates with the components using HTTP-based RESTful APIs. With this Python code already available, we can quickly implement component drivers for calling the OpenStack APIs in order to interact with the various components. For these reasons, it has been decided that the SAVI SDI manager will be implemented in Python.

32
3.2 Janus Framework Implementation
In its initial conception, Janus was meant to be a dedicated network controller for SAVI, but was later expanded to function as a modular SDI framework. As discussed in section 2.1.1, the SDI manager should provide the following services for its C&M modules:
1. Server(s) that enable APIs for receiving calls from external clients and components;
2. A central database accessible by all modules;
3. A shared events channel that facilities inter-module communication;
4. Set of drivers for communicating with external components.
The following subsections will discuss the implementation details of Janus, and describe how each of the items listed above are achieved. Design choices will also be discussed where appropriate.
3.2.1 RESTful Service
To meet the need for the Janus framework to provide APIs for external clients and components, a web service is required. Since we are building Janus as a separate component that must orchestrate alongside OpenStack, we look to it as an example in order to examine how its individual components interact with one another. As a collection of interrelated projects, the various OpenStack components communicate with one another using RESTful APIs, with each component implementing their own RESTful services. The choice of using RESTful APIs means that clients sending requests must contain, within the body of the request, all the state information necessary for the server to process the said request. When dealing with a collection of separate components such as OpenStack, this opens up the ability for each component’s internal implementation to evolve separately, so long as they keep the APIs (the interfaces between client and server) consistent. Thus, we opted to adopt this architectural style for Janus’ web service.

33
The current implementation of Janus utilizes an HTTP-based RESTful service to implement the APIs. Though REST is not limited to HTTP, HTTP is the most ubiquitous REST-compliant protocol. As a result, many communication services, such as firewalls and proxies, already exist with support for HTTP. Such services may be useful later on for helping to secure Janus and make it scalable. Janus currently implements two HTTP web servers, a “public” server and an “admin” server. These servers listen on separate ports and differ by the level of security and filtering applied to incoming requests, with the admin server currently having no restrictions. Security on the public server is implemented with the help of the SAVI IAM [46] service component, which is a modified version of Keystone [35], the OpenStack component responsible for authentication and authorization. All HTTP requests directed to the public server will pass through a number of filtering functions, most notable of which is the Keystone middleware. The Keystone middleware parses the HTTP request body, which is formatted in a JSON format, for an authentication token that is then validated against Keystone.
Each module implemented on top of Janus will be given the ability to define their own set of APIs, by specifying URLs relative to the module’s base URL address. Each module’s base URL address is defined by the module name. For example, if a module is named my_module, then the base URL for that module will be http://{janus_url}:{port_num}/v1.0/my_module, where janus_url and port_num defines the IP address and port number that the web server is listening on.
3.2.2 External Component Drivers
As Janus will occasionally be required to interact with external components in order to configure, control, and manage them, it requires a set of drivers accessible by all modules. The implementation of each driver is dependent on the APIs available on the target component. As the network control module was the first to be developed and deployed, Janus currently contains two drivers: an OpenFlow controller driver and a FlowVisor driver. The set of drivers can be expanded in order to support the interaction with other components as new C&M modules, which may need to interact with these components, are eventually implemented on Janus.

34
Two options were available regarding how to pass the drivers to the modules. The first was to instantiate the complete set of drivers and pass them to all the modules. The second was to allow each module to instantiate them separately. While the first option has the benefit of not duplicating a driver if two modules wish to interact with the same external component, it also has the pitfall that a component may hog or even corrupt the driver. Thus, it was decided that each module should be responsible for instantiating a copy of each individual driver that it requires. The developed drivers are located in a common directory known to all modules such that they may load from it.
3.2.3 MySQL Database
In order to preserve the infrastructure state information, a database is needed. As previously mentioned, the SDI manager without any modules does nothing and thus, Janus itself has no state to save. However, the various C&M modules running on Janus may require state information to be saved, and it is possible that this state information may need be shared across different modules. An example illustrating the need to share information across modules was previously given in section 2.1.3. While an in-memory data structure can easily satisfy the need for inter-module information sharing, it is not resilient against program crashes. Thus, an external database component, which exists independently of Janus, is needed in order to preserve state across program malfunctions.
While searching for database management systems, the focus was on open-source implementations which would be easy to set up and easy to interact with. In regards to the question of database interaction, Structured Query Language (SQL) provides a data definition and manipulation language which is recognized by many open-source implementations of database management systems [47], as it has been standardized by the American National Standards Institute (ANSI) and the International Organization for Standardization (ISO) [48]. The top two open-source database implementations which are operable using SQL are SQLite [49] and MySQL [50]. The former, SQLite, is an embedded database system designed for local storage only, and thus does not meet our requirement for an independent database system. The latter, MySQL, is a widely used database implementation actively supported by the open-source community. Another benefit of MySQL is that Python has existing libraries, most notably SQLAlchemy [51], that can be used for managing and manipulating the database content. Other existing Python libraries also exist for the sole purpose of version

35
controlling the database schema (e.g. SQLAlchemy-migrate [52] and Alembic [53]). With these open-source tools available, we opted to utilize MySQL for Janus in order to shorten the development time.
At the time of writing, all the tables in the Janus database are related to, and used by, the network control module. Within the module, we have implemented a database driver in a class that defines functions for read and write operations to the various network-related tables. This simplifies the task of database interactions for future developers working on new network control applications, or new modules that may need access to the network database. For the interested reader, the schemas for the various database tables used by the network control module can be seen in Appendix C.
3.2.4 Module Manager
As discussed in section 2.1, the SDI manager is envisioned to be a platform upon which modules responsible for implementing various C&M functions are “plugged in”. The module manager can thus be considered the core of the SDI manager, as it is responsible for the instantiation and enablement of the various C&M modules. Besides instantiating the modules, the module manager is also responsible for registering and linking APIs specified by each module to the appropriate API servers (public or private).
As the module manager is responsible for linking module APIs to the Janus API web servers, it is also well suited to implement the shared events channel for inter-module communication. Within the module manager is an “event manager”, whose job it is to map event types to a list of callback functions. Individual modules are allowed to define their own set of sharable events. The module manager also implements a single API on the public server to enable external components the ability to insert events. Each module expresses its interest in certain events by registering a callback function with the events it wishes to receive. Events are differentiated via an event ID, and as events may be shared across multiple modules, they must have a globally unique event ID. Modules, external clients, or other components interested in sending events to Janus must be aware of this unique ID. When Janus receives events, they are put into a queue to be processed by a secondary thread, whose role is to consume the queue and dispatch the event to all the registered callback functions.

36
The high level Janus start-up procedure is illustrated using pseudo-code in Figure 3.1. After creating the module manager, Janus will start loading the modules as given by the user-defined (currently specified in the configuration file) enabled_modules variable. This process begins by first creating the event manager, which creates the shared events channel as well as the secondary thread responsible for consuming and dispatching the events to registered modules. For each module specified in enabled_modules, the event manager will register any newly defined event types, as well as any callback functions tied to events. The module manager will then instantiate each of the modules and register the API’s defined by each module. After all the modules have been instantiated and their APIs, event types, and callbacks are registered, Janus will create the API web servers and associate the registered APIs, which contains the URLs as well as the back-end code for handling each API call.
The implementation details presented in the past subsections now allow us to present an updated high level architectural view of the SDI manager and how it interacts with external components to control a SAVI node. Figure 3.2 shows the SDI manager running multiple modules on top, along with an external MySQL database to the side. The external components seen are OpenStack, an OpenFlow controller, and FlowVisor, which
Figure 3.1: Pseudo-code for Janus start-up procedure
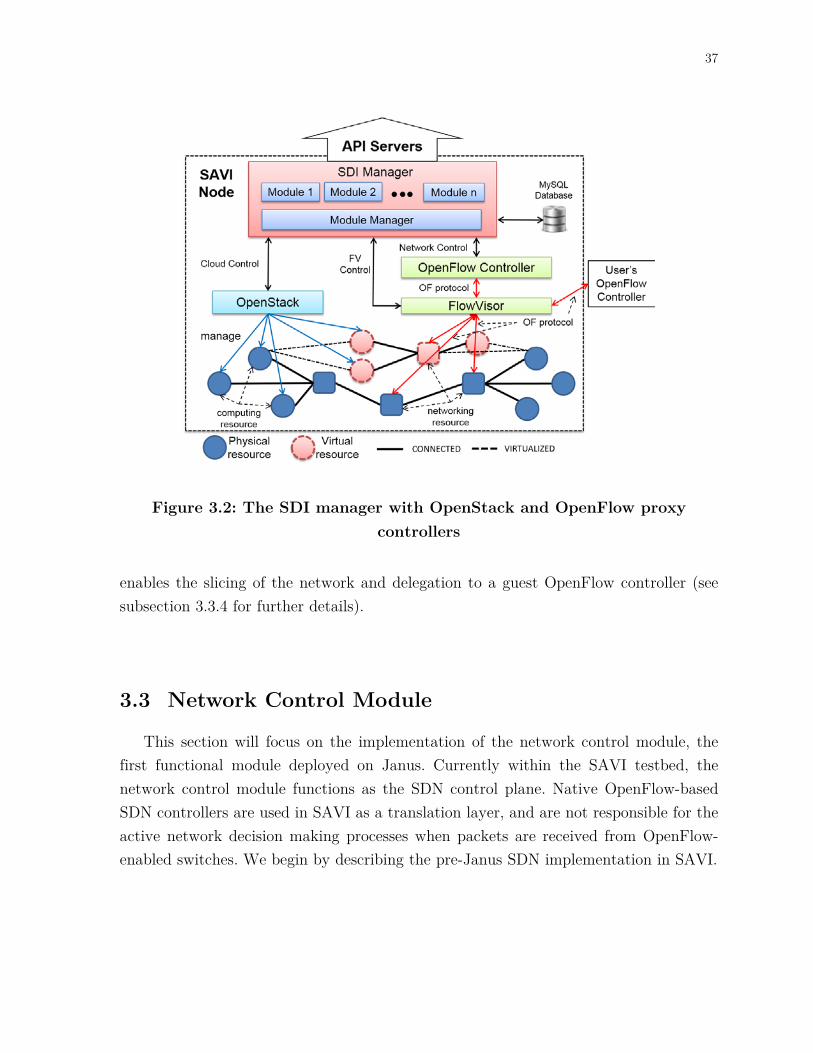
37
enables the slicing of the network and delegation to a guest OpenFlow controller (see subsection 3.3.4 for further details).
3.3 Network Control Module
This section will focus on the implementation of the network control module, the first functional module deployed on Janus. Currently within the SAVI testbed, the network control module functions as the SDN control plane. Native OpenFlow-based SDN controllers are used in SAVI as a translation layer, and are not responsible for the active network decision making processes when packets are received from OpenFlow-enabled switches. We begin by describing the pre-Janus SDN implementation in SAVI.
Figure 3.2: The SDI manager with OpenStack and OpenFlow proxy controllers

38
3.3.1 Initial Network Manager Implementation
Prior to the design and implementation of Janus, the SAVI network SDN control logic was implemented on top of Ryu [43], an OpenFlow-based network operating system created by a group from NTT's Software Innovation Centre. Ryu functions as a component-based SDN framework, enabling SDN developers to quickly create and deploy their network applications. Ryu also provided an application which enabled RESTful APIs, and was easily extensible.
The SAVI SDN application on Ryu followed much of the design as discussed in section 2.2. As a starting point, we used an early version of Ryu that had been integrated into OpenStack version Essex as a plugin for Quantum. Ryu provides a “Simple Isolation” application, which is an extension of a simple learning switch application in that it takes into account the virtual network that each packet should belong to. The application is able to discern which virtual network a packet belongs to based on two things: the list of virtual network IDs, and the mapping between each switch’s ports to one of these IDs. This information allows the Simple Isolation application to determine which ports on a switch are allowed to communicate with one another. For ports belonging to inter-switch links, which may be used to carry traffic belonging to a multitude of different network IDs, a special-case “external” ID was defined which signifies that this port may allow traffic from any virtual network. When a packet arrives from a port that is associated with a virtual network ID, that packet is automatically assumed to be part of that virtual network. However, when a packet arrives from an inter-switch link port, another method must be used to determine its origin virtual network. Thus, MAC addresses must also be associated with the virtual network IDs. This MAC to virtual network ID association is learnt by the system upon the first encounter of a new source MAC address previously unseen by the system entering the network from a registered port. If a packet using the same source MAC then enters the network from a port registered to another virtual network ID, the packet is automatically dropped.
The list of virtual network IDs, as well as the port-to-ID associations, are explicitly configured via calls to the RESTful APIs which Ryu provides. This explicit registration and association of ports with virtual network IDs is done by the Ryu-based Quantum plugin. As explained in subsection 1.2.1, a Quantum plugin is a vendor-specific back-end executed whenever Quantum is tasked with creating, updating, or destroying some logical network component. For example, the creation of new virtual networks, new

39
virtual ports, new floating IP, and etc., would trigger the plugin code to be executed. Thus, the Ryu-based plugin for Quantum is responsible for reporting these network-related configuration changes to Ryu.
3.3.2 OpenFlow Interface Layer
The Ryu Simple Isolation application served well in the early versions of the SAVI testbed. However, to meet the integrated C&M capabilities envisioned in SAVI, the network control had to reside on the SDI manager. As network C&M functions are migrated up to Janus from the SDN controller, the role of the SDN controller itself becomes a simple interface layer, translating instructions from Janus to whichever protocol the switch recognizes and vice versa. In the current iteration of the SAVI testbed, we employ OpenFlow as the SDN protocol, and thus the SDN controllers are all OpenFlow-based controllers. We designate these set of OpenFlow controllers, which are relegated to a translation role, as the “OpenFlow Interface” layer (see Figure 3.3).
Figure 3.3: OpenFlow Interface (OFI) layer OFI abstracts the network from Janus
40
To facilitate these changes, a new application was written for Ryu called ‘ryu2janus’. Like existing Ryu applications, this new application receives OpenFlow protocol messages from switches, but rather than implementing logic that would handle each message type, the message is parsed and encapsulated into an HTTP request and forwarded up to the Janus network control module. This implementation, however, suffers from the fact that both the ryu2janus forwarding application and the network control module’s APIs must agree on the format of content within the request body. Consider the case in which Janus updates its internal implementation regarding the format its APIs expect to receive, but the forwarding application on the SDN controller still forms the request body using an older format. To help keep the body format of the requests consistent between Janus and the SDN controller, an EventContents class was implemented within the network control module, which can then be imported by the ryu2janus application or any other Python client. The main purpose of this new class is to serve as a formatter for external clients wishing to send network events to the network control module. It contains several member functions that take in network event parameters and returns a properly formatted string for the request body.
When the network control module wishes to interact with the testbed’s network devices, it leverages the SDN controller through calls to its APIs. This is done via one of the external component drivers discussed in section 3.2.2. Janus currently provides two types of OpenFlow drivers, one for the Ryu OpenFlow controller and another for the Floodlight OpenFlow controller [54]. As previously mentioned, Ryu provides an easily extensible set of RESTful APIs, which is implemented as just another Ryu application running in tandem with the forwarding application. When Ryu receives these network control requests, it parses the message and implements the appropriate actions by sending OpenFlow protocol messages down to the network switches.
The combination of these two Ryu-hosted applications, the RESTful API application and the ryu2janus forwarding application, effectively transforms the Ryu SDN controller into an OpenFlow Interface (OFI) layer.
3.3.3 RESTful APIs and Events
The network control module implements a number of RESTful APIs accessible by external clients and components. These APIs can be used for either querying network-

41
related information or configuring the virtual network state. Similarly, Ryu also implements a number of RESTful APIs that enable it to receive HTTP requests from the network control module. In this section, we elaborate on the communication between the network control module and other network-related external components. This communication can be decomposed into two types of requests: northbound requests and southbound requests.
Northbound requests are defined as the set of requests that originate from external clients or components and are received by Janus and the network control module’s APIs. In the current implementation, these requests are primarily from the Janus-based plugins for Quantum and Nova which we have implemented (see section 3.4 for details). These plugins are used to notify the network control module of virtual network configuration changes made by OpenStack. Some examples of network configuration changes include, but are not limited to, the creation and deletion of new virtual networks, the registration and removal of ports from the system, the migration of an interface from one virtual network to another, the delegation of control of a virtual network to another controller, and etc. Upon the receipt of these northbound requests, the API server will direct them to the appropriate API controller. An API controller essentially implements functions that dictate how a received request is to be processed. If the request contains information regarding a change in the network configuration, it is saved into the state context (which SDN applications have read access to) and also reflected in the external database.
As previously mentioned in subsection 3.2.4, the Janus module manager also defines an API which enables external components to insert events into the shared channel. Thus, in addition to the configuration notification APIs, the network control module defines two event types for the shared events channel. The first is a generic OpenFlow event type, where the specific OpenFlow message type and other information are embedded within the event contents. These events originate from the Ryu OpenFlow controller’s ryu2janus forwarding application. The second is a generic Network event type, used for disseminating network-configuration related information between modules. These shared event messages are received by Janus and distributed to any module that registers a callback for it. As an example, the network control module has a callback for the OpenFlow event type which simply receives the event and passes copies of it to the various SDN applications running atop the module. In essence, the SDN applications are designed to be reactionary, such that they define what actions should be taken given certain event occurrences.

42
We define the southbound requests as those requests that originate from Janus and are destined for some external client or component. In regards to the network control module, these requests are primarily related to control and configuration messages destined for either the Ryu SDN controller or FlowVisor (which will be further discussed in the next subsection). Some examples of southbound requests sent by the network control module include ones that call the OFI layer to write and delete flows from OpenFlow-enabled switches, send custom-formed packets from switches, query switch status and statistics, and query the latest network topology. The FlowVisor component also comes with a set of well-documented RESTful APIs that receive requests based on JSON-RPC [55]. Like the drivers used for communicating with the SDN controllers, the SDI manager also maintains a driver specifically for communicating with FlowVisor using its established APIs.
The interaction between the network control module with the northbound and soutbound requests can be seen in Figure 3.4. This diagram shows the various elements of the network control module and how they are inter-related with one another. Received
Figure 3.4: Overview of the Network Control Module
43
northbound requests are first directed to an appropriate API controller. If the API contained an event, it would be inserted into the shared events channel (implemented and depicted as a queue in the figure). The SDN application manager may then send SDN applications a copy of these events. The application manager also has read access to the data stored within the state contexts, which stores up-to-date state information regarding the network. When SDN applications wish to interact with an external component, it may then leverage the available drivers to initiate southbound requests.
For the full list of the current APIs defined by the network control module, including the shareable event types and their descriptions, please refer to Appendix A. Additionally, the set of Ryu APIs responsible for receiving and handling the southbound requests previously described are listed and described in Appendix B.
3.3.4 FlowVisor Driver & Network Slicing
The use of FlowVisor in the SAVI testbed’s network management system allows users the option of delegating control of one or more virtual networks to an OpenFlow controller running elsewhere on the internet, or even within the testbed itself (i.e. running on a VM). Since the network control module has a complete view of the current state and topology of the network, including the MAC addresses of all the interfaces belonging to computing resources, as well as the ports and switches they are connected to, it is well positioned to make the decisions regarding how the network can be sliced into separate FlowSpaces. FlowVisor defines a FlowSpace as a subset of the OpenFlow 12-tuple set sample space [18]. With the use of a FlowVisor driver we have implemented, the network control module is able to call FlowVisor APIs to install FlowSpace entries into FlowVisor. These entries effectively slices the network, instructing FlowVisor to redirect any OpenFlow messages regarding packets whose header information matches the FlowSpace to a user’s guest controller. Each FlowSpace entry must also be assigned a priority level, which is used when resolving conflicting FlowSpaces that overlap. FlowSpaces with priority levels take precedent over lower priority levels.
One of the goals of the SAVI testbed is to support Future Internet research and experimentation with novel networking protocols. As such, we designed the network slicing to be done at layer 2, the link layer, which opens up possibilities for users to experiment with new protocols for L3 and above. Currently, the network control module

44
defines the FlowSpace slicing rules using a 3-tuple: the datapath (switch) ID, the port number, and the MAC address. While it is possible to install slicing rules based on purely the MAC address alone, we include the switch ID and the port number in order to strengthen the isolation of the slices and prevent potential MAC spoofers from being able to send/receive traffic to/from running applications and experiments. A copy of the FlowSpace slicing rules are stored within the central MySQL database, and acts as a backup in the event that FlowVisor crashes or needs to be restarted.
When no virtual networks are delegated, FlowVisor still requires a default slice and a controller to know where to send the OpenFlow packets to. This default slice is defined using a single FlowSpace where the entire 12-tuple set is specified using wildcards. The priority level assigned to this FlowSpace is set to 1, the lowest. Thus, any OpenFlow packets that do not match any of the other FlowSpaces in the table must match this FlowSpace rule. The Ryu controller, which runs the ryu2janus forwarding application, is assigned to be the controller for the default slice.
3.4 Janus-Plugin for Quantum & Nova
As previously discussed in subsection 1.2.1, Quantum is the OpenStack component responsible for providing “Networking as a service” [33]. Its core responsibility is to keep track of all the necessary network-related information (e.g. MAC addresses, L3 network IP ranges, resource interfaces, etc.) regarding the virtual computing resources located throughout the cloud infrastructure. Beyond the task of this record-keeping, Quantum relies on plugins (i.e. backend controllers) in order to accomplish the work of configuring and controlling the network. These plugins are not unlike the Janus event callbacks describe earlier, in that their code is executed only when certain events in Quantum take place. Our pre-Janus SAVI implementation utilized the Ryu plugin along with the Ryu OpenFlow controller to control the network. The Ryu-based Quantum plugin would forward the relevant information to Ryu regarding the creation, update, and deletion of virtual networks and ports. In addition to forwarding this information to the OpenFlow controller, other pieces of the plugin code were also responsible for configuring various network-related items in Linux such as OpenVSwitch (OVS) [56], Linux Bridge [57], virtual interfaces, DHCP servers, and iptables [58] for implementing routers and firewalls.

45
Our Janus-based Quantum plugin implementation is based off much of the work in the Ryu-based plugin, with the major difference being that our plugin calls the network control module’s APIs. The events and conditions which trigger the Janus-based plugin remain identical to the Ryu-based plugin. Since our plugin is essentially an external client of the network control module, there is once again the issue of maintaining consistency with the module’s APIs. A future update or modification to the APIs would result in the plugin having to be updated as well. Thus, a “Janus Network Driver” class was created, residing in Janus, which could be imported by Python-based external clients. Updates to the Janus APIs would thus be reflected in the clients as well. This abstracts the act of calling the network control module’s APIs by having the client code simply call certain class functions and passing the related parameters to it.
Since OpenStack versions prior to Grizzly did not support bare metal (BM) resources, the Quantum plugin code was limited to reporting network configuration changes relating to VMs only. SAVI’s integration of bare metal resources in the Folsom version of OpenStack required the creation of a separate Janus-based Nova plugin that would, like the Quantum plugin, forward the network related information regarding the BMs to the network control module. This plugin was integrated with Nova, which contained the modified code which enables the provisioning of BM resources. These BMs may potentially be attached to resources such as GPGPUs or FPGAs. This work allows the SAVI testbed to spawn unconventional computing resources, all of which whose network traffic and interfaces are registered with and controlled by the Janus network control module.
3.5 Current SAVI SDN Application
The current SDN application running on the network control module is responsible for the proper isolation of virtual networks within the SAVI testbed. This SAVI Edge Isolation application, which can be found in [59], is based on the original Simple Isolation application that previously ran on Ryu. Similar to the Simple Isolation application, the SAVI Edge Isolation application uses the port and MAC associations with network IDs to enforce the isolation of traffic between virtual networks. This mapping is provided by Quantum via the Janus-based Quantum plugin which we have implemented. The portion of the code responsible for registering the associations to the network control module is triggered whenever a new resource is booted up or released. Unlike the Ryu-
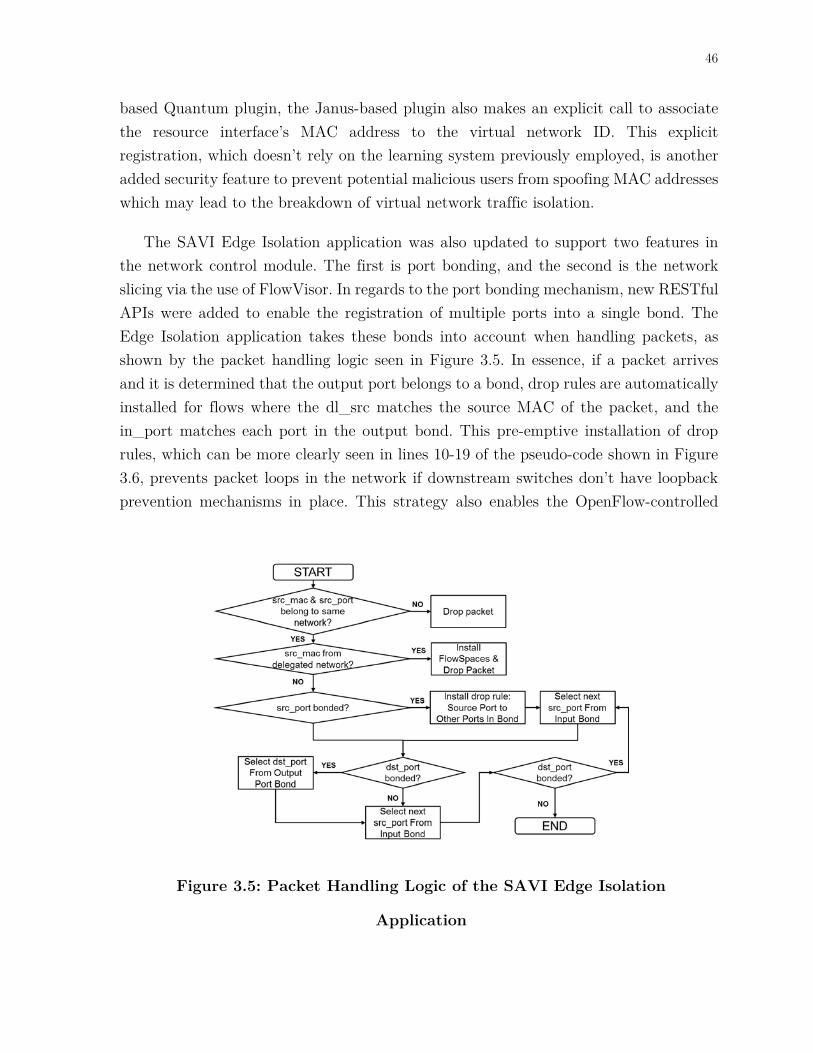
46
based Quantum plugin, the Janus-based plugin also makes an explicit call to associate the resource interface’s MAC address to the virtual network ID. This explicit registration, which doesn’t rely on the learning system previously employed, is another added security feature to prevent potential malicious users from spoofing MAC addresses which may lead to the breakdown of virtual network traffic isolation.
The SAVI Edge Isolation application was also updated to support two features in the network control module. The first is port bonding, and the second is the network slicing via the use of FlowVisor. In regards to the port bonding mechanism, new RESTful APIs were added to enable the registration of multiple ports into a single bond. The Edge Isolation application takes these bonds into account when handling packets, as shown by the packet handling logic seen in Figure 3.5. In essence, if a packet arrives and it is determined that the output port belongs to a bond, drop rules are automatically installed for flows where the dl_src matches the source MAC of the packet, and the in_port matches each port in the output bond. This pre-emptive installation of drop rules, which can be more clearly seen in lines 10-19 of the pseudo-code shown in Figure 3.6, prevents packet loops in the network if downstream switches don’t have loopback prevention mechanisms in place. This strategy also enables the OpenFlow-controlled
Figure 3.5: Packet Handling Logic of the SAVI Edge Isolation
Application

47
portion of the network to be directly connected to non-OpenFlow-controlled L2 networks, where support for port bonding may not exist.
Additionally, when the application attempts to install any flow rules where the input port belongs to a bond, similar flows will also be installed for each port within that bond, but with the in_port match field changed to correspond with each port. If a flow is to be installed for an output port that is found to belong to a bond, the actual output port will be chosen based on round-robin fashion over the ports within the bond. This round-robin selection is a simple method for balancing out the traffic flows over the ports of the bond. Figure 3.6 shows the pseudo-code for this implementation.
Figure 3.6: Pseudo-code for flow installation involving bonded ingress & egress ports

48
Awareness of slices in FlowVisor is another feature in the SAVI Edge Isolation application. Occasionally, if a problem occurs in FlowVisor that causes FlowSpace rules to be deleted, packets that were intended for a guest controller will instead be forwarded to the default controller. As our default controller, Ryu, forwards everything up to the network control module, the Edge Isolation application will receive it and check the network ID associated with the packet’s source MAC address. The application consults with the network state contexts stored in the database and determines whether or not the network ID has been delegated to a guest controller. If the virtual network is found to have been delegated, the application re-installs the appropriate FlowSpace rules into FlowVisor to ensure future packets are forwarded to the correct OpenFlow controller.
3.6 Preliminary Evaluation
In this section, a preliminary evaluation on the functionality and performance of the SAVI testbed’s network management system, based on the designs described in the previous sections of this chapter, will be presented. The combination of the Ryu OpenFlow controller serving as an OFI layer, with the Janus SDI manager running the network control module, will be henceforth designated as the Janus SDN system in this text. We note that at the time of writing this thesis, the initial first-step implementation of the Janus SDI framework, as well as the network control module, has been successfully tested within the SAVI testbed itself, and is currently running in all the SAVI Core and Edge nodes throughout Canada. Thus, from a functional perspective, the design has been verified both in internal trials as well as in deployment. While the initial focus of the work has been on functionality, we now must move towards understanding the limits of the system’s performance and how it may be improved. We begin by clarifying the scope of this initial evaluation as well as present the approach taken.
3.6.1 Scope and Methodology
The evaluation of the Janus SDN system will focus on measuring the packet throughput rate of the system, which is the primary metric we wish to know. Another metric that we will briefly examine is the latency incurred when an OpenFlow switch sends a packet up to the Janus SDN system for processing. In addition, we will attempt
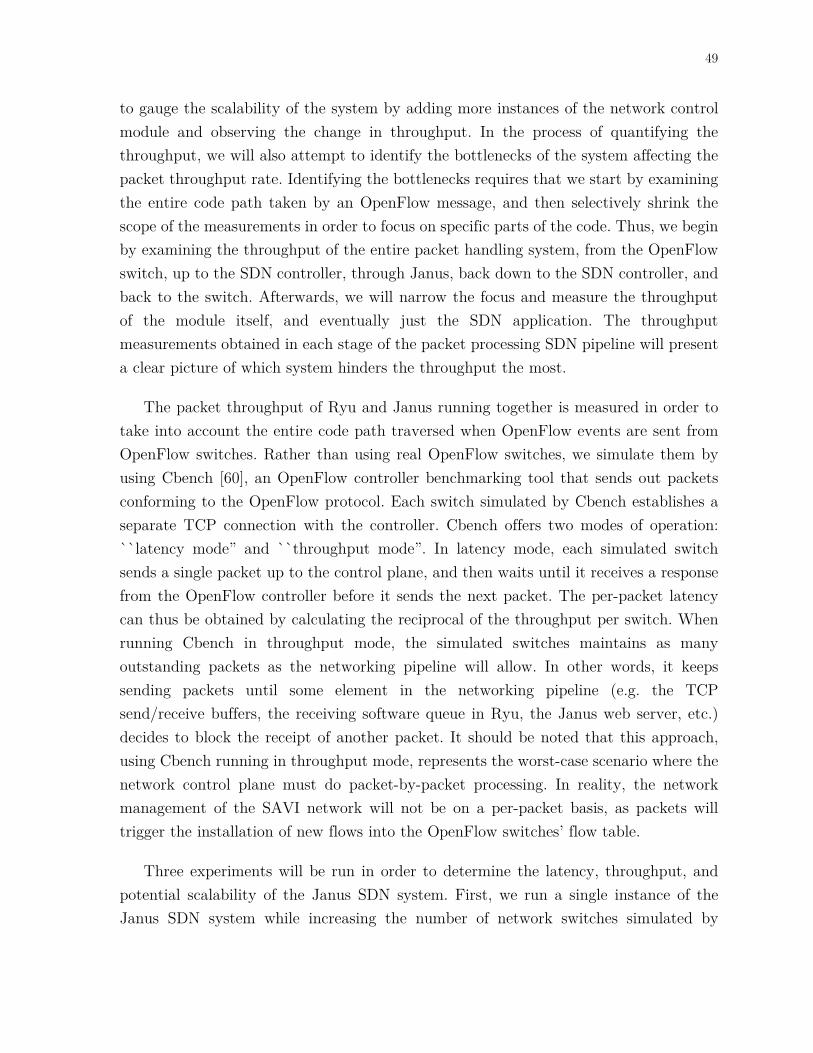
49
to gauge the scalability of the system by adding more instances of the network control module and observing the change in throughput. In the process of quantifying the throughput, we will also attempt to identify the bottlenecks of the system affecting the packet throughput rate. Identifying the bottlenecks requires that we start by examining the entire code path taken by an OpenFlow message, and then selectively shrink the scope of the measurements in order to focus on specific parts of the code. Thus, we begin by examining the throughput of the entire packet handling system, from the OpenFlow switch, up to the SDN controller, through Janus, back down to the SDN controller, and back to the switch. Afterwards, we will narrow the focus and measure the throughput of the module itself, and eventually just the SDN application. The throughput measurements obtained in each stage of the packet processing SDN pipeline will present a clear picture of which system hinders the throughput the most.
The packet throughput of Ryu and Janus running together is measured in order to take into account the entire code path traversed when OpenFlow events are sent from OpenFlow switches. Rather than using real OpenFlow switches, we simulate them by using Cbench [60], an OpenFlow controller benchmarking tool that sends out packets conforming to the OpenFlow protocol. Each switch simulated by Cbench establishes a separate TCP connection with the controller. Cbench offers two modes of operation: ``latency mode” and ``throughput mode”. In latency mode, each simulated switch sends a single packet up to the control plane, and then waits until it receives a response from the OpenFlow controller before it sends the next packet. The per-packet latency can thus be obtained by calculating the reciprocal of the throughput per switch. When running Cbench in throughput mode, the simulated switches maintains as many outstanding packets as the networking pipeline will allow. In other words, it keeps sending packets until some element in the networking pipeline (e.g. the TCP send/receive buffers, the receiving software queue in Ryu, the Janus web server, etc.) decides to block the receipt of another packet. It should be noted that this approach, using Cbench running in throughput mode, represents the worst-case scenario where the network control plane must do packet-by-packet processing. In reality, the network management of the SAVI network will not be on a per-packet basis, as packets will trigger the installation of new flows into the OpenFlow switches’ flow table.
Three experiments will be run in order to determine the latency, throughput, and potential scalability of the Janus SDN system. First, we run a single instance of the Janus SDN system while increasing the number of network switches simulated by
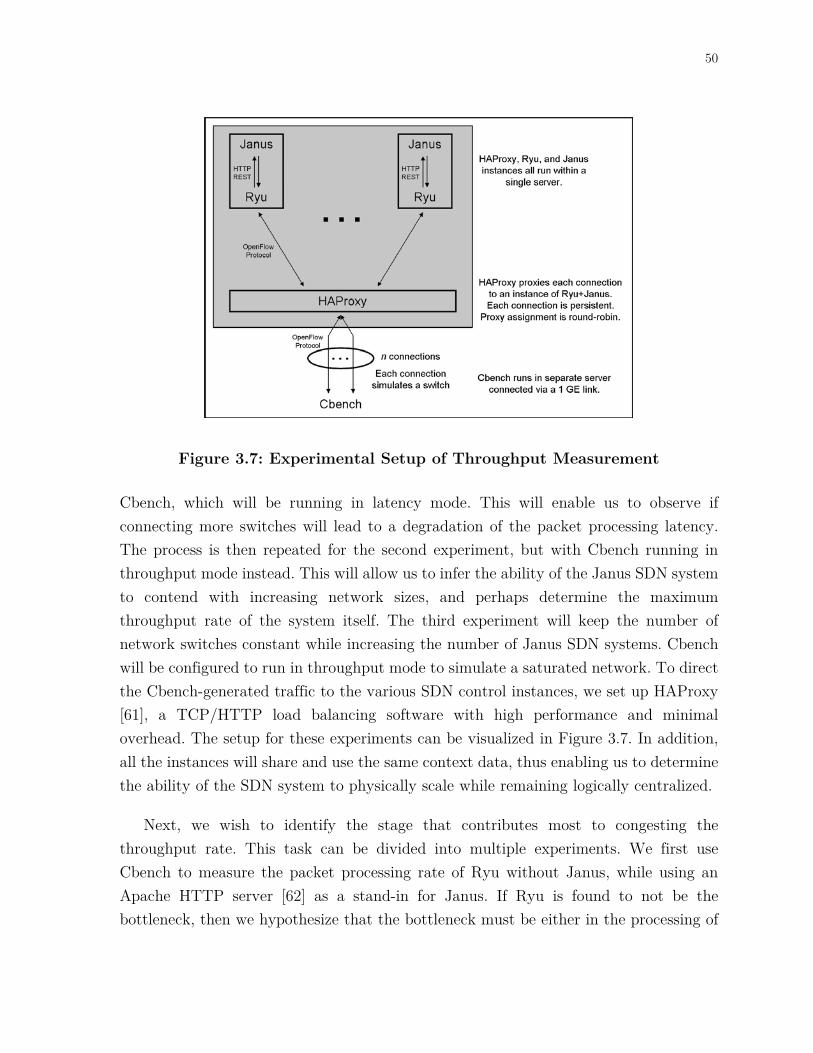
50
Cbench, which will be running in latency mode. This will enable us to observe if connecting more switches will lead to a degradation of the packet processing latency. The process is then repeated for the second experiment, but with Cbench running in throughput mode instead. This will allow us to infer the ability of the Janus SDN system to contend with increasing network sizes, and perhaps determine the maximum throughput rate of the system itself. The third experiment will keep the number of network switches constant while increasing the number of Janus SDN systems. Cbench will be configured to run in throughput mode to simulate a saturated network. To direct the Cbench-generated traffic to the various SDN control instances, we set up HAProxy [61], a TCP/HTTP load balancing software with high performance and minimal overhead. The setup for these experiments can be visualized in Figure 3.7. In addition, all the instances will share and use the same context data, thus enabling us to determine the ability of the SDN system to physically scale while remaining logically centralized.
Next, we wish to identify the stage that contributes most to congesting the throughput rate. This task can be divided into multiple experiments. We first use Cbench to measure the packet processing rate of Ryu without Janus, while using an Apache HTTP server [62] as a stand-in for Janus. If Ryu is found to not be the bottleneck, then we hypothesize that the bottleneck must be either in the processing of
Figure 3.7: Experimental Setup of Throughput Measurement

51
the packet as it goes through Janus, or in the RESTful communication between Ryu and Janus. Within Janus, the potential bottleneck points include the shared channel which queues and distributes the OpenFlow-related messages sent from Ryu, as well the SDN application running on the network control module. Measuring the packet processing rate of the SDN application can be done by pre-loading the shared channel with OpenFlow PacketIn events, and then enabling the network control module to start processing packets. The rate at which the size of the shared channel, which is implemented as a queue, decreases will allow us to ascertain the packet processing rate of the SDN application running on the network control module. Since the shared channel may itself be a bottleneck, the same experiment can be repeated against increasing numbers of control module instances, in order to observe if the consumption rate increases linearly as we expect it to. Finally, in regards to the throughput of the RESTful API servers, they can be benchmarked using ApacheBench [63], a tool for measuring the performance of HTTP web servers.
Though the aforementioned experiments are designed to gather data measuring the throughput capacity of the Janus SDN system, it is also of interest to know the current load and utilization of that capacity in a deployed datacentre. As mentioned earlier, the Janus SDI manager and the network control module are both in use within all the SAVI nodes controlling the testbed’s production network. As of September 2013, the SAVI testbed comprised of one Core node and six Edge nodes, all of which have resources being actively used in experiments. The node with the most resources in use, the Toronto Core node, is thus chosen for monitoring the load on the system.
To summarize, we wish to understand three things from these experiments:
1. What is the packet processing latency and throughput rate of the Janus SDN system, as designed and implemented thus far?
2. Where are the bottlenecks of the Janus SDN system in regards to packet processing?
3. What is the current utilization of the Janus SDN system in the busiest SAVI node?

52
3.6.2 Results and Discussion
We present the results of our experiments to answer the three questions presented in the previous section. Our first set of experiments was designed to determine the latency incurred by, and throughput rate of, the Janus SDN system. As previously described, this was done in two experiments, both of which used a server equipped with two Intel Xeon E5-2650 CPUs, comprising of 16 cores (32 virtual cores) clocked at 2.0 GHz per core, and 64 GB of system RAM. A minimalistic installation of Ubuntu 12.04 serves as the operating system, with just the packages required to run Cbench, Ryu, and Janus installed. The experiments ran Ryu and Janus together against increasing number of switches as simulated by Cbench, once in latency mode, and again in throughput mode. The results for the latency and throughput experiments are presented in Figure 3.8 and Figure 3.9, respectively.
The data from Figure 3.8 shows the average packet processing latency of the Janus SDN system for varying network sizes. As expected, the latency increases proportionally with the number of switches as packets are processed serially by the Janus SDN system, and thus must wait longer if there are more switches sending packets. The base processing latency (which assumes the packet does not have to wait to be processed) is quite low at approximately 5 ms. While this result appears promising, we note that the
Figure 3.8: Packet processing latency vs. Increasing # of switches Single Janus SDN system; Cbench in latency mode

53
nature of the experiment (i.e. switches sending one packet at a time) simulates a lightly loaded network, and it is yet unknown how, if at all, the packet processing latency may be affected under higher load conditions.
Figure 3.9 shows that the packet throughput of the Janus SDN system with Cbench running in throughput mode, thus simulating a saturated network. We had assumed, by trivial reasoning, that the throughput of the two-switch network would be less than or equal to double that of the one-switch network. However, the data shows that the throughput in the two-switch network case is greater than double of the one-switch network case’s throughput. In addition, we observed that the throughput does not appear to increase any further as the number of switches continues to scale beyond two. In fact, we observed that the throughput of the overall system dipped sharply as the number of switches grew and, by the five-switch network case, falls below that of the one-switch case. This behaviour may indicate something in the system is delaying the processing of the packets when multiple switches spam the Janus SDN system with packets, leading to a congestion effect. We mention once again that this experiment simulates the worst case scenario when the network is heavily saturated and all packets are forwarded to the control plane for processing. A thorough examination of the system and investigation into the root cause of this behaviour is thus required later on to handle this worst-case scenario.
Figure 3.9: Throughput vs. Increasing # of switches Single Janus SDN system; Cbench in throughput mode

54
An interesting conundrum is presented if the throughput of the first experiment (which is just the reciprocal of the latency multiplied by the number of switches, since the simulated switches were sending one packet at a time) is compared to the throughput of the second experiment. The linear nature shown in Figure 3.8 shows that the throughput levels off for networks with two or more switches, at a rate of roughly 400 packets per second. Thus, for the cases when the number of switches is greater than or equal to three, it appears that the throughput of the Janus SDN system in first experiment is actually higher than the rates from the second experiment. Also, while the results from the latency experiment show a consistent throughput beyond the two-switch case, the results from the throughput experiment shows a continuously degrading throughput. This reinforces the theory that something in the system is congesting the processing of the packets when the network switches are spamming the Janus SDN system.
The third experiment kept the number of switches constant while increasing the number of Janus SDN systems. Cbench was run in throughput mode so as to simulate
Figure 3.10: Constant # of switches. Throughput vs. # of Janus SDN systems
0
500
1000
1500
2000
2500
3000
3500
4000
1 2 3 4 5 6 7 8 9 10 11 12 13 14 15 16
# of Janus SDN Systems
Thro
ughp
ut (p
acke
ts/s
ec)
8 switches 16 switches

55
a saturated network. The setup for this experiment was previously described and illustrated in Figure 3.7. We present two data sets, one simulating 8 switches and a second simulating 16 switches, in the hopes of observing how doubling the number of switches in the network may affect the throughput of the overall system. Figure 3.10 presents the data collected.
When we simulated with 8 switches, we observed the throughput increasing rapidly as more Janus SDN systems were added. The throughput increases up until we have 8 instances of the SDN system, and levels off from there. This makes sense, as each switch connects to a Janus SDN system via a dedicated OpenFlow-TCP connection, 8 switches would require at most 8 Janus SDN systems. Thus, if we assume that the 8 switches have individually saturated each Janus SDN system, this indicates an average throughput rate of roughly 2400 / 8 = 300 packets per second for each SDN system. We note that this result does not appear to agree with the second experiment; with a single Janus SDN system, the single-switch case in Figure 3.9 shows a lower throughput, while the two-switch case shows that the system has the capacity to handle many more packets. These perplexing and contradicting results require further investigation later on.
In a similar fashion, the simulation with 16 switches sees the throughput increase rapidly up until 8 instances of the Janus SDN system were running, and continues to increase afterwards albeit at an ever slowing growth rate. This slowing of the growth of the throughput appears to reflect what was observed in Figure 3.9, which shows that one switch connected to a single Janus SDN system has lower throughput than two switches. While these consistent results seem to indicate that the simulated switch is unable to fully saturate the Janus SDN system, [60] shows that Cbench is able to send requests many orders of magnitude greater. We also note that the throughput is lower than the 8-switch scenario when the number of Janus SDN systems was below eight. Again, this agrees with the findings from Figure 3.9 showing a degradation in the throughput as three or more switches are connected simultaneously to a Janus SDN system. Further investigation is thus warranted to properly assess the cause of this behaviour. Regardless, we note that the results in Figure 3.10 shows that the Janus SDN system is able to physically scale in a distributed manner, corresponding to an increase to the packet processing capacity of the control plane.
After completing the throughput experiments for the Janus SDN system, which involves the entire SDN packet processing pipeline, we attempt to identify the

56
bottlenecks within the pipeline. The first potential bottleneck point is Ryu itself. To test Ryu’s performance without Janus, we again used Cbench running in throughput mode, while using an Apache HTTP server as a stand-in for Janus. From the Apache access log file, we calculated the throughput rate of the Ryu-based OpenFlow forwarding application. This experiment was conducted with and without HAProxy in the TCP path in order to see how much it impacts the performance numbers. Cbench was used to make ten runs each, each run lasting 20 seconds, and the average of all the runs was calculated. Table 3.1 shows the throughput benchmarking results of Ryu. As can be seen in the table, the throughput is roughly 4.5 times greater than the previous results seen in Figure 3.9, thus eliminating Ryu as the potential bottleneck. In addition, it was found that the throughput degradation due to HAProxy was less than 2%.
In the event that Ryu was eliminated as the bottleneck, we had hypothesized that the likely bottleneck points within Janus may lie in either the shared events channel which passes the OpenFlow messages to the network control module, the packet processing in the SDN application running on the network control module, or in the web servers used to facilitate the HTTP-based communications between Ryu and Janus. For benching the shared channel and the SDN application, we pre-loaded the shared events channel with 1 million OpenFlow PacketIn events (i.e. not including the mandatory OpenFlow Hello packets for switch connection and FeaturesReply packets where each switch reports its capabilities to the controller), and then started the network control
Ryu Forwarding Application Throughput
Without HAProxy (requests/sec.)
910.1732
With HAProxy (requests/sec.)
894.0056
Throughput Degradation Due to HAProxy
- 1.78%
Table 3.1: Ryu Forwarding Throughput Comparison (HAProxy vs No Proxy)

57
module. This procedure was repeated numerous times with increasing numbers of network control module instances, while using the SAVI Edge Isolation application on each module. The results of this experiment are shown in Figure 3.11.
The data collected shows that the throughput of the network control module running the SAVI Edge Isolation application is over an order of magnitude higher than that of the overall Janus SDN system, thus eliminating it as a potential bottleneck. Promisingly, it can be seen that the scalability of packet processing capacity is quite close to being directly proportional to the number of control modules, thus also eliminating the shared events channel as the bottleneck while showing it to be quite scalable. The average throughput per module did decrease slightly, as was expected, from roughly 20,000 packets/sec in the single-module case to roughly 18,000 packets/sec in the eight-module case.
Using ApacheBench, we attempted to quantify the throughput of the web servers used in the HTTP-based communication between Ryu and Janus, which was the remaining candidate from our earlier hypothesis. Specifically, we sent HTTP requests to
Figure 3.11: Packet Throughput vs. # of Network Control Modules Running SAVI Edge Isolation application on each module
0
20000
40000
60000
80000
100000
120000
140000
160000
1 2 3 4 5 6 7 8
# of Network Control Modules
Thro
ughp
ut (p
acke
ts/s
ec)

58
the web servers and measured the number of replies received. Each throughput measurement was done using 1 ApacheBench thread sending 100,000 requests to a valid API that does nothing but return an HTTP status of 200 OK, and repeated four times. The results of the measurements were then averaged. Table 3.2 summarizes our findings.
The benchmarking of the web servers involved in the communication between Ryu and Janus reveal that the Janus web server should be the bottleneck point in the throughput of the Janus SDN system, as they are the last components in the packet processing pipeline to be considered. However, it is still roughly 200 requests per second higher compared to the highest throughput observed in Figure 3.9, indicating that there may exist a component in the packet processing pipeline which we have not yet considered. Further analysis of the individual components involved in the Janus SDN system will be needed to successfully identify the bottleneck.
Having quantified the worst-case scenario throughput capacity in the second experiment, we wish to now determine the use of that capacity in an active SAVI node. It was decided earlier to monitor the load on the SDN system within the Toronto Core node due to the fact that it contains the most active virtual machines, belonging to multiple experiments. As of September 2013, the Core node was involved in 14 projects, with up to 50 users, and roughly 150 virtual machines and other computing resources aiding SAVI-affiliated researchers in their experiments. At the time of data collection, the node consisted of one controller and eleven interconnected computing servers (each running an OpenVswitch within), one object storage server, one volume server, and two physical OpenFlow-enabled switches.
The HTTP calls up to the network control module can be monitored using dumpcap [64], a command-line traffic monitoring tool. It should also be noted that in the deployment of the Janus SDN system, OpenFlow rules are actively installed into the
Ryu Web Server
Janus Web Server
Throughput (requests/sec.)
1190.9925 756.5125
Table 3.2: Web Server Performance Measurements
59
flow tables of the switches in the network, with a timeout of 3000 seconds. Thus, this prevents future packets belonging to the same flow from requiring intervention from the SDN control plane (at least until the flow entry in the switches’ table times out). Figure 3.12 shows the packet-in requests per hour over roughly four weeks on the Core node. The Core node’s controller runs a single instance of the network control module on a server with two E5-2650 CPUs with 16 cores (32 virtual cores) clocked at 2.0 GHz, similar to the server used for all the previous experiments.
The monitoring results shows that the design and implementation of the Janus SDN system can process and handle the amount of unique traffic flows generated by the running virtual machines and other computing resources in the SAVI testbed. The highest spike observed in Figure 3.12 is 19,231 packet-in requests within an hour on September 6th, which represents approximately 5.34 packets per second, well below the throughput gathered from the worst-case scenario shown in Figure 3.9.
Figure 3.12: Packet-In Requests to the network control module in the SAVI Core node
0
2000
4000
6000
8000
10000
12000
14000
16000
18000
20000
Sep
t. 5
Sep
t. 5
Sep
t. 6
Sep
t. 7
Sep
t. 8
Sep
t. 9
Sep
t. 10
Sep
t. 11
Sep
t. 12
Sep
t. 13
Sep
t. 14
Sep
t. 15
Sep
t. 16
Sep
t. 17
Sep
t. 18
Sep
t. 19
Sep
t. 20
Sep
t. 21
Sep
t. 22
Sep
t. 23
Sep
t. 24
Sep
t. 25
Sep
t. 26
Sep
t. 27
Sep
t. 28
Sep
t. 28
Sep
t. 29
Sep
t. 30
Sept. 5th - Sept. 31st, 2013
Pack
et-In
Req
uest
s / h
our

60
3.6.3 Conclusion
The results obtained and shown in subsection 3.6.2 showed some informative results, while simultaneously presenting a few mysteries which remains to be solved. We first summarize the unexplained observations which require further attention and investigation:
1. As seen in Figure 3.9, the packet processing throughput of a one-switch network is lower than that of a two-switch network
2. The packet processing throughput as shown in Figure 3.9 degrades exponentially for networks containing more than two switches
3. The throughput of the first experiment (benchmarking latency) is greater than the throughput of the second experiment (benchmarking throughput)
4. The average per-Janus SDN system throughput rate, as calculated from Figure 3.10, is higher than the single-switch network throughput shown in Figure 3.9
With regards to the three questions which we posed earlier at the end of subsection 3.6.1, we were able to answer the first and third questions, but not the second. To reiterate, the first question was seeking to find the packet processing latency and throughput rate of the current Janus SDN system. We found that with a single instance, the packet processing latency is as low as 5 ms (refer to Figure 3.8), while the throughput rate can go as high as 558 packets per second (refer to Figure 3.9).
The third question we posed was meant to determine the current utilization of the Janus SDN system in the SAVI testbed’s busiest node, the Toronto Core node. The utilization was measured over a period of almost four weeks, and the results displayed in Figure 3.12. Considering that the Core node, at the time of data collection, was supporting roughly 150 virtual machines and other computing resources, belonging to up to 50 SAVI researchers partaking in 14 different projects, it was satisfying to observe that the traffic generated by the various testbed activities could be comfortably accommodated by the current implementation of the Janus SDN system.
The second question which we sought to answer was in regards to the bottleneck of the Janus SDN system. Through various methods, we isolated and individually benchmarked the various sections of the packet processing pipeline. While we identified

61
the Janus web server to be the component that should have been the bottleneck, the throughput obtained from benchmarking it alone was still higher than the throughput results obtained from answering the first question. This perplexing result may mean that there exists a component crucial to the processing of packets that we have overlooked and yet to benchmark, or it may mean that the combination and interaction between the various components somehow leads to a congestion effect which we did not foresee. In either case, the Janus SDN system will require further analysis and investigation to explain these results and put the question of the bottleneck to rest.

62
Chapter 4
Scaling of Janus SDN System
The focus of this chapter will be on improving the initial implementation and design of the Janus SDN system with regards to its processing capacity. In order to undertake this task, an analysis must be done on the initial implementation of the Janus SDN system, specifically, the implementation of Janus, the network control module, and the Ryu-based OFI layer. The preliminary evaluation done in section 3.6 presented us with results which raised new questions. In addition, there remains the unfinished task of identifying the bottleneck of the packet processing pipeline within the Janus SDN system. The initial analysis and investigation to identify the bottleneck revealed that there are other factors affecting the performance which was not originally considered. This chapter will begin by aiming to address the questions and issues raised during the preliminary evaluation section of the previous chapter. The results of this extended investigation into the Janus SDN system will then provide a starting point upon which changes to the implementation will be explored, which will comprise the rest of the chapter. The preliminary performance results from the previous chapter will be used as a baseline for comparison.
4.1 Analysis of Initial Implementation
In this section, we will revisit the issues left over from the preliminary evaluation of the Janus SDN system. The data collected during the evaluation presented us with new questions which were summarized near the end of the previous chapter. In addition, we were unable to identify the bottleneck of the Janus SDN system despite the fact that we had individually benchmarked each stage of the pipeline. We will investigate each of the issues in the hopes of providing answers to some of the mysterious numbers observed

63
in the initial performance evaluation. It is hoped that the investigation into answering the questions may also help shed light on the search and identification of the bottleneck in the Janus SDN system. As a reminder, we pose as questions all the outstanding issues left over from section 3.6 which demand our attention:
1. Assuming Cbench is able to fully saturate the control plane, why is the throughput of a one-switch network lower than that of a two-switch network, as seen in Figure 3.9?
2. Why does the throughput in Figure 3.9 degrade for networks greater than two switches?
3. Why is the throughput of the first experiment (benchmarking latency) greater than the throughput of the second experiment (benchmarking throughput)?
4. Why is the average per-Janus SDN system throughput rate, as calculated from Figure 3.10, higher than the single-switch network throughput shown in Figure 3.9?
5. Where are the bottlenecks of the Janus SDN system in regards to packet processing?
4.1.1 CPU Frequency Scaling Governor
We begin our investigation by looking into the first outstanding question listed in the previous subsection. The first question deals with the odd results seen in Figure 3.9, where the maximum throughput capacity of the Janus SDN system is lower in a one-switch network case as opposed to a two-switch network case. The results appear to indicate that the performance of the control plane is somehow dependent on the network size.
After a thorough investigation and analysis was done, it was discovered that the clock rate of the CPU cores in our experimental servers were not running as advertised. This is due to the CPU frequency scaling governor within Ubuntu responsible for individually adjusting the clock rate of each core in order to save power. The OS caps the clock rate of each CPU core at a rate lower than advertised, and specifically raises
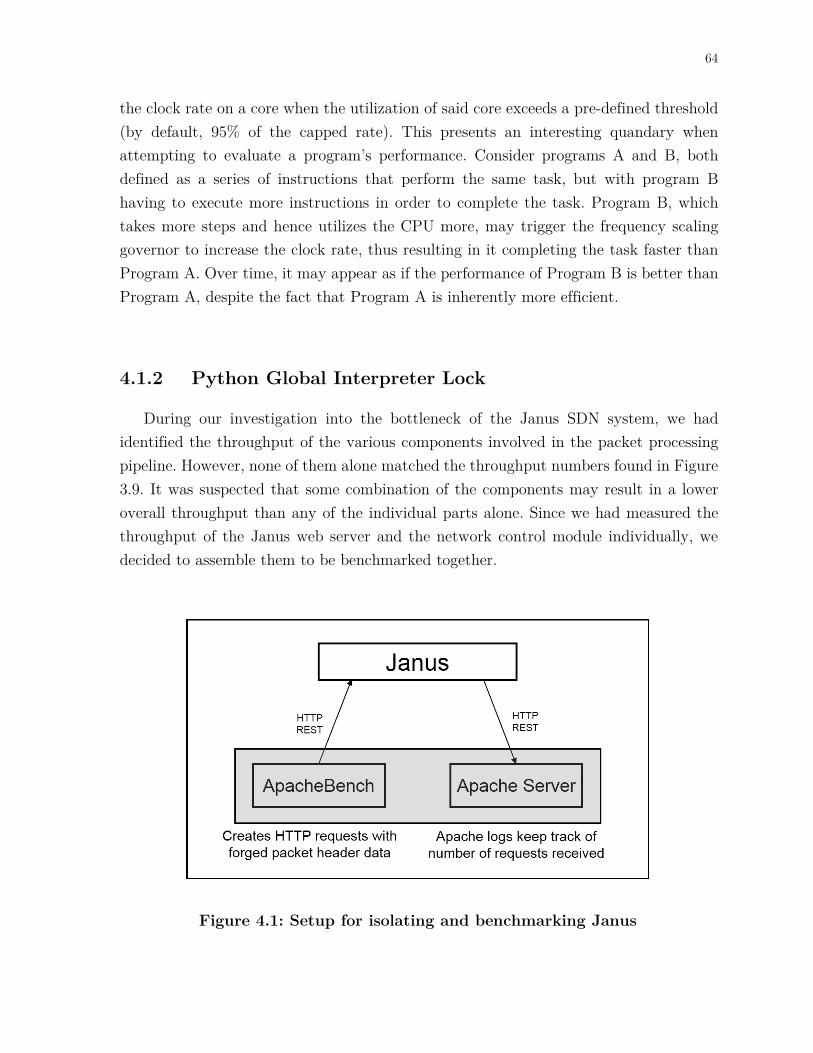
64
the clock rate on a core when the utilization of said core exceeds a pre-defined threshold (by default, 95% of the capped rate). This presents an interesting quandary when attempting to evaluate a program’s performance. Consider programs A and B, both defined as a series of instructions that perform the same task, but with program B having to execute more instructions in order to complete the task. Program B, which takes more steps and hence utilizes the CPU more, may trigger the frequency scaling governor to increase the clock rate, thus resulting in it completing the task faster than Program A. Over time, it may appear as if the performance of Program B is better than Program A, despite the fact that Program A is inherently more efficient.
4.1.2 Python Global Interpreter Lock
During our investigation into the bottleneck of the Janus SDN system, we had identified the throughput of the various components involved in the packet processing pipeline. However, none of them alone matched the throughput numbers found in Figure 3.9. It was suspected that some combination of the components may result in a lower overall throughput than any of the individual parts alone. Since we had measured the throughput of the Janus web server and the network control module individually, we decided to assemble them to be benchmarked together.
Figure 4.1: Setup for isolating and benchmarking Janus
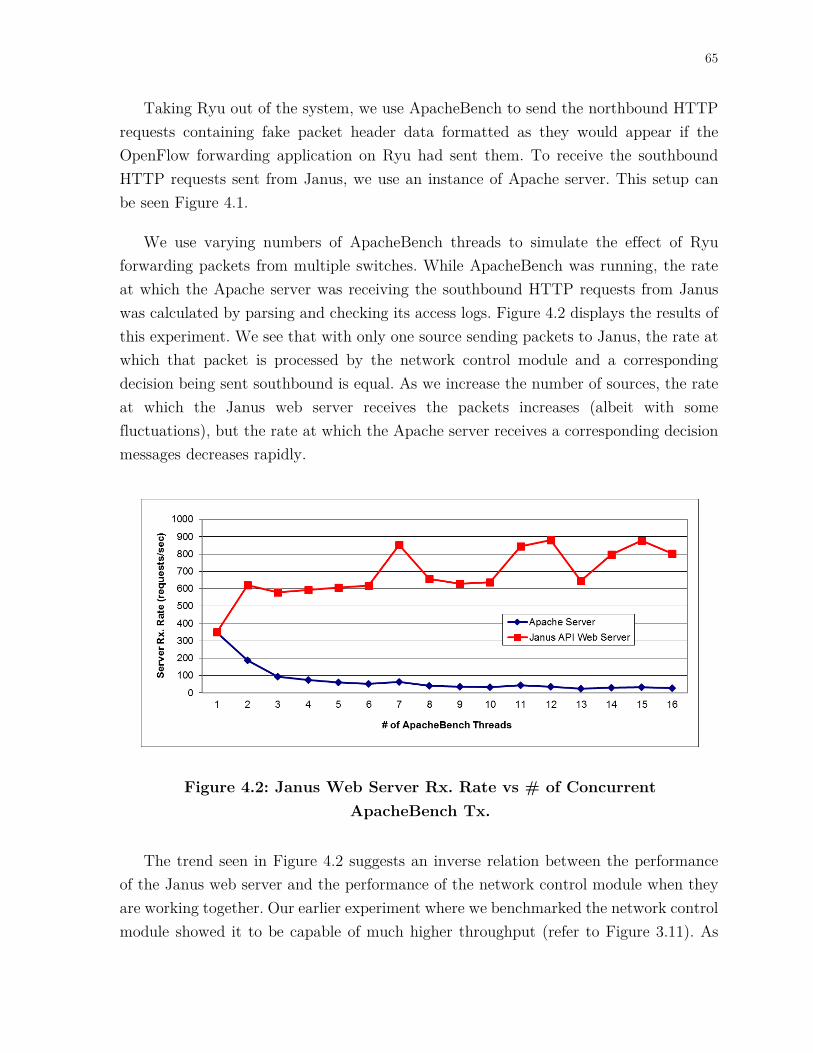
65
Taking Ryu out of the system, we use ApacheBench to send the northbound HTTP requests containing fake packet header data formatted as they would appear if the OpenFlow forwarding application on Ryu had sent them. To receive the southbound HTTP requests sent from Janus, we use an instance of Apache server. This setup can be seen Figure 4.1.
We use varying numbers of ApacheBench threads to simulate the effect of Ryu forwarding packets from multiple switches. While ApacheBench was running, the rate at which the Apache server was receiving the southbound HTTP requests from Janus was calculated by parsing and checking its access logs. Figure 4.2 displays the results of this experiment. We see that with only one source sending packets to Janus, the rate at which that packet is processed by the network control module and a corresponding decision being sent southbound is equal. As we increase the number of sources, the rate at which the Janus web server receives the packets increases (albeit with some fluctuations), but the rate at which the Apache server receives a corresponding decision messages decreases rapidly.
The trend seen in Figure 4.2 suggests an inverse relation between the performance of the Janus web server and the performance of the network control module when they are working together. Our earlier experiment where we benchmarked the network control module showed it to be capable of much higher throughput (refer to Figure 3.11). As
Figure 4.2: Janus Web Server Rx. Rate vs # of Concurrent ApacheBench Tx.

66
mentioned in subsection 3.2.4, once events are put into the shared events channel, which is implemented by a queue, a secondary thread is responsible for consuming the queue and dispatching the events to the modules that have registered callback functions for the events. The latest data appear to show that the consumption thread severely underperforms when the web server thread is highly active.
Our investigation into this matter eventually led us to the global interpreter lock (GIL) used by each Python process/interpreter. The purpose of this lock is to simplify multi-threaded programming for developers. Multi-threading management is simplified in that the interpreter only executes a single thread at a time, as each thread must acquire the lock prior to running on the interpreter. This implementation greatly simplifies, or often times eliminates, synchronization issues for the developer. While this multi-threading management scheme means that Python is not ideal for CPU-bound multi-threaded programs, it can still yield improvements if the threads are I/O bound. For true parallelization, Python must rely on multi-processing.
When compared to Figure 3.9, one can see that the rates reported in Figure 4.2 appear worse. We believe this is due to the fact that Ryu is inherently a single-threaded process utilizing greenthreading (refer to subsection 4.1.3) as a way to achieve a limited degree of parallelism. Thus, the data expressed in Figure 4.2 show the actual performance of the Janus SDN system if each switch had a dedicated unit responsible for forwarding the OpenFlow events to Janus. The effect of the GIL on Janus appears to the primary cause of the congestion in the packet processing pipeline in the control plane. As the server thread is actively busy receiving requests and inserting OpenFlow events into the shared events channel, it gets a greater share of the time holding the GIL, and the consumption thread gets only a fraction of the GIL’s time to do its part.
4.1.3 Greenthreading
During the investigation into the throughput degradation observed in Figure 4.2, we were curious as to how Ryu, a single-threaded process, was able to send multiple requests to Janus in a seemingly simultaneous manner. We had assumed that Ryu would act as a serialization mechanism in forwarding the OpenFlow events up to Janus, and given HTTP’s synchronous nature, it was also thought that the next request would only be sent after a reply was received for the previous request. This was what we simulated

67
when we benchmarked the Janus and Ryu web servers in Table 3.2, which utilized a single thread of ApacheBench. We shifted the investigation into the implementation details of Ryu and, more specifically, into the greenthreading mechanism used by Ryu.
As an aside, we first briefly describe the definition and role of greenthreading. Greenthreading is a general term used to describe a lightweight alternative to traditional multithreading [65], wherein a single thread can be partitioned into many greenthreads. In Python, greenthreads are a way to realize coroutines [66]. Coroutines can be described as a form of cooperative multitasking, where the execution of code must be explicitly relinquished from one task to another, rather than pre-emptive multitasking, where a task is interrupted by some scheduler responsible for switching between tasks. It should be noted that we use the term ‘task’ here to indicate either a thread or a process. Traditional multithreading and multiprocessing both fall under the pre-emptive model, as it doesn’t require the programmer to explicitly state when the program should yield control over the CPU, and instead relies on a central scheduler to initiate a context switch for the various threads and processes requiring the CPU. The reliance on a central scheduler to switch tasks usually guaranties the various tasks a more fair share of the CPU’s time. In addition, pre-emptive multitasking on processes enables the system to immediately deal with urgent events such as kernel traps or other types of system interrupts. We note that most of the components within OpenStack utilize greenthreading via a library called Eventlet [67]. They use greenthreads to achieve some semblance of concurrency in an environment that prevents multi-threading due to the existence of the GIL. Both Ryu and Janus also use greenthreading as a way to boost single-threaded performance and ensure maximal use of the CPU time. Within the rest of this text, we will use the term ‘greenthread’ to be synonymous with ‘coroutine’.
Ryu utilizes a greenthread-based networking library, gevent [68], which provides monkey patching [69] of specific OS and network-related libraries to work with coroutines. Ryu monkey patches all the libraries such that an OS call to spawn a thread, for example, would create a greenthread instead of a standard thread. Thus, Ryu operates as a single thread in a single process, but with multiple greenthreads. gevent simplifies coding for developers by having a central hub act as a scheduler, which runs in its own greenthread. The use of this central hub, which is responsible for deciding which greenthread is to be scheduled next, puts it somewhere between the pre-emptive and cooperative multitasking models described earlier. System and network calls that would normally cause the thread to block, such as waiting on a socket for I/O, are

68
patched such that rather than blocking, it acts as an implicit call to yield control and switch to another greenthread. This mechanism improves the efficiency of single-threaded execution models that are I/O bound, as the thread of execution may continuously have something to do (rather than switching to another process). Similarly, explicitly relinquishing control to another greenthread can still be done via calls to yield.
Going back to the degrading trend observed in Figure 3.9, we discover that this is likely due to the fact that each additional switch opens a separate TCP connection to Ryu, which spawns two separate greenthreads for managing each connection (one for receiving, one for sending). However, the Ryu web server only exists in a single greenthread, and thus the proportion of time it gets to execute in relation to the total pool of greenthreads is diminished as more switches connect. In addition, since gevent’s central hub only switches greenthreads upon either explicit calls to relinquish control, or patched system and network I/O calls that gets blocked, a connection from a switch that sends packets at rapid rates means that the chance of blocking is reduced. Each time the greenthread polls the socket, it is likely that there will be data ready to be read and therefore the call will not block, thus starving out other greenthreads. The combination of both these factors, the reduced proportion of execution time to the greenthread running the web server and the reduced chance of blocking when reading from very active OpenFlow connection sockets, effectively slows down the amount of southbound requests Ryu is able to receive from Janus, thus throttling the throughput of the entire Janus SDN system.
To test this hypothesis, an experiment was set up where Janus was replaced with an instance of Apache server. We then ran Cbench simulating 16 switches in throughput mode against an instance of Ryu running the OpenFlow forwarding app and the API web server. While Cbench was running, we simultaneously ran ApacheBench to benchmark Ryu’s web server. The setup for this experiment is fully illustrated in Figure 4.3. The rate at which Ryu’s web server was able to receive and process requests was measured to be roughly 60 requests per second, over an order of magnitude lower than the earlier benchmarking results shown in Table 3.2. This successfully confirms our hypothesis, and reveals another potential point of bottleneck in the Janus SDN system’s packet processing pipeline.
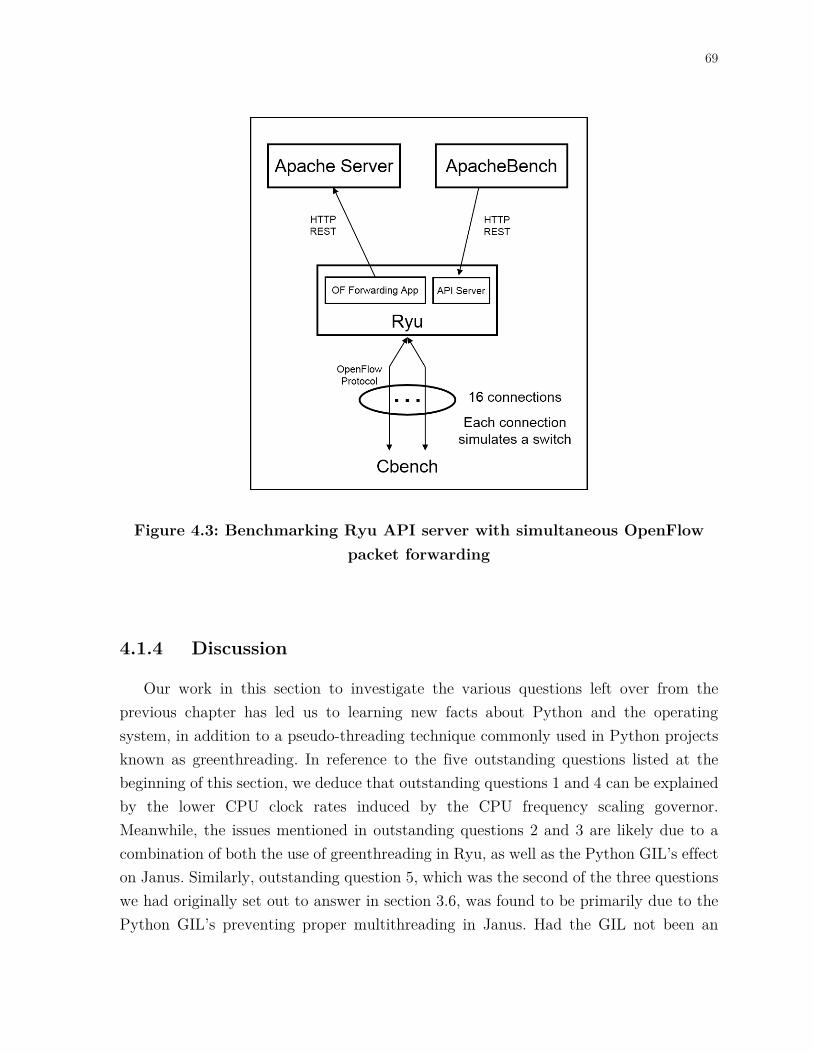
69
4.1.4 Discussion
Our work in this section to investigate the various questions left over from the previous chapter has led us to learning new facts about Python and the operating system, in addition to a pseudo-threading technique commonly used in Python projects known as greenthreading. In reference to the five outstanding questions listed at the beginning of this section, we deduce that outstanding questions 1 and 4 can be explained by the lower CPU clock rates induced by the CPU frequency scaling governor. Meanwhile, the issues mentioned in outstanding questions 2 and 3 are likely due to a combination of both the use of greenthreading in Ryu, as well as the Python GIL’s effect on Janus. Similarly, outstanding question 5, which was the second of the three questions we had originally set out to answer in section 3.6, was found to be primarily due to the Python GIL’s preventing proper multithreading in Janus. Had the GIL not been an
Figure 4.3: Benchmarking Ryu API server with simultaneous OpenFlow packet forwarding

70
issue, the starvation of the greenthread responsible for the Ryu web server would have been the bottleneck.
4.2 Stabilizing Performance
The effect of the CPU frequency scaling governor, the Python global interpreter lock, and the use of greenthreading discussed in the previous section all led to unpredictable performance in the Janus SDN system. To improve and stabilize the performance of the Janus SDN system under heavy loads, we need to either fix or work around these obstacles. The issue with the CPU frequency scaling governor can be resolved easily by adjusting the settings in the Ubuntu operating system, and manually changing the governor of all the virtual cores from ‘ondemand’ to ‘performance’. While this ramps up the power utilization of the server, it prevents the variable CPU clock rates that we have seen can have drastic effects on the performance of our software systems. Changing the CPU frequency scaling governor had immediate effects on the receive rates of the web servers used by Janus and Ryu. We re-bench the servers using a single ApacheBench thread. Table 4.1 shows a comparison of the old web server benchmarking data with the new data.
The Python GIL, which prevents threads within a process from running concurrently, can be worked around by switching to multi-processing. Fortunately, our
Ryu Web Server
Janus Web Server
Old Throughput (requests/sec.)
1190.9925 756.5125
New Througput (requests/sec.)
2718.1275 1079.6875
Increase + 128.22% + 42.72%
Table 4.1: Updated Web Server Performance Measurements

71
initial implementation of Janus has only one component which both threads are dependent on, which is the queue used as the shared events channel. The Python multi-processing library offers a version of the queue (which runs as a separate process) that works remarkably similar to the multi-threaded version, thus minimizing the changes necessary to upgrade Janus to use multi-processing. We start by creating a separate server dedicated to receiving the network API requests, which is responsible for receiving and parsing the received requests and inserting them into the shared events queue. When this change is combined with the change to the CPU frequency governor, we notice that the server’s performance has increased beyond that shown in Table 4.1. Figure 4.4 shows the increased performance of the Janus API web server, as well as the overall throughput of Janus. It can be observed that the overall throughput rate of Janus is now limited by the rate at which southbound requests can be made. The most important result, however, is the fact that, in contrast to what was observed in Figure 4.2, the southbound request rate no longer degrades as the load on Janus increases, and stays constant at roughly 1200 requests per second.
Resolving the greenthread starvation issue in Ryu, however, requires a reconsideration of how it is implemented. As the core implementation of the Ryu OpenFlow controller was not developed within SAVI, we wish to limit, as much as possible, any changes and modifications necessary to be within the applications (i.e. the
Figure 4.4: Updated Janus Throughput Measurements Janus Web Server Rx. Rate vs # of Concurrent ApacheBench Tx.
72
OpenFlow forwarding application, and the RESTful API application) that run on the controller. As mentioned in subsection 4.1.3, each switch that connects to Ryu spawns two new greenthreads, one for reading from the TCP connection socket, and one for writing to it. Meanwhile, the web server which enables the RESTful APIs resides within a single greenthread. As the greenthreads responsible for reading from the socket and receiving the OpenFlow messages get more busy, the likelihood of them blocking on read, which would implicitly trigger a switch to another greenthread, is reduced. Our workaround to this was to place a simple rate limiting mechanism into the code that would save the timestamps of the last 1000 messages received from all the switch connections, and calculate the arrival rate from those set of timestamps. If the rate is above a certain threshold, we explicitly call sleep, which is a system call that has been monkey patched by gevent, to trigger a switch to another greenthread. If the next greenthread scheduled happens to be another socket-reading thread, it will encounter the same rate limiting mechanism and immediately call sleep to switch greenthreads again. This happens until the greenthread responsible for the web server gets scheduled and it starts processing incoming HTTP requests.
Any application-level code which wishes to send a message back to the switch must insert the message into a per-switch queue. The greenthreads responsible for writing to the various sockets are simply endless loops that poll the outgoing message queue. Upon detection of a message in the queue, it pops the message and writes it to the socket. It is possible that despite the fact that the web server greenthread runs, the socket writing greenthreads starve. Thus, all the messages sent from Janus that are destined for the OpenFlow switches in the network are simply queued in Ryu, and never get sent down to the switches. To prevent this, we also implemented a checkpoint to ensure that the greenthreads responsible for writing to the TCP connection sockets get a chance to run. This checkpoint occurs right after the rate limiting mechanism mentioned earlier, and simply queries the size of the outgoing queue associated with the current connection. If it is over a certain limit, another call to sleep is made. When a socket-writing greenthread gets a chance to run, it runs until all the messages in the outgoing queue are consumed and written out to the socket before blocking and switching to another greenthread. The rate limiting mechanism as well as the output queue checking are illustrated in the pseudo-code seen in Figure 4.5.
While the rate limiting mechanism and the outgoing queue checks successfully prevent the greenthread starvation observed earlier, the performance of Ryu will still

73
degrade with more connected switches, simply due to the fact that the socket-related greenthreads outnumber the web server greenthread. With this change, we now re-bench a single instance of the Janus SDN system against increasing number of switches to observe the throughput degradation. Figure 4.6 shows a slower degradation of throughput compared to that seen in Figure 3.9.
While we have successfully stabilized the performance to avoid the sharp drop in throughput previously observed in the initial prototype of the Janus SDN system, it appears that we are now hitting a brick wall in the performance of a single API server. We now look towards ways to further improve the performance of the system by investigating how web services are commonly scaled to handle large amounts of requests.
Figure 4.5: Psuedo-code of packet forwarding rate limiter & Output queue checkpoint
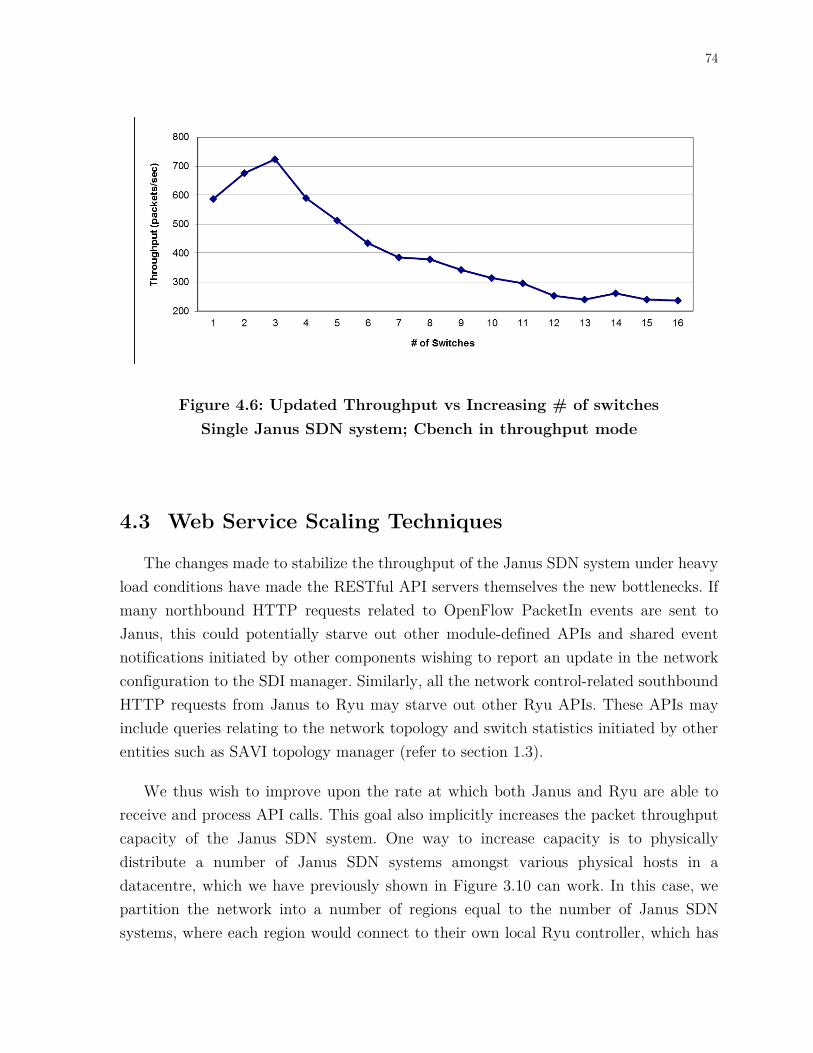
74
4.3 Web Service Scaling Techniques
The changes made to stabilize the throughput of the Janus SDN system under heavy load conditions have made the RESTful API servers themselves the new bottlenecks. If many northbound HTTP requests related to OpenFlow PacketIn events are sent to Janus, this could potentially starve out other module-defined APIs and shared event notifications initiated by other components wishing to report an update in the network configuration to the SDI manager. Similarly, all the network control-related southbound HTTP requests from Janus to Ryu may starve out other Ryu APIs. These APIs may include queries relating to the network topology and switch statistics initiated by other entities such as SAVI topology manager (refer to section 1.3).
We thus wish to improve upon the rate at which both Janus and Ryu are able to receive and process API calls. This goal also implicitly increases the packet throughput capacity of the Janus SDN system. One way to increase capacity is to physically distribute a number of Janus SDN systems amongst various physical hosts in a datacentre, which we have previously shown in Figure 3.10 can work. In this case, we partition the network into a number of regions equal to the number of Janus SDN systems, where each region would connect to their own local Ryu controller, which has
Figure 4.6: Updated Throughput vs Increasing # of switches Single Janus SDN system; Cbench in throughput mode

75
a corresponding local Janus. The SDN applications running atop the network control module would keep a centralized logical state by utilizing a shared memory object caching system such as memcached [70]. Similarly, the various instances can back up all state information in a central MySQL database, which can be used to reload from in case one or more of the instances crashes. As we are attempting to optimize the system under worst-case scenario, we thus focus on the case of a single centralized Janus SDN system, and how we can improve its API processing capacity. We note that this choice does not exclude the option to physically distribute the systems in the future, as it would merely lead to an even further increase in the processing capacity of both Janus and Ryu.
To increase the API processing capacity of Janus and Ryu, we must increase the number of web servers available to both components. We resort to multi-processing to spawn multiple HTTP web servers, each listening on a different port. The use of multi-processing circumvents the GIL’s limitation to multi-threading and also limits any server errors and crashes to just within its own process. In addition, separating the Ryu web servers out to their own processes will resolve the issue of the socket-related greenthreads competing against the web server greenthread. Communication between processes can be done using instances of the Python multiprocessing queue. To make these changes transparent to outside external clients and other users of the APIs, we once again utilize HAProxy to receive all the requests and distribute them amongst the multiple web server processes.
4.3.1 Multi-Processing Versions of Janus and Ryu
We start by describing the changes made to Janus to make it multi-processed and increase its API receiving and processing capacity. The creation of the API servers was originally the responsibility of the janus-init function, which it would do after instantiating the module manager and all the modules enabled (refer to Figure 3.1). It can be noted that the initial implementation used this server for receiving both the module-defined APIs as well as the single shared events API defined by the module manager. With the knowledge that the majority of the calls are OpenFlow events destined for the shared events API, we decide to create new web servers dedicated to processing these shared events. This plan frees up the original web server for receiving and processing requests made to the module-defined APIs.

76
We task the creation of the new servers, dedicated to receiving and processing the shared events, to the event manager within the Janus module manager. Each of these servers will run in its own dedicated process, as depicted in Figure 4.7. Given that we have already made the shared events channel an inter-process-capable queue during the work done as described in section 4.2, it is a simple matter to pass a handle/pointer referencing the queue to the newly spawned server processes. Upon the receipt of an event by one of the servers, it will parse the event and insert it into the shared events channel.
We do the same thing for Ryu by spawning a set of new web servers dedicated to receiving the southbound requests from Janus calling the OpenFlow-related APIs. These servers will exist in their own separate processes, which means the receiving rate of OpenFlow-APIs will no longer be influenced by the number of active OpenFlow switch connections. We create an inter-process queue in the main process and pass a handle referencing it to the various OFI-dedicated servers. Upon the receipt of an OpenFlow-related request, the server will parse the request and insert it into the queue. Within the
Figure 4.7: Multi-Process API Servers (Top: Janus APIs; Bottom: Ryu APIs)

77
main Ryu process, we create a single greenthread responsible for consuming the queue. However, in order to prevent the same issue observed before, where the socket-related greenthreads outnumber and gradually starve the single greenthread responsible for processing requests received by the web server, we designed it such that each request received and de-queued in the main Ryu process will spawn a new greenthread to handle the request. This helps to push back against the dominance of the number of socket-related greenthreads.
With the changes outlined above, both Janus and Ryu now have dedicated servers to receive and process the network-control related HTTP requests exchanged between them, while leaving their original servers open for processing API calls intended for other purposes. These changes would be fruitless, however, if we did not also increase the transmission capacity. Using a similar strategy, we spawn new processes, connected to the main process via an inter-process queue, dedicated to sending HTTP requests. Since HTTP is a synchronous protocol, this avoids the issue of the main process having to block whenever it is waiting for an HTTP response. With all the changes in place, the final architecture can be visualized in Figure 4.8.
Figure 4.8: Fully Multi-Proc Ryu and Janus

78
4.3.2 Load Balancing
For each new server spawned, it has to listen on a separate port number. In order to make these changes transparent, we employed HAProxy to listen on the original default port numbers and redirect the requests to the new servers. HAProxy is highly configurable and contains many different load balancing strategies for deciding which backend server to redirect to. We consider two of the offered strategies: round-robin and least connected. For long lasting TCP connections, least connected would be the optimal strategy, as it would redirect the connection to the backend server with the least number of active connections from HAProxy. In the case that multiple backend servers have the same number of active connections, and have the same assigned weight, HAProxy chooses one amongst them based on round-robin. For short lived connections, round robin would be more ideal. For most HTTP-based RESTful services, the connections are short lived HTTP requests. However, part of our strategy of improving the communication between Ryu and Janus was to make persistent HTTP connections, wherein multiple HTTP request-response transactions can be made within the context of a single TCP session. Thus, we opted for the least connected load balancing strategy.
As our new servers are meant to handle only the OpenFlow-related APIs, we configure HAProxy to parse the request URL. Requests that are determined to be destined for the OpenFlow APIs are redirected to the new servers, otherwise HAProxy falls back on a default server. The default server, for both Ryu and Janus, is the existing API server running within the main process. Our use of persistent HTTP connections helps offset the delay caused by the per-request URL parsing and checking that HAProxy would otherwise be performing.
4.4 Distribution of FlowVisor
As discussed in subsection 3.3.4, the SAVI testbed utilizes FlowVisor to enable network slicing, allowing users the option to delegate control over their virtual networks to their own custom OpenFlow controllers. At the time of writing this thesis, it appears that the project has been abandoned as of version 1.4, with the last code update done on August 30th, 2013. Thus, it is unknown if future work will be done to enhance the stability of the component. To mitigate the risk of any errors or malfunctions in the component, we decide to distribute FlowVisor amongst several servers within the SAVI

79
testbed, with each one responsible for controlling and slicing only a subset of the switches in the testbed. In the event one of the FlowVisors encounters an error, the damage done to the network will only be limited to the region it controls.
Distributing FlowVisor leads to new challenges, as Janus must be able to issue commands to slice the entire testbed network. The initial implementation of network control module running on Janus had the module directly call the FlowVisor RESTful APIs to configure it. With many instances of FlowVisor, the network control module will need to interact with all of them in order to slice the network. This may cause a significantly higher delay between the time the module decides to slice the network until the time the network is ready to be used by the user. To resolve this issue, the responsibility of configuring and interacting with each FlowVisor is distributed as well. A FlowVisor agent process is assigned to each instance of FlowVisor, which will keep track of the network slicing decisions made by the network control module and implement them in its associated FlowVisor. The task of keeping track of the network slicing decisions is done via reading the central MySQL database where Janus and the network control module backs up all the state-related data.
4.4.1 Design and Implementation of FlowVisor Agent
The FlowVisor agent is designed to run a simple loop, auditing the FlowVisor FlowSpace table to ensure that it conforms with the slicing decisions made by the network control module on Janus. It is assumed that since the network control module updates the MySQL database with any state-related changes, it has the most up-to-date decisions made regarding the network. Working under this assumption, for each loop, the FlowVisor agent will:
1. Sync its internal state context (stored in memory) with the MySQL database;
2. Read the state of the associated FlowVisor instance;
3. Determine if any slices exist in FlowVisor that doesn’t exist in the database, and if so, delete them;
4. Determine if any slices exist in the database that doesn’t exist in FlowVisor, and if so, create them;

80
5. Obtain the list of connected switches (identified by their datapath IDs);
6. Filter the list of FlowSpace rules from the database to find ones containing to the connected datapath IDs;
7. Determine if any FlowSpaces exist FlowVisor that doesn’t exist in database, and if so, delete them from the table;
8. Determine if any FlowSpaces exist in the database that doesn’t exist in FlowVisor, and if so, install them into the table.
The decision to delete slices and FlowSpaces first prior to creating and installing the new ones was important to avoid conflicts or break the virtual network isolation. Consider a case with two slices, Slice A and Slice B, both owned by the same user, with a virtual network assigned to Slice A. The owner of the virtual network then decides to un-assign it from Slice A, and switch control over it to Slice B. Had the agent installed the new FlowSpaces first, there would briefly exist a conflict where two FlowSpace rules have the same packet match criteria, but with different slices to forward it to. Thus, the stale FlowSpace rules may lead packets in active flows to be redirected to another controller in the brief time between installing and uninstalling the FlowSpace rules.
4.5 Re-evaluation
In this section, the Janus SDN system will be re-evaluated based on the changes described within the previous sections of this chapter. We will briefly review the performance results presented in section 3.6 and use them as a baseline for comparing the results to be obtained in this section. We will aim to repeat the first and second experiments measuring packet processing latency and throughput, respectively, using a single Janus SDN system.
4.5.1 Results and Discussions
We had previously benchmarked the packet processing latency of the Janus SDN system, and found that the latency floored at roughly 5 ms per packet (see Figure 3.8).

81
Similarly, we benchmarked the packet throughput rate of the Janus SDN system and found that it maxed out at 558 packets per second (see Figure 3.9). With the various changes described in this chapter, we re-bench the Janus SDN system under the same set of conditions and using the same hardware specifications. The new latency results can be seen in Figure 4.9, while the new throughput results can be seen in Figure 4.10.
The new latency benchmarking shows that overall packet processing time has been reduced. While our previous base processing time (when packets wouldn’t have to wait to be processed) was 5 ms, Figure 4.9 shows that with just a single switch, the packet processing time is roughly 2.5 ms. Additionally, while the addition of each switch would previously increase the average packet processing time by another 2.5 ms, now it increases by just 0.5 ms per switch.
While the previous results in Figure 3.9 show a sharp degradation in throughput as the number of network switches increases, the latest throughput benchmarking results seen in Figure 4.10 shows that this is no longer the case. In fact, the line of best fit shows that the system’s throughput subtly increases as the network size scales, proving that its performance is now largely independent of the network size. When comparing the throughput of the 16-switch case between the old benchmarking results and our latest results, we observe an improvement of almost two orders of magnitude.
Figure 4.9: Packet processing latency vs. Increasing # of switches Single Janus SDN system; Cbench in latency mode

82
The new bottleneck appears to be the main Ryu process, which we determined by looking at the CPU utilization per process. Using the Linux utility htop, it can be observed that the main Ryu process constantly runs at 100%+ (due to Intel Turbo Boost [71]). As a brief reminder, we reiterate that this process is responsible for maintaining the OpenFlow TCP connection with all the OpenFlow switches, receiving OpenFlow packets, parsing the necessary data from them and sending it out through the output queue to the HTTP forwarding processes, receiving the southbound requests from Janus, translating the requests to the appropriate OpenFlow packet, and sending the packet back out through the OpenFlow connection.
4.6 Future Scalability Work
While we have successfully shown a substantial increase to the performance of the Janus SDN system under the worst-case scenario of having to do packet-by-packet processing, we wish to further address scalability problems that we may encounter as more modules are added onto Janus and the SAVI testbed’s infrastructure grows further. This section will thus briefly discuss potential options to improve the scalability of
Figure 4.10: Throughput vs. Increasing # of switches Single Janus SDN system; Cbench in throughput mode

83
Janus. The detailed exploration and investigation into each of the following methods will be left up as future work.
A potential scalability problem is foreseen as more modules are run on Janus. As Janus currently continues to use a greenthreaded model for its main process, the processing capacity it can dedicate to each module will degrade as the number of running modules increases. One option for resolving this is to further move towards multi-processing, where each module runs in its own dedicated process. If this is the case, then a suitable inter-process communication (IPC) method must be implemented in order to enable the modules to exchange information and talk to one another.
Taking multi-processing a step further, it is also possible to distribute agent processes responsible for implementing the infrastructure control drivers, similar to our work done in section 4.4 regarding FlowVisor. The drivers would manage and control their own local set of resources, ensuring their configuration conforms to the states specified in the central Janus database. Following along this line of thought, Janus itself may be physically distributed, which we have briefly shown can yield substantial benefits in Figure 3.10 and Figure 3.11. If this method is adopted, then work will have to be done to ensure that the various Janus instances maintain a logically centralized state in order to act as a cohesive infrastructure manager. An alternative would be to have a multi-tier hierarchical setup, where
At the moment, each region (Core and Edge nodes) in the SAVI testbed maintains its own local Janus, being aware of and controlling only its own local set of resources. A two-tier hierarchical setup may be necessary in the future for applications involving resources deployed amongst several regions. A top level Janus then becomes responsible for the high level control and management of the entire testbed, and communicates with each regional Janus to delegate local decision making, as well as to collect and aggregate their data.
Finally, with regards to the performance of the APIs, it is expected that the one-size-fits-all approach with using HTTP-based APIs for both simple data exchange as well as remote procedure calls (RPCs) may not be suitable for all cases. Other protocols may be utilized in the future depending on the needs of each module. For cross-platform RPCs involving high throughput, protocols such as Protocol Buffers [72], Apache Thrift [73] [74], or Apache Avro [75] may be more desirable and more efficient. For the occasional exchange of information, perhaps a publish-subscribe system or an AMQP-

84
based [76] [77] system may be more suitable. Additionally, we expect the eventual system should have the ability to spin up and retire API servers on the fly, thus realizing an elastic capacity for API processing.
The work for Janus is by no means done, and deserves much more attention in the future. The options mentioned in this section are only some of the ways that scalability may be improved, but they are by no means meant to be a declaration of a solution. As Janus becomes more utilized and more modules are added, further work must be done to investigate the forthcoming limits of its scalability and explore various potential resolution mechanisms. We thus leave these tasks up as future work.

85
Chapter 5
Control of E2E Network Virtualization
This chapter will discuss how the SAVI SDI and SDN systems can be used to enable users of the testbed to engage in end-to-end (E2E) control of their virtual network’s traffic. We begin by discussing the integration of wireless access points (WAPs) into the SAVI testbed, which allows mobile devices to be integrated as part of a virtual network on the testbed. As a demonstration of end to end network control, a scenario will be presented where a mobile device connected to the testbed streams live video from a VM server running within the testbed. Via the user’s own custom OpenFlow controller implementation, the video streaming traffic will be prioritized to ensure a level of guaranteed bandwidth in the face of network congestion.
5.1 Integration of WAPs into SAVI
In this section we discuss the integration of wireless access points into the SAVI testbed, which opens the door to allowing Wi-Fi enabled mobile devices to connect to and become a part of a virtual network on the testbed. This work was built upon previous efforts in [78] [79] and [80, pp. 52-53], wherein the latter also sought to integrate WAPs into the SAVI testbed. Our efforts differ in that, rather than using tunneling and encapsulation to differentiate traffic from different tenants, we fully utilize OpenFlow to control and isolate the traffic. Additionally, the OVS running within the WAPs are centrally controlled by the Janus SDN system, enabling Janus to control the end to end traffic from resources within the testbed to guest mobile devices connected to the access points.

86
For full customizability, we use a custom-compiled OpenWrt [81], an open source linux-based embedded operating system for wireless routers. The wireless router itself consists of a PC Engine Alix3d2 [82] board with an AMD Geode LX800 processor [83], using two mini PCI radio cards which support 802.11 b/g. OpenWrt also supports a simple wireless virtualization technique whereby a single access point can broadcast multiple BSSID’s, with each one mapped to a virtual interface within the operating system. Using this technique, we can assign a BSSID and virtual interface to each tenant.
When a mobile client wishes to connected to the SAVI testbed, it can view the list of available wireless networks. As the WAP is broadcasting multiple SSIDs, the mobile client can choose to connect a specific tenant. The task of negotiating the wireless connection setup (i.e. Association) between the WAP and the mobile client is done by a local process running within OpenWrt. Using shell scripts, it is possible to attach additional actions to be done after the connection has been set up. Thus, we created a script that would automatically register the MAC address of the mobile client with the Janus network control module as soon as it connects. Once this is done, the mobile client can send DHCP requests to obtain an IP address from the DHCP server (which runs within the testbed) associated with that tenant, and thus completes its connection with
Figure 5.1: Process Flow of Mobile Client Joining/Leaving Testbed

87
the testbed upon the acquisition of an IP address. The full process can be visualized in Figure 5.1.
Similar to the process of connecting to the testbed, when the mobile client wishes to disconnect from the testbed, the wireless disassociation is handled locally by a process within the WAP itself. After it has been fully disassociated, the WAP will then notify Janus of this by un-registering the MAC address of the client. Since the network control disallows the same MAC from being registered to multiple tenants, this last step is especially important, as it allows the mobile client to join another tenant. We avoid sending a DHCP release at this time; in the event that the client decides to re-join the tenant at a later time, it may be possible for it to re-acquire its old IP address.
5.2 Traffic Control Demonstration
As previously explained, the SAVI testbed aims to present an experimental testbed upon which research can be conducted on Future Internet protocols and applications. To facilitate this goal, the SAVI testbed provides the ability for users to control the network forwarding logic of their own slice. The work done for this simple video streaming application presents a first step towards extending that control to include bandwidth reservation and traffic prioritization. The goal is to demonstrate the ability for a testbed user to create their own network forwarding control applications based on network bandwidth availability.
5.2.1 Demonstration Setup
The setup for the traffic control demonstration can be seen in Figure 5.2. A video streaming experiment will be conducted involving a single VM within the testbed, which will serve as the source for the streaming video, and a laptop connected to the testbed via a WAP, which will serve as the video client. Simultaneously, another server within the testbed will be conducting a “separate experiment”, called Experiment X, along with a laptop, which is also connected to the testbed via the WAP. Experiment X will involve large amounts of traffic, in the form of ICMP packets, that seek to consume bandwidth on a best-effort basis. In addition, the user conducting the video streaming experiment

88
will delegate control over his or her own network to a guest OpenFlow controller, which will enable custom control over the virtual network that the video is streamed through.
The SAVI testbed’s topology manager (refer to section 1.3), known as Whale, enables users to query topology, switch, link, and port information as well as statistics. Consider a scenario wherein a user’s experiment, which requires some level of bandwidth guarantee, finds itself short of the bandwidth it requires. Using the information from Whale, the user thus has two options: route the traffic around the bottleneck point(s) of the network, or use traffic priority queuing. With the user’s guest OpenFlow controller, both options are equally feasible. For the purposes of this demonstration, we focus on using priority queues with guaranteed bandwidth.
OpenvSwitch, which we use extensively in the SAVI testbed, supports basic traffic policing, classification, queueing, and bandwidth guarantees. It is able to perform these tasks by leveraging Linux HTB under the hood [84]. Additionally, the OpenFlow protocol supports an Enqueue action [16] which allows users to specify which queue of an output port to send a packet out through. Using pre-configured egress queues on the wireless-facing ports in the OVS running within the WAP, the user can dictate which
Figure 5.2: Traffic Control Demonstration Setup
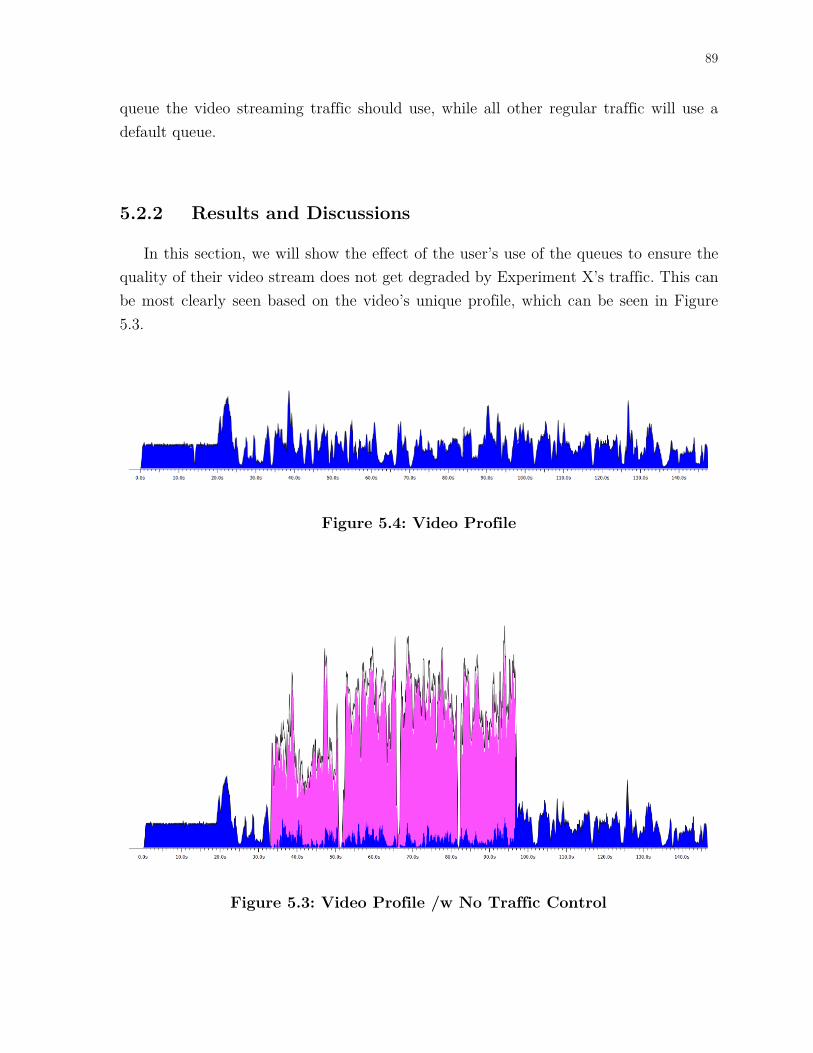
89
queue the video streaming traffic should use, while all other regular traffic will use a default queue.
5.2.2 Results and Discussions
In this section, we will show the effect of the user’s use of the queues to ensure the quality of their video stream does not get degraded by Experiment X’s traffic. This can be most clearly seen based on the video’s unique profile, which can be seen in Figure 5.3.
Figure 5.4: Video Profile
Figure 5.3: Video Profile /w No Traffic Control

90
When Experiment X is run simultaneously alongside a playback of the video, we observe a visible degradation in the quality of the video as observed in the client’s video player. This degradation can also be visualized when comparing the video traffic profile shown in Figure 5.4 to the previous Figure 5.3.
Next, the user utilizes the guest OpenFlow controller to install flow table rules that match on the video traffic, with an associated action to enqueue it into a higher priority queue with guaranteed bandwidth. When both Experiment X and the video is once again ran simultaneously, pristine video could be observed on the client’s video player.
The video profile shown in Figure 5.5 can be compared to that from Figure 5.3, and it can be seen that the user’s custom traffic control rules succeeds in preventing Experiment X’s traffic from stealing the necessary bandwidth that the video stream needs.
As previously mentioned in the setup section, the queues in the network are expected to be pre-configured by the testbed administrators. While it is possible to open up public APIs for users themselves to create such queues, there would need to be some level of restrictions and other policies in place to dictate who can create such queues, and what properties they can assign those queues. Without such mechanisms in place, the
Figure 5.5: Video Profile /w Traffic Control

91
testbed’s network bandwidth (which is considered as a limited resource) would once again be available as a free-for-all. The decision over who may create queues in the network, as well as what restrictions they may be subject to, is left up as future work.

92
Chapter 6
Conclusion
This thesis documented the design and implementation of Janus, a novel SDI management system that enables the integrated control and management of infrastructures containing converged heterogeneous resources. The SAVI project, which is in the ongoing process of building the SAVI testbed, sees the successful deployment of the SDI manager as a key step towards realizing a more efficient and effective future application platform. It is expected that the SDI manager will shorten the development time of applications and experiments, while enabling them to be rapidly deployed, modified, scaled, and retired. The unification of the control and management under a centralized management system, as well as the presentation of a central point of contact for infrastructure APIs, has the potential to open doors for experimenters and application developers to realize new smart applications. The ability to query information about the topology and status of the infrastructure’s resources is key in realizing smart applications whose performance is dependent on multiple resources.
In addition, we also designed and implemented a network control module that runs atop of Janus. It is hoped that having the network control moved onto the SDI manager will give it a global view of the infrastructure, thus granting the network control logic the benefit of viewing the state and location of all infrastructure resources, virtualized or otherwise. We have successfully implemented and deployed the Janus SDI manager and the network control module on the SAVI testbed. At the time of writing this thesis, Janus is running in all the SAVI regions throughout Canada, and is responsible for managing the network in all the Core and Edge nodes. We have shown that the current system is able to fully handle the traffic demand of SAVI’s largest and busiest regional node, thus verifying its functionality in a production network. While our performance evaluations of the initial prototype implementation showed that the system did not perform well under extreme loads, we presented a set of modifications to the system

93
that was then shown to dramatically increase the performance up to two orders of magnitude. As the SDI-based network management system is constantly aware of both the computing and network resources, it is hoped that this work presents a first step towards realizing more complicated network management schemes.
6.1 Future Work
While we have already discussed some potential future scalability work in section 4.6, we focus this section on discussing the future work regarding the SDI manager as a whole. As noted in the first chapter of this thesis, our work contributes towards realizing a centralized manager for the SAVI testbed. However, our current design and deployment was done on a per-node basis, not for the entire testbed as a whole. The design and improvement of the system to be able to handle a platform-wide integrated control and management scheme is thus left up to future work. We believe that the current modular design of Janus, as well as the ability to have custom-defined APIs, will surely enable researchers engaging in this work to explore a hierarchical solution, a distributed solution, or any other novel solutions. In regards to the potential for new C&M modules, the SAVI testbed team currently has plans in the works to engage in research regarding fault tolerance, infrastructure monitoring and data analytics, green networking, traffic engineering, QoS support, and real-time diagnostics systems. Lastly, future work must also be done to explore the possibility of using the SDI manager to federate the SAVI testbed with other cloud infrastructures such as GENI in the United States. Such a union would open the possibilities for having distributed applications and experiments exist on separately owned cloud infrastructures.
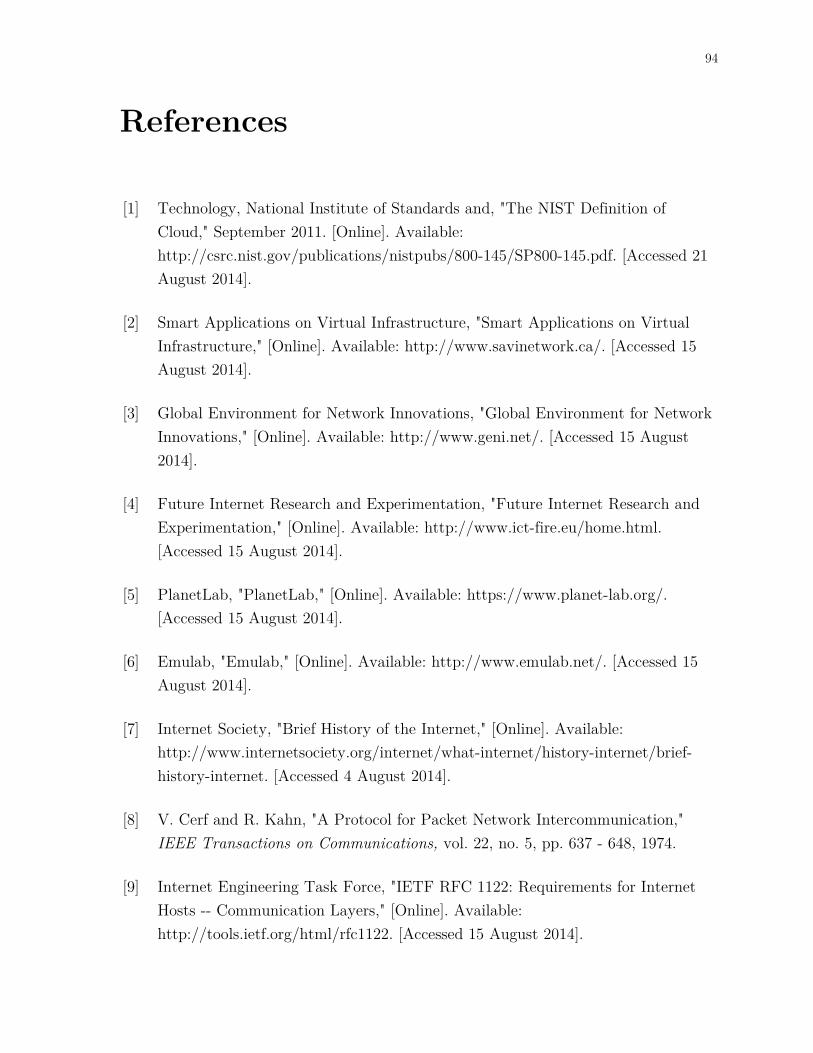
94
References
[1] Technology, National Institute of Standards and, "The NIST Definition of Cloud," September 2011. [Online]. Available: http://csrc.nist.gov/publications/nistpubs/800-145/SP800-145.pdf. [Accessed 21 August 2014].
[2] Smart Applications on Virtual Infrastructure, "Smart Applications on Virtual Infrastructure," [Online]. Available: http://www.savinetwork.ca/. [Accessed 15 August 2014].
[3] Global Environment for Network Innovations, "Global Environment for Network Innovations," [Online]. Available: http://www.geni.net/. [Accessed 15 August 2014].
[4] Future Internet Research and Experimentation, "Future Internet Research and Experimentation," [Online]. Available: http://www.ict-fire.eu/home.html. [Accessed 15 August 2014].
[5] PlanetLab, "PlanetLab," [Online]. Available: https://www.planet-lab.org/. [Accessed 15 August 2014].
[6] Emulab, "Emulab," [Online]. Available: http://www.emulab.net/. [Accessed 15 August 2014].
[7] Internet Society, "Brief History of the Internet," [Online]. Available: http://www.internetsociety.org/internet/what-internet/history-internet/brief-history-internet. [Accessed 4 August 2014].
[8] V. Cerf and R. Kahn, "A Protocol for Packet Network Intercommunication," IEEE Transactions on Communications, vol. 22, no. 5, pp. 637 - 648, 1974.
[9] Internet Engineering Task Force, "IETF RFC 1122: Requirements for Internet Hosts -- Communication Layers," [Online]. Available: http://tools.ietf.org/html/rfc1122. [Accessed 15 August 2014].

95
[10] ITU Telecommunication Standardization Sector, "ITU-T's Definition of NGN," [Online]. Available: http://www.itu.int/en/ITU-T/gsi/ngn/Pages/definition.aspx. [Accessed 15 August 2014].
[11] Cisco, "The Zettabyte Era—Trends and Analysis," [Online]. Available: http://www.cisco.com/c/en/us/solutions/collateral/service-provider/visual-networking-index-vni/VNI_Hyperconnectivity_WP.pdf. [Accessed 17 August 2014].
[12] Analysys Mason, "Internet Global Growth: Lessons for the Future," [Online]. Available: http://www.analysysmason.com/Research/Content/Reports/Internet-global-growth-lessons-for-the-future/Internet-global-growth-lessons-for-the-future/. [Accessed 17 August 2014].
[13] National Science Foundation, "Future Internet Design (FIND)," [Online]. Available: http://www.nets-find.net/. [Accessed 15 August 2014].
[14] Open Networking Foundation, "Software-Defined Networking (SDN) Definition," [Online]. Available: https://www.opennetworking.org/sdn-resources/sdn-definition. [Accessed 15 August 2014].
[15] N. McKeown, T. Anderson, H. Balakrishnan, G. Parulkar, L. Peterson, J. Rexford, S. Shenker and J. Turner, "OpenFlow: Enabling Innovation in Campus Networks," ACM SIGCOMM Computer Communication Review, vol. 38, no. 2, pp. 69-74, 2008.
[16] Open Networking Foundation, "OpenFlow Switch Specification 1.0.0," [Online]. Available: https://www.opennetworking.org/images/stories/downloads/sdn-resources/onf-specifications/openflow/openflow-spec-v1.0.0.pdf. [Accessed 15 August 2014].
[17] R. Sherwood, G. Gibb, K.-K. Yap, G. Appenzeller, M. Casado, N. McKeown and G. Parulkar, "Can the Production Network be the Testbed?," Proceedings of the 9th USENIX conference on Operating systems design and implementation (OSDI'10).

96
[18] R. Sherwood, G. Gibb, K.-K. Yap, G. Appenzeller, M. Casado, N. McKeown and G. Parulkar, "FlowVisor: A Network Virtualization Layer," [Online]. Available: http://archive.openflow.org/downloads/technicalreports/openflow-tr-2009-1-flowvisor.pdf. [Accessed 15 August 2014].
[19] J.-M. Kang, H. Bannazadeh and A. Leon-Garcia, "SAVI Testbed: Control and Management of Converged Virtual ICT Resources," in 2013 IFIP/IEEE International Symposium on Integrated Network Management (IM 2013), Ghent, Belgium, 2013.
[20] Smart Applications on Virtual Infrastructure (SAVI), "SAVI Testbed Platform System Architecture," 2013. [Online]. Available: https://docs.google.com/a/savinetwork.ca/document/d/1sjuay9A3QuSdbN2LuPZRQuRu5w2YqPIuYPCemDVq86c/edit. [Accessed 15 August 2014].
[21] Berkeley Wireless Research Center, UC Berkeley, "Berkeley Emulation Engine 2," [Online]. Available: http://bee2.eecs.berkeley.edu/. [Accessed 17 August 2014].
[22] NetFPGA, "NetFPGA," [Online]. Available: http://netfpga.org/. [Accessed 17 August 2014].
[23] BEEcube, "miniBEE: Research in a Box," [Online]. Available: http://www.beecube.com/products/miniBEE.asp. [Accessed 17 August 2014].
[24] Terasic, "DE5-Net FPGA Development Kit," [Online]. Available: http://de5-net.terasic.com.tw/. [Accessed 17 August 2014].
[25] Ontario Research and Innovation Optical Network, "Ontario Research and Innovation Optical Network," [Online]. Available: http://www.orion.on.ca/. [Accessed 17 August 2014].
[26] Canada's Advanced Research and Innovation Network, "Canada's Advanced Research and Innovation Network," [Online]. Available: http://www.canarie.ca/. [Accessed 17 August 2014].

97
[27] OpenStack, "OpenStack," [Online]. Available: http://www.openstack.org/. [Accessed 17 August 2014].
[28] R. T. Fielding, "Architectural Styles and the Design of Network-based Software Architectures," Irvine, 2000.
[29] OpenStack, "Horizon: The OpenStack Dashboard Project," [Online]. Available: http://docs.openstack.org/developer/horizon/. [Accessed 21 August 2014].
[30] OpenStack, "Nova’s developer documentation," [Online]. Available: http://docs.openstack.org/developer/nova/. [Accessed 21 August 2014].
[31] OpenStack, "Swift’s documentation," [Online]. Available: http://docs.openstack.org/developer/swift/. [Accessed 21 August 2014].
[32] OpenStack, "Cinder’s developer documentation," [Online]. Available: http://docs.openstack.org/developer/cinder/. [Accessed 21 August 2014].
[33] OpenStack, "Neutron’s developer documentation," [Online]. Available: http://docs.openstack.org/developer/neutron/. [Accessed 21 August 2014].
[34] OpenStack, "Glance’s documentation," [Online]. Available: http://docs.openstack.org/developer/glance/. [Accessed 21 August 2014].
[35] OpenStack, "Keystone, the OpenStack Identity Service," [Online]. Available: http://docs.openstack.org/developer/keystone/. [Accessed 21 August 2014].
[36] OpenStack, "Ceilometer developer documentation," [Online]. Available: http://docs.openstack.org/developer/ceilometer/. [Accessed 21 August 2014].
[37] OpenStack, "Heat developer documentation," [Online]. Available: http://docs.openstack.org/developer/heat/. [Accessed 21 August 2014].
[38] OpenStack, "Sahara," [Online]. Available: http://docs.openstack.org/developer/sahara/. [Accessed 21 August 2014].

98
[39] Amazon, "Amazon EC2 Pricing," [Online]. Available: http://aws.amazon.com/ec2/pricing/. [Accessed 17 August 2014].
[40] J.-M. Kang, H. Bannazadeh, H. Rahimi, T. Lin, M. Faraji and A. Leon-Garcia, "Software-Defined Infrastructure and the Future Central Office," in 2013 IEEE International Conference on Communications Workshops (ICC), Budapest, Hungary, 2013.
[41] J.-M. Kang, T. Lin, H. Bannazadeh and A. Leon-Garcia, "Software-Defined Infrastructure and the SAVI Testbed," in 9th International Conference on Testbeds and Research Infrastructures for the Development of Networks & Communities (TRIDENTCOM 2014), Guangzhou, People's Republic of China, 2014.
[42] OpenStack MarkMail, "[Openstack] OpenStack Networking, use of "Quantum"," [Online]. Available: http://markmail.org/message/w37tv4bgzxld7x4a. [Accessed 17 August 2014].
[43] NTT DoCoMo, "Ryu SDN Framework," [Online]. Available: http://osrg.github.io/ryu/. [Accessed 17 August 2014].
[44] NTT Group, "NTT Innovation Institute," [Online]. Available: http://www.ntti3.com/. [Accessed 17 August 2014].
[45] Intel, "Multitask with Intel Hyper-Threading Technology," [Online]. Available: http://www.intel.com/content/www/us/en/architecture-and-technology/hyper-threading/hyper-threading-technology-video.html. [Accessed 21 August 2014].
[46] M. Faraji, J.-M. Kang, H. Bannazadeh and A. Leon-Garcia, "Identity access management for Multi-tier cloud infrastructures," in IEEE Network Operations and Management Symposium (NOMS), Krakow, Poland, 2014.
[47] W3Schools, "SQL Tutorial," [Online]. Available: http://www.w3schools.com/sql/. [Accessed 21 August 2014].

99
[48] International Standardization Organization, "Information technology -- Database languages -- SQL -- Part 1: Framework (SQL/Framework)," [Online]. Available: http://www.iso.org/iso/home/store/catalogue_tc/catalogue_detail.htm?csnumber=53681. [Accessed 21 August 2014].
[49] SQLite, "Well-Known Users of SQLite," [Online]. Available: https://www.sqlite.org/famous.html. [Accessed 21 August 2014].
[50] MySQL, "MySQL :: Market Share," [Online]. Available: http://www.mysql.com/why-mysql/marketshare/. [Accessed 21 August 2014].
[51] SQLAlchemy, "SQLAlchemy - The Database Toolkit for Python," [Online]. Available: http://www.sqlalchemy.org/. [Accessed 21 August 2014].
[52] Google Code, "SQLAlchemy Schema Migration Tools," [Online]. Available: https://pypi.python.org/pypi/sqlalchemy-migrate. [Accessed 21 August 2014].
[53] M. B. (zzzeek), "Alembic Bitbucket Repository," [Online]. Available: https://bitbucket.org/zzzeek/alembic. [Accessed 21 August 2014].
[54] Big Switch Networks, "Floodlight OpenFlow Controller," [Online]. Available: http://www.projectfloodlight.org/floodlight/. [Accessed 21 August 2014].
[55] JSON-RPC Google Group, "JSON-RPC 2.0 Specification," [Online]. Available: http://www.jsonrpc.org/specification. [Accessed 21 August 2014].
[56] Open vSwitch, "Open vSwitch," [Online]. Available: http://openvswitch.org/. [Accessed 17 August 2014].
[57] Linux Foundation, "bridge," [Online]. Available: http://www.linuxfoundation.org/collaborate/workgroups/networking/bridge. [Accessed 17 August 2014].
[58] Netfilter, "The netfilter.org "iptables" project," [Online]. Available: http://www.netfilter.org/projects/iptables/. [Accessed 17 August 2014].

100
[59] SAVI Project, "savi-dev janus/tr_edge_isolation.py," [Online]. Available: https://github.com/savi-dev/janus/blob/savi-2.1/janus/network/apps/tr_edge_isolation.py. [Accessed 21 August 2014].
[60] A. Tootoonchian, S. Gorbunov, Y. Ganjali, M. Casado and R. Sherwood, "On Controller Performance in Software-Defined Networks," in USENIX Workshop on Hot Topics in Management of Internet, Cloud, and Enterprise Networks and Services (Hot-ICE), San Jose, 2012.
[61] HAProxy, "The Reliable, High Performance TCP/HTTP Load Balancer," [Online]. Available: http://www.haproxy.org/. [Accessed 21 August 2014].
[62] Apache, "Apache HTTP Server Project," [Online]. Available: http://httpd.apache.org/. [Accessed 21 August 2014].
[63] Apache, "Apache HTTP server benchmarking tool," [Online]. Available: http://httpd.apache.org/docs/2.2/programs/ab.html. [Accessed 21 August 2014].
[64] Wireshark, "dumpcap - The Wireshark Network Analyzer," [Online]. Available: https://www.wireshark.org/docs/man-pages/dumpcap.html. [Accessed 21 August 2014].
[65] M. Sung, S. Kim, S. Park, N. Chang and H. Shin, "Comparative performance evaluation of Java threads for embedded applications: Linux Thread vs. Green Thread," Information Processing Letters, vol. 84, no. 4, pp. 221-225, 2002.
[66] M. E. Conway, "Design of a Separable Transition-Diagram Compiler," Communications of the ACM, vol. 6, no. 7, pp. 396-408, 1963.
[67] Eventlet, "Eventlet Networking Library," [Online]. Available: http://eventlet.net/. [Accessed 21 August 2014].
[68] gevent, "gevent: A coroutine-based network library for Python," [Online]. Available: http://www.gevent.org/. [Accessed 21 August 2014].
101
[69] B. Biswal, "Monkey Patching in Python," [Online]. Available: http://www.mindfiresolutions.com/Monkey-Patching-in-Python-1238.php. [Accessed 21 August 2014].
[70] Memcached, "memcached - a distributed memory object caching system," [Online]. Available: http://memcached.org/. [Accessed 21 August 2014].
[71] Intel, "Intel Turbo Boost Technology 2.0," [Online]. Available: http://www.intel.com/content/www/us/en/architecture-and-technology/turbo-boost/turbo-boost-technology.html. [Accessed 21 August 2014].
[72] Google Code, "Protocol Buffers - Google's data interchange format," [Online]. Available: https://code.google.com/p/protobuf/. [Accessed 21 August 2014].
[73] Apache, "Apache Thrift," [Online]. Available: https://thrift.apache.org/. [Accessed 21 August 2014].
[74] Facebook, "Thrift: Scalable Cross-Language Services Implementation," [Online]. Available: https://thrift.apache.org/static/files/thrift-20070401.pdf. [Accessed 21 August 2014].
[75] Apache, "Apache Avro," [Online]. Available: http://avro.apache.org/. [Accessed 21 August 2014].
[76] AMQP, "AMQP: Advanced Message Queuing Protocol," [Online]. Available: http://www.amqp.org/. [Accessed 21 August 2014].
[77] International Standardization Organization, "Information technology -- Advanced Message Queuing Protocol (AMQP) v1.0 specification," [Online]. Available: http://www.iso.org/iso/home/store/catalogue_tc/catalogue_detail.htm?csnumber=64955. [Accessed 21 August 2014].
[78] K.-K. Yap, M. Kobayashi, R. Sherwood, N. Handigol, T.-Y. Huang, M. Chan and N. McKeown, "OpenRoads: Empowering Research in Mobile Networks,"

102
ACM SIGCOMM Computer Communication Review, vol. 40, no. 1, pp. 125-126, 2010.
[79] OpenFlow, "OpenFlow Wireless," [Online]. Available: http://archive.openflow.org/wk/index.php/OpenFlow_Wireless. [Accessed 21 August 2014].
[80] SAVI Project, "SAVI 2013 Annual General Meeting (AGM) Student Posters," [Online]. Available: http://www.savinetwork.ca/wp-content/uploads/bookletV6.pdf. [Accessed 21 August 2014].
[81] OpenWrt, "OpenWrt: Wireless Freedom," [Online]. Available: https://openwrt.org/. [Accessed 21 August 2014].
[82] PC Engines, "PC Engines alix3d2 product file," [Online]. Available: http://www.pcengines.ch/alix3d2.htm. [Accessed 21 August 2014].
[83] AMD, "AMD Geode LX Processor Family," [Online]. Available: http://www.amd.com/en-us/products/embedded/processors/lx. [Accessed 21 August 2014].
[84] M. D. (devik), "HTB Linux queuing discipline manual - user guide," [Online]. Available: http://luxik.cdi.cz/~devik/qos/htb/manual/userg.htm. [Accessed 21 August 2014].

103
Appendix A: Network Control Module APIs
Table A-1 lists the Janus APIs defined by the network control module. Parameters specified within the URLs are encased in braces and italicized, and are explained in the description column. All URLs are defined relative to the path to the module itself (i.e. http://{janus_ip}:{port_num}/v1.0/network).
URL HTTP
Method
Description
/networks GET List existing virtual network IDs.
/networks/{network_id} POST network_id: Virtual network ID
Create a new virtual network.
/networks/{network_id} PUT network_id: Virtual network ID
Update an existing virtual network, or create it if it doesn’t exist.
/networks/{network_id} DELETE network_id: Virtual network ID
Delete a virtual network.
/networks/{network_id}/macs GET network_id: Virtual network ID
List the MACs associated with a virtual network.
/networks/{network_id}/macs/{mac} PUT network_id: Virtual network ID
mac: MAC address
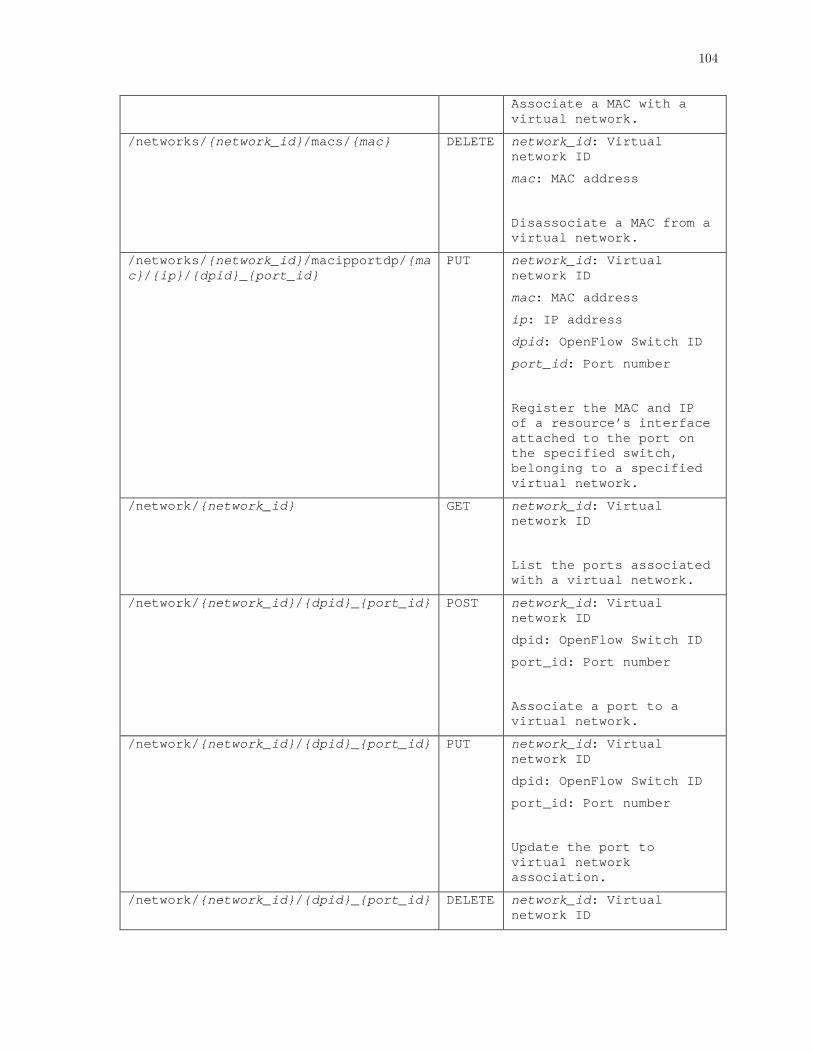
104
Associate a MAC with a virtual network.
/networks/{network_id}/macs/{mac} DELETE network_id: Virtual network ID
mac: MAC address
Disassociate a MAC from a virtual network.
/networks/{network_id}/macipportdp/{mac}/{ip}/{dpid}_{port_id}
PUT network_id: Virtual network ID
mac: MAC address
ip: IP address
dpid: OpenFlow Switch ID
port_id: Port number
Register the MAC and IP of a resource’s interface attached to the port on the specified switch, belonging to a specified virtual network.
/network/{network_id} GET network_id: Virtual network ID
List the ports associated with a virtual network.
/network/{network_id}/{dpid}_{port_id} POST network_id: Virtual network ID
dpid: OpenFlow Switch ID
port_id: Port number
Associate a port to a virtual network.
/network/{network_id}/{dpid}_{port_id} PUT network_id: Virtual network ID
dpid: OpenFlow Switch ID
port_id: Port number
Update the port to virtual network association.
/network/{network_id}/{dpid}_{port_id} DELETE network_id: Virtual network ID

105
dpid: OpenFlow Switch ID
port_id: Port number
Disassociate a port from a virtual network.
/flowvisor GET List the existing network slices.
/flowvisor/flowspace GET List the full FlowSpace table in FlowVisor.
/flowvisor/health/{sliceName} GET sliceName: Unique name of a network slice.
Query the health and status of a slice. Can be used to check if a controller is connected to the slice.
/flowvisor/{sliceName} DELETE sliceName: Unique name of a network slice.
Delete a network slice.
/flowvisor/{sliceName}_{ip}_{port} POST sliceName: Unique name of a network slice
ip: IP address of OpenFlow controller
port: TCP port number of OpenFlow controller
Create a new slice, and assigning it an OpenFlow controller listening on the address and port.
/flowvisor/{sliceName}/assign/{network_id}
PUT sliceName: Unique name of a network slice
network_id: Virtual network ID
Associate a virtual network to a slice.
/flowvisor/unassign/{network_id} DELETE network_id: Virtual network ID
Disassociating a virtual network from its slice.
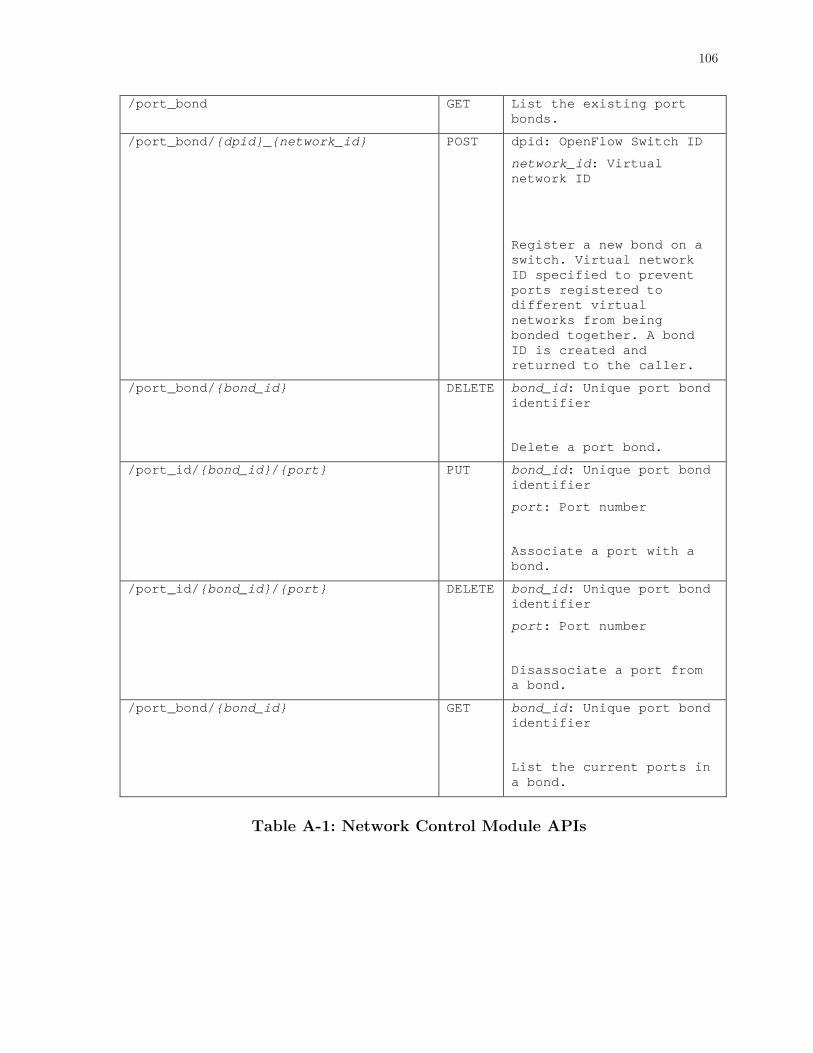
106
/port_bond GET List the existing port bonds.
/port_bond/{dpid}_{network_id} POST dpid: OpenFlow Switch ID
network_id: Virtual network ID
Register a new bond on a switch. Virtual network ID specified to prevent ports registered to different virtual networks from being bonded together. A bond ID is created and returned to the caller.
/port_bond/{bond_id} DELETE bond_id: Unique port bond identifier
Delete a port bond.
/port_id/{bond_id}/{port} PUT bond_id: Unique port bond identifier
port: Port number
Associate a port with a bond.
/port_id/{bond_id}/{port} DELETE bond_id: Unique port bond identifier
port: Port number
Disassociate a port from a bond.
/port_bond/{bond_id} GET bond_id: Unique port bond identifier
List the current ports in a bond.
Table A-1: Network Control Module APIs

107
Table A-2 shows the two event types and their URLs. As can be observed, the URLs differ by only the event ID, which is later used by Janus to distinguish the event and call the appropriate callback functions registered to it.
Event URL Description
http://{janus_ip}:{port_num}/v1.0/events/0 Event ID 0 defines OpenFlow events. All OpenFlow events forwarded by Ryu are forwarded to this event URL.
Differentiation between different OpenFlow events is done by another identifier embedded within the body.
http://{janus_ip}:{port_num}/v1.0/events/1 Event ID 1 defines generic network events similar to the previous APIs. Examples of network events may include MAC to network ID associations, disassociations, addition of new DHCP servers into the network, and etc.
Differentiation between different network events is done by another identifier embedded within the body.
Table A-2: Network Control Module Event Types and URLs
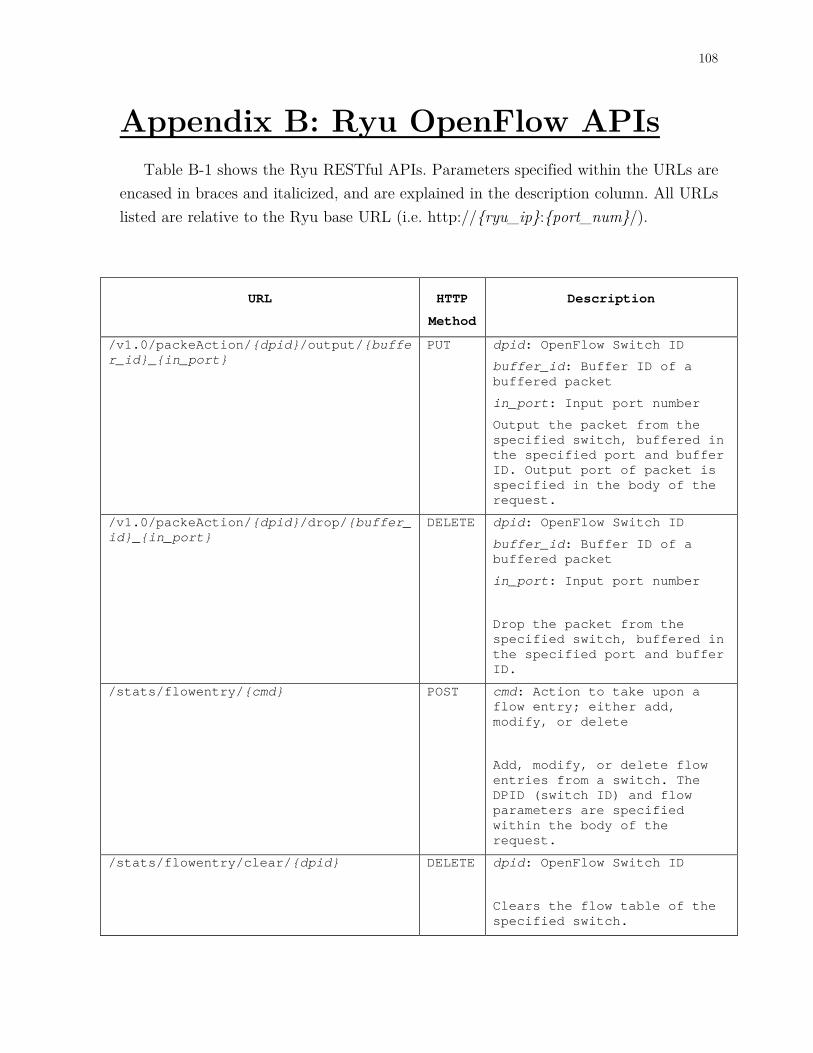
108
Appendix B: Ryu OpenFlow APIs Table B-1 shows the Ryu RESTful APIs. Parameters specified within the URLs are
encased in braces and italicized, and are explained in the description column. All URLs listed are relative to the Ryu base URL (i.e. http://{ryu_ip}:{port_num}/).
URL HTTP
Method
Description
/v1.0/packeAction/{dpid}/output/{buffer_id}_{in_port}
PUT dpid: OpenFlow Switch ID
buffer_id: Buffer ID of a buffered packet
in_port: Input port number
Output the packet from the specified switch, buffered in the specified port and buffer ID. Output port of packet is specified in the body of the request.
/v1.0/packeAction/{dpid}/drop/{buffer_id}_{in_port}
DELETE dpid: OpenFlow Switch ID
buffer_id: Buffer ID of a buffered packet
in_port: Input port number
Drop the packet from the specified switch, buffered in the specified port and buffer ID.
/stats/flowentry/{cmd} POST cmd: Action to take upon a flow entry; either add, modify, or delete
Add, modify, or delete flow entries from a switch. The DPID (switch ID) and flow parameters are specified within the body of the request.
/stats/flowentry/clear/{dpid} DELETE dpid: OpenFlow Switch ID
Clears the flow table of the specified switch.
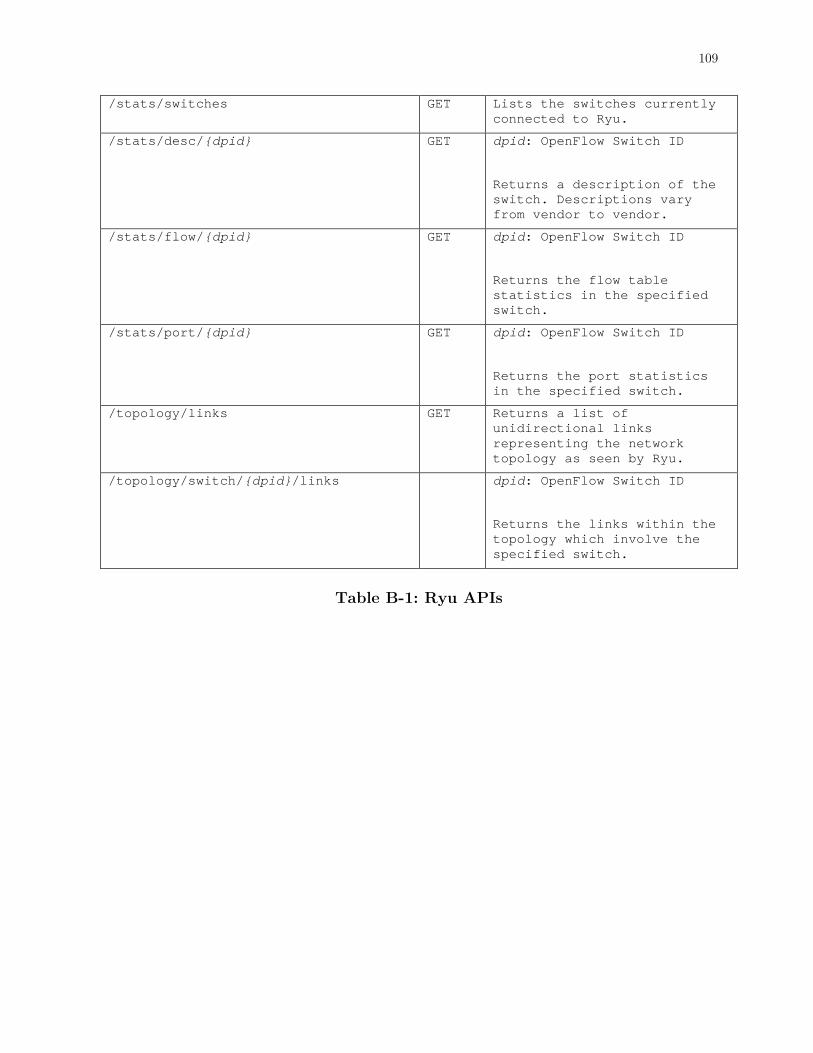
109
/stats/switches GET Lists the switches currently connected to Ryu.
/stats/desc/{dpid} GET dpid: OpenFlow Switch ID
Returns a description of the switch. Descriptions vary from vendor to vendor.
/stats/flow/{dpid} GET dpid: OpenFlow Switch ID
Returns the flow table statistics in the specified switch.
/stats/port/{dpid} GET dpid: OpenFlow Switch ID
Returns the port statistics in the specified switch.
/topology/links GET Returns a list of unidirectional links representing the network topology as seen by Ryu.
/topology/switch/{dpid}/links dpid: OpenFlow Switch ID
Returns the links within the topology which involve the specified switch.
Table B-1: Ryu APIs
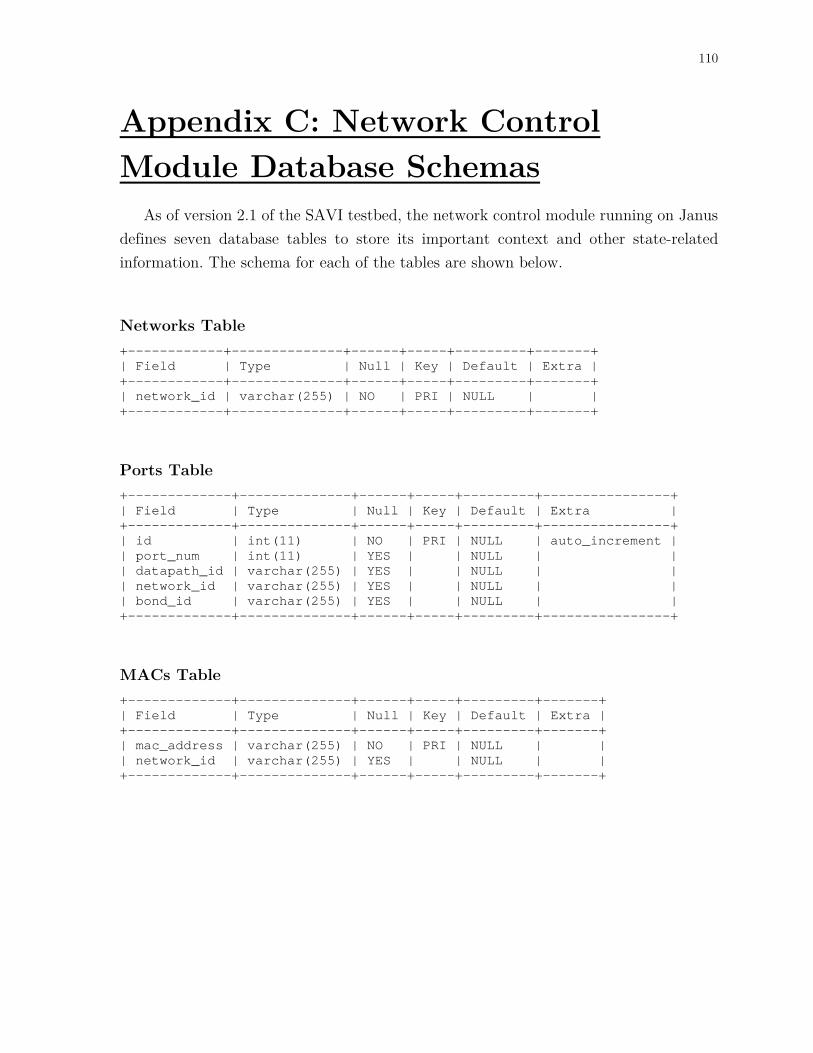
110
Appendix C: Network Control Module Database Schemas
As of version 2.1 of the SAVI testbed, the network control module running on Janus defines seven database tables to store its important context and other state-related information. The schema for each of the tables are shown below.
Networks Table +------------+--------------+------+-----+---------+-------+ | Field | Type | Null | Key | Default | Extra | +------------+--------------+------+-----+---------+-------+ | network_id | varchar(255) | NO | PRI | NULL | | +------------+--------------+------+-----+---------+-------+
Ports Table +-------------+--------------+------+-----+---------+----------------+ | Field | Type | Null | Key | Default | Extra | +-------------+--------------+------+-----+---------+----------------+ | id | int(11) | NO | PRI | NULL | auto_increment | | port_num | int(11) | YES | | NULL | | | datapath_id | varchar(255) | YES | | NULL | | | network_id | varchar(255) | YES | | NULL | | | bond_id | varchar(255) | YES | | NULL | | +-------------+--------------+------+-----+---------+----------------+
MACs Table +-------------+--------------+------+-----+---------+-------+ | Field | Type | Null | Key | Default | Extra | +-------------+--------------+------+-----+---------+-------+ | mac_address | varchar(255) | NO | PRI | NULL | | | network_id | varchar(255) | YES | | NULL | | +-------------+--------------+------+-----+---------+-------+

111
Port Bonds Table +-------------+--------------+------+-----+---------+-------+ | Field | Type | Null | Key | Default | Extra | +-------------+--------------+------+-----+---------+-------+ | bond_id | varchar(255) | NO | PRI | NULL | | | datapath_id | varchar(255) | YES | | NULL | | | network_id | varchar(255) | YES | | NULL | | +-------------+--------------+------+-----+---------+-------+
Slices Table +-----------+--------------+------+-----+---------+-------+ | Field | Type | Null | Key | Default | Extra | +-----------+--------------+------+-----+---------+-------+ | slice | varchar(255) | NO | PRI | NULL | | | ctrl_addr | varchar(255) | YES | | NULL | | +-----------+--------------+------+-----+---------+-------+
Delegated Networks Table +------------+--------------+------+-----+---------+-------+ | Field | Type | Null | Key | Default | Extra | +------------+--------------+------+-----+---------+-------+ | network_id | varchar(255) | NO | PRI | NULL | | | slice | varchar(255) | YES | | NULL | | +------------+--------------+------+-----+---------+-------+
FlowSpaces Table +-------------+--------------+------+-----+---------+----------------+ | Field | Type | Null | Key | Default | Extra | +-------------+--------------+------+-----+---------+----------------+ | id | int(11) | NO | PRI | NULL | auto_increment | | datapath_id | varchar(255) | YES | | NULL | | | port_num | int(11) | YES | | NULL | | | mac_address | varchar(255) | NO | MUL | NULL | | | slice | varchar(255) | YES | | NULL | | +-------------+--------------+------+-----+---------+----------------+


![Savi Episode 12[1]](https://static.fdocuments.us/doc/165x107/55cf8c9e5503462b138e4d4b/savi-episode-121.jpg)


![Savi Episode 14[1]](https://static.fdocuments.us/doc/165x107/55cf8c9e5503462b138e4cd9/savi-episode-141.jpg)


![Savi Episode 13[1]](https://static.fdocuments.us/doc/165x107/55cf8c9e5503462b138e4cd5/savi-episode-131.jpg)