IMPLEMENTATION AND ANALYSIS OF TRUE LEAN IN A STARTUP ...
99
University of Kentucky University of Kentucky UKnowledge UKnowledge Theses and Dissertations--Manufacturing Systems Engineering Manufacturing Systems Engineering 2019 IMPLEMENTATION AND ANALYSIS OF TRUE LEAN IN A STARTUP IMPLEMENTATION AND ANALYSIS OF TRUE LEAN IN A STARTUP COMPANY BY USING PDCA MODEL, A CASE STUDY IN A COMPANY BY USING PDCA MODEL, A CASE STUDY IN A MANUFACTURING VENTURE MANUFACTURING VENTURE Ankit Jangid University of Kentucky, [email protected] Author ORCID Identifier: https://orcid.org/0000-0002-4833-4785 Digital Object Identifier: https://doi.org/10.13023/etd.2019.423 Right click to open a feedback form in a new tab to let us know how this document benefits you. Right click to open a feedback form in a new tab to let us know how this document benefits you. Recommended Citation Recommended Citation Jangid, Ankit, "IMPLEMENTATION AND ANALYSIS OF TRUE LEAN IN A STARTUP COMPANY BY USING PDCA MODEL, A CASE STUDY IN A MANUFACTURING VENTURE" (2019). Theses and Dissertations-- Manufacturing Systems Engineering. 9. https://uknowledge.uky.edu/ms_etds/9 This Master's Thesis is brought to you for free and open access by the Manufacturing Systems Engineering at UKnowledge. It has been accepted for inclusion in Theses and Dissertations--Manufacturing Systems Engineering by an authorized administrator of UKnowledge. For more information, please contact [email protected].
Transcript of IMPLEMENTATION AND ANALYSIS OF TRUE LEAN IN A STARTUP ...

University of Kentucky University of Kentucky
UKnowledge UKnowledge
Theses and Dissertations--Manufacturing Systems Engineering Manufacturing Systems Engineering
2019
IMPLEMENTATION AND ANALYSIS OF TRUE LEAN IN A STARTUP IMPLEMENTATION AND ANALYSIS OF TRUE LEAN IN A STARTUP
COMPANY BY USING PDCA MODEL, A CASE STUDY IN A COMPANY BY USING PDCA MODEL, A CASE STUDY IN A
MANUFACTURING VENTURE MANUFACTURING VENTURE
Ankit Jangid University of Kentucky, [email protected] Author ORCID Identifier:
https://orcid.org/0000-0002-4833-4785 Digital Object Identifier: https://doi.org/10.13023/etd.2019.423
Right click to open a feedback form in a new tab to let us know how this document benefits you. Right click to open a feedback form in a new tab to let us know how this document benefits you.
Recommended Citation Recommended Citation Jangid, Ankit, "IMPLEMENTATION AND ANALYSIS OF TRUE LEAN IN A STARTUP COMPANY BY USING PDCA MODEL, A CASE STUDY IN A MANUFACTURING VENTURE" (2019). Theses and Dissertations--Manufacturing Systems Engineering. 9. https://uknowledge.uky.edu/ms_etds/9
This Master's Thesis is brought to you for free and open access by the Manufacturing Systems Engineering at UKnowledge. It has been accepted for inclusion in Theses and Dissertations--Manufacturing Systems Engineering by an authorized administrator of UKnowledge. For more information, please contact [email protected].

STUDENT AGREEMENT: STUDENT AGREEMENT:
I represent that my thesis or dissertation and abstract are my original work. Proper attribution
has been given to all outside sources. I understand that I am solely responsible for obtaining
any needed copyright permissions. I have obtained needed written permission statement(s)
from the owner(s) of each third-party copyrighted matter to be included in my work, allowing
electronic distribution (if such use is not permitted by the fair use doctrine) which will be
submitted to UKnowledge as Additional File.
I hereby grant to The University of Kentucky and its agents the irrevocable, non-exclusive, and
royalty-free license to archive and make accessible my work in whole or in part in all forms of
media, now or hereafter known. I agree that the document mentioned above may be made
available immediately for worldwide access unless an embargo applies.
I retain all other ownership rights to the copyright of my work. I also retain the right to use in
future works (such as articles or books) all or part of my work. I understand that I am free to
register the copyright to my work.
REVIEW, APPROVAL AND ACCEPTANCE REVIEW, APPROVAL AND ACCEPTANCE
The document mentioned above has been reviewed and accepted by the student’s advisor, on
behalf of the advisory committee, and by the Director of Graduate Studies (DGS), on behalf of
the program; we verify that this is the final, approved version of the student’s thesis including all
changes required by the advisory committee. The undersigned agree to abide by the statements
above.
Ankit Jangid, Student
Dr. Jeffrey Seay, Major Professor
Dr. Fazleena Badurdeen, Director of Graduate Studies

IMPLEMENTATION AND ANALYSIS OF TRUE LEAN IN A STARTUP COMPANY BY USING PDCA MODEL, A CASE STUDY IN A MANUFACTURING VENTURE
________________________________________
THESIS ________________________________________
A thesis submitted in partial fulfillment of the requirements for the degree of Master of Science in Manufacturing Systems Engineering
in the College of Engineering
at the University of Kentucky
By
Ankit Jangid
Paducah, Kentucky
Co- Directors: Dr. Jeffrey Seay, Associate Professor of Chemical Engineering and Dr. M. Abbott Maginnis, Associate Professor of Mechanical Engineering and Director of Lean Graduate Certificate Program
Paducah, Kentucky
2019
Copyright © Ankit Jangid 2019 https://orcid.org/0000-0002-4833-4785
ABSTRACT OF THESIS
IMPLEMENTATION AND ANALYSIS OF TRUE LEAN IN A STARTUP COMPANY BY USING PDCA MODEL, A CASE STUDY IN A MANUFACTURING VENTURE
The purpose of this research is to implement and analyze the true lean transformation in a manufacturing start-up organization. Often, lean transformations are observed in developed manufacturing organizations having sophisticated production lines and numerous employees, where lean tools are utilized to reduce waste while increasing profit. However, this type of transformation is narrowly focused on quantifiable process results and falls short of the ultimate goal, establishing a true lean culture within the organization. As a result, it is recommended that true lean principles, philosophies, culture, operations environment and tools be applied at the very beginning stages of an organization, or during the start-up phase to embed true lean thinking and application in the entirety of the organization. In this analysis, a case study is performed on a team embarking on a start-up manufacturing enterprise. The team is trained on true lean and all the four aspects of true lean are applied for successfully implementing true lean in the start-up. In addition, true lean implementation approach was generated and applied using PDCA (plan, do, check and act) model. The results of this case study are presented in this work.
KEYWORDS: True Lean Principles & Philosophies, True Lean Culture, True Lean
Operations Environment, True Lean Tools & Terminologies
Ankit Jangid
04/24/2019
Date

IMPLEMENTATION AND ANALYSIS OF TRUE LEAN IN A STARTUP COMPANY BY USING PDCA MODEL, A CASE STUDY IN A MANUFACTURING VENTURE
By Ankit Jangid
Dr. Jeffrey Seay Co-Director of Thesis
Dr. M. Abbot Maginnis Co-Director of Thesis
Dr. Fazleena Badurdeen
Director of Graduate Studies
04/24/2019 Date

I dedicate this thesis to my wife and my parents

iii
ACKNOWLEDGEMENTS
First, I thank God for the many opportunities that have allowed me to pursue my
Master’s degree at the University of Kentucky. I acknowledge my parents’ support in
sending me abroad to pursue my goals and dreams. I also thank my wife for her steady
support and encouragement throughout the process. Thank you for allowing me to
discuss my ideas with you and receive feedback for generating this document. Because of
your love, I have achieved this milestone.
I further acknowledge the guidance of my advisors, Dr. Jeffrey Seay, Dr. M.
Abbot Maginnis and Dr. Fazleena Badurdeen. Their input, assistance, and expertise have
allowed me to create a meaningful thesis. From them, I have gained valuable knowledge
and skills in the field of manufacturing and True Lean. Their courses, one-on-one
discussions and feedback on my work has allowed me to truly understand this fields,
which I hope will further benefit others too.

iv
Table of Contents
ACKNOWLEDGMENTS ............................................................................................ iii
LIST OF TABLES ........................................................................................................ vi
LIST OF FIGURES ..................................................................................................... vii
LIST OF ABBREVIATIONS & ACRONYMS ....................................................... viii
1. INTRODUCTION.......................................................................................................1
1.1 Problem Statement .................................................................................................2
1.2 Objective ................................................................................................................3
1.3 Research Question ..................................................................................................4
2. LITERATURE REVIEW ..........................................................................................5
2.1 Background ............................................................................................................5
2.2 Lean Manufacturing ...............................................................................................9
2.3 A Journey from TL to Sustainability ....................................................................17
2.4 Startup ..................................................................................................................20
3. METHODOLOGY ...................................................................................................22
3.1. First Aspect of TL: Principles and Philosophies .................................................24
3.2. Second Aspect of TL: Culture .............................................................................30
3.3. Third Aspect of TL: Operations Environment ....................................................33
3.4. Fourth Aspect of TL: Tools and Terminologies ..................................................39
4. APPLICATION OF TRUE LEAN IN TSPC, A MS (CASE STUDY) ................47
4.1. Value Proposition ................................................................................................48
4.2. Functional Product Prototype ..............................................................................48
4.3. Product Market ....................................................................................................48
4.4. Potential Customers and Customer Demand Forecast ........................................49
4.5. True Lean Training ..............................................................................................51
4.6. PDCA Model for Applying Four Aspects of TL .................................................53
5. DISCUSSION OF RESULTS ..................................................................................74
6. CONCLUSION .........................................................................................................78

v
APPENDIX....................................................................................................................80
A.1 True Lean Exam Results .......................................................................................80
REFERENCES ..............................................................................................................81
VITA...............................................................................................................................86

vi
List of Tables
Table 1. Cycle time for each operation per batch ..............................................................61
Table 2. Estimated land areas ............................................................................................65
Table 3. Three years of projection .....................................................................................67
Table 4. Observations and Results from the TL Assessment……………………………71

vii
List of Figures
Figure 1. Toyota Production System or Toyota House ......................................................11
Figure 2. The Benevolent Production System ...................................................................19
Figure 3. Four aspects of True Lean. .................................................................................22
Figure 4. True Lean Implementation Approach ................................................................23
Figure 5. True Lean Culture ...............................................................................................31
Figure 6. True Lean Operations Environment and The Seven Conditions thereof ...........34
Figure 7. The 8-step problem solving method and how it relates to the PDCA model .....34
Figure 8. Roles in True Lean Operations Environment .....................................................37
Figure 9. Percentages of PS activities at different levels in an organization .....................38
Figure 10. TSPC target market based on geographical markets ........................................50
Figure 11. Process flow sequence ......................................................................................60
Figure 12. M&I Flow chart for TSPC ...............................................................................64
Figure 13. Land area required ............................................................................................65
Figure 14. TSPC’s True Lean Exam Results .........................................................................70

viii
List of Abbreviations and Acronyms
5S Sort, Straighten/Set in order, Shine, Standardize and Sustain
ABS Australian Bureau of Statistics
BPS Benevolent Production System
CANDO Cleanup, Arrange, Neatness, Disciple and Ongoing improvement
CT Cycle Time
FTE Full Time Employees
JIC Just-In-Case
JIT Just-In-Time
KPI Key Performance Indicators
LM Lean Manufacturing
LSP Lean Systems Program
MS Manufacturing Startup
M&I Material and Information flow
NVA Non-Value Added
OEE Overall Equipment Effectiveness
PDCA Plan, Do, Check and Action
PS Problem Solving
SHE Safety, Health and Environment
SMED Single Minute Exchange of Dies
SMLE Small, Medium and Large Enterprises
Sus-VSM Sustainable Value Stream Mapping
TBL Triple Bottom Line
TL True Lean
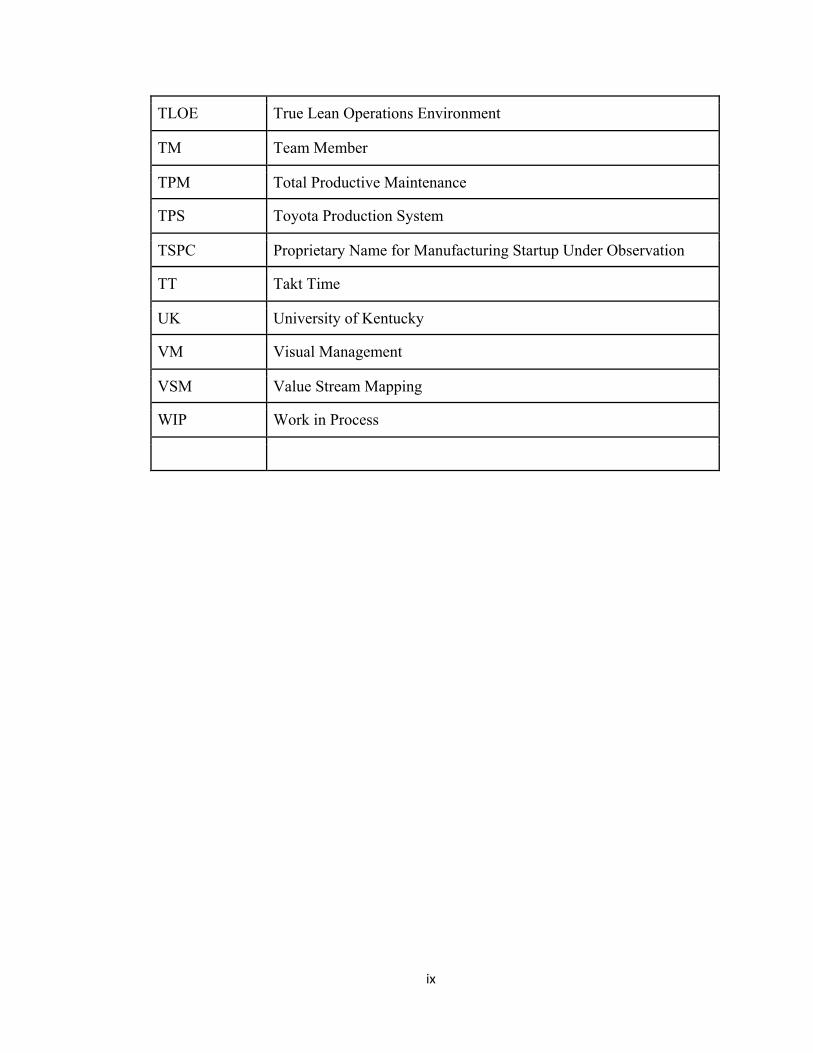
ix
TLOE True Lean Operations Environment
TM Team Member
TPM Total Productive Maintenance
TPS Toyota Production System
TSPC Proprietary Name for Manufacturing Startup Under Observation
TT Takt Time
UK University of Kentucky
VM Visual Management
VSM Value Stream Mapping
WIP Work in Process

1
Chapter 1
Introduction
In order to exist in a competitive global manufacturing environment, many
production enterprises have implemented Lean Manufacturing (LM) tools and practices to
meet increasing customer demand, reduce cost, and improve quality. Both product and
service companies can benefit from lean implementation in various ways like reduction or
elimination of non-value-added activities to maximize value for customers, and
examination of the entire value stream (the value stream represents all the activities that
are taking place to produce products or services). Just like small, medium, and large-scale
production plants, many manufacturing startups are trying to thrive and grow by utilizing
LM theory for manufacturing planning, product development, and customer development.
However, the number of startups has dropped from 614,024 (in 2006) to 452,835 (in 2014)
due to various reasons like the Walmartization of America, regulation, and big companies
becoming more entrepreneurial [1].
In addition to the reduction in the number of manufacturing startups, many other
small, medium and large-scale companies have also failed to successfully implement lean
because more priority has been given to lean tools without deeply understanding the
principles and practices. Becky Morgan (2016) expressed lean as a system of thinking
which consists of tools, not a system of tools [2]. Morgan gave three main reasons for lean
failure: first, unclear understanding of lean tools and practices; second, the culture of
blame; and third, organizations consider people as expenses and give less importance to
the learning cycle [2]. In addition to these challenges, another reason which results in lean

2
failure is that the employees of many organizations show resistance to cultural
transformation or change for adapting lean.
Many literature sources focusing on lean implementation have been published, but
the lean program at University of Kentucky provides a deeper knowledge of Toyota’s
approach which is known as Toyota Production System (TPS) or Lean System (LS). This
Lean System Program (LSP) is a university-industry partnership initiated by Fujio Cho,
Kentucky’s Toyota Motor Manufacturing Plant’s president, in 1994. Also, this program
has coined and trademarked the term, True Lean (TL). According to LSP, “true lean is
achieved when a group of people works by itself while engaged in the systematic problem
solving on the work they do, when and only when the culture of the organization is the
reason behind it” [3].
Based on the available information, TL has been implemented on SMLEs (small,
medium, and large enterprises) including service and product industry sectors but has not
been implemented on a startup. Therefore, this thesis focuses on implementing TL in a
startup company by using the PDCA (plan, do, check, and act) model to get the desired
results. [3, 4].
1.1 Problem Statement:
A survey conducted by Rich Alloo, a Toyota executive, and the LSP showed that
70-90% of all organizations who are pursuing lean transformation or implementation have
failed to achieve successful and sustainable lean transformation, regardless of the
abundance of lean resources [5]. Hence, organizations can improve the performance of
operations by utilizing lean tools, but continuously sustaining those improvements will be
the biggest challenge if lean tools are utilized without a comprehensive understanding

3
coupled with lean thinking. Most of the time, management starts losing support for lean
transformation and blames operators for problems’ causes instead of finding the root causes
of the problems [3].
Furthermore, as per the LSP, TL is not as simple as it seems. To implement TL
successfully, a critical and pervasive transformation in the entire organization with the
consistent support of behavioral modification is required. It is an evolutionary change
(a slow process) which results in slow progress, and due to this, organizations can lose
hope in it. Despite all this, TL is one of the best opportunities for organizations to
continuously sustain the development and learning environment.
This thesis will address the following problem:
● The TL implementation approach for achieving a successful transformation is not
currently available for a manufacturing startup.
In addition, manufacturing startups face many challenges and the most common
of all are addressed below:
• Incapability for producing an efficient production plan
• Low capital and experience do not allow manufacturing startups to create a visual
simulation in a manufacturing-simulation software
• Low availability of investors to raise desired capital
1.2 Objective:
The goal of this thesis is to create a plan for implementing TL in a startup and
highlight the areas that could be improved based upon the collected data. The

4
methodology discussed in this thesis is mainly focused on a Manufacturing Startup
(MS) and may not be applicable to all startups. However, the issues faced in a
manufacturing startup will most likely be common to many other startups. In addition,
further research will be conducted to alter or improve the existing methodology to form
an adaptable approach that is uniquely tailored for the MS’s observation. The
implementation of the improved model may enhance the chances of successful lean
transformation in the MS.
The objectives of implementing TL in the MS are:
● To create a TL implementation roadmap for the MS company.
● To implement TL in the MS company using PDCA model.
● To conduct a TL assessment in the MS company.
● To explore the challenging factors for the manufacturing startup to determine
ways to overcome them.
1.3 Research Question:
According to the given problem statement, the following research question and
sub-question will direct the research presented herein:
Research Question: How should TL be implemented in a MS company?
Sub-Question: Can TL assist a MS in overcoming the common problems it faces?

5
Chapter 2
Literature Review
2.1 Background
TL is based on the Toyota Production System and this term is coined and
trademarked by the University of Kentucky's LSP. The LSP is a university-industry
partnership initiated by Fujio Cho, Kentucky’s Toyota Motor Manufacturing Plant’s
president, in 1994.
Sakichi, Kiichiro, Eiji, Ohno, Kikuo, and Cho are the most discussed and prominent
TL practitioners who made a notable contribution to TPS (and Toyota) by standing two
pillars of TPS - Jidoka and Just-In-Time, by developing lean tools such as Kanban, pull
system, Anodon board, Kaizen, standardized work, etc., by cultivating the people’s abilities
and maximizing employees’ potential with respect [6]. The following information reveals
the history of contribution and challenges faced by the above-mentioned TL practitioners
towards the creation of TPS.
Sakichi Toyoda was the father of the Japanese industrial revolution. In 1890, he
invented the original wooden hand loom. In 1896, he created Japan’s first power loom. In
1924, Sakichi created the world’s first automatic loom [6]. His invention raised the
productivity and freed the operators from being watchdogs for a machine by giving the
machine human intelligence, to which Toyota called Jidoka. Jidoka is one of the two pillars
of the Toyota Production System. It means that a machine runs automatically and stops
automatically under one of the two conditions. First, when the process is completed, and
second, when there is a problem relating to quality or equipment. Since the machine can

6
stop when any abnormal activity occurs, a single operator can take care of numerous
machines. Hence, it frees operators to do more meaningful work instead of watching one
machine all day [6]. In 1926, Sakichi Toyoda introduced the concept of Genchi Genbutsu
and established Toyota Automatic Loom Works [6].
In 1937, Kiichiro Toyoda (the son of Sakichi Toyoda) established Toyota Motors
Corporation (TMCo.) and studied western auto manufacturers like Ford [3]. Later, when
the war-torn Japanese economy was struggling to rebuild and was slow to recover, Kiichiro
Toyoda, the son of Sakichi Toyoda who led Toyota into automobile manufacturing,
originated the idea of Just-In-Time which is one of the two pillars of TPS [6]. Since there
was no cash to pay for raw materials, the company needed to shorten the time from when
raw materials were purchased to the time money was received for its products. Therefore,
the philosophy of making only what is needed, when needed, and in the amount needed
became critical and was called Just-In-Time. In 1950, the Japanese government ordered
the company to reorganize its operations. Kiichiro took the responsibility and said, “those
who had worked with me had to be let go and I remained. It taught us a lesson we should
never forget. Once was enough to have such a bitter experience for both management staff
and employees” [6].
During the time of the Japanese economic crisis, Kiichiro assigned Eiji, his cousin,
as machine shop manager and instructed him to bring up the company to the US standards
of technology within 3 years. Eiji brought the company into a different political, social,
and economic environment. He also commented, “even though business had to operate
according to cold and heartless economic principles, to betray employee trust by layoffs

7
was the last thing company management should do. Providing employment stability is the
responsibility of a company” [6].
Taiichi Ohno realized the concept of the TPS by integrating Toyota’s philosophy
with a practical production management system based on Jidoka and Just-In-Time. Ohno
rearranged the processes according to the production sequence to shorten the lead time.
Also, to establish the continuous flow and to ease the process of tracing the defects, he
minimized the inventory between processes and established the smooth or continuous flow.
Plus, Ohno reversed the push system into the pull system based on the American
supermarket which runs on the customer demands to reduce lead time and inventory [6].
In a pull system, the following process is the customer and the preceding process is
the supplier or supermarket. So, the preceding process produces only what has been
withdrawn by the following process (customer). As it is based on actual consumption,
operators can make their own judgment about whether overtime is required [6]. Also, to
make the pull system work, Ohno used Kanban as a tool for communication between
processes. Plus, he discovered that when implementing a pull system, the withdrawal must
be even to allow preceding processes to produce evenly with minimum fluctuation in
workload which is called as Heijunka [6]. Also, he described the pace of sales using takt
time which is the time required to complete a job. The status of the pace of sales and
multiple skilled operators provided flexibility to Toyota’s production for a fluctuating
market. Ohno knew the backbone of TPS is standardized work which is the written best-
known way to do a job at a given situation, and it is continuously improved using problem-
solving and this process of continuous improvement was called as Kaizen. He also attached
Andon board (a signal board) to call the attention of leaders whenever the machine stops.

8
Here, it is important that the team leader must arrive quickly within the given time to
implement a quick fix, and after this, problem-solving should be done to keep the problem
from coming back. He was a guru who cultivated people’s abilities to figure out the
problem and solve it just by gazing their eyes at the problem [6].
Kikuo, the project general manager at the operation and management consulting
division at Toyota motor corporation, increased the pace of Ohno’s skill for cultivating
people’s abilities for figuring out the problem by asking multiple ‘why’ questions to the
relevant operators. Also, he never dictated to people by telling them exactly what to do;
and he never praised the employees to avoid the complacency which may block further
growth of subordinates. Moreover, he said, “do not waste workers’ time because they spend
the prime of their life at work. So, it is important for the management to ensure that
worker’s time is well spent in value-add work to show respect for people” [6].
Fujio Cho, the current chairman of Toyota Motor Corporation, is a disciple of
Taiichi Ohno and Kikuo Suzumura. He was the first president of Toyota Motor
Manufacturing Kentucky, Inc., and he transplanted TPS to the US. He taught many people
the philosophy, tools, and concepts of TPS. He said to executives at Toyota, “Everyone has
the capability to contribute; the ability to motivate others to develop their capabilities is the
key” [6].
Above all, the fundamental philosophy that supports TPS is respect for people or
the people’s side. Getting respect from the management and all the other employees is one
of the basic needs of individuals. If management fulfills this need for everyone then, each
employee will be satisfied and will work with his maximum potential to serve the in-house
customers and company [3]. Also, management shows respect to the employees in many
9
ways such as it finds the value-added work for employees and makes sure they can do it, it
involves the employees in meeting to make an important decision and do problem-solving
[3]. Fujio Cho once said that “Problem-solving is just like climbing a mountain. There are
many routes to get to the top. You may get lost in the woods or lose your footing in a valley.
But these are valuable lessons. Learn from mistakes and you will eventually get to the top”
[6]. Lastly, the TPS is an integration of several western theories such as interchangeable
parts, control chart, continuous flow, and PDCA [3]. These concepts were developed by
innovators like Eli Whitney, Walter Shewhart, Henry Ford, and W. Edwards Deming [3].
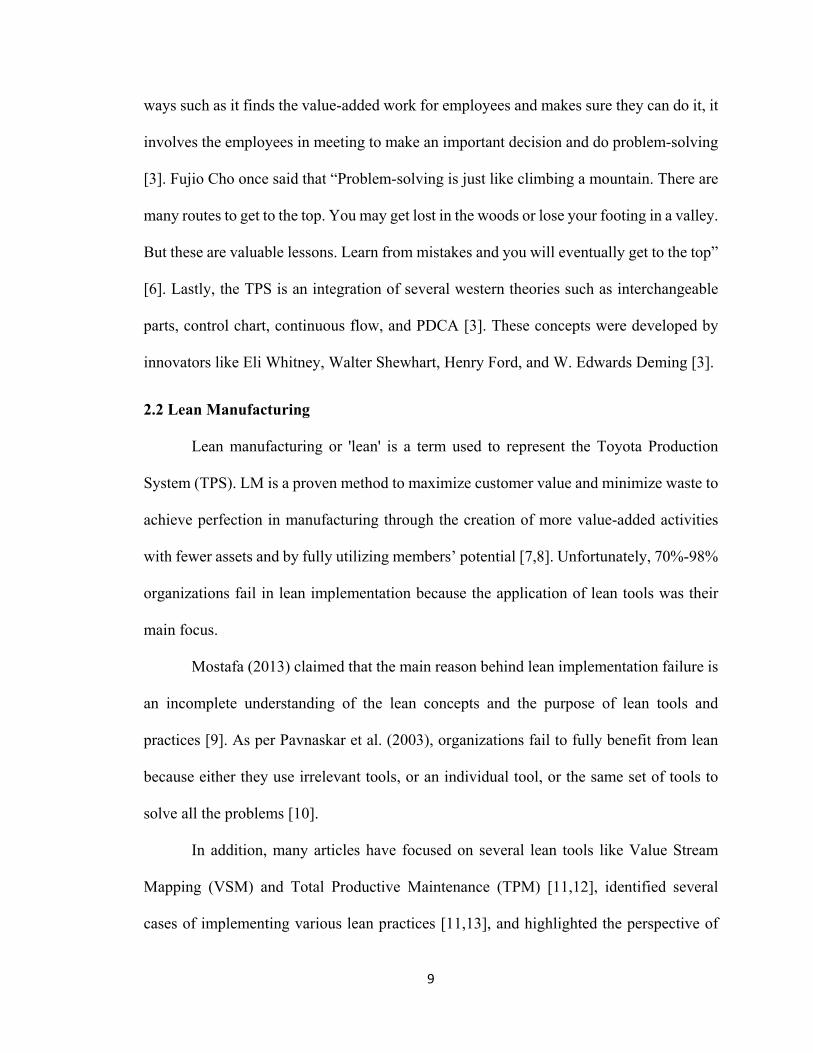
2.2 Lean Manufacturing
Lean manufacturing or 'lean' is a term used to represent the Toyota Production
System (TPS). LM is a proven method to maximize customer value and minimize waste to
achieve perfection in manufacturing through the creation of more value-added activities
with fewer assets and by fully utilizing members’ potential [7,8]. Unfortunately, 70%-98%
organizations fail in lean implementation because the application of lean tools was their
main focus.
Mostafa (2013) claimed that the main reason behind lean implementation failure is
an incomplete understanding of the lean concepts and the purpose of lean tools and
practices [9]. As per Pavnaskar et al. (2003), organizations fail to fully benefit from lean
because either they use irrelevant tools, or an individual tool, or the same set of tools to
solve all the problems [10].
In addition, many articles have focused on several lean tools like Value Stream
Mapping (VSM) and Total Productive Maintenance (TPM) [11,12], identified several
cases of implementing various lean practices [11,13], and highlighted the perspective of

10
seeing lean as a philosophy [14]. However, one of the two Toyota Ways or core principles
of TPS, respect for people, has almost always been missed [8].
In this thesis, the term TL has been used in place of lean or lean manufacturing for
several reasons. The term TL emerged from the TPS and is a system of thinking that
consists of tools (which will be discussed later), but not as a system of tools. This is separate
from the term lean or lean manufacturing, which in many articles, blogs, industries, lean
consultants and authors have described and applied as only a set of tools to reduce waste
and increase profit. This has led the soft side of lean or lean thinking to be always either
ignored or not prioritized. Consequently, this is one of the main reasons that organizations
suffer failure in lean transformation and quit the process due to frustration. Hence, TL is a
model that points the users back to the intended benefits of lean, highlighting the original
four aspects of principle & philosophies, culture, operations environment and tools. For
this reason, in this thesis, lean manufacturing has been replaced with TL to focus on the
thinking as well as the application of thinking and tools. In like manner, terms such as lean
tools or lean principles have been replaced with TL tools and TL principles.
Furthermore, if organizations adopt TPS thinking and properly apply TPS
principles and practices, or TL, then, they can successfully establish a learning environment
which will play a vital role in sustaining the continuous improvement [8]. As per Nichols
(2018), there are five common goals that all companies are trying to achieve: customer
satisfaction, happy and knowledgeable employees, reduced lead time, lower costs, and
increased product quality [15]. However, TL claims to assist in achieving eight main goals
or desired outcomes which fall under the three core philosophies of TPS. The first
philosophy is “Customer First” and its goals are the highest quality, lowest cost, and

11
shortest lead-time. The second philosophy is “Respect for Humanity” and its goals are job
satisfaction, job security, and a consistent income. The third philosophy is “Waste
Elimination” and its goals are market flexibility and profit increment or cost reduction by
eliminating waste. These philosophies and goals are clearly represented in the TPS house
Figure 1 [3].
Figure 1. Toyota Production System or Toyota House [3]
In TPS, there are four main types of activities that impact the success of any
production system: value-added, Muri, Mura, and Muda. Out of these four activities, three
of them are represented as a 3M model of TPS: Mura, Muri, and Muda [16,17]. These 3Ms
are Japanese terms and considered as the biggest enemies for a company’s profitability.
Value-added are those activities that add value to the product or service for which
customers are ready or willing to pay. As per Womack and Jones’s book, Lean Thinking,
“value is the capability provided to customers at the right time and price” [17]. Mura means
unevenness which occurs because of fluctuation in customer demand, variations in cycle
times, instability in the required materials or WIP (work in process), etc. Mura can generate

12
Muri and Muda, and it can be reduced by establishing stability in the supply chain (between
suppliers and customers), implementing standardized work and visual management. Muri
is the overburden caused due to the utilization of humans or machines for more than 100%
of their capacity. For example, absenteeism, breakdowns, Mura, can make operators or
machine work more than their capacity and that results in overburden [17]. Muda is another
Japanese term which means waste or non-value added (NVA) activities for which
customers do not pay. Muda is divided into two categories- type one muda and type two
muda. Type one muda is an NVA activity that cannot be eliminated and are necessary under
several conditions, for example, inspection is a process which is required to insure the
quality of products, the inspection time can be reduced, but it cannot be eliminated. Type
two muda is an NVA activity which can be completely eliminated. In addition, muda was
also divided into a total of seven types of waste activities that were defined by Toyota, and
the eighth waste was discovered later by different authors and experts in different form like
unergonomic work conditions or under-utilized human potential or confusion (uncertainty
to do the right thing) [18]. These eight wastes are Defects, Excess Processing,
Overproduction, Waiting, Unnecessary Inventory, Motion, Transportation, and Non-
Utilized Talent. In addition, Panneman (2007) claimed that Toyota also created several
tools to overcome or eliminate these wastes such as SMED (single minute exchange of
die), Takt time, Poke Yoke, One-Piece flow, Problem Solving, Standardization, etc. [19].
Following points describes types of Muda and various tools and activities that can eliminate
them.
1. Defects: According to Business Dictionary, manufacturing defects are non-
conformance of a product with specified standards or non-fulfillment of customer
13
satisfaction [20]. In addition, defects are divided into four classes- very serious class which
may cause severe injury or loss, a serious class which may cause significant injury or loss,
the major class represents significant problems with intended normal use, and minor
represents minor problems with intended normal use [20].
The production of defective products/parts/assemblies/subassemblies at any point
in production that leads to additional time, labor, rework, scrap parts or assemblies, and
money to fix the defects. Additionally, defects may increase overproduction,
transportation, and excess processing. In a product focused or manufacturing company,
there can be many reasons for defects such as poor-quality control, poor repair, poor
documentation, zero standards, weak processes, misunderstanding of customer needs,
uncontrolled inventory levels, poor design and undocumented design changes [21].
Defects can be avoided by utilizing tools such as Poke Yoke, standard work, etc. [19]. Poka
Yoke is a Japanese term which means error proofing and is described in section 2.3.
2. Excess Processing: The term excess processing means processing or
working on products or arts or services more than required. This type of waste can be a
consequence of an unclear understanding of customer requirements or defects which
requires rework to repair or remanufacture the products for the satisfaction of customer's
need [22]. For example, cleaning of a windshield even if it looks clean and transparent, re-
entry of data, human error, etc., these types of activities can be called excess processing.
Other causes for excess processing are the use of high precision equipment where simpler
tools are sufficient, for instance, cracking a nut using a sludge hammer [23], multiple
signatures in a document, overdesigned equipment [21]. Various tools have been identified
to overcome this waste such as customer-communication, process map, and observation

14
[19]. First, customer feedback is important to simply know whether a customer needs extra
features/processing or not. Second, the process map is similar to a flowchart which reveals
the information about delay, process steps, inventory, transportation, measurement, and
decisions. Plus, it is also a part of the value stream map and is capable of systematically
assisting team leaders or members to find waste in the working process. Lastly, observation
is required to create a process map, but it can also be used to directly identify waste and it
is the best way to find wastes [19, 24]. Plus, Taiichi Ohno observed waste by simply
creating and standing in an imaginary circle around him [19, 25].
3. Overproduction: In TL, overproduction is referred to as the Just-In-Case
(JIC) concept which is the opposite of Just-In-Time (JIT) concept. For example, production
of more products than required, JIC some units are defective or to avoid late delivery is
called overproduction. Many organizations manufacture and store more products or goods
than required because of unclear customer needs, long set-up times, and just-in-case
thinking. These actions lead to long lead times, high inventory cost, difficulty in finding
the location of defects, and other additional wastes. Overproduction can highly impact the
growth of any company because it is highly costly, it can prohibit smooth material flow,
and it can diminish productivity and quality [22]. According to LSP, stability in the
production can reduce or avoid this waste by implementing JIT concept i.e. produce based
on what, when, and how much is needed. Tools to overcome the overproduction are
appropriate demand forecasting, SMED, and Kanban [19]. Appropriate demand
forecasting is very important to avoid overproduction or crisis. SMED stands for the single
minute exchange of die and it means quick changeover. Shorted changeovers can reduce
the need for overproduction, WIP between the process, and lead time. Kanban is a visual

15
card that transfers signal to upstream workstations about the quantity and type of material/
parts/ assemblies/ subassemblies are required. As per TL, Kanban is the source of
communication which provides information about what to build and move, in other words,
provide instruction for production and withdrawal. In addition, Kanban also provides visual
control to reveal and control the overproduction waste.
4. Waiting: In a batch production, whenever a batch of parts or products sits
or waits for the value added by an operator or operation, it is called waiting. Waiting also
occurs when an operator waits due to the unavailability of materials, unplanned downtime,
breakdowns, poor material and information flow, etc. [21]. David McBride claimed that in
a traditional batch production facility, 99% of a product's life is spent in waiting [23]. In
addition, according to Christina Gay, the product waiting is one of the many factors that
are directly proportional to overhead cost [22]. Similarly, as per Goldratt's theory of
constraints, the amount of time lost in waiting due to any reason is the amount of time lost
to the entire factory's output and is unrecoverable [23]. This waste can be avoided by
improving material and information flow, by improving operations, by making the
production stable, and by setting up standards. Tools that can avoid waiting for waste are-
time studies, takt time, and line balancing [19]. Time studies are gathering of process time
or total cycle time, walking time, and waiting time. These gathered times can assist in
establishing standards; plus, with these data, the measured waiting time can be reduced or
eliminated by performing the problem-solving activity.
5. Unnecessary Inventory: It is also called excess inventory which is one of
the 8 wastes for which customers do not want to pay. In lean, excess inventory is considered
as cash in hand that may lead to a risk of losing money in case of pitfalls in customer

16
demands. It also results in buffers, overproduction, long set-up times, waiting, excess
transportation, etc. In addition, maintenance of excess inventory increases the holding or
storage and transportation cost. According to LSP, the smooth flow among workstations
and controlled WIP as per customer demand can assist in the reduction of excess inventory.
Plus, the establishment of Kanban and manufacturing cells can also result in inventory
reduction [3].
6. Transportation: This is a non-value-added activity or waste which consumes
energy, time, and labor, and cannot be completely eliminated, but can be reduced [3]. In
general, the customer does not want to pay for any transportation of goods expect the
shipment to the given address. For example, transporting products from manufacturing
plant to warehouses, moving products within the warehouse, moving products, parts,
assembly, and sub-assembly in the manufacturing plant, etc. Activities that can help reduce
this waste are 5S, standardized worksheet, rearranging the physical layout of the operations
or shop floor as production lines or manufacturing cells in U shape, and reducing inventory
and defects.
7. Motion: It is an unnecessary movement that is performed by either machine
or TMs to complete their given job. It may cause some health and safety problems because
of poor ergonomics like bending, stretching, walking, lifting, bowing, climbing, and
reaching. The unnecessary motion makes the work longer by adding some non-value
activities which result in a waste of time, effort, energy, and cost. Unnecessary motion can
be eliminated by utilizing tools like standardized worksheets and 5S (Sort, Set in order,
Shine, Sustain and Standardize), and identifying this waste in each job's work elements and
improving those work elements to avoid non-value added activities.
17
8. Non-utilized Talent: This waste can be noticed in many existing
manufacturing plants. When a company fails to utilize the talent, knowledge, and skills of
the TMs or employees then it is considered as non-utilized talent. This waste is rarely taken
care of because management plays the main role in driving this waste and at the same time,
management does not want to fix itself to avoid this waste. According to Jason McGee-
Abe, this 8th waste can occur because of lack of teamwork, poor communication, poor
management, wasteful admin tasks, zero response and activity for employee’s
improvement suggestions, etc. [21]. Hence, training, trust, respect, and support from the
managerial level to shop floor level can assist in the elimination of this waste, continuous
improvement and individual development.
2.3. A Journey from TL to Sustainability
In general, sustainability has become a widely recognized term that has been
implemented in many sectors including social, political, and industrial. As a result, it has
been defined in various ways. For example, according to the Brundtland Commission,
sustainable development is defined as that which meets the needs of the current generation
without compromising the ability of future generations to meet their own needs [26].
Another definition, according to Institute for Sustainability is that it is a business strategy
which considers economy, governmental issues, and the voice of customers and
stakeholders [27]. Essentially, the goal of sustainability is to benefit society, the economy,
and the environment equally, or in other words, meeting the Triple Bottom Line (TBL).
The principle challenge for many organizations which are trying to be sustainable
is to balance the TBL. To address this challenge, various TBL performance measurement
frameworks and metrices have been developed to measure and improve the impact of
18
products, processes, and systems on the TBL. Another challenge faced by manufacturers
is enterprise sustainability [28], which can be achieved by reducing the consumption of
resources, energy, and impact on environment, while ensuring that the business is
profitable by considering the benefit of consumers and communities [29,30]
Sustainability has also been applied to the manufacturing environment specifically.
This aspect takes enterprise sustainability one step further by considering safe working
environment and employee satisfaction, targeting the societal aspect of the organization
itself [30]. The 6R elements of sustainable manufacturing, which assists facilities in
determining the impact of their products in the post-use phase are also applied in this term,
streamlining the activities of manufacturing organizations to obtain product sustainability.
The 6R approach introduces a take-back system that recovers, reuses, recycles,
remanufactures, and redesigns products by giving the end-of-life product a new life, while
reducing process costs, consumption of valuable resources, and energy [31]. The lean
manufacturing tools are specifically focused on 1R of these 6Rs, reduce, which is
incorporated into all of the product life cycles for achieving the TBL [31]. Some commonly
used lean tools have been extended to sustainability in other ways also. For example, 5S
has been extended to 7S (Spirit and Safety) and their connectivity with sustainability has
been shown [32,33]; the “5 whys”, a common problem-solving activity, has been utilized
for the analysis of processes, products, and systems to avoid toxic release and hazardous
materials [33]; and Value Stream Mapping (VSM) has been extended to Sustainable-VSM
(Sus-VSM) for seeking more opportunities to improve TBL [30].
However, for small startup manufacturing enterprises, the take-back system
proposed in the 6R elements of sustainable manufacturing is difficult to implement

19
initially, as these organizations may struggle to implement the expensive and complex
transportation network of taking back their products, which leads to a loss in the beginning
phase. As a result, it is recommended for startups to begin their journey with sustainable
practices at low costs, designing inherently sustainable products that avoid higher
implementation costs of sustainability in later phases.
In addition, Benevolent Production System (BPS) was generated by performing gap
analysis based on UK True Lean Operating Environment Model and sustainable
manufacturing as shown in Figure 2 [8].
Figure 2. The Benevolent Production System [8]
As per BPS, TL in a manufacturing environment has a large effect on the TBL because
it allows an organization to fully utilize the existing resources with minimum waste
generation. It also demands to put customers first by providing products at lowest cost and

20
on-time delivery for their highest satisfaction and creates an environment of respect for
people who do the work [8]. Plus, extended lean tools like Sus-VSM can be used to
visualize the factors that has impact on the TBL. Afterwards, these factors can be reduced
to create a sustainable manufacturing plan for a MS or a future state for established
organizations. In this way, TL is capable of making an organization more sustainable by
positively nourishing the TBL. Hence, implementing TL in a MS will lead to sustainability
at lowest cost and in minimum time.
2.4. Startup
As per the Australian Bureau of Statistics (ABS), there are four business categories
from the perspective of scale or size- startup/micro-business (1-5 employees), small scale
(5-19 employees), medium scale (20-199 employees), and large scale (200 or higher
employees) [34]. Out of these four categories, this thesis is mainly focused on the 1st
category, i.e. a startup or a product focused manufacturing startup.
A startup has been defined as “a temporary organization designed to search for
repeatable and scalable business models” [34]. A startup is a temporary organization
because it does not plan to stay a startup forever and wants to be a large-scale company. It
is designed to search for a set of things that are repeatable and work every time that could
be taught to other people [35]. This set of things include questions such as what’s the right
value proposition, product or service offering; what’s the right customer segments,
distribution channel, revenue model and pricing; what kind of resources and activities are
required to create the right product; what are the expenses; who are the right partners; and
does the company have a capacity to multiply the invested money to avoid shut down [35].

21
As a result, a startup is a company that puts efforts in solving an issue when the solution
may not be obvious and when success is not guaranteed [36].

22
Chapter 3
Methodology
Cost and time for the implementation of TL depends on various general factors like
size of the organization, type of organization, resistance towards TL transformation, the
extent with which they utilize TL, and training. Hence, it can be said that implementation
of TL in a MS (Manufacturing Startup) company will take less time, cost, and effort
because of its micro size, and it will naturally show low resistance towards TL
transformation. Additionally, TL implementation in the early stage of a MS will allow the
startup to save time and cost required for lean transformation in later stages.
TL is divided into four phases or aspects for its implementation in a MS, these four
phases are TL principles and philosophies (first), TL culture (second), TL tools and
terminologies (third), and TL operational environment (fourth) as shown in Figure 3.
Figure 3. Four Aspects of True Lean

23
In addition, all these four phases are interconnected with each other and will be
implemented using PDCA (plan, do, check, and act) model as shown in Figure 4.
Additionally, this approach can be utilized for all types of organizations (as
mentioned in section 2.4), but a startup is required to fulfill the following prerequisites
before implementing TL. Also, one can complete these prerequisites in the PDCA model
too, but because this thesis is focused on a MS or the manufacturing side of a startup, the
customer forecast and product market are not included in the PDCA cycle.
1. Has a functional product idea or prototype.
2. Has defined the value proposition of its product.
3. Has identified the product market.
4. Has identified potential customers.
5. Has estimated a reasonable customer forecast by approaching the potential
customers.
Figure 4. True Lean Implementation Approach
Once, a startup fulfills these five prerequisites, the TL implementation model can
be pursued. To start, first step for TL implementation is to “Educate or Introduce or Train”
all members of the startup on the four aspects of TL in a sequence where all the phases will
be covered from first to fourth. This step is very important to establish TL thinking in any
enterprise. Plus, the sequence of covering all the four phases is also very important for
24
successful TL transformation because if TL principles and philosophies are covered first
and adapted by the MS then, it will assist the MS to establish a TL culture easily. After
introducing all of the four aspects of TL, the MS can utilize PDCA model to implement
TL.
Initially, a "plan" must be generated to apply the four phases of TL – principles and
philosophies, culture, operations environment, and tools. For instance, in this step, the MS
can plan the manufacturing layout of the plant, allocate resources and determine capital
constraints by using principles and philosophies and tools to attain TLOE. Once the plan
is created, the MS can execute or implement the plan, which is the "do" step. After the
execution of the plan, the MS will gather the results and analyze the situations using
observations and TL assessment tools in the "check" step to determine successes or
bottlenecks. In the last step, "act", MS either continues the plan, if successful, or makes
decisions on which bottlenecks should be improved first to carry on the TL journey towards
True North. Since, the initial PDCA cycle highlights where the weak points are located
(check step), the PDCA cycle can be further applied to each relevant phase of TL (as
prioritized by the act step) by conducting a PDCA within individual phases to continue
towards TL. In detail, a PDCA cycle can be applied to problems relating to understanding
principles & philosophies, maintaining the culture, applying the tools, or improving the
operations environment. If needed, the PDCA cycle can be repeated again within each
phase of TL for remaining or additionally discovered problems. The above mentioned four
phases or aspects of TL are discussed below.
3.1. First Aspect of TL: Principles and Philosophies

25
The very first step of TL implementation is educating all the member of MS about
four aspects of TL. The aspect that needs to be introduced first is TL principles and
philosophies. This aspect can simply be done by giving a presentation, lecture or speech
on it. The following information can also be presented to cover the theory of the first aspect.
"TL is a system of thinking which consists of tools, not a system of tools" [2],
hence, the TL thinking part plays a vital role in TL implementation and without it, TL
transformation will fail in the near future. The TL thinking represents the knowledge of all
the four aspects or phases of TL, and out of these four phases, the first phase i.e. TL
principles and philosophies represents most of the TL thinking which has always been
ignored or given less priority. As per TL or TPS, there are three core TL philosophies-
customer first, respect for humanity, and no waste. TL puts customers first by providing
them high quality products at low cost and on time. Second, it respects people in various
ways, constituting one of the foundations of TL principles. Lastly, it continuously finds
ways to avoid non-value-added activities and/or waste to increase profit and be flexible in
the market.
Specifically, TL consists of five core principles- spirit of challenge, genchi
genbutsu, kaizen, respect, and teamwork. These principles are further detailed below.
1. Spirit of challenge: It is a very important to go through changes to achieve
perfection. The image of perfection starts with long-term visions which consist of greater
challenges. These challenges cannot be accomplished without any change in current
situation of an organization, and they must be accepted with a creative spirit and courage.
As per the Toyota Way 2001, change is a constant partner; nonetheless, being generally
frustrating and challenging for employees [37].
26
In addition, the change in an organization mostly starts in the form of problem
finding and solving, targets, goals or projects as management's decisions linked with
company's long-term visions. These goals or projects or problem-solving activities can be
related to customer complaints, cultural transformation, quality and productivity issues, or
financial crisis [37]. Now, to meet the challenge of change, employees need to bring out
their best to take extraordinary steps in the form of a systematic problem solving
throughout the company from upstream to downstream (if required). This can only be
possible if the organization maintains the required energy towards improvement at all
levels of it. Plus, a TL enterprise should always welcome competition to learn from
challenges and become more competitive.
2. Genchi Genbutsu: As per Akio Toyoda, job titles are unimportant in TL culture
and those who learn the concept of gemba are the most respected. In similar manner, the
winners among the team members are those who observe the activities being close to the
gemba [37]. Gemba is any location where activities take place and value is added; for
example, a location where an engine is being assembled, a location where customers are
being severed via phone or emails, or a location where the customer is using the vehicle.
Therefore, genchi genbutsu is a value-added activity performed by leaders by going to the
gemba and trusting the people working there to gather facts and make decisions [37]. These
decisions are required for making change and they must be carefully made by the
consensus, considering all options.
Likewise, continuous improvement (Kaizen) projects, quality circles to cut costs,
productivity improvement and waste minimization should not be provided by senior plant
managers sitting in their offices but should be carried forward by the people at the gemba.
27
For example, decision making related to customer complaints is a task of the dealers and
customer service representatives who are at the gemba [3].
3. Kaizen: Changes should not be made in rush when problems occur. Instead,
thorough analysis of problems should be performed to find the real root cause and the best
countermeasures. Later, the most successful countermeasure(s) must be standardized to
keep the problems from coming back [37]. This problem solving activity should be actively
performed in the company on a daily basis, being therefore referred to as continuous
improvement. Hence, it requires the responsible members, or team leaders, to go to the
gemba for seeing the actual situation and gathering facts. Often, companies are data
collection driven, but only data cannot solve the problems. Problems need to be solved in
timely manner at the gemba where they occur by using effective problem-solving activity.
Operations can be improved constantly using effective problem-solving tools like, 8-step
problem solving method where they are clearly seen and accepted by all individuals [3].
There are several examples of where Kaizen activities can be performed by utilizing
various TL tools [3,38]:
● Establish a pull system to avoid overproduction - producing based on customer
demand.
● Level out the workload on the shop floor - various operations tasks should be
organized to where all stations have close to equal operating time to avoid large
inventories, production hold up or idle working stations.
● Implement shop floor controls to visualize the current shop floor status and
structure.

28
● Use reliable technology or autonomation that serves people and processes by
manufacturing quality products while highlighting problems.
● Visualize the information gathered and made it easy to access.
● Place improvement target controls and their progress clearly to continue in Kaizen.
Furthermore, the kaizen mind not only repeats the mantra of customer first, but it also
participates in the problem-solving activities from the customer perspective, requiring
persistent thinking and action [37]. The kaizen mind allows organizations to work
diligently with customers to identify and solve their problems, and to admit openly and
instantly to any uncovered verified problem. Moreover, it creates a learning environment
where leaders, people, and teams who better understand their work participate in problem
solving, live the philosophies, and teach it to others.
4. Respect: Generally, from a non-TL company's perspective, respect is shown in its
common form as honor, regard, or admiration. However, from a TL's perspective, in
addition to the aforementioned qualities, a TL organization respects its individuals in the
following ways [3,39]:
● It respects its customers, suppliers, dealers, employees or anyone else by
avoiding finger-pointing or blaming for its problems.
● It respects them by challenging and helping them improve.
● It respects its team members by making sure they are spending their valuable
time by manufacturing products with minimum or zero non-value-added
activities.
● It respects its suppliers by supporting them in waste reduction.

29
● It utilizes reliable technology or autonomation that serves people and processes
to manufacture quality products and highlight problems.
● It leads through shared values, equal opportunities, mentorship, cooperation,
support, and sound judgement, rather than dominance.
● It provides work ownership to responsible individuals.
● It communicates thoroughly and sincerely.
● It respects all the employees equally by rewarding them based on its overall
performance or profit.
● It respects its customers by being ready to apologize for any dissatisfaction,
pain or inconvenience they suffer from the products and by highlighting the
positive steps towards improvement.
5. Teamwork: Teamwork does not take place when employees are identified only
with their own success and development, but rather when employees are identified with
the entire organization [37]. The attitude of being identified by or thinking about the
company allows employees to work as a team for learning, growing, and sharing the
opportunities of development to maximize each individual's, team's or organization's
performance. Plus, a TL organization should share the TL knowledge with its suppliers and
dealers for benefiting them and itself. This attitude is often easier to maintain in small
enterprises; however, it can become highly complex in global companies where
communication for everyone with everyone else can be almost impossible. These
complications are the bottlenecks that can be improved to allow the various individuals to
share required information with others efficiently. This journey is, of course, never ending
for all organizations, making teamwork a foundational value.

30
This discussion concludes the first phase or aspect of TL, which are the core
philosophies and principles that can be taught to a MS. In like manner, the second aspect
is inclined towards the application of TL principles and philosophies to develop a TL
culture.
3.2. Second Aspect of TL: Culture
A TL culture within a company can be introduced in the following way. Authors of
the books “the machine that saved the world” and “Lean Thinking” have emphasized that
TL culture comes when employees live the TL philosophies and follow the TL principles
in their organizations, whether it is a manufacturing or a service organization [40, 41, 42].
In addition, Figure 5 represents TL culture where people at all levels are following the
standards, doing their own work to add value in products, participating in problem solving
or kaizen activities for continuous improvement, following the TL principles and the one
voice tools to establish one system for all involved [3].
An organizational culture depends on the expectation and behavior of leaders,
middle and top management individuals. In a TL enterprise, leaders are taught to tailor
their behavior around TL principles and philosophies. Once, the leaders start showing the
first aspect of TL in their actions then, the members under them will also represent the first
aspect or principles and philosophies in their behaviors. It is important for an organization
to deeply understand this before implementing TL tools and practices to avoid
consequences that might not be in its favor. For sustaining this culture, effective leadership
is required, and effective leadership comes when leaders effectively convey the
expectations, clearly mentioning and writing down the principles and philosophies. This
action assists all employees in standing by these guidelines. In this way, leadership lives

31
these principles and philosophies, demonstrating them diligently through their behavior.
Additionally, it is recommended that leadership takes action to visualize TL principles and
philosophies to remind employees that they should always stand by these principles and
philosophies.
Figure 5. True Lean Culture [3]
Furthermore, TL leaders should deploy and deliver TL principles and philosophies
in their behavior using one voice tools to establish one system for the entire organization.
That is, a TL culture shares a single system of adding value by using one voice materials
such as problem solving, standardized work format, and etc. [43]. Here, a startup should
take advantage of establishing the TL culture in the beginning stages of the organization as
it is easier and cheaper to do so in a green field than in an existing company due to the
reasons discussed earlier in this methodology. To establish this culture, leaders should also
teach the problem solving activity and deeply engrave TL principles and philosophies in
team members during the beginning stages of the company, as each member will need to
32
follow and live TL principles and philosophies every day and every time while being
employed in the organization. In return, this informs the members the organization's
expectations and how to meet those expectations. This is different from the approach of
many other organizations that hand the problem-solving activities to the new members and
fail to build a foundation for living the problem-solving activity every day. Hence, this is
an example of a misleading application of problem solving and is one the reason why all
four phases of TL must be introduced before utilizing the PDCA model.
Moreover, TL leaders should strive for continuous improvement in all aspects of
the business, which requires people from top executives to the heads of small work groups
on the shop floor to work together. All the employees should take errors or problems
personally regardless of their job titles and do everything possible to solve the problem and
keep the problem from coming back. Hence, in a TL organization, a problem is never
someone else's concern – it must be addressed by the right people (who finds the problem)
at exactly that time. Furthermore, TL leaders should have the ability to point toward “True
North” and find gaps between standard and current conditions. They also need to believe
that all waste cannot be eliminated but can be reduced; perfect quality can never be
achieved but defects can be reduced; and a corporate's performance can never be 100% but
can be made better. Also, companies who are on the path of TL transformation should
understand that TL is not an achievement, but it is a continuous and never-ending journey.
Lastly, TL leadership should maintain the respect of people, provide respect in
return, and focus on improvement to minimize loss and to strengthen the organization as a
whole. This can only be possible when a company has strong leadership, with a deep belief
that change is constant and only highly developed people can continuously adapt to change.
33
Hence, the recipe for Toyota’s success has been deep understanding and truly believing
that employees are the company's most precious resources, while investing time and money
to develop all of the members in the organization. The leadership at Toyota started with
Sakichi, not by the help of external experts, and took decades to cultivate and example a
TL culture [39]. Conclusively, the establishment and maintenance of a TL culture is an
ongoing journey within the company.
3.3. Third Aspect of TL: Operations Environment
After understanding the TL culture, it can be applied within the company to generate
a True Lean Operations Environment (TLOE), or the third aspect of TL. TLOE is built
upon and consists of seven conditions, which form an integrated network as shown in
Figure 6 [3]. The first and primary condition of TLOE is "highest customer satisfaction" –
a core philosophy of the TL that states customers are first. A TL organization meets this
condition by providing good quality products or services to customers at cheaper,
competitive prices and in the least time. For this reason, TL tools are required to eliminate
waste or to avoid non-value add activities.

34
Figure 6. True Lean Operations Environment and The Seven Conditions thereof [3].
Figure 7. The 8-step problem solving method and how it relates to the PDCA model [3].

35
The second condition of the TLOE is systematic problem solving. Here, the best
TL tool that can be used to solve problems is the 8-step problem solving method. This tool
is often combined with the PDCA cycle and consists of 8 steps as shown in Figure 7. The
benefits of this tool are reaped most when it is carefully followed and used every day in
TLOE to eliminate waste and achieve the highest customer satisfaction. It is important to
note that the prerequisite of problem solving requires a known stability or consistency in
the process, which come from standardization and via clear member roles. That is, if the
best-case, or the stable situation of a process are known, when deviations, fluctuations or
abnormalities occur, they can be classified as problems rather than rare mishaps.
Therefore, the 8-step problem solving method begins when a deviation from the
stable situation is noticed. Next, the problem is assessed by both team members and team
leaders to break down the problem to identify its location, setting an expected time for
resolving it, also known as target setting. This can be done either immediately (such as in
the case of blocked production line) or within a desired time frame (such as a machine
breakdown). It further includes to what extent the problem needs to be reduced. For
instance, defected products must be reduced to a certain extent by the end of desired time.
Then, the problem is analyzed to determine the root causes and potential solutions, i.e.
countermeasures are developed. Hence, the first five steps from identifying the problem to
developing countermeasures encompass the "plan" phase of the PDCA model. Step six sees
the countermeasures through in the "do " phase of the PDCA by carrying out the activities
necessary for solving and fixing the problem. In like terms, step seven monitors the results
obtained and the impact of the problem on the processes to determine consequences, or the
effectiveness of the solution in what is known as the "check" phase of the PDCA. Lastly,

36
the "act" phase of the PDCA, or the eight step, standardizes successful processes and
outcomes to avoid the recurrence of the problem.
Next, the third condition for TLOE is the abnormality management. This
management consists of various activities such as distinguishing the problems (to make
decisions on ether if they require quick a fix or not), highlighting the problems as they
occur, solving the problems using systematic problem solving tool (8 step problem
solving), and building quality products the first time.
The fourth condition of TLOE is standard processes generated by standardizing the
current best methods. Standardization is the foundation of continuous improvement in TL.
The standard process document should be available at all the workstations in an
organization. This practice is the best available method to complete the jobs on time and
to identify gaps or abnormalities on workstations. Plus, it is used in the last step of 8 step
problem solving to standardize the best countermeasure to sustain improvements and keep
the problems from coming back.
The fifth condition of TLOE is an engaged staff, which means team members are
involved in the organization's improvement. Staff can easily be engaged by highlighting
problems and working on them using the 8 step problem solving method. Leaders play an
essential role in this as they generate trust among their staff by encouraging and
appreciating them for surfacing the problems. Here, leaders should utilize the expertise of
the team members that perform the required tasks, since they are most familiar with the
problems and are the best resources to effectively resolve the problems.
The sixth condition of TLOE is establishment of clear roles. TL has a hierarchy of
roles which shows the duties of team members, team leaders, group leaders, assistant

37
managers and managers, as depicted in Figure 8 [3]. According to this hierarchy, a team
member’s duty is to follow standardized work and highlight problems when following the
standardized work. Above this is the team leader, whose role is to write and update
standardized work, provide job instruction training, lead problem solving, and back fill in
team members' (TMs’) absence. A team leader may have 4-8 followers, or TMs. The group
leader is one level above the team leader and he/she may have 4 or more team leaders
working under him/her. In addition to problem solving, the group leader is also responsible
for performance analysis of the group. The assistant manager is one level higher than the
group leader and he/she may have few group leaders working under him/her. Very much
like the group leader, the assistant manager oversees the performance of several groups, or
an area. Lastly, a manager is on the highest level and he/she may have few assistant
managers working under him/her.
Figure 8. Roles in True Lean Operations Environment [3]
38
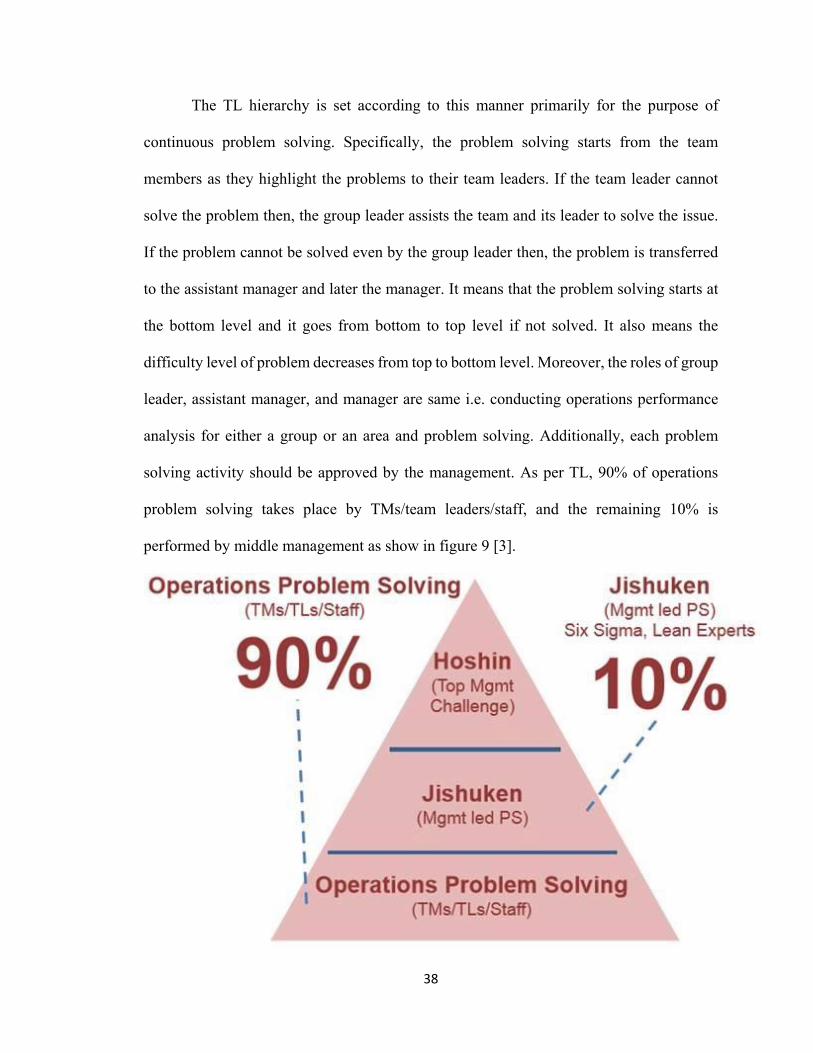
The TL hierarchy is set according to this manner primarily for the purpose of
continuous problem solving. Specifically, the problem solving starts from the team
members as they highlight the problems to their team leaders. If the team leader cannot
solve the problem then, the group leader assists the team and its leader to solve the issue.
If the problem cannot be solved even by the group leader then, the problem is transferred
to the assistant manager and later the manager. It means that the problem solving starts at
the bottom level and it goes from bottom to top level if not solved. It also means the
difficulty level of problem decreases from top to bottom level. Moreover, the roles of group
leader, assistant manager, and manager are same i.e. conducting operations performance
analysis for either a group or an area and problem solving. Additionally, each problem
solving activity should be approved by the management. As per TL, 90% of operations
problem solving takes place by TMs/team leaders/staff, and the remaining 10% is
performed by middle management as show in figure 9 [3].

39
Figure 9. Percentages of PS activities at different levels in an organization [3]
Lastly, to successfully accomplish all of the above six condition, the consistent
support of management is required. To do so, management needs to know the visual status
of the system at any given time using key production indicators (KPIs) for this purpose, as
discussed in the TL Tools aspect. Additionally, management is responsible for creating an
environment of trust among all employees in order to encourage them to identify problems
without the fear of finger pointing or blame. In the TL management’s eyes, both results
and processes are equally important; as a result, the management also rewards employees
for both better results and processes. This increases the awareness among team members
towards both processes and result, and they are likely to work towards improving both by
taking prompt actions while thinking outside the box [8]. Conclusively, the third aspect
represents an ideal TLOE that is based on the core values (principles and philosophies) of
TL, the TL culture, and the engagement of all members from bottom to the top of the
organization's hierarchy.
3.4 Fourth Aspect of TL: Tools and Terminologies
The fourth aspect of TL represents TL tools and terminologies. These tools are also
well known as lean tools and terminology; however, because this thesis is focused on TL,
these tools are represented here as TL tools. Organizations often focus on this aspect as
their first priority, investing great effort and time only in completely adapting TL tools; in
return, neglecting or giving partial importance to the other aspects of TL. The reason for
this phenomenon is that TL tools are capable of assisting organizations in reducing waste
and costs, while increasing profit. Consequently, this aspect is the focus of and has gotten
a great deal of attention from organizations seeking a lean transformation. However, this

40
temptation has become one of the main reasons behind the lean transformation failure.
Simply tools are not enough to go through a lean or TL transformation – companies should
adapt all the four aspects for establishing a TL culture and operations environment by
utilizing TL principles, philosophies, tools and terminologies.
Presented below are the most widely adapted and used TL tools and terminologies.
Hence, this is a shortened version of the actual TL tools and terminologies, and should be
taught to a MS before applying the PDCA model.
5S (Sort, Straighten/Set in order, Shine, Standardize, Sustain):
Hiroyuki Hirano said that "factories are like people- they sweat and get dirty.
People deal with this problem by bathing", however, cleaning factories is a separate
question. As a result, the 5S tool is presented as a potential answer. [44]. 5S is a systematic
approach for eliminating waste and inefficiencies that results from poorly organized work
areas through better and more disciplined housekeeping. The term is derived from five
Japanese words that start with "s"- seiri, seiton, seiso, seiketsu, and shitsuke [3]. In English,
these terms are known as sort, straighten/set in order, shine, standardize and sustain. Sort
refers to separating necessary items from unnecessary using a Red Tag Strategy, or by
placing red tags on unnecessary items and then removing them from the manufacturing
environment. Straighten, or set in order, identifies and organizes everything by putting it
in its allocated location. Shine is a routine cleanup or sweeping activity, and standardize
represents the method utilized for maintaining the first three 5S. Lastly, sustain means the
discipline of routinely following the standardized methods [3]. In like manner, a mnemonic
CANDO is also used to represent these terms and stands for cleanup, arrange, neatness,
discipline, and ongoing improvement [3]. Furthermore, 5S allows team members to have

41
self-control of their work environment. Nonetheless, support from management is required
for successful adaptation as is the case with all of the tools.
Heijunka:
This is a Japanese term and a process for scheduling production or leveling the
workload. It works by enabling a flow of small-batch manufacturing, which reduces the
variations in parts consumption at workstations; thereby, leveling the workload. For
example, take a company has a monthly demand for 80 type A, 40 type B, and 40 type C
products, and works 20 days a month, 8 hours a day. Based on this data, the optimum mixed
model of product mixes that the company can produce is 4 type A, 2 type B, and 2 type C
products everyday in a sequence of ABAC. Thus, Heijunka provides higher flexibility, on
time delivery, predictability, and overtime savings [45].
Hoshin Kanri:
This is another Japanese term which means policy deployment. It ensures that
company's goals, middle management plans and team members working on shop floor are
pulling in the same direction at the same time [46].
Jidoka:
This is one of the two pillars of Toyota house under which a variety of different
tools fall such as Poka Yoke and andon. Jidoka is a Japanese term meaning automation
with a human touch, or giving human intelligence to machines [3]. By using this concept,
machines are designed to detect abnormal situations (problems) and to stop automatically
when any abnormality takes place to avoid the production of defective products. Whenever
a machine stops due to any error or abnormality, a lighting signal notifies a responsible
member to come and see the problem. From here, the 8 step problem solving tool can be

42
applied. Additionally, the machine can have the capability to inform that it has completed
its task as well, working similar to a timer.
Andon:
This is an alarming or signaling process used to highlight abnormalities to team
members and leaders. So, when an abnormality occurs, either the team member or the
machine will signal the problem and its location to leaders on screen or in the form of light
or sound [43].
Kanban:
This is a Japanese term which means visual cards. Kanban cards are used as an
effective source of communication among team members to build and move materials [3].
In other words, these signal cards are capable of controlling material flow in a supply chain.
A kanban card consists of information such as part/product name, from/to location, number
of cards, quantity, picture, note, barcode, etc. In addition, there are three types of kanbans:
withdrawal, production, and signal kanban. Withdrawal kanban inform when material
needs to be in the production line, production kanban inform what part needs to be
processed, and signal kanban informs the requirement of changeover [3].
Takt time (TT):
It is the ratio of total time available and total customer demand. Its main purpose is
to identify the pace of production to meet both internal and external customer demand [3].
TT also determines the maximum time limit or cycle time (CT) of each work station. For
example, if a company has a demand of 120 bouquets and the available time is 240 minutes,
then the takt time will be 2 minutes per bouquet. This tool is also integrated in various other
lean tools such as standardized work sheet and value stream mapping.
43
Poka Yoke:
It is a Japanese term which means error proofing. It is used to eliminate safety issues
and the production of defective parts or products [3]. There are two types of Poka Yoke
systems: warning system and control system. A warning system sends a signal to a team
member and a team leader that the work has deviated from its standard; whereas, a control
system stops the machine or line whenever abnormal work is identified [19, 47].
Standardized Work Chart:
As per TL, standardized work chart is a “written, current best method for safe and
efficient work that meets the required quality and provides the standard for continuous
improvement” [3]. Its elements are: TT; work in process and safety symbols; process
sequence layout; work elements; and CT. Moreover, it is helpful for problem identification,
real-time status of products, and builds respect for customers in the form of on time delivery
of quality products [3].
OEE:
OEE stands for Overall Equipment Effectiveness, which is a tool to measure
efficiency and effectiveness of a process. There are two formulas used to measure it [48]:
first, 𝐎𝐎𝐎𝐎𝐎𝐎
= 𝐀𝐀𝐀𝐀𝐀𝐀𝐀𝐀𝐀𝐀𝐀𝐀𝐀𝐀𝐀𝐀𝐀𝐀𝐀𝐀𝐀𝐀𝐀𝐀 × 𝐏𝐏𝐏𝐏𝐏𝐏𝐏𝐏𝐏𝐏𝐏𝐏𝐏𝐏𝐀𝐀𝐏𝐏𝐏𝐏𝐏𝐏 × 𝐐𝐐𝐐𝐐𝐀𝐀𝐀𝐀𝐀𝐀𝐀𝐀𝐀𝐀
(1)
second, 𝐎𝐎𝐎𝐎𝐎𝐎 =
𝐆𝐆𝐏𝐏𝐏𝐏𝐆𝐆 𝐔𝐔𝐏𝐏𝐀𝐀𝐀𝐀𝐔𝐔 × 𝐂𝐂𝐀𝐀𝐏𝐏𝐀𝐀𝐏𝐏 𝐀𝐀𝐀𝐀𝐏𝐏𝐏𝐏 𝐏𝐏𝐀𝐀𝐀𝐀𝐏𝐏𝐏𝐏𝐏𝐏𝐆𝐆 𝐏𝐏𝐏𝐏𝐏𝐏𝐆𝐆𝐐𝐐𝐏𝐏𝐀𝐀𝐀𝐀𝐏𝐏𝐏𝐏 𝐀𝐀𝐀𝐀𝐏𝐏𝐏𝐏
(2)
For example, a company's shift length is 480 minutes including 60 minutes of
break. It has a customer demand of 420 units or products per shift. Meaning, in one shift,
the company needs to produce 420 products, and the cycle time to produce each product is

44
1 minute. During the shift, a machine was down for 10 minutes and there were 10 defective
products generated at the end of the shift out of 420 total products.
Therefore, OEE for this shift is:
OEE =((420 − 10) ∗ 1)
(480 − 60)= 0.9762 = 97.62%
OEE is capable of assisting leaders to find opportunities of improvement in the
production cycle and can track the improvements of any process [48].
TPM:
TPM stands for Total Productive Maintenance which means proactive and
preventative maintenance of equipment to increase their operational time [49]. As per TL,
this maintenance is necessary to allow equipment to support stable processes and to achieve
various production plans by avoiding breakdowns, small stops, accidents, and defects [3].
TPM's foundation is 5S and it consists of eight pillar autonomous maintenance, planned
maintenance, quality integration, focused improvement, early equipment management,
training and education, SHE (safety, health, and environment), and TPM in administration
[3].
VSM or M&I:
VSM stands for Value Stream Map. Here, value means the requirement of
customers, and value stream means all the action taking place from end-to-end to convert
input into output. VSM is also known as an M&I flow chart, or a Material and Information
flow chart [3]. Therefore, the VSM is a tool used for visualizing the value stream,
identifying and eliminating waste. It is further capable of visualizing an entire supply
chain's material and information flow. VSM has two states, current state and future state.
Current state VSM is the visual representation of existing value stream with highlighted

45
problems or opportunities for improvements. As a result, the future state VSM is a desired
or improved state of the current state VSM.
Continuous Flow:
Continuous flow manufacturing is also called one-piece flow because only one unit
is processed at a time based on kanban instructions. Such a production provides flexibility
and is exactly opposite to a batch production [3]. In continuous flow, materials or work in
process (WIP) flows smoothly through production with minimum or no buffers between
each operation. It assists in reducing waste such as transport, inventory, and waiting.
Process time measurement sheet:
This tool is also known as time measuring sheet. Leaders use this tool to determine
and track the real cycle time of the processes [3]. Process time measurement sheet plays a
very important role in establishing the standards and stability during at TL transformation.
It further serves to easily highlight the specific work element that needs to be improved in
an operation.
Yamazumi chart:
This is a Japanese term for what is known as a line balancing chart [3]. It is a very
useful tool designed to access and allocate equal job load across work stations. To do so, it
requires the CT of each team member in the production line, the TT, and examination of
operations and utilization of resources for rebalancing the chart. This tool is crucial for
setting up a continuous flow in a shop floor.
Waste/5S/VM sheet:
This sheet is a tool used by teams to identify and note down types of wastes, 5S and
visual management (VM) activities that are required in the production line or plant [3].

46
KPI:
As mentioned previously, KPI stands for Key Performance Indicators. KPI is a
measurement tool used to track and evaluate the performance of organizations towards key
targets [3]. Generally, leaders develop KPI reports to have discussions during leadership
meetings to solve bigger problems related to cost, lead time, or quality. As per TL, there
are two types of KPIs - Process KPIs and Result KPIs. Process KPIs are focused on the
operation elements that lead to results, and Result KPIs are focused on the outcomes of the
processes [3].
SMED:
SMED stands for Single Minute Exchange of Die [3]. As per TL, SMED is method
designed to reduce the setup time or changeover time to under ten minutes. This method is
really beneficial for companies because it reduces the lead time, cost and provides
flexibility in production [3].
Kaizen:
This is a Japanese term which means continuous improvement [3]. It is the ceiling
of the Toyota house as shown in Figure 1. In addition, it relies on team members who are
responsible for highlighting the problems on the shop floor and team leaders who perform
problem solving activities.
8 Step Problem-Solving- This is a systematic and effective problem-solving tool
that consist of eight steps and is used to eliminated waste and to improve customer
satisfaction [8]. Also, this approach follows PDCA (plan, do, check, and act) model for
continuous improvement [3]. The details of this tool have been previously provided in the
third aspect of TL.
47
Chapter 4
Application of True Lean in TSPC, a MS (Case Study)
To apply, TL in a startup, initially the MS was assessed to ensure that it met the
requirements of being a startup. This included items like ensuring that the company had
identified a value proposition, viable product(s), customers, market size and a strategy to
target the market. Below, a background on the MS is presented. The details of the
company’s value proposition, functional product prototype, product market, potential
customers and customer demand forecast are also presented.
Company’s background:
TSPC, LLC is a start-up company that was established to bring clean food to the
table by reducing the use of synthetic and copper-based pesticides. Presently, the
widespread use and exposure to synthetic pesticides is leading to serious health concerns,
groundwater contamination, and negative environmental impacts globally [50]. Even
organic products, which are seen by consumers as an alternative to synthetic pesticides are
sprayed with copper-based pesticides. These copper pesticides are leading to both inflated
prices (since they have to be sprayed on average 3.5 times more than synthetic [51], and
soil poisoning, endangering many insect and plant species [52]. Thus, TSPC was formed
to meet the need for wholesome agricultural products that reduce the pesticide footprint on
society and the environment, especially as demand for clean produce grows. Also, it must
be noted that before applying PDCA model, the MS fulfilled of the five prerequisites as
described in below sections.

48
4.1. Value Proposition:
TSPC’s value proposition is to bring clean food to the table by reducing the use of
synthetic and copper-based pesticides. The company accomplishes this by manufacturing
completely natural, non-synthetic WiseEarth™ Pest Repellent and WiseEarth™ Soil
Additive products that are safe to use and biodegradable. These products are extracted from
natural oils present in various wood and agricultural residue species. Consequently, TSPC
meets the growing consumer demand for all-natural agricultural products while ensuring
health and environmental safety, along competitive prices.
4.2. Functional Product Prototype:
TSPC was launched in December 2016 and began manufacturing operations of their
product prototypes in Fall 2017 on lab-scale. During this time, TSPC generated the
WiseEarth™ products, and the products were initially tested on small-scale agricultural
applications, providing positive preliminary results of repellent activity on soil nematodes
for WiseEarth™ Pest Repellent and longer water retention times using WiseEarth™ Soil
Additive. However, since the soil additive is a byproduct of the pest repellent and was not
generated in large quantities to be marketed easily, the company’s leaders decided to sell
the WiseEarth™ Soil Additive to potential competitors in the soil care market.
4.3. Product Market:
TSPC’s market for WiseEarth™ Pest Repellent product lies in food crop
production, specifically focusing on pesticides and insect repellents to produce clean,
natural food. The company’s consumers are farmers interested in growing natural,
wholesome food, free of synthetic chemicals. The farmers are local small or medium scale
currently. Small-scale refers to those growing vegetables and fruits (or ever plant or

49
flowers) in pots on approximately 10 sq. ft land in their backyard. Medium-scale refers to
farmers who plant larger than 10 sq. ft but less than 100 sq. ft
The overall U.S. insecticide market represents $3 billion, with $396 million
attributed to small home gardeners and the remainder to the other commercial scale
farmers, exports, livestock, and dairy sectors. The commercial scale agriculture sector has
a high barrier to entry, controlled by six giants, Dow, DuPont, Bayer, Monsanto,
ChemChina, and Syngenta, supplying the industrial pesticide market. Due to this barrier,
the small-to-medium scale home gardener market is preferred for an agricultural startup.
In fact, TSPC’s interviews with potential customers and professionals in the agricultural
and horticulture fields have indicated the minimal barrier to entry for the home gardening
sector and that a natural, safe pest management product will be well received. Hence, the
small-to-medium grower market, which is focused on clean produce is a relatively open
market with limited established non-synthetic insect pest management products, this
provides the footing that TSPC needs to be successful in its development and sales of
WiseEarth™ Pest Repellent and WiseEarth™ Soil Additive.
4.4. Potential Customers and Customer Demand Forecast:
Since, the WiseEarth™ products requires registration in each state before sale,
TSPC aims to reach target customers via a steady expansion from western Kentucky (the
location of the company), utilizing an effective sales and marketing team, including online
marketing through social media and a company website. The first-year will focus on
serving the Jackson Purchase and western regions of Kentucky through sales at local home
gardening shops, and farmers markets. The following year, additional sales and marketing
experts will be hired to target the remaining regions of Kentucky in a similar manner, while

50
applying for registrations for neighboring states. As the company grows, it will expand to
neighboring states and retail home gardening stores, including Walmart, Home Depot,
Lowes, Tractor Supply, Menards, Star Hollow Farms, Field Day Family Farm, Bon Vivant,
Moore Farms & Friends and Red Hills. At this phase, it will expand online sales through
Amazon and eBay. After successful penetration of the home gardening market in retail and
neighboring states, the company will apply for registration and expand to the Southeast
U.S. farming regions, followed by a national expansion. At this time, the company will
outsource distribution of online sales to Amazon Fulfillment Services, managing
distribution of retail sales via biweekly and monthly orders. By targeting both the online
and retail shopping communities, TSPC is likely to reach all of the various types of
agriculture and horticulture consumers for the WiseEarth™ product line. An overview of
the strategy is provided in figure 10.
Figure 10. TSPC target market based on geographical markets.
TSPC further analyzed the customer forecast, based on the number of products that
will be purchased each year for the first three years of the startup. This was determined by

51
analyzing and taking a small fraction of the number of home gardeners present in the
Western Kentucky, entire Kentucky and neighboring states. The company reported that in
their startup years, they would be able to sell approximately 20,790 product bottles in their
first year to the Western Kentucky market; 117,250 bottles in their second year to farmers
throughout Kentucky; and 286,782 bottles in their third year to farmers in Kentucky along
with neighboring states.
4.5. True Lean Training
While the MS team was meeting the five requisites, an introduction to TL was given
to the members of the startup. At this stage, only the two co-founders (leaders) of the
company and three TMs existed as the company was still in the research and development
phase. Hence, weekly meetings were scheduled with TSPC team to educate and discuss
this project. Also, appropriate presentations were given, handouts were provided, and
discussions were engaged throughout this process. All the individuals were provided
personal files to maintain the material provided and to record the project work. It is
noteworthy to mention that leaders personally encouraged TMs to take the TL
transformation seriously for personal knowledge and to assist the company in moving
onward. As a result, leaders were present at all the trainings with the TMs.
During the introductory stages, background on what constitutes TL and the 8 types
of waste, exampled by Toyota Production system were provided. Next, the four phases of
TL were discussed, and as the members' knowledge of TL increased, the PDCA model was
conducted to implement TL and determine optimum production plan for transitioning to a
manufacturing stage from research and development.
52
Phase 1:
To introduce the first phase of TL to the MS team, two meetings were carried out.
In this phase, first, the three core philosophies and five core principles of true lean were
discussed. The introduction for this phase was taken from the relevant details provided in
methodology. For example, one of the principles covered in the meetings was respect.
Here, it was highlighted that employees should lead through shared values, equal
opportunities, mentorship, cooperation, support and sound judgement, rather than
dominance. In addition, it was also explained that this phase represents the majority of TL
thinking, and it can assist the company to move towards success and establish TL culture.
Phase 2:
This phase of TL represents the TL culture and is primarily based on the first phase
of TL. The education of this phase also took 2-3 meetings. The topics that were covered in
this phase included, what is culture, what is TL culture, and how to establish and sustain
TL culture. For instance, culture is seen as company's behavior and practices towards its
expectations. However, to establish TL culture, all the employees need to tailor their
behavior and practices around TL principles and practices. This encompasses the adaption
of TL principles and philosophies by upper management and should always be
demonstrated in their behavior, motivating middle management team and the shop floor
members to do the same. Also, it was taught that TL culture requires all the members to
live the problem-solving activity every day on the plant or shop floor. Consequently,
members should be actively analyzing their tasks to identify problems and solutions to
make the work flow smoother. Conclusively, the MS team was requested to start working
towards a TL culture at the end of this phase's discussion, and it was informed to them that

53
their behavior will be observed from this point onward until the completion of the case
study to complete a TL assessment required for the PDCA model.
Phase 3:
The third phase of TL represents the TL operations environment. During this phase,
the seven conditions of the TLOE were introduced in a time period of 2-3 meetings. The
goal of this phase was to understand and determine the ideal operations environment based
on a TL culture for TSPC. Thus, at the end of this phase's introduction, a discussion was
carried out to decide how TSPC's operations environment should look like. Subsequently,
TSPC decided to meet the forecasted customer demand to satisfy customers. It was further
decided that the startup team will utilize the remaining conditions of TLOE- systematic
problem solving, abnormality management, standard processes, clear roles, engaged staff,
and management support culture to create a TLOE from the early stage of production,
which will be detailed in the PDCA model.
Phase 4:
The last phase of TL represents tools and terminologies. During this phase, most of
the common tools and terminologies were discussed as shown in the methodology. After
assessing the company's goals, tools such as M&I, cycle time, takt time, and cellular
manufacturing layouts were chosen by the MS team to meet customer satisfaction, produce
good quality products at low cost in the allotted time.
4.6. PDCA Model for Applying Four Aspects of TL
Demonstrating TL Thinking and Actions through TSPC’s behaviors
As discussed previously, the PDCA model is founded on the four aspects of TL that
were introduced to the company. Hence, the TMs and leaders of TSPC followed the TL
54
principles and began living the TL philosophies, in order to start establishing a TL culture
within the organization. For instance, they worked as a team to collect the necessary data
required for planning the TLOE and utilized TL tools within it to successfully outline the
manufacturing operations. The detailed purposes of the organization were customer
satisfaction, efficient operations, maintaining TL culture, and generating clear roles and
responsibilities among TMs to effectively grow as a TL-MS. Here, the behaviors of the
team are discussed to validate that they understood and followed TL thinking before
discussing the PDCA process.
First, the team demonstrated a strong understanding of TL principles and
philosophies by first valuing both respect within the organization and for its customers.
The end-user, or the gardening consumers were the focal point of the company's entire
decision-making process. This was relatively clear for the company, since it was not
generating any revenue and had not yet invested capital in the production phase. Thus, a
thorough market analysis was conducted to identify the needs of gardeners, where they are
located, what and how much do they farm, and what qualities they desired in pest
repellents. Utilizing this information, the WiseEarth™ product line was developed, along
with the quantity of products needed per year for the first three years of the company's
growth. Next, a strong mutual respect for all individuals and for the success of the
organization was woven throughout the five members, especially considering that all of
them were simply volunteers within the organization, not benefiting from any financial
gain. The two co-founders and three TMs met every week to discuss and establish TL,
either via an online platform or in person. During these meetings, respect was shown to all
individuals in the form of being on time for the meetings, not procrastinating on the work

55
assigned, equally rewarding everyone when achieving organization milestones, and by
taking setbacks as a whole company rather than blaming on a single individual. TSPC
utilized all four phases of TL by continuously challenging and helping each other to
improve in the tasks they performed. Consequently, TMs demonstrated great trust in the
co-founders, or the leaders.
As previously stated, after understanding the term genchi genbutsu, the TSPC team
established a gemba where weekly meetings were held, and the TMs added value to the
company by taking ownership of projects and completing them on time. During the times
when value was being added at gemba by the TMs, the TSPC leaders were also present to
support TMs in their work. This resulted in a great work environment based on teamwork,
which was maintained throughout the development stages of the organization. Leaders
mentored TMs in their tasks or assignments and provided support in the work they did,
instead of being dominant and bossy on what needs to be done when and how. They, too,
equally distributed the workload and performed the mundane tasks. Leaders provided
targets and goals for the company, but the approach to reach those targets were defined by
TMs. Team members were responsible for determining the market demand, an optimized
manufacturing layout and calculating the financial pro forma, respectively. Meanwhile, the
co-founders led research and development in a university lab setting, prepared pitch
presentations, executive summaries, applied for grants and assisted the members in their
tasks. For example, leaders did not dominate the approach taken by TMs to collect
necessary data, rather, encouraged TMs to come up with a plan and how to execute it, while
providing feedback on ways to improve the techniques, when possible. In return, the MS

56
created a safe and learning environment and shared all the improvement ideas among the
company without the fear of blame, ridicule and finger pointing.
Next, minimization of non-value-added activities, including the 8 types of waste
were an active goal of the company. The primary reason for this was the lack of capital to
invest in wasteful activities, especially when the organization was in the fundraising stage.
During the PDCA cycle, the organization optimally reduced waste generation of raw
materials and products by aiming to reduce overproduction and inventory. The
manufacturing layout was also according to a cellular approach, where a "U" shaped was
utilized to minimize transportation waste. The TT and standard CTs were also determined
to reduce waiting in the production line, and the reactor, condenser and mixing times were
carefully tested in the lab to avoid overprocessing. In like manner, the human potential
required for production was not wasted by diligently discussing and calculating the number
of labors required during each year's operation. The only two waste that were not yet
applicable to the company include, reduction of motion and quality defects. The reason
being that the company is not yet a physical manufacturing facility to where motion can be
maintained, or where defects can be generated with an operating production line.
Nonetheless, during the weekly meetings, the team members discussed where and when
the reduction of these waste would be possible in the upcoming stages of the organization.
A spirit of challenge was also observed within the organization as the members
gathered the necessary data for the PDCA, conducted lab trials and pitched their business
strategy at various fundraising venture competitions. Often, the data was not easily
accessible online and had to be researched by calling farmers co-ops, or by speaking to
mutual contacts that were farmers. The lab trials varied based on raw feedstock until a

57
desired feedstock was identified and the team moreover had several setbacks at venture
competitions due to the complexity of the product chemistry. Nonetheless, none of the
members grew a disheartened attitude towards the MS and continued to modify their
approach to perform better over time in the venture competitions, winning five
competitions that generated approximately $3,000 of startup capital.
Therefore, as can be gathered from the aforementioned activities and behaviors, the
TSPC team truly worked towards the development of a TL culture. The TL principles and
practices were followed diligently by putting customers first, valuing respect, reducing
waste, building an environment of teamwork and by living out the spirit of challenge.
Leadership modeled these behaviors, leading by example. TMs followed in the co-
founders' footsteps by being engaged in the work processes and contributing to the
development of the MS via their individual projects. The only part that was difficult to
implement was the 8 step problem solving approach and continuous improvement. This is
again a consequence of the lack of a physical manufacturing organization. Albeit, the
members were taught this concept and have committed to following it during the
production stage.
In the third phase of TL, the knowledge of TLOE was applied in order to determine
the ideal manufacturing operations, as depicted in the "Plan" part of the PDCA model. The
seven conditions of TLOE were also considered a core motivation in the development of
this strategy. Specifically, customer's satisfaction was a priority, the staff, i.e. TSPC team,
was engaged in the planning and development of the MS, clear roles were identified for
each member to achieve milestones, and management supported the TL culture while
determining the standardized workflow to obtain stability via the PDCA. The most latter

58
part is used to ensure that abnormality management takes place within the organization,
and stable operating conditions are known from the start to ensure that problems do not
arise frequently in meeting customer demand.
Lastly, the PDCA model also required the application of various TL tools to
develop a TLOE. The tools heavily employed by the TSPC team include M&I flow chart,
CT, TT, kanban cards, cellular manufacturing layout, and production capacity sheets. The
application of these tools is described in the following PDCA section, where the "Plan"
part encompasses the aforementioned team's knowledge, adaptation and behaviors
associated with the four aspects of TL to detail a TL based manufacturing blueprint.
Conclusively, these activities assisted in visualizing the future state of the company.
Plan (Cycle 1):
The purpose of Plan is to implement TL in a MS by following three steps. First,
follow TL principles and philosophies; second, live lean leadership and problem solving to
establish a TL culture; and third, utilize TL tools while following the previous two steps to
generate an efficient MS production strategy and create a TLOE. The TSPC companied
followed the first two steps of this Plan as previously discussed in section 4.6. The
information below highlights how the company utilized TL tools to generate a viable
production strategy.
To start, TSPC team initially produced products on a lab-scale. During this lab-
scale production, process flow sequence was determined and visualized as simplistic
operations, shown in Figure 11. This sequence was also used to create a M&I flow chart,
and to ensure all the members understood it easily. In addition, batch size was determined
by using the forecasted demand of the first year and the processing time of each operation
59
was determined by analyzing lab-scale operations. Later on, the number of human
resources, land requirement, supply of raw materials, and production capacity were
determined, and a M&I flow chart was created based on the forecasted customer demand.
It is important to note here that the “1” next to “Plan” refers to the first cycle of PDCA.
In detail, Figure 11 depicts the ideal process of TSPC's manufacturing plant. First,
a weekly supply of raw materials such as biomass, bottles, and boxes for packaging
products are ordered from suppliers to fulfill weekly demands. The biomass is fed into the
reactor, where it is converted into gases and then condensed in a shell-and-tube condenser
to fulfill daily demand. Afterwards, the condensed organic chemical, or the natural
chemicals present within the biomass that have been extracted, are separated into two
containers. One container is diluted with water and the other is not; but, both are mixed
with the company’s trade secret, an efficacy enhancer. Once, the concentrated and diluted
chemicals are ready, they are filled in bottles and packed in boxes (containing 14 bottles
each). In addition, the byproduct of the reactor is a soil additive similar in appearance to
charcoal. It is passed through a screw conveyor and boxed in 1 cubic foot boxes, holding
ten pounds of soil additive per box.

60
Figure 11. Process flow sequence.
Furthermore, as per the TSPC's market analysis, it was concluded that the
WiseEarth™ Pest Repellent product should be sold on a diluted and concentrated form for
small-scale and medium-scale farmers, respectively. As a result, three products were
generated – WiseEarth™ 16 oz Diluted Pest Repellent, WiseEarth™ 16 oz Concentrated
Pest Repellent and WiseEarth™ Soil Additive. However, since the soil additive product
was generated as a byproduct, it was intended to be sold to directly to competitors in
whatever quantity obtained, as mentioned previously. Thus, the co-owners of TSPC shifted
their focus from all three products to just the WiseEarth™ Pest Repellent line.
Moreover, it is important to notice that the concentrated and diluted WiseEarth™
Pest Repellents are chemicals and can only be produced in batches due to the limitations
or constraints of the chemical equipment available. It is simply too expensive to

61
manufacture one bottle of WiseEarth™ products at a time. Due to this reason, the CT for
each process is gathered in terms of hours per batch (see Table 1), instead of seconds per
product. These CTs, or time data, were gather by actually running the reactor on a lab scale
and by utilizing industrial experience gathered from a chemical packaging company. This
table was also used to establish a one batch flow system in the production; meaning, the
company will produce one batch at a time based on customer demand. Also, the team
decided not to store over one days of inventory of finished products. This planning was
performed to avoid overproduction or the push system in the operations environment.
Table 1. Cycle time for each operation per batch
Operations Activity Cycle time (hours/batch) Reactor 4.000
Mixing 0.330
Bottle Filling 1.575
Bottle Packing 1.350
Screw conveyor 0.25
Soil additive packing 0.2
Furthermore, to meet the first year’s forecasted customer demand, TSPC team also
specified the number of product bottles required. The forecasted demand for the first year
was 20,790 bottles, of which 770 were concentrated pest repellent product. During this
year, the team decided to only operate for 11 weeks as the MS needed to dedicate the
remainder of the year to fundraising activities and set up manufacturing facility operations.
In order to produce 20,790 products in 11 weeks, the company needs to meet the least or
targeted productivity rate. This can be calculated according to Equation 3 and can be
defined as the batch size of the reactor. The resulting batch size was 378 bottles/batch. This
information was vital, because it allowed the company to target the TT, as shown in

62
Equation 4, and determine the required sizes for the reactor and condenser unit. The TT
was further applied in the VSM model for each manufacturing unit. The CTs, process flow
sequence, forecasted demand, and total available time were used to create M&I chart as
shown in the figure 12.
𝐓𝐓𝐀𝐀𝐏𝐏𝐓𝐓𝐀𝐀𝐀𝐀𝐏𝐏𝐆𝐆 𝐏𝐏𝐏𝐏 𝐀𝐀𝐏𝐏𝐀𝐀𝐔𝐔𝐀𝐀 𝐩𝐩𝐏𝐏𝐏𝐏𝐆𝐆𝐐𝐐𝐏𝐏𝐀𝐀𝐀𝐀𝐀𝐀𝐀𝐀𝐀𝐀𝐀𝐀 𝐏𝐏𝐀𝐀𝐀𝐀𝐏𝐏 =(𝐍𝐍𝐐𝐐𝐏𝐏𝐀𝐀𝐏𝐏𝐏𝐏 𝐏𝐏𝐏𝐏 𝐩𝐩𝐏𝐏𝐏𝐏𝐆𝐆𝐐𝐐𝐏𝐏𝐀𝐀𝐔𝐔) 𝐓𝐓𝐏𝐏𝐀𝐀𝐀𝐀𝐀𝐀 𝐀𝐀𝐀𝐀𝐀𝐀𝐀𝐀𝐀𝐀𝐀𝐀𝐀𝐀𝐀𝐀𝐏𝐏 𝐀𝐀𝐀𝐀𝐏𝐏𝐏𝐏
(3)
Total available time = 11 weeks x 5 daysweek
x 8 hoursday
= 440 hours
Number of products = 20790 = (770 concentrated + 20020 diluted)
𝐓𝐓𝐀𝐀𝐏𝐏𝐓𝐓𝐏𝐏𝐀𝐀𝐏𝐏𝐆𝐆 𝐏𝐏𝐏𝐏 𝐀𝐀𝐏𝐏𝐀𝐀𝐔𝐔𝐀𝐀 𝐩𝐩𝐏𝐏𝐏𝐏𝐆𝐆𝐐𝐐𝐏𝐏𝐀𝐀𝐀𝐀𝐀𝐀𝐀𝐀𝐀𝐀𝐀𝐀 𝐏𝐏𝐀𝐀𝐀𝐀𝐏𝐏 =𝟕𝟕𝟕𝟕𝟕𝟕𝟒𝟒𝟒𝟒𝟕𝟕
+𝟐𝟐𝟕𝟕𝟕𝟕𝟐𝟐𝟕𝟕𝟒𝟒𝟒𝟒𝟕𝟕
= 14conentrated unitsday (or 8 hours)
+ 364diluted units
day (or 8 hours)= 378 units/day
𝐓𝐓𝐀𝐀𝐓𝐓𝐀𝐀 𝐀𝐀𝐀𝐀𝐏𝐏𝐏𝐏 =𝐀𝐀𝐀𝐀𝐀𝐀𝐀𝐀𝐀𝐀𝐀𝐀𝐀𝐀𝐀𝐀𝐏𝐏 𝐀𝐀𝐀𝐀𝐏𝐏𝐏𝐏 𝐩𝐩𝐏𝐏𝐏𝐏 𝐆𝐆𝐀𝐀𝐀𝐀
𝐓𝐓𝐀𝐀𝐏𝐏𝐓𝐓𝐏𝐏𝐀𝐀𝐏𝐏𝐆𝐆 𝐩𝐩𝐏𝐏𝐏𝐏𝐐𝐐𝐏𝐏𝐀𝐀𝐀𝐀𝐀𝐀𝐀𝐀𝐀𝐀𝐀𝐀 𝐏𝐏𝐀𝐀𝐀𝐀𝐏𝐏 (4)
=8 hours
378 or 1 batch= 8 hours/batch
Next, it can be noticed that the CTs of all the operations in the production line as
shown in Table 1 are less than the TTs, which means that one batch can be produced for
delivery to the customers within 8 hours. The top part of the M&I represents information
flow where company puts weekly orders to the suppliers in the left and receives daily orders
from the retailers in the right. The bottom part of M&I shows the material flow. To establish
pull (or one batch flow), an inventory of one raw batch is kept as a WIP-1 between each
reactor and mixing station. Then, a WIP-2 of one mixed batch is kept between mixing
station and filling station. Afterwards, 14 concentrated and 24 diluted bottles were prepared
from the WIP-2 mixed batch and kept between filling and packaging station. At the end of
63
the line, an inventory of one finished batch is also stored for the customers to fulfill their
demand on time. This scenario represents a setup production line where the company can
fulfill the first condition of TLOE, which is producing quality products at low cost and
delivering them to the customers in the least amount of time. However, since TSPC is not
yet a manufacturing facility (due to the lack of startup capital), the remaining conditions of
TLOE cannot be fulfilled by the team members. Nonetheless, they decided to fulfil them
as soon as a manufacturing facility is built, and continued with the Plan phase of PDCA to
determine required land area, labor and raw feedstock.
Next, the M&I was further employed to calculate the minimum amount of land area
and number of team members required to meet targeted productivity rate. The
manufacturing facility's land area requirement was measured by estimating the land area
required for each workstation/process and inventories as shown in the M&I. Table 2.
represents the land area required for the first year only for all of the stations. In like manner,
Table 3 shows the total land area required to fulfill the first, second, and third year's
forecasted customer demand. These land areas were later drawn in AutoCAD as a
simplistic 2D layout and the land area requirement for the three years projection were
estimated as shown in Figure 13. The operations were laid out in the diagram to depict
work flow sequence in an open square shape. There are three wall boundaries that represent
the land requirement for first (34 x 54.3 sq. feet), second (40 x 54.3 sq. feet) and third (57.9
x 65.3 + 8 x 8 sq. feet) years. In addition, there is a silo of size (8 x 8 sq. feet) outside of
the third year’s land area which will be utilized in the third year for raw feedstock storage.

64
Figure 12. M&I Flow chart for TSPC

65
Table 2. Estimated land areas
Land area in sq. feet Mobile silo 64
Reactor 117
Condenser 32
Mixing station and its output WIP 48
Filling station 25
Output WIP of Filling station 16
Packing station for bottles 48
Screw conveyor 32
Packing station for soil additive 25
Finished goods inventory 50
Inventory for boxes and bottles 64
Figure 13. Land area required

66
Afterwards, the minimum number of employees required were estimated by using
FTE (full time employee) formula, as shown in Equation 5 [53]. It is important to note that
several processes like the reactor, mixing, and screw conveying stations can run parallel to
each other because of automation. As a result, in the following equation, the screw
conveyor cycle time is not mentioned because it runs parallel to the reactor. But, the mixing
cycle time is included to account for any uncertainties within the production line.
𝐅𝐅𝐓𝐓𝐎𝐎 =𝐌𝐌𝐀𝐀𝐌𝐌𝐀𝐀𝐏𝐏𝐐𝐐𝐏𝐏 𝐰𝐰𝐏𝐏𝐏𝐏𝐓𝐓𝐀𝐀𝐏𝐏𝐀𝐀𝐆𝐆 𝐡𝐡𝐏𝐏𝐐𝐐𝐏𝐏𝐔𝐔
𝐰𝐰𝐏𝐏𝐏𝐏𝐓𝐓𝐀𝐀𝐏𝐏𝐓𝐓 𝐡𝐡𝐏𝐏𝐐𝐐𝐏𝐏𝐔𝐔 𝐏𝐏𝐏𝐏 𝐀𝐀𝐏𝐏 𝐏𝐏𝐏𝐏𝐩𝐩𝐀𝐀𝐏𝐏𝐀𝐀𝐏𝐏𝐏𝐏 𝐀𝐀𝐏𝐏 𝐀𝐀 𝐆𝐆𝐀𝐀𝐀𝐀
(3)
FTE =(4 + 0.33 + 1.575 + 1.35 + .2)
8= 1 team member is required
Next, whenever customers pull the finished goods, a production kanban will be
dropped off to the packing station. A TM at the packing station will pull the filled bottles
from its WIP and will send the signal to the filling station to replenish the pulled WIP.
After this, the TM will go to the filling station and pull the mixed chemical batch WIP,
sending the signal to mixing station whenever the mixed chemical runs out. Then, the same
TM will separate and mix the batch; and while the mixing process is going on, the TM will
start another batch in the reactor. Later on, while the reactor is running, the TM will pass
the soil amendment byproduct through the screw conveyor and will pack it. Lastly, after
completing all these steps, the TM will go back to the filling and packing stations if more
demand exists. If this is not the case, the TM can perform 5S activity and observe the
processes to find opportunities to improve performance or update the visual boards to show
the production status and encountered problems. As the company continue to develop,
additional TM can be added throughout the process. Albeit, during the entire process, both
the TMs and leaders are expected to follow all four aspects of TL. That is, TMs will
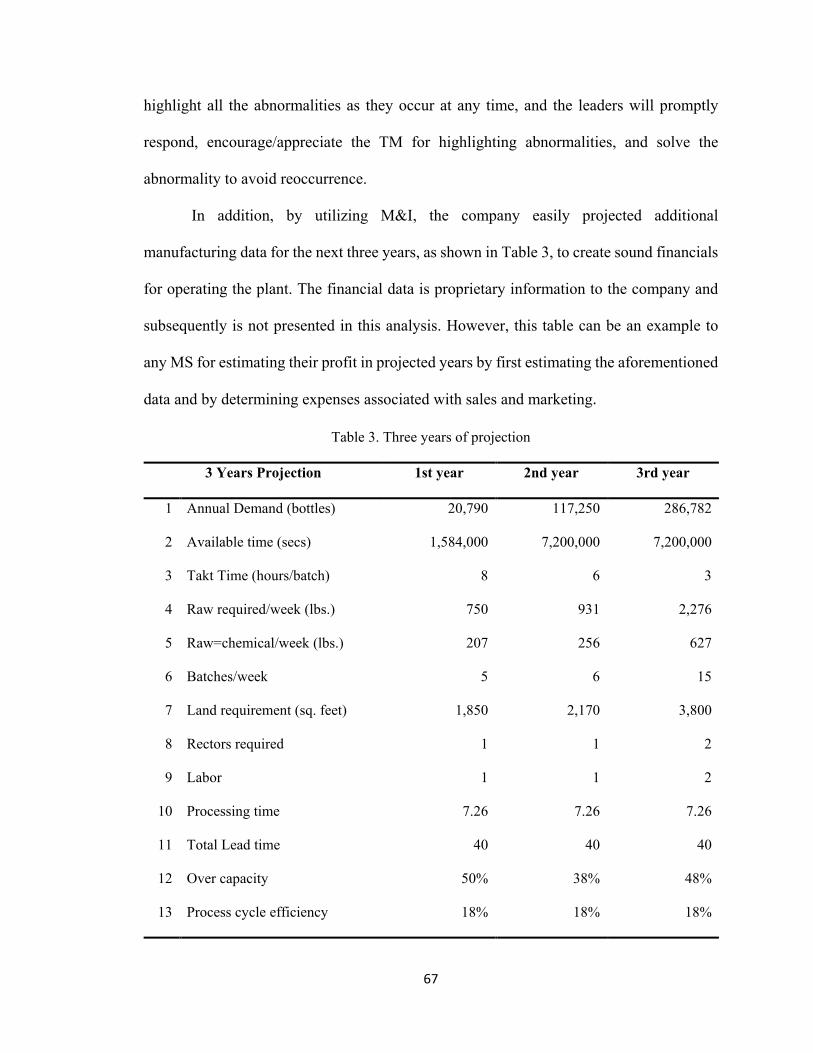
67
highlight all the abnormalities as they occur at any time, and the leaders will promptly
respond, encourage/appreciate the TM for highlighting abnormalities, and solve the
abnormality to avoid reoccurrence.
In addition, by utilizing M&I, the company easily projected additional
manufacturing data for the next three years, as shown in Table 3, to create sound financials
for operating the plant. The financial data is proprietary information to the company and
subsequently is not presented in this analysis. However, this table can be an example to
any MS for estimating their profit in projected years by first estimating the aforementioned
data and by determining expenses associated with sales and marketing.
Table 3. Three years of projection
3 Years Projection 1st year 2nd year 3rd year
1 Annual Demand (bottles) 20,790 117,250 286,782
2 Available time (secs) 1,584,000 7,200,000 7,200,000
3 Takt Time (hours/batch) 8 6 3
4 Raw required/week (lbs.) 750 931 2,276
5 Raw=chemical/week (lbs.) 207 256 627
6 Batches/week 5 6 15
7 Land requirement (sq. feet) 1,850 2,170 3,800
8 Rectors required 1 1 2
9 Labor 1 1 2
10 Processing time 7.26 7.26 7.26
11 Total Lead time 40 40 40
12 Over capacity 50% 38% 48%
13 Process cycle efficiency 18% 18% 18%
68
Conclusively, as can be observed from the table, the company has an over capacity
of 50%, 38%, and 48% in years one, two and three, respectively, to allow for quick
response to excess demand or uncertainties. Plus, the process cycle efficiency for all the
three years are same, but they can be reduced if the weekly supply of raw material can be
reduced to less than 5 days. Finally, it is again noteworthy to mention that this planning is
effective only if the company meets the five assumptions that were made earlier.
Do (Cycle 1):
After obtaining the WiseEarth™ product prototypes, conducting preliminary small-
scale agricultural studies, and creating the three-year projection for TSPC, the company
presented the findings in various innovation and entrepreneurial competitions throughout
Kentucky to raise awareness, brand and receive start-up funding. This process took place
during August 2017 through May 2018.
The company struggled to raise funding for additional product development and
testing due to uncertainty in product chemical composition and active ingredients. As a
result, a pilot-scale manufacturing plant was not developed to launch the products in local
shops in the geographical region of the company. This hindered the company’s steady
growth, and the company is still in the initial phase of planning and learning. Currently, it
is working to validate their business product idea, the business model surrounding it and
determine product compositions by conducting additional research. The research and
development phase of the company is additionally requiring capital for extensive
performance testing of the products and data collection. As soon as these steps are
completed, the company aims to launch pilot-scale production with appropriate marketing
and advertising of the products.
69
Nonetheless, a TL assessment was utilized to measure the success of the
organization towards a TL transformation. This assessment was conducted by the
individual responsible carrying out TL activities within TSPC to assess the behaviors of
the remaining members in following the four aspects of TL.
Additionally, a questionnaire was taken by three of the four members of the
organization (two members could not complete this part) to measure the understanding of
TL aspects. The results of both assessments are presented in the following section.
Check (Cycle 1):
In this state of the PDCA model, two tasks were completed. First, the entire team
of TSPC was requested to take a TL exam generated by LSP, but only three members out
of five were available to take the exam. The purpose of this exam was to measure or get a
close idea of the understanding level of the available members of TSPC. The TL
understanding level depends on how much TMs or the MS knows about all four aspects of
TL. When there is a time constraint to observe members for an extended period of time to
assess their understanding of TL, then, one of the best approaches is to validate via either
an exam, test, or questionnaire. The exam employed in this case study was obtained from
the LSP at UK. It was regarded as proprietary and could not be included in this report;
however, the LSP did allow the results of the exam to be shared visually using graphing
techniques. Hence, the questions of the exam were linked to all the four phases or aspects
of TL and the results obtained from this exam are shown in Figure 13.
AS per Figure 14, the TL exam results depict an average understanding of the first
aspect of TL to be approximately 80%, of the second aspect to be 75%, of the third aspect
to be 80%, and of the four aspect to be approximately 85%.

70
Figure 14. TSPC’s True Lean Exam Results
After the analysis of the TL exam, an assessment was utilized to measure the
success of the TL transformation in TSPC, performed by the designated TL representative
within the organization. This assessment also helped the MS in finding out its strengths
and weaknesses towards TL transformation. This assessment is based on true direct
observations, providing scores on a scale of 1-5, where 1 means never observed, 2 means
rarely observed, 3 means occasionally observed, 4 means frequently observed and 5 means
always observed. However, just like the TL exam, this assessment was generated by the
LSP at UK, allowing the application of the TL assessment for this case study and results to
be assessed, but not for broad dissemination of the actual criteria utilized. Table 4
represents the observations and results from this TL assessment.
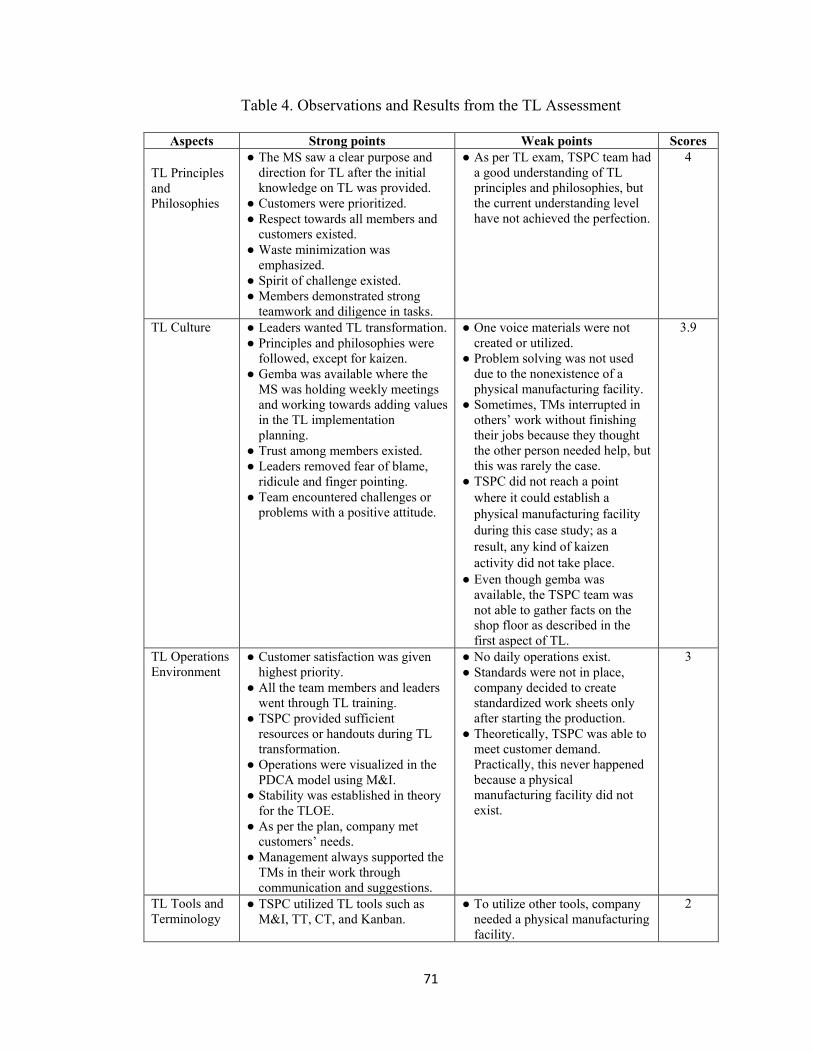
71
Table 4. Observations and Results from the TL Assessment
Aspects Strong points Weak points Scores
TL Principles and Philosophies
● The MS saw a clear purpose and direction for TL after the initial knowledge on TL was provided.
● Customers were prioritized. ● Respect towards all members and
customers existed. ● Waste minimization was
emphasized. ● Spirit of challenge existed. ● Members demonstrated strong
teamwork and diligence in tasks.
● As per TL exam, TSPC team had a good understanding of TL principles and philosophies, but the current understanding level have not achieved the perfection.
4
TL Culture ● Leaders wanted TL transformation. ● Principles and philosophies were
followed, except for kaizen. ● Gemba was available where the
MS was holding weekly meetings and working towards adding values in the TL implementation planning.
● Trust among members existed. ● Leaders removed fear of blame,
ridicule and finger pointing. ● Team encountered challenges or
problems with a positive attitude.
● One voice materials were not created or utilized.
● Problem solving was not used due to the nonexistence of a physical manufacturing facility.
● Sometimes, TMs interrupted in others’ work without finishing their jobs because they thought the other person needed help, but this was rarely the case.
● TSPC did not reach a point where it could establish a physical manufacturing facility during this case study; as a result, any kind of kaizen activity did not take place.
● Even though gemba was available, the TSPC team was not able to gather facts on the shop floor as described in the first aspect of TL.
3.9
TL Operations Environment
● Customer satisfaction was given highest priority.
● All the team members and leaders went through TL training.
● TSPC provided sufficient resources or handouts during TL transformation.
● Operations were visualized in the PDCA model using M&I.
● Stability was established in theory for the TLOE.
● As per the plan, company met customers’ needs.
● Management always supported the TMs in their work through communication and suggestions.
● No daily operations exist. ● Standards were not in place,
company decided to create standardized work sheets only after starting the production.
● Theoretically, TSPC was able to meet customer demand. Practically, this never happened because a physical manufacturing facility did not exist.
3
TL Tools and Terminology
● TSPC utilized TL tools such as M&I, TT, CT, and Kanban.
● To utilize other tools, company needed a physical manufacturing facility.
2
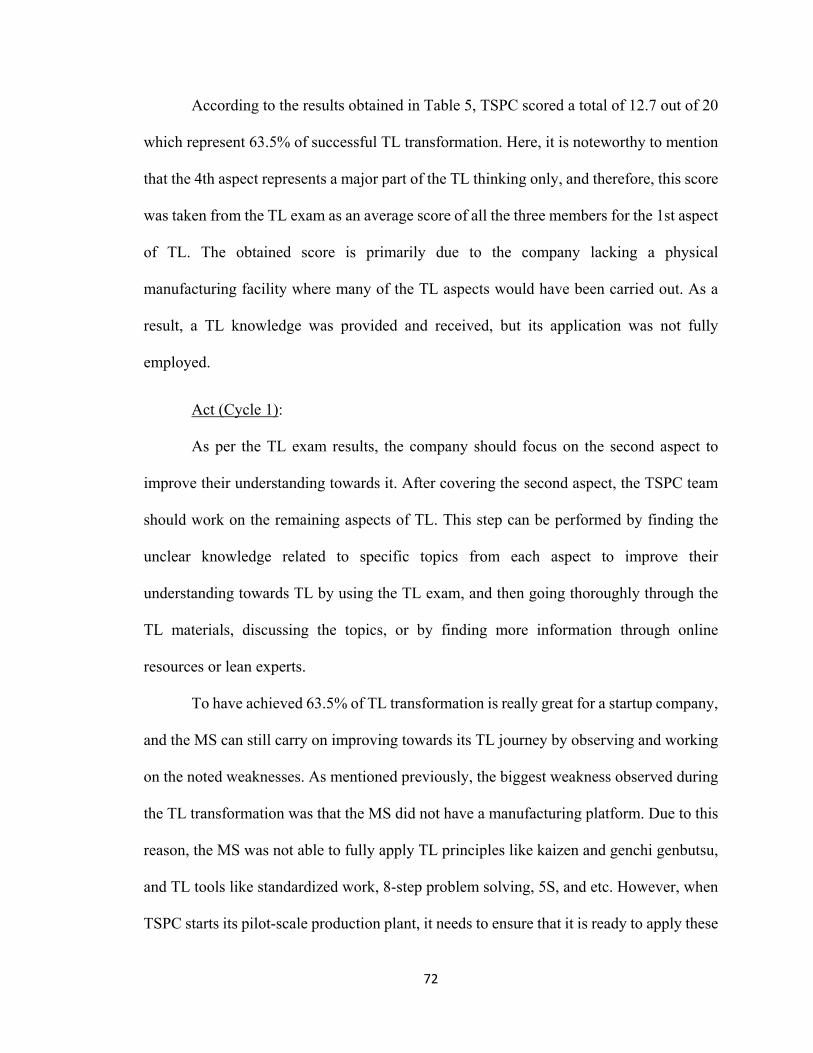
72
According to the results obtained in Table 5, TSPC scored a total of 12.7 out of 20
which represent 63.5% of successful TL transformation. Here, it is noteworthy to mention
that the 4th aspect represents a major part of the TL thinking only, and therefore, this score
was taken from the TL exam as an average score of all the three members for the 1st aspect
of TL. The obtained score is primarily due to the company lacking a physical
manufacturing facility where many of the TL aspects would have been carried out. As a
result, a TL knowledge was provided and received, but its application was not fully
employed.
Act (Cycle 1):
As per the TL exam results, the company should focus on the second aspect to
improve their understanding towards it. After covering the second aspect, the TSPC team
should work on the remaining aspects of TL. This step can be performed by finding the
unclear knowledge related to specific topics from each aspect to improve their
understanding towards TL by using the TL exam, and then going thoroughly through the
TL materials, discussing the topics, or by finding more information through online
resources or lean experts.
To have achieved 63.5% of TL transformation is really great for a startup company,
and the MS can still carry on improving towards its TL journey by observing and working
on the noted weaknesses. As mentioned previously, the biggest weakness observed during
the TL transformation was that the MS did not have a manufacturing platform. Due to this
reason, the MS was not able to fully apply TL principles like kaizen and genchi genbutsu,
and TL tools like standardized work, 8-step problem solving, 5S, and etc. However, when
TSPC starts its pilot-scale production plant, it needs to ensure that it is ready to apply these

73
principles. After the initial PDCA cycle, TSPC stopped proceeding with their goals of the
three-year projection due to lack of funding, and further PDCA cycles or improvements
were not made.
74
Chapter 5
Discussion of Results
The TL implementation approach for the MS company was successfully created by
using PDCA model. After developing the TL implementation strategy for the MS
company, it was introduced to the members of the MS via weekly discussion meetings.
First, the knowledge of TL principles and philosophies was provided. Next, TL culture was
studied, mainly focusing on TL leadership, practice of TL principles, philosophies, and
systematic problem solving. In addition, TSPC was requested to follow TL principles and
philosophies by demonstrating it in their behaviors. Afterwards, the third and fourth aspects
of TL were covered, which consisted of TL operations environment, and TL tools and
terminologies.
PDCA model was carried out utilizing all four aspects of TL to implement TL in
TSPC, where all five members contributed towards the initial PDCA cycle. Before
generating this plan, TSPC fulfilled all the five prerequisites of a startup. The four aspects
of TL assisted the MS team in establishing TL culture and a TLOE comprised of TL tools.
The results included an observation of TL transformation, noticed by the behaviors of
members, demonstrating: prioritization of the customer, respect towards all individuals
involved, and a spirit of challenge. The leaders of the organization, the co-founders,
supported the TMs in their projects without dominance or finger pointing, and emphasized
the importance of TL thinking throughout all activities. This built a positive working
environment where all members learned from each other’s’ projects, uniting the team as a
whole, and depicting strong teamwork. It is further important to note that all individuals
volunteered in these activities and in the development of TSPC throughout the entire study,

75
without any financial gain. This behavior highlighted their motivation, trust and respect
towards the leaders and the company as a whole.
The results of the PDCA include generating an effective and efficient batch
production plan for the first three years of the production. The number of FTEs, number of
equipment, size of the equipment, land area, production capacities and budget requirements
were determined. Manufacturing layout and M&I flow charts were generated by utilizing
data such as CTs of all workstations, TT, customer demand, process sequence and
inventory requirements. Using this information, the complete three-year projections’ and
financial proformas were also generated. These details were used for business venture
competitions, where the company presented and won 5 competitions, obtaining $3,000 of
startup capital.
The PDCA “Plan” was created, but the MS could not perform the “Do” activity, or
execute it because of insufficient liquidity to buy required resources for producing the
products. The product testing to identify active ingredients and to obtain certainty in their
chemical composition was also not fully completed for this reason. In return, the lack of a
physical manufacturing facility hindered the launching of the WiseEarth™ pest repellent
line. However, even after the company's failure in execution of the “plan”, its TL
transformation success was quantified by using two TL assessments: a questionnaire of
understanding and an observation of behaviors, taken by the team and the TL
representative, respectively. These assessments were capable of measuring the success of
TL transformation and TL thinking level.
According to the TL exam results of the TSPC team, the members have a good
understanding of TL, and TSPC achieved over 63% TL transformation. Based on these

76
results, the MS decided to work on its weaknesses in TL by reviewing the TL material
thoroughly for review and clarification. TSPC also decided to wait to strengthen their
weaknesses in production planning and execute improvements towards a TL
transformation until the company establishes a pilot plant.
As a result, when the pilot plant or physical manufacturing facility is established,
the company is recommended to perform a second cycle of PDCA in their weakest TL
aspects and improve their performance towards it. The same practice can be done for the
remaining aspects of TL to strengthen them too. It is recommended that the second PDCA
cycle should focus on the TL culture to follow TL principles like kaizen, genchi genbutsu,
and TL tools like standardized work and 8-step problem solving.
The TL assessment did not focus on the impact of TL on the company’s
performance in terms profit increase, customer satisfaction and waste reduction, as the
production has not yet started. However, this assessment has focused on the application of
all four aspects of TL and TL thinking in the MS. As the company starts the production,
other factors like safety, quality, profit, customer satisfaction, etc. can also be considered
in the assessment to analyze the company’s performance after TL transformation in terms
of profit increment, waste reduction, or customer satisfaction. Lastly, TSPC has been
suggested to participate in TL program or workshop to get hands on experience with lean
tools and practices after the required funding is raised.
Therefore, the benefits of implementing TL in a startup company are:
● TL can assist a MS in reducing the impact on the TBL by efficiently utilizing all
the resources including people, keeping safe environment due to waste reduction
and proper ergonomics, and increasing profit by reducing cost of quality products.

77
● Implementation of TL in an early stage of company can save money because the
cost of TL implementation in the later stage is more expensive and time consuming.
● Early stage TL implementation can assist startups in saving money due to reduction
of waste and inexpensive, efficient production planning.
● Lastly, the success of TL transformation is easy to track in startups compared to
SMLEs and this tracking can allow a startup to completely establish TL quicker.
The MS simply needs to sustain the transformation by keeping a track of the TL
journey periodically.

78
Chapter 6
Conclusions
A TL journey requires significant personal effort because each individual has to
follow all the aspects to TL. Many companies fail in the implementation of TL because
even though they know TL principles and philosophies, they fail to live them due to their
primary focus on TL tools, not TL thinking. TL is not just about tools, it is more about the
thinking, culture and leadership that continuously assists the organization to become a
successful enterprise. Once, organizations understand this, they should be careful to
include all four aspects of TL, with all the groups within the organization working together
to master these aspects. This will benefit the companies in their efforts of striving to be the
leader in the competitive market. As a result, the focus of this study was to begin TL
implementation at the very early stages of a manufacturing organization to ensure that the
company develops around TL thinking by engraving it in all of its activities.
The objectives of this thesis were to create a TL implementation approach for a MS
startup, apply the methodology in a MS, conduct a TL transformation assessment, and
determine if TL can assist a MS in overcoming common startup challenges. These
objectives were met by creating and successfully implementing the TL approach for TSPC,
a MS company. TSPC met the five prerequisites of being a startup to conduct TL
implementation by identifying a value proposition, functional product idea, product
market, potential customers and forecasted customer demand. TSPC members attended
weekly meeting to learn of the four aspects of TL and to apply them in creating a viable
operations plan for their WiseEarth™ pest repellent line.

79
The application of PDCA model via the four aspects of TL resulted in an effective
and optimum production plan and financial data for TPSC. The results of this study
included the generation of a manufacturing layout and a M&I flow chart; determination of
required capital, land area, employees, raw materials and a stable workflow. If company
executes this plan, it can easily reduce the impact on the TBL by effectively utilizing human
potential, reducing waste, producing goods via the pull system, and establishing a
controlled production. In addition, the TL assessment can also be beneficial for the
company and its individuals to keep track of their TL transformation periodically.
However, other factors like performance of individuals, and KPIs (cost, quality, safety, on-
time delivery, environmental aspect and social aspect) need to be integrated in TSPC’s plan
to fully work towards a TL transformation. The need of a physical manufacturing facility
was also highlighted to meet these requirements.
Lastly, the understanding level and the extent to which the MS had gone through
TL transformation were assessed using a TL exam and a TL assessment (which is based
on real and true observations) provided by the LSP at UK. According to these two
assessments, the average understanding level of TSPC for TL is 80% and the extent to
which the TSPC has gone through TL transformation is 63.5%. The four aspects of TL also
assisted TSPC in confronting two common startup challenges of producing an efficient
production plan and visualizing the production environment void of the need for
manufacturing simulation and experts. Nonetheless, challenges associated with raising
required capital to run a manufacturing facility and perform product testing hindered the
company from launching the production line and completing the TL transformation.

80
A.1 True Lean Exam Results

81
References
[1] Long, H. (2016, September 8). U.S. startups near a 40-year low. Retrieved from
https://money.cnn.com/2016/09/08/news/economy/us-startups-near-40-year-
low/index.html
[2] Morgan, B. (2016, April 22). Why lean fails so often. Retrieved from
https://www.ame.org/target/articles/2016/why-lean-fails-so-often
[3] University of Kentucky Lean Systems Program, Lean Graduate Certification Course,
2017.
[4] University of Kentucky,
[5] Marshall, D. (2011, August 16). The Journey to “True Lean”. Retrieved from
https://www.ame.org/target/articles/2011/journey-%E2%80%9Ctrue-lean%E2%80%9D
[6] Saito, A., Kozo, S., & Cho, F. (2012). Seeds of collaboration: Seeking the essence of
the Toyota Production System, an appreciation of Mr. Fujio Cho, master teacher.
Monterey, KY: Larkspur Press
[7] Faro, (2011). An introduction of Lean Manufacturing. QUALITYDIGEST. Retrieved
from https://www.qualitydigest.com/inside/metrology-article/introduction-lean-
manufacturing.html#
[8] Maginnis, M. A., Hapuwatte, B. M., & Jawahir, I. S. (2017, July). Implementing
Total Lifecycle Product Sustainability Through True Lean Thinking. In IFIP International
Conference on Product Lifecycle Management (pp. 544-553). Springer, Cham
[9] Mostafa, S., Dumrak, J., & Soltan, H. (2013). A framework for lean manufacturing
implementation. Production & Manufacturing Research, 1(1), 44-64.
[10] Pavnaskar, S. J., Gershenson, J. K., & Jambekar, A. B. (2003). Classification scheme
for lean manufacturing tools. International Journal of Production Research, 41, 3075–
3090.
[11] Bhasin, S., Burcher, P.: Lean viewed as a philosophy. J. Manuf. Technol. Manag.
17, 56 –72 (2006)
[12] Shah, R., Ward, P.T.: Lean manufacturing: context, practice bundles, and
performance. J. Oper. Manag. 21, 129–149 (2003)
[13] Womack, J.P., Jones, D.T.: Lean thinking: Banish waste and create wealth in your
organization, vol. 397. Simon and Shuster, New York (1996)
82
[14] Lander, E., Liker, J.K.: The Toyota Production System and art: making highly
customized and creative products the Toyota way. Int. J. Prod. Res. 45, 3681–3698
(2007)
[15] Nichols, M. R. (2018, July 27). How lean manufacturing leads to a competitive
advantage. Retrieved from https://born2invest.com/articles/lean-manufacturing-leads-
competitive-advantage/
[16] The Toyota 3M model: Muda, Mura, Muri. (n.d.). Retrieved from
https://www.panview.nl/en/lean-production-theory/toyota-3m-model-muda-mura-muri
[17] Womack, & Jones (2000). Lean Thinking. Retrieved form
http://web.mit.edu/esd.83/www/notebook/WomackJones.PDF
[18] Muda - 7 Wastes of Lean. (n.d.). Retrieved from
https://www.systems2win.com/LK/lean/7wastes.htm
[19] Finding Muda (waste) in your Process. (n.d.). Retrieved from
https://www.panview.nl/en/lean-production-theory/finding-muda-waste-your-process
[20] What is defect? definition and meaning. (n.d.). Retrieved from
http://www.businessdictionary.com/definition/defect.html
[21] McGee-Abe, J. (2018, November 01). The 8 Deadly Lean Wastes - DOWNTIME.
Retrieved from https://www.processexcellencenetwork.com/business-
transformation/articles/the-8-deadly-lean-wastes-downtime
[22] Gay, C. (2016, January 01). MachineMetrics Blog. Retrieved from
https://www.machinemetrics.com/blog/2016/1/24/8-wastes-of-lean-manufacturing
[23] Dolcemascolo, D. (n.d.). Retrieved from
https://www.emsstrategies.com/dm090203article2.html
[24] Ballé, M. (2010). The gold mine: A novel of lean turnaround. Lean Enterprise
Institute.
[25] Krijnen, A. (2007). The Toyota way: 14 management principles from the world's
greatest manufacturer
[26] The US Department of Commerce, 2010, The International Trade Administration
and The U.S. Department of Commerce’s definition for Sustainable Manufacturing,
Available via https://www.trade.gov/green/documents/introduction-to-sustainable-
manufacturing.pptx
83
[27] Institute for Sustainability (2011), Defining sustainability, available at:
http://theinstituteforsustainability
[28] M. P. Sajan, P. R. Shalij, A. Ramesh, P. B. Augustine, Lean manufacturing practices
in Indian manufacturing SMEs and their effect on sustainability performance, Journal of
Manufacturing Technology Management, 28 (2017), 772-793.
[29] A. Thomas, M. Francis, E. John, D. Alan, Identifying the characteristics for
achieving sustainable manufacturing companies, Journal of Manufacturing Technology
Management, 23 (2012) 426-440.
[30] W. Faulkner, F. Badurdeen, (2014). Sustainable value stream mapping (Sus-VSM):
methodology to visualize and assess manufacturing sustainability performance. Journal
of Cleaner Production, 85 (2014) 8-18.
[31] I. S. Jawahir, R. Bradley, Technological elements of circular economy and the
principles of 6R-based closed-loop material flow in sustainable manufacturing. Procedia
CIRP, 40 (2016) 103-108.
[32] O. Peto, Lean in the aspect of sustainability, Theory, Methodology, Practice, 8
(2012) 54.
[33] G. Langenwalter, “Life” is our ultimate customer: from lean to sustainability, Target,
22 (2006) 5-15.
[34] Business Studies Topic 3, (2018), Retrieved from
https://drstoney.wikispaces.com/Business Studies Topic 3
[35] S. Blank (2011). What is a startup? Alto University. Retrieved from
https://www.youtube.com/watch?v=qeMRTx5C70A
[36] N. Robehmed, What is a startup? Forbes, (2015), Retrieved from
https://www.forbes.com/sites/natalierobehmed/2013/12/16/what-is-a-
startup/#29a802274044
[CIT37] Team, STR. “The Spirit of Challenge.” Business Standard, Business-Standard.
(2013)
www.business-standard.com/article/management/the-spirit-of-challenge-
111052300015_1.html.

84
[38] The Toyota Way Chapter 4 – The 14 Principles Of The Toyota Way. (2017, April
18). Retrieved from http://steelefficiencyreview.com.au/blog/principles-of-the-toyota-
way/
[39] Liker, J. K., & Convis, G. L. (2012). The Toyota way to lean leadership. McGraw-
Hill.
[40] Lean Thinking | Lean Principles. (n.d.). Retrieved from
http://leanmanufacturingtools.org/39/lean-thinking-lean-principles/
[41] Leinster, M. (2018). The Machine That Saved the World. Anncona Media.
[42] Womack, J. P., & Jones, D. T. (2010). Lean Thinking: Banish Waste and Create
Wealth in Your Corporation. Riverside: Free Press.
[43] University of Kentucky Lean Systems Program. (n.d.). Retrieved from
https://w2.engr.uky.edu/lean/reference/tip/
[44] Hirano, H. (1995). 5 pillars of the visual workplace. CRC Press.
[45] Jagare, N. (2015, June 11). Principle 4 heijunka. Retrieved from
https://www.slideshare.net/nehajags/principle-4-heijunka
[46] Hoshin Kanri. (n.d.). Retrieved from https://www.leanproduction.com/hoshin-
kanri.html
[47] Shingo, S., & Dillon, A. P. (1989). A study of the Toyota production system: From
an Industrial Engineering Viewpoint. CRC Press
[48] Calculate OEE. (n.d.). Retrieved from https://www.oee.com/calculating-oee.html
[49] TPM (Total Productive Maintenance). (n.d.). Retrieved from
https://www.leanproduction.com/tpm.html
[50] Damalas, Christos A and Ilias G Eleftherohorinos. “Pesticide exposure, safety
issues, and risk assessment indicators” International journal of environmental research
and public health vol. 8,5 (2011): 1402-19.
[51] "About Organic Pesticides." University of California, Berkley. Accessed 2017.
https://www.ocf.berkeley.edu/~lhom/organictext.html
[52] Andrew, Porterfield. "Far more toxic than glyphosate: Copper sulfate, used by
organic and conventional farmers, cruises to European reauthorization." Genetic Literacy
Project. March 2018

85
[53] Newman, J. (2018, October 08). How to Calculate FTE. Retrieved from
https://www.wikihow.com/Calculate-FTE

86
Vita
Education
Bachelor of Science, Mechanical Engineering, Jodhpur Institute of Technology, India
(2015)
Graduate Certificate in Lean Systems, University of Kentucky, USA (2017)
Student Lean Certification Course, University of Kentucky, USA (2017)
Professional Positions
Operations and Engineering Intern, Stoner Incorporated, USA (June 2017 – August 2017)
Assistant Production Manager, Kashma Art & Craft Export, India (June 2014 – July 2016)
Summer Intern, Tractors and Farm Equipment Limited, India (June 2014 – July 2014)
Assistant Production Manager, Krishna Innovation (June 2012 – May 2014)
Honors and Awards
First Place, Bench 2 Business Competition: The Sustainable Products Company,
University of Kentucky, USA (2018)
State Finalist: The Sustainable Products Company, Idea State U Competition, USA (2018)
Second Place, Fast Pitch Presentation: The Sustainable Products Company, Cardinal
Challenge (2018)
First Place, Venture Studio Bootcamp Competition: The Sustainable Products Company,
University of Kentucky (2017)