Imperfect Competition: A Game-Theoretic Approach
25
Imperfect Competition: A Game-Theoretic Approach 13-1 Chapter 13
-
Upload
leroy-mcdonald -
Category
Documents
-
view
60 -
download
5
description
Chapter 13. Imperfect Competition: A Game-Theoretic Approach. 13- 1. Chapter Outline. An Introduction to the Theory of Games Some Specific Oligopoly Models Competition When There are Increasing Returns to Scale Monopolistic Competition A Spatial Interpretation of Monopolistic Competition - PowerPoint PPT Presentation
Transcript of Imperfect Competition: A Game-Theoretic Approach
Imperfect Competition:
A Game-Theoretic Approach
13-1
Chapter 13
Chapter Outline
An Introduction to the Theory of Games
Some Specific Oligopoly Models Competition When There are
Increasing Returns to ScaleMonopolistic CompetitionA Spatial Interpretation of Monopolistic
CompetitionHistorical Note: Hotelling’s Hot Dog
Vendors• Consumer Preferences and Advertising
13-2
Prisoner's Dilemma
Two prisoners are held in separate cells for a serious crime that they did in fact commit. The prosecutor has only enough hard evidence to convict them of a minor offense, for which the penalty is a year in jail.
Each prisoner is told that if one confesses while the other remains silent, the confessor will go scot-free while the other spends 20 years in prison.
If both confess, they will get an intermediate sentence 5 years.
13-3
Dominant Strategy
Dominant strategy: the strategy in a game that produces better results irrespective of the strategy chosen by one’s opponent.
The Nash Equilibrium ConceptNash equilibrium: the combination of
strategies in a game such that neither player has any incentive to change strategies given the strategy of his opponent.– A Nash equilibrium does not require both
players to have a dominant strategy!The Maximin StrategyMaximin strategy: choosing the option that
makes the lowest payoff one can receive as large as possible.
13-4
Tit-for-Tat
Tit-for-tat strategy-The first time you interact with someone,
you cooperate. In each subsequent interaction you simply do what that person did in the previous interaction.
Thus, if your partner defected on your first interaction, you would then defect on your next interaction with her.
If she then cooperates, your move next time will be to cooperate as well.Requirement: there not be a known, fixed
number of future interactions.
13-5
Sequential Games
Sequential game: one player moves first, and the other is then able to choose his strategy with full knowledge of the first player’s choice.– Example - United States and the former Soviet
Union (USSR) during much of the cold war.
Strategic entry deterrence – they change potential rivals’ expectations about how the firm will respond when its market position is threatened.
13-6
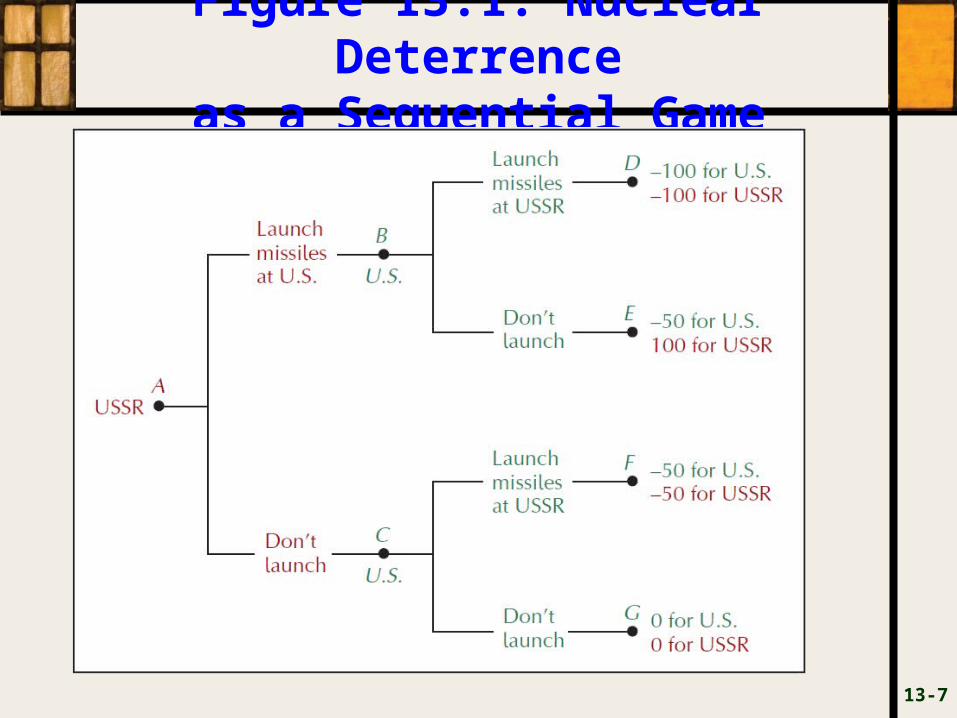
Figure 13.1: Nuclear Deterrence
as a Sequential Game
13-7
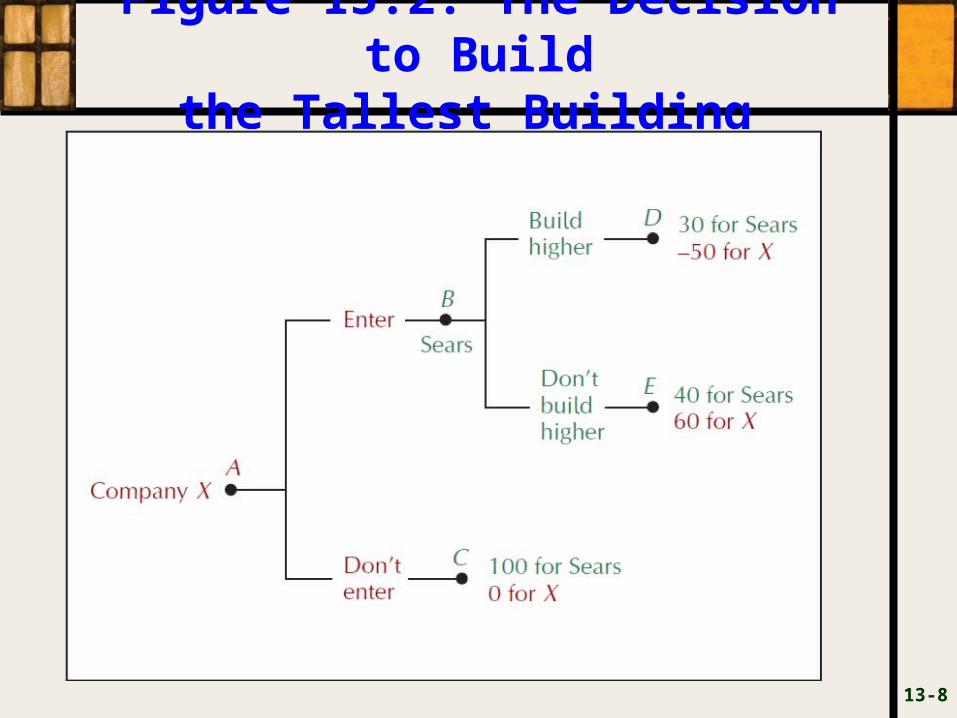
Figure 13.2: The Decision to Build
the Tallest Building
13-8
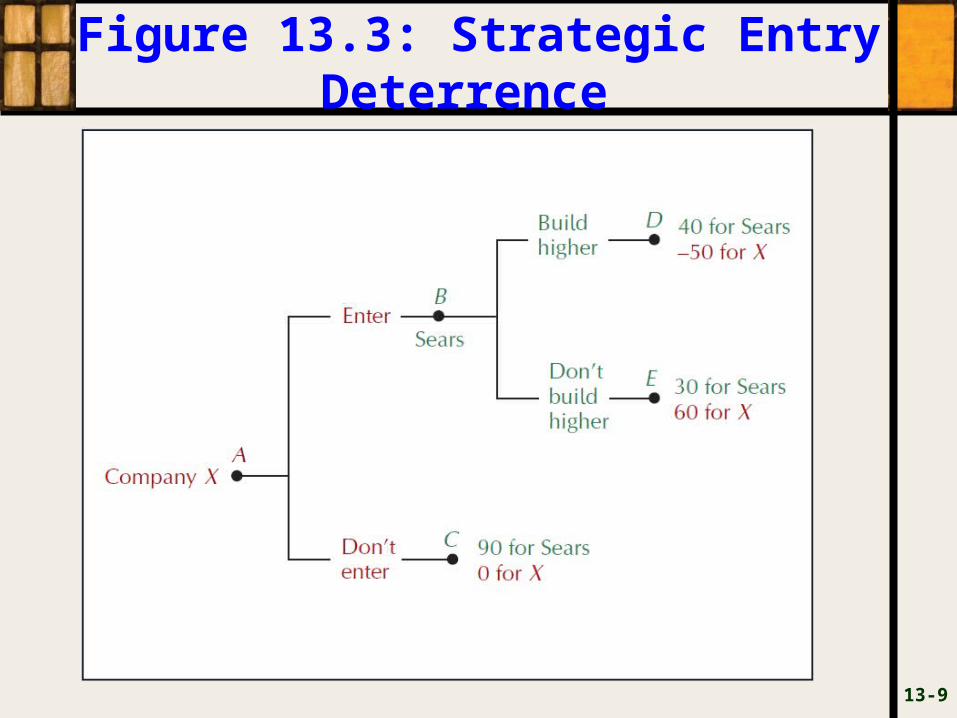
Figure 13.3: Strategic Entry Deterrence
13-9
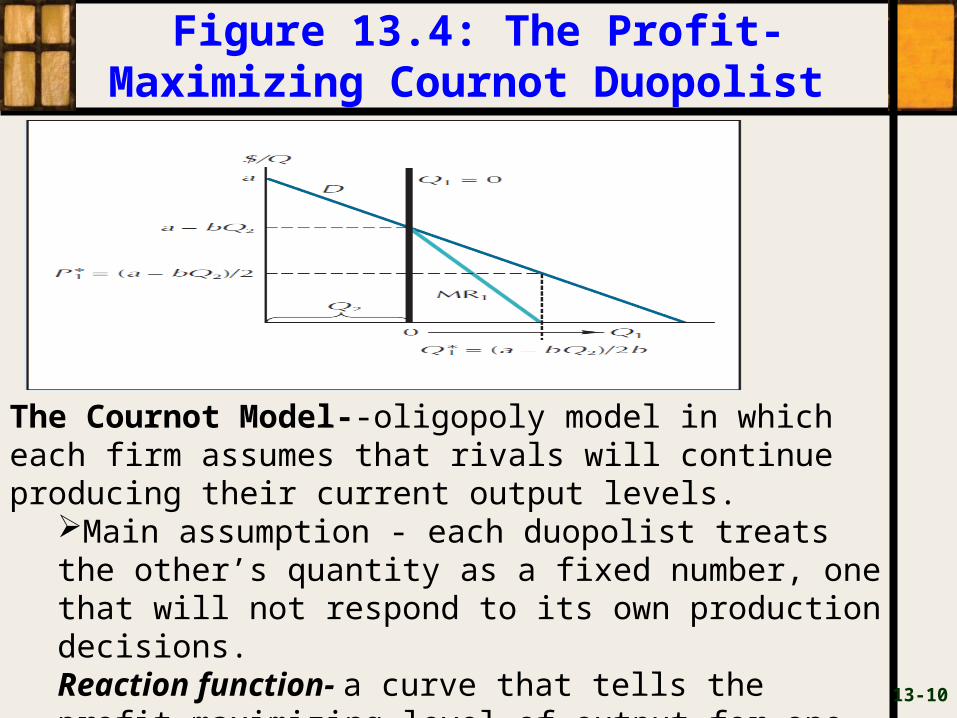
Figure 13.4: The Profit-Maximizing Cournot Duopolist
13-10
The Cournot Model--oligopoly model in which each firm assumes that rivals will continue producing their current output levels.
Main assumption - each duopolist treats the other’s quantity as a fixed number, one that will not respond to its own production decisions.Reaction function- a curve that tells the profit-maximizing level of output for one oligopolist for each amount supplied by another.
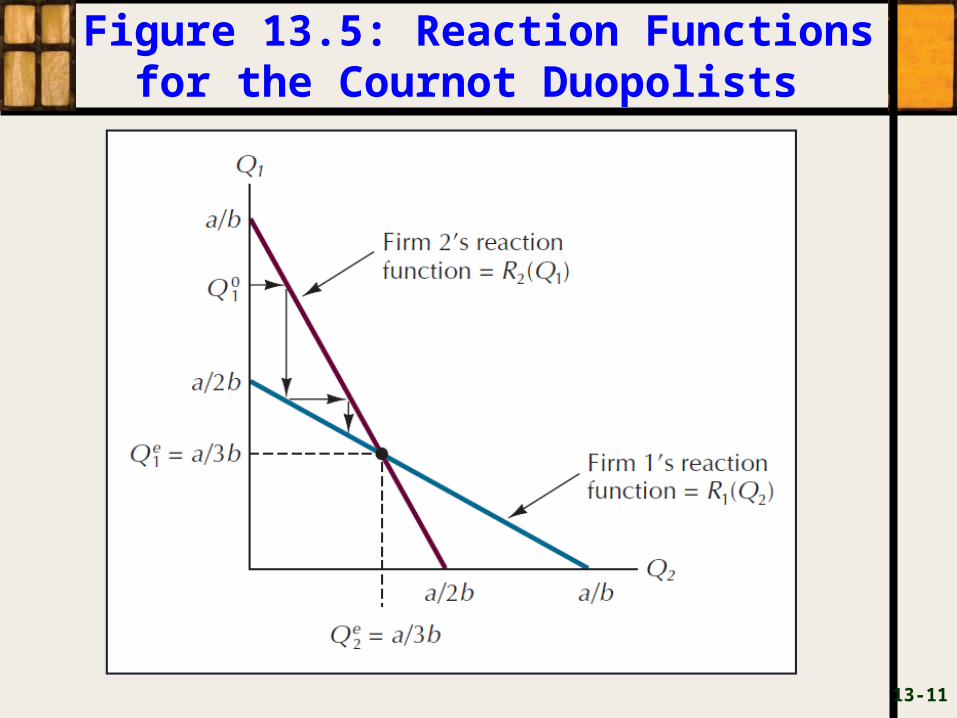
Figure 13.5: Reaction Functionsfor the Cournot Duopolists
13-11
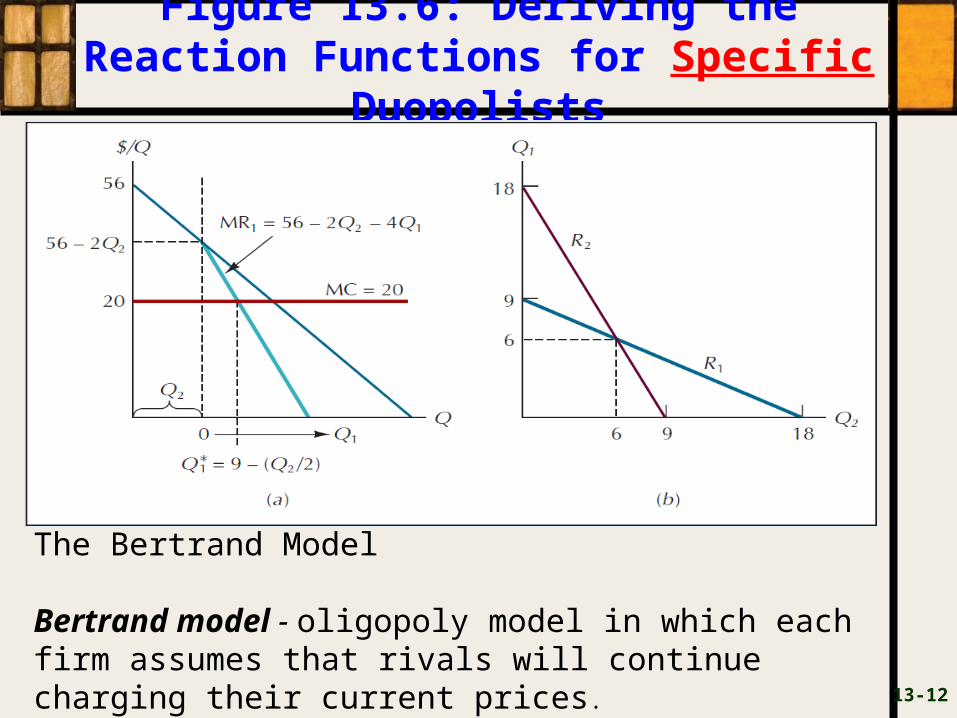
Figure 13.6: Deriving the Reaction Functions for Specific
Duopolists
13-12
The Bertrand Model
Bertrand model - oligopoly model in which each firm assumes that rivals will continue charging their current prices.
13-13
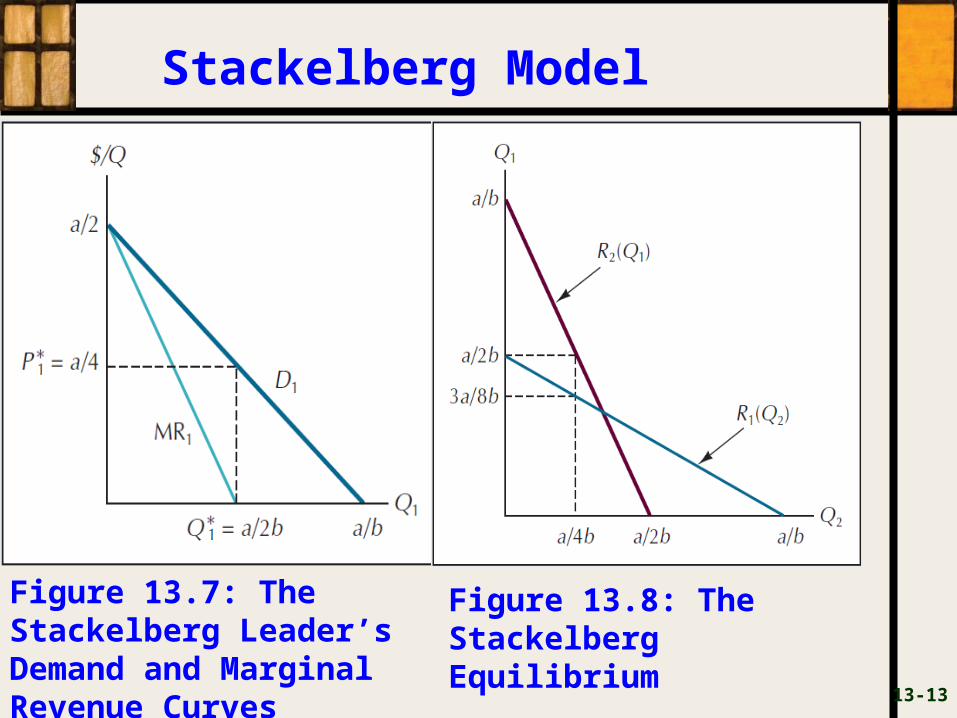
Figure 13.7: The Stackelberg Leader’s Demand and Marginal Revenue Curves
Figure 13.8: The Stackelberg Equilibrium
Stackelberg Model
13-14
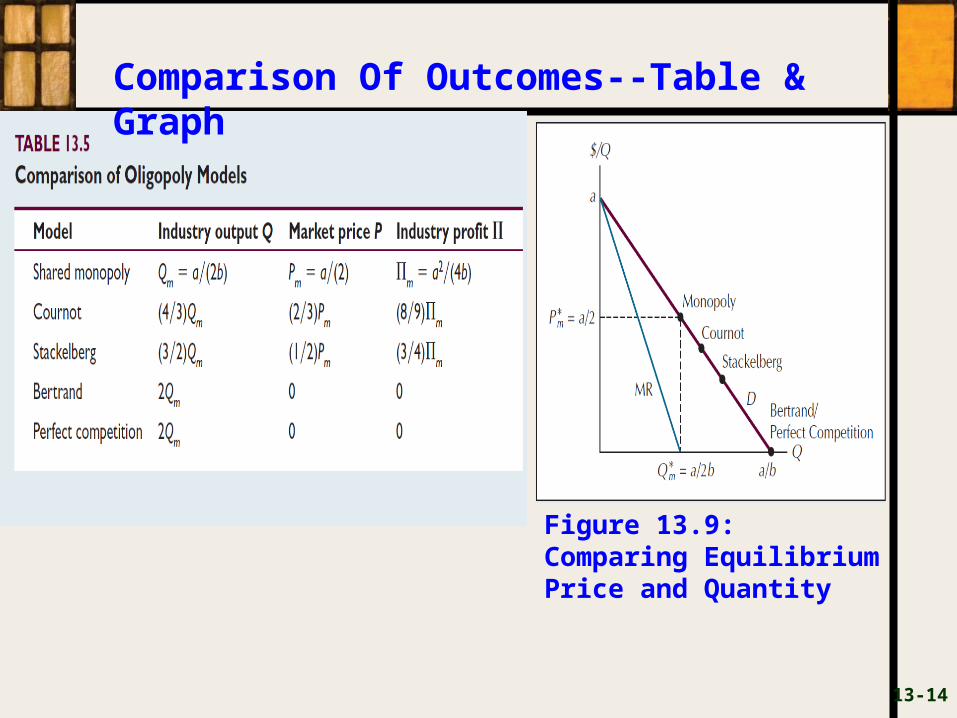
Figure 13.9: Comparing Equilibrium Price and Quantity
Comparison Of Outcomes--Table & Graph
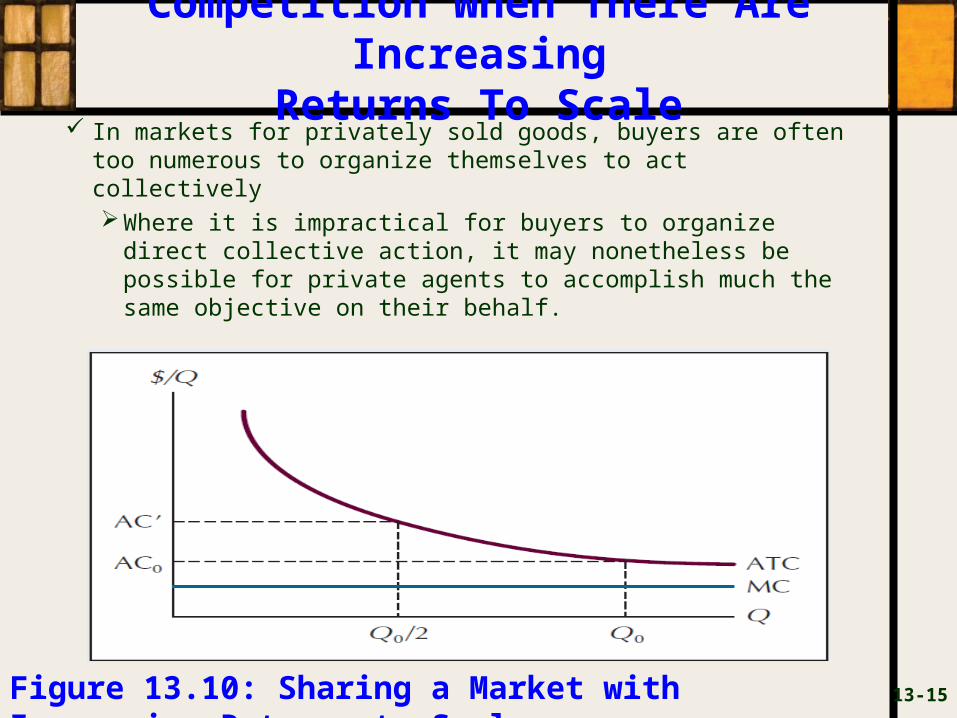
Competition When There Are Increasing
Returns To Scale In markets for privately sold goods, buyers are often too
numerous to organize themselves to act collectively Where it is impractical for buyers to organize direct
collective action, it may nonetheless be possible for private agents to accomplish much the same objective on their behalf.
13-15Figure 13.10: Sharing a Market with Increasing Returns to Scale
The Chamberlin Model
Assumption: a clearly defined “industry group,” which consists of a large number of producers of products that are close, but imperfect, substitutes for one another.
Two implications:1. Because the products are viewed as close
substitutes, each firm will confront a downward-sloping demand schedule.
2. Each firm will act as if its own price and quantity decisions have no effect on the behavior of other firms in the industry.
13-16
13-17
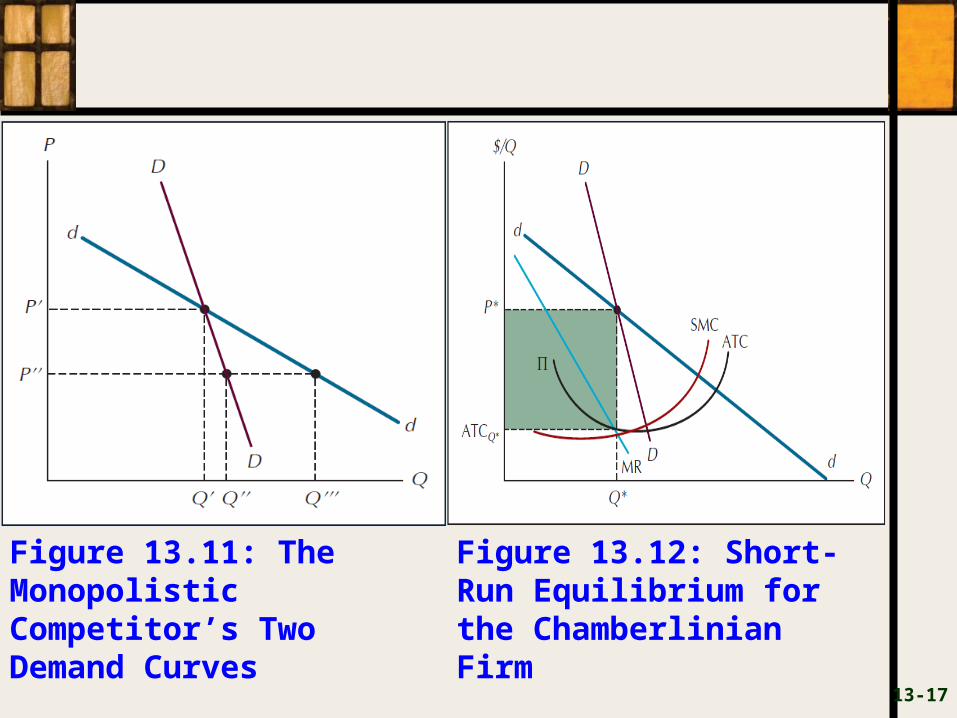
Figure 13.11: The Monopolistic Competitor’s Two Demand Curves
Figure 13.12: Short-Run Equilibrium for the Chamberlinian Firm
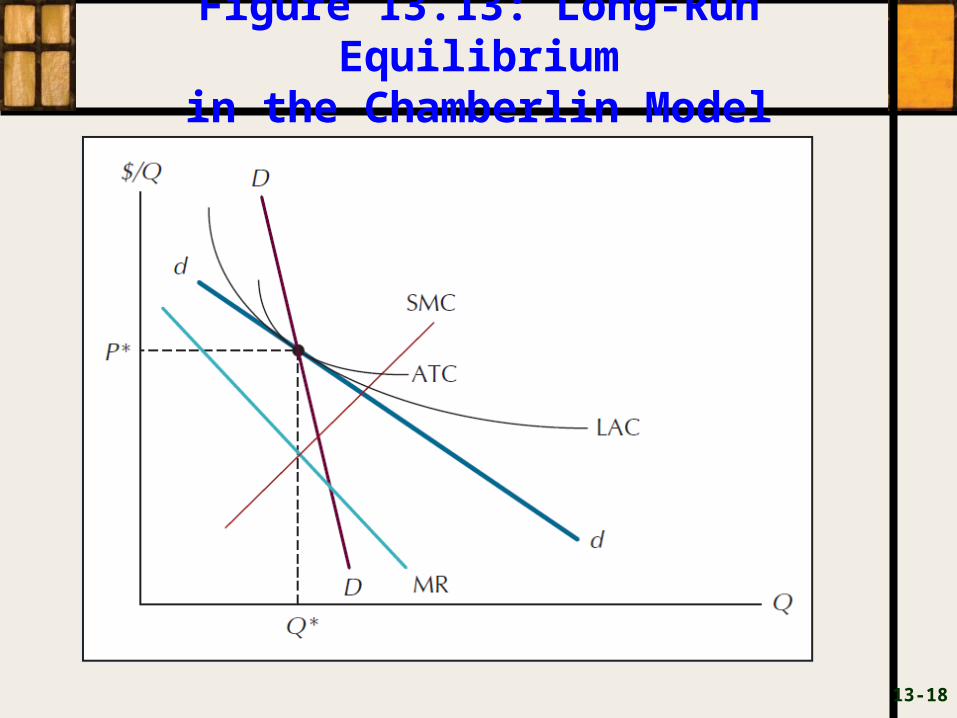
Figure 13.13: Long-Run Equilibrium
in the Chamberlin Model
13-18
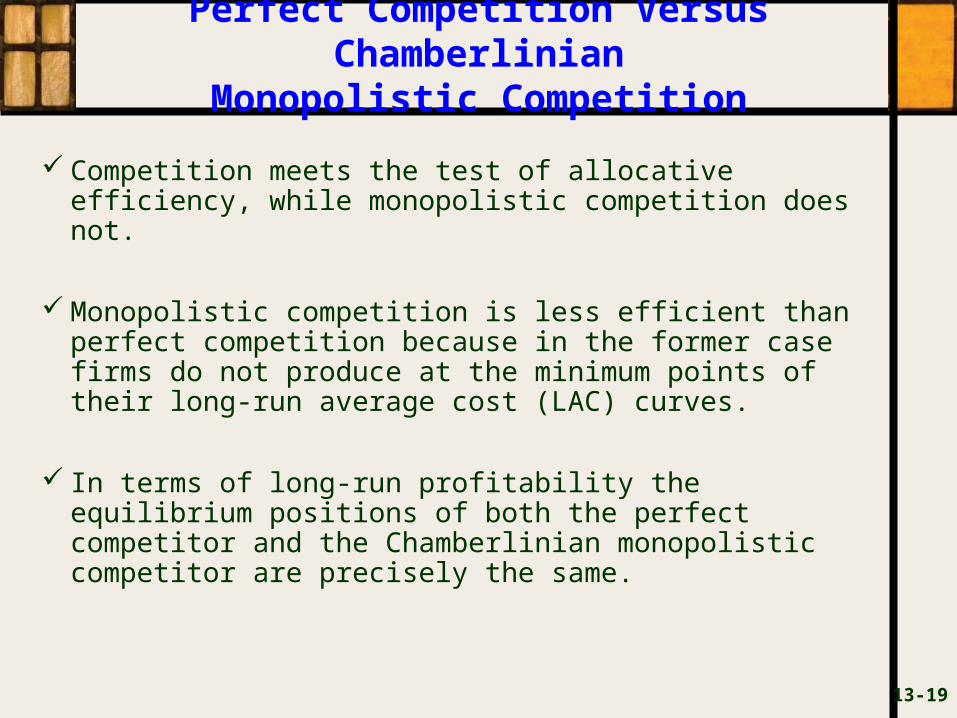
Perfect Competition Versus Chamberlinian
Monopolistic Competition
Competition meets the test of allocative efficiency, while monopolistic competition does not.
Monopolistic competition is less efficient than perfect competition because in the former case firms do not produce at the minimum points of their long-run average cost (LAC) curves.
In terms of long-run profitability the equilibrium positions of both the perfect competitor and the Chamberlinian monopolistic competitor are precisely the same.
13-19
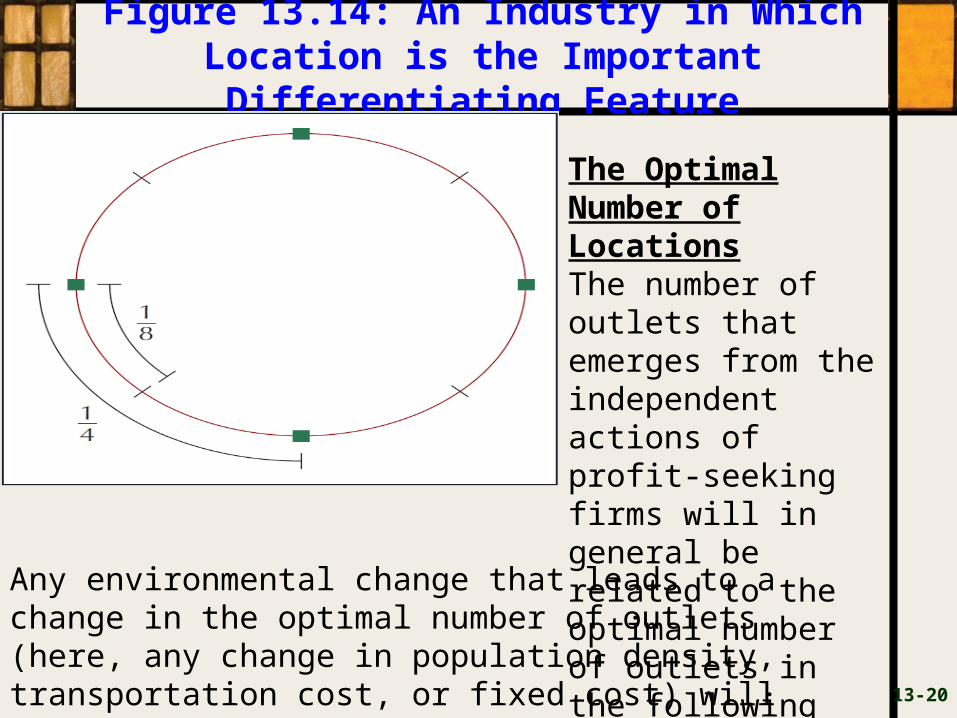
Figure 13.14: An Industry in Which Location is the Important Differentiating Feature
13-20
Any environmental change that leads to a change in the optimal number of outlets (here, any change in population density, transportation cost, or fixed cost) will lead to a change in the same direction in the equilibrium number of outlets.
The Optimal Number of LocationsThe number of outlets that emerges from the independent actions of profit-seeking firms will in general be related to the optimal number of outlets in the following simple way
13-21
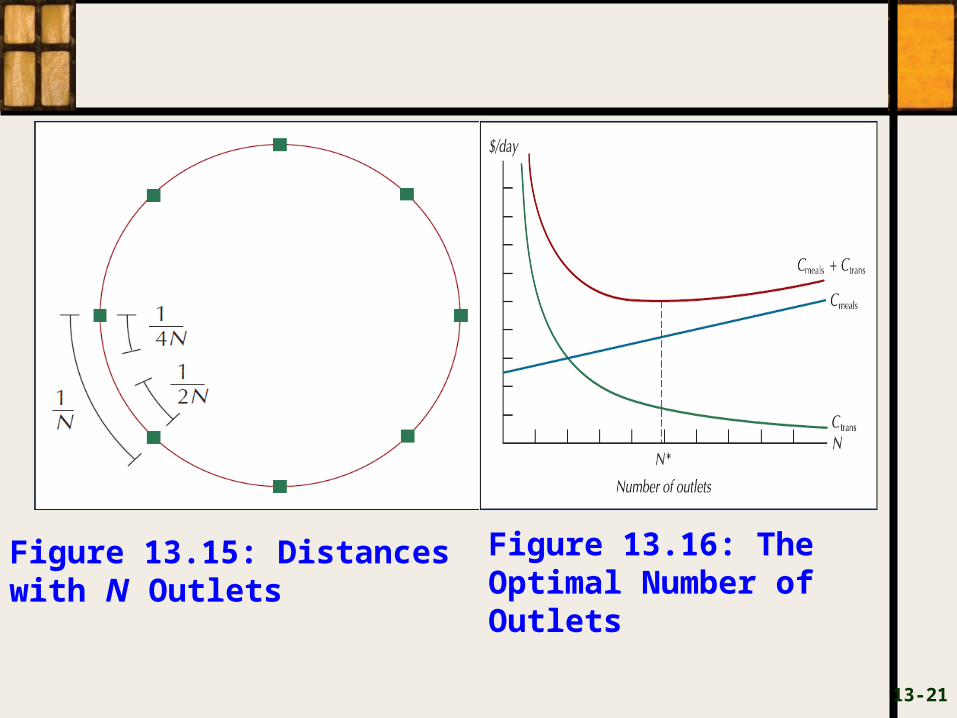
Figure 13.15: Distances with N Outlets
Figure 13.16: The Optimal Number of Outlets
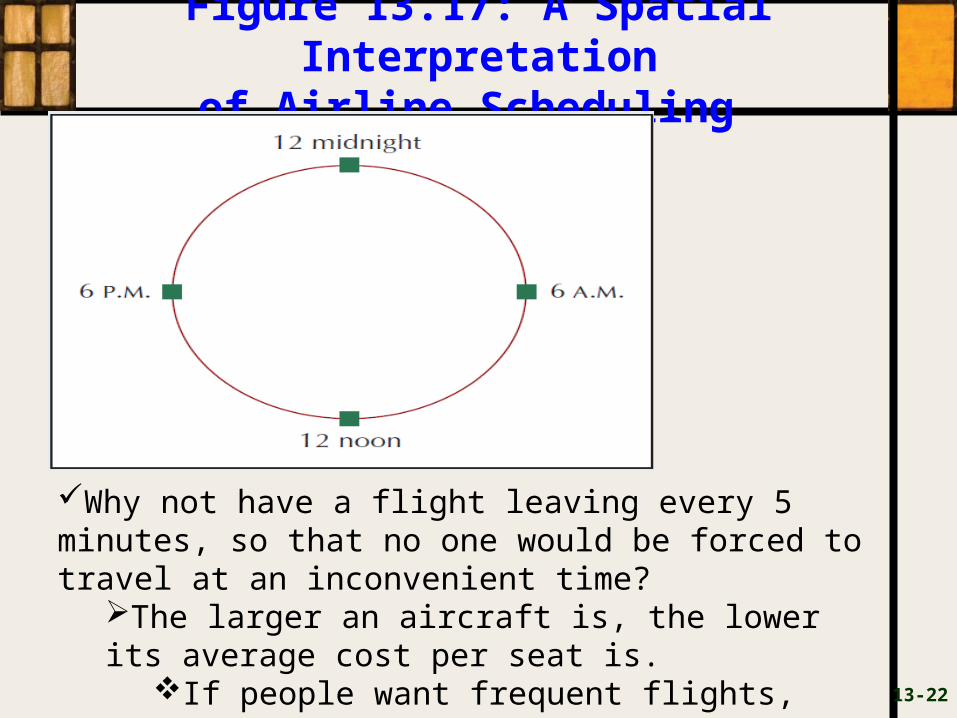
Figure 13.17: A Spatial Interpretation
of Airline Scheduling
13-22
Why not have a flight leaving every 5 minutes, so that no one would be forced to travel at an inconvenient time?
The larger an aircraft is, the lower its average cost per seat is.
If people want frequent flights, airlines are forced to use smaller planes and charge higher fares.
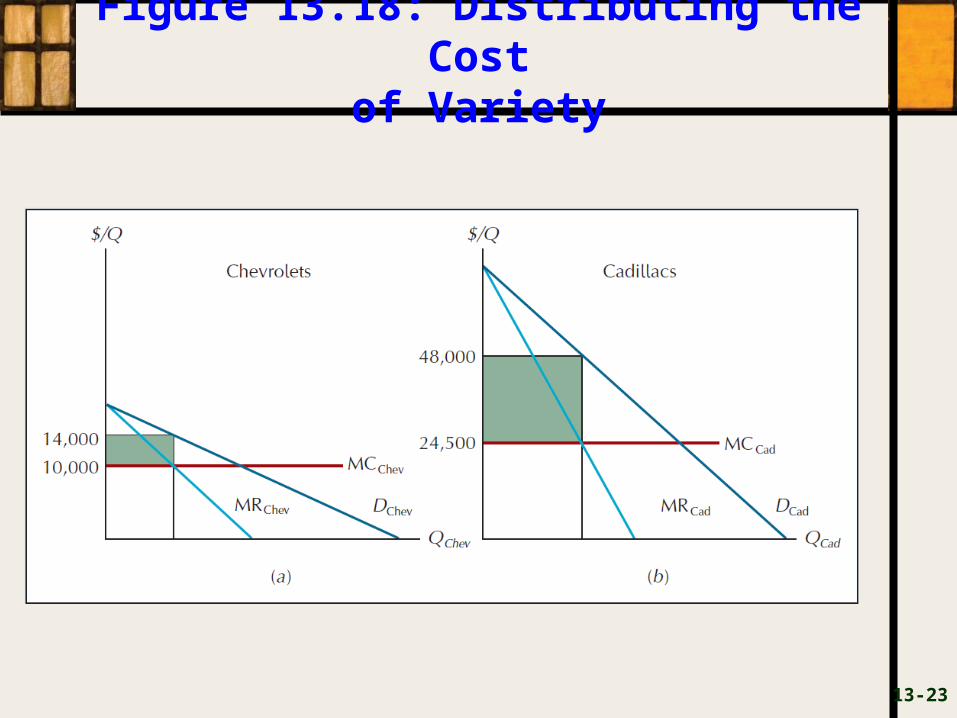
Figure 13.18: Distributing the Cost
of Variety
13-23
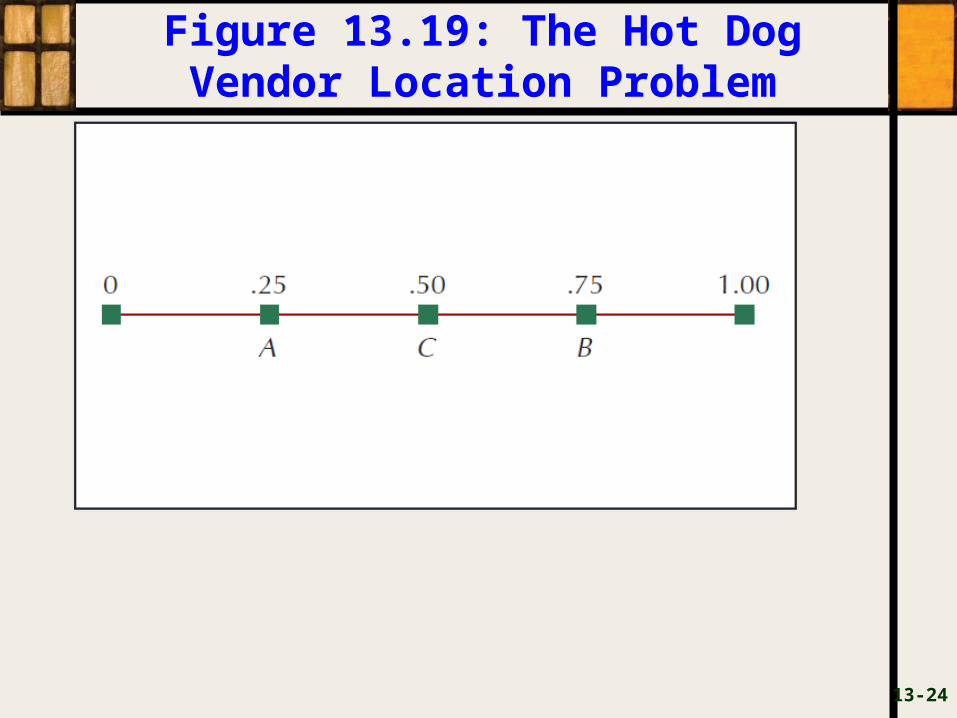
Figure 13.19: The Hot Dog Vendor Location Problem
13-24
Consumer Preferences And Advertising
Because products are differentiated, producers can often shift their demand curves outward significantly by advertising.
The revised sequence -- the corporation decides which products are cheapest and most convenient to produce, and then uses advertising and other promotional devices to create demand for them.
13-25