
IMPACTS ON ECONOMIC SECURITY PROGRAMS
42
Trans 27th ICA Robert L. Brown (Canada) 1 “IMPACTS ON ECONOMIC SECURITY PROGRAMS OF RAPIDLY SHIFTING DEMOGRAPHICS” Robert L. Brown, Canada, Abstract Canada and the United States are facing rapidly shifting demographic profiles as their respective Baby-Boom generations move from the labor force into retirement. This paper explores the impacts this shift will have on a broad range of Economic Security Programs, including: Social Security; Employer-Sponsored Pension and Group Benefit Plans; and Individual Savings Plans, both tax-advantaged and otherwise. The paper first outlines the magnitude of the demographic shifts that are taking place, and gives a careful definition of population aging. The paper concludes by noting some concerns that practitioners in any of the areas of the provision of economic security should have in the face of these rapid shifts.
Transcript of IMPACTS ON ECONOMIC SECURITY PROGRAMS

Trans 27th ICA Robert L. Brown (Canada)
1
“IMPACTS ON ECONOMIC SECURITY PROGRAMS
OF
RAPIDLY SHIFTING DEMOGRAPHICS”
Robert L. Brown,Canada,
Abstract
Canada and the United States are facing rapidly shifting demographic profiles as their respectiveBaby-Boom generations move from the labor force into retirement. This paper explores theimpacts this shift will have on a broad range of Economic Security Programs, including: SocialSecurity; Employer-Sponsored Pension and Group Benefit Plans; and Individual Savings Plans,both tax-advantaged and otherwise.
The paper first outlines the magnitude of the demographic shifts that are taking place, and givesa careful definition of population aging.
The paper concludes by noting some concerns that practitioners in any of the areas of theprovision of economic security should have in the face of these rapid shifts.

Trans 27th ICA Robert L. Brown (Canada)
2
“Impactos en la Seguridad Económica. Programas de Cambio Demográfico.”
Robert Brown Canada
Resumen
Este artículo analiza con cierto detalle posibles trastornos a los programas de seguridadeconómica – de origen gubernamental, patronal e individual – causados por el envejecimiento dela generación del “baby boom”. El documento comienza definiendo qué se entiende por“población en envejecimiento” y concluye que los cambios en la fertilidad son más importantesque los cambios en la esperanza de vida. También se argumenta que la denominación “babyboom de la posguerra” es inexacta y puede llevar a errores de planeación en el desarrollo deproductos y su mercadotecnia. Finalmente, esta sección del artículo muestra que el segmento dela población de más rápido crecimiento será el más anciano – aquellos de edades 85 en adelante,quienes también representarán el mayor gasto en la provisión de servicios de salud y pensionesde retiro. El artículo se enfoca entonces a otros cambios demográficos de importancia, enparticular las tasas de participación laboral femenina. Se analiza el impacto de los cambiosdemográficos en cada proveedor de programas de seguridad económica: gobierno (salud yseguridad social); patrones (planes de pensiones y beneficios); y los individuos. Puntospreocupantes y oportunidades de contrarrestar sus efectos en la industria aseguradora soncomentados. Finalmente, el artículo investiga si seremos capaces de financiar el temprano retirode la generación “baby boom”. Se concluye que será financiable si podemos convencer a unaporción de la fuerza laboral a mantenerse activa por más tiempo y si tenemos tasas decrecimiento productivo sanas. Los problemas de envejecimiento de la población pueden servistos como oportunidades para aquellos que tengan el “mapa” adecuado.

Trans 27th ICA Robert L. Brown (Canada)
3
I Introduction
Canada and the United States are facing rapidly shifting demographic profiles as their respectiveBaby-Boom generations move from the labor force into retirement. This paper explores theimpacts this shift will have on a broad range of Economic Security Programs, including: SocialSecurity; Employer-Sponsored Pension and Group Benefit Plans; and Individual Savings Plans,both tax-advantaged and otherwise.
The paper first outlines the magnitude of the demographic shifts that are taking place, and givesa careful definition of population aging.
The paper concludes by noting some concerns that practitioners in any of the areas of theprovision of economic security should have in the face of these rapid shifts.
II Population Aging
This section of the paper explores the definition of the phrase “Population Aging”. There aretwo components of Population Aging: enhanced life expectancy and shifting demographics.
It is well known that life expectancy in both Canada and the United States has improvedremarkably this century as evidenced in the following two tables.
Table 1
Life Expectancy in Canada
1931 to 1991
Year At Birth At Age 65 At Age 75
Male Female Male Female Male Female
1931 60.0 62.1 13.0 13.7 7.6 8.01951 66.3 70.8 13.3 15.0 7.9 8.81971 69.3 76.4 13.7 17.5 8.5 10.71991 74.6 80.9 15.7 19.9 9.6 12.5
Source: Statistics Canada, National Life Tables

Trans 27th ICA Robert L. Brown (Canada)
4
Table 2
Life Expectancy in the United States
1930 to 1990
Year At Birth At Age 65Male Female Male Female
1930 59.8 61.1 11.7 12.81950 65.5 71.0 12.7 15.01970 67.1 74.7 13.0 16.71990 71.8 78.8 15.1 18.9
Source: United States, Bureau of the Census, National Life Tables
Opinions vary as to why life expectancy has improved so much. However the literature seems tobe in general agreement that the leading reasons for improvement this century include: nutrition,child spacing/family size, housing, and public sanitation (Hertzman et al, 1994, p70). This is notto say that medical care has been ineffective. Quite clearly, data indicate the effects ofimprovements in medical therapy and public health on certain diseases. But there are seriouslimits to the effects of medical intervention on population life expectancy. Major shifts in thehealth status of whole populations over time do not necessarily depend upon the implementationof public health or medical control measures against specific diseases. They point instead to aprofound linkage between health and the social environment, including the levels anddistribution of prosperity in a society (ibid, p71).
Clearly, all else being equal, if every member of society lives longer, then the population willage. Thus, enhanced life expectancy is an important part of the population aging paradigm, butnot the most important part.
What is more important, it turns out, is the dramatic demographic shifts that took place in bothCanada and the United States in the second half of this century.
Both Canada and the United States experienced large increases in live births after World War II.This has become known as the Post-War Baby-Boom. One view of this phenomenon is providedby Figure 1 which shows the Fertility Rates for Canada and the United States for the period from1921 to 1992.

Trans 27th ICA Robert L. Brown (Canada)
5
Figure 1
Source: Brown, 1997, p30
This graph provides a great deal of information.
First, had one been asked in the late 1930’s to predict the fertility rates of the 1990’s, one wouldprobably have been able to provide a relatively accurate prediction. That is, the low fertilityrates of the 1990’s are not the anomaly. Rather, it was the fertility rates of the 1940’s and 1950’sthat are out of place. (As an aside, it is interesting how low the fertility rate was in the 1930’s,before the advent of modern birth control devices such as the pill. Thus, it may be difficult touse “the pill” as the major explanation of the drop in fertility rates in the 1960’s and 1970’s).
Second, Canada had a more interesting and dramatic demographic shift than did the UnitedStates. Canada’s Baby-Boom/Baby-Bust Tidal Wave was higher in its peak and lower in itstrough than the wave experienced in the United States. Thus, in the paper that follows someemphasis is given to the Canadian context since problems in Canada should tend to be moresevere than in the United States (and also because the author has a stronger familiarity with theCanadian environment).
Third, it may be inappropriate to call this phenomenon the Post-War Baby-Boom. If one studiesFigure 1, one can see that the immediate effect of the return of the soldiers from the war isobvious, but temporary. It is the view of this author that the real Baby-Boom did not start untilthe early 1950’s. This would then require a new explanation of the Baby-Boom (i.e. it was notcaused by the return of the war participants).

Trans 27th ICA Robert L. Brown (Canada)
6
The explanation is very much based in economics and can be found in the writings of Easterlin(e.g. 1980). The depression cohort was small and had experienced little in the way of materialrewards. When they entered the workforce in the 1950’s, jobs and promotions were relativelyeasy to come by. That, combined with the low material expectation of the depression cohort,meant that they were able to meet their material needs while having one spouse at home full-time. This also meant that they were able to have extra children. By the same token, theeconomic cost of a stay-at-home spouse in the 1960’s and 1970’s combined with the muchhigher material expectation of the Baby-Boom generation can be used to explain the decline inlive births in the late 1960’s and 1970’s (see Ermisch, 1983). Ermisch’s analysis indicated thatthe higher a woman’s earning power, the longer the gap between marriage and first birth. Healso points out that the increased probability of divorce may keep the fertility rate down.
Another representation of the same phenomenon can be found in the next two graphs whichpresent Live Births for each of Canada and the United States in this century.
Figure 2Live Births in Canada
Source: Brown, 1997, p225

Trans 27th ICA Robert L. Brown (Canada)
7
Figure 3Live Births in the United States
Source: Brown, 1997, p224
Once again, one can see that the Baby-Boom did not really reach its full force until the goodeconomic times of the 1950’s. In fact, live births peaked in the United States in 1957, and inCanada in 1959. Thus, as this paper is being presented in 2000, the largest birth cohort ever isturning age 43 in the United States, and age 41 in Canada—not age 55 as one might assumeusing the indicator—‘Post-War Baby-Boom’.
Second, one can confirm that the Baby-Boom peak over the Depression-cohort trough is larger inCanada (more than two-to-one) than in the United States (less than two-to-one).
In reality, the Baby-Boom is made up of two very different cohorts. These will be described asthe Senior Boomers or Wave Surfers, those born in the period 1945 to 1955, and the JuniorBoomers, those born from 1956 to 1966.
The Wave Surfers got into the job market when jobs were still available. They bought houseswhen they were still relatively cheap, and borrowed mortgage money when rates were still low.More importantly, they entered corporations where their superiors were from the extremely smalldepression cohort. This made progression through the ranks relatively easy. By age 30 theSenior Boom cohort was earning one-third more than their fathers (Levy and Michel, 1985, p40).

Trans 27th ICA Robert L. Brown (Canada)
8
The Junior Boomers, however, entered the labor force when youth unemployment was high (25percent in Canada), bought houses when the prices had already jumped, and backed theirpurchases with mortgages at rates that were all-time highs (over 20 percent per annum in1983/84 in Canada). They also entered corporations where the ranks just above them werejammed by the Senior Boomers. For them, promotion was and is painfully slow. By age 30, theJunior Boomers were earning 10 percent less than their fathers (ibid).
Thus, as stated, the Baby-Boom in total is not a homogeneous entity. At the very least, there aretwo radically different demographic subsets.
We have now achieved a good understanding of just what we mean by population aging. Anoverall graphic image of population aging is captured nicely in Figure 4 that follows.
Figure 4
Source: Foot, 1982, p125
The graph for the United States would be very similar.
One can see in this graph the rapid escalation of the median age (whereby 50 percent of thepopulation is older and 50 percent of the population is younger). From median age 17 in themiddle of the last century, we are now at median age 30, and we expect to achieve a median ageof around 42 by the middle of the next century. While enhanced life expectancy is an importantpart of this phenomenon, shifting demographics are the true driving force.

Trans 27th ICA Robert L. Brown (Canada)
9
For evidence of this, notice that the only time the median age in Canada has ever fallen was inthe period from around 1952 to 1966, which corresponds to the Baby-Boom years as defined inthis paper. Since 1966, the median age of the population has been driven very much by theBaby-Boom generation.
Other indications exist. For example, in projecting future contribution rates required for theQuebec Pension Plan, Menard (1992, p267) indicated that enhanced life expectancy would causethe contribution rate of 2040 to rise 1.3 percentage points over 1990, while other demographicfactors (lower birth rates offset slightly by immigration) would cause the Quebec Pension Plancontribution rate of 2040 to rise 7.7 percentage points over 1990. Similarly, Denton et al (1998,p107) found that the impact of low versus high fertility on median ages in Canada was 12.5 yearsby 2041, while the impact of low versus high mortality was only 1.6 years.
In conclusion, population aging has a lot more to do with shifting demographics than withimprovement in life expectancy. However, enhanced life expectancy is an important element ofboth the problems and the possible solutions that need to be considered in the future design ofeconomic security programs.
It is interesting to place these demographics shifts that have taken place in Canada and theUnited States in an international perspective.
Most nations have experienced remarkable improvements in Life Expectancy over the last half-century, especially those who are just attaining modern medical practice (e.g. China). This isindicated clearly in Figures 5 and 6 that follow (data from Chris Daykin, UK GovernmentActuary).
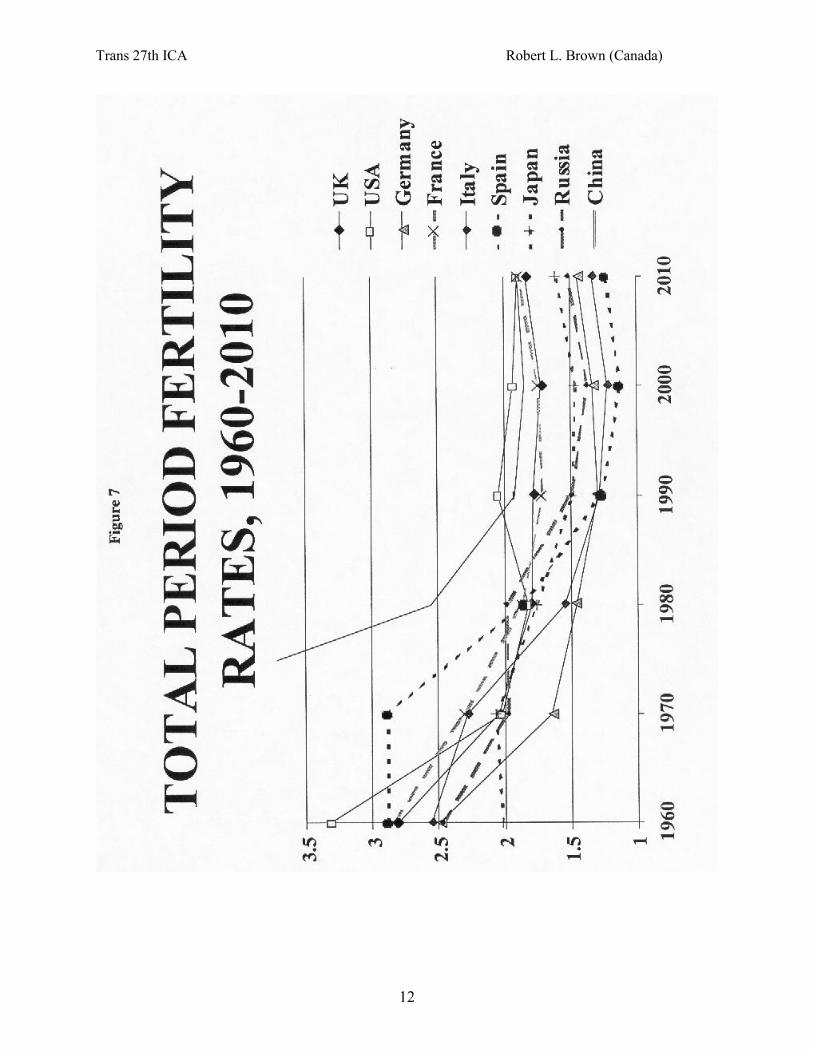
These same countries have seen significant drops in their fertility rates (at least since the mid60’s) as seen in Figure 7 (ibid).
Finally, as presented in Figure 8 (ibid), the result of enhanced life expectancy combined withdropping Fertility Rates, is an expected sharp rise in Dependency Ratios (defined here as theratio of those aged 65 and over to those aged 15 to 64).
Returning our focus to Canada and the United States, graphical evidence of this macro-population aging process can be seen in the graphs that follow.

Trans 27th ICA Robert L. Brown (Canada)
10

Trans 27th ICA Robert L. Brown (Canada)
11
Trans 27th ICA Robert L. Brown (Canada)
12

Trans 27th ICA Robert L. Brown (Canada)
13

Trans 27th ICA Robert L. Brown (Canada)
14
Figure 9
Canadian Population 1986
Source: Statistics Canada
Figure 10
Canadian Population 2031
Source: Statistics Canada

Trans 27th ICA Robert L. Brown (Canada)
15
Figure 11United States Population, 1995
Figure 12United States Population, 2030

Trans 27th ICA Robert L. Brown (Canada)
16
These graphs are known as population pyramids and show the number of people within each agegroup, females on the right and males on the left. In a stable population (one in which birth ratesand death rates are constant year after year) these histograms would look like a pyramid—broadin the base and then, because of mortality, working gradually to a peak at the top. These are notthe shapes presented in Figures 9 to 11.
Clearly, both Canada and the United States are going through some rapid demographic changes.This is dramatically summarized for Canada in Table 3 which follows. Similar data could bepresented for the United States.
Table 3
Distribution of Canadian Population by Age-Group1956 to 2036
Age 1956 1976 1996 2016 2036
Under 20 39.4 35.6 26.7 22.0 20.220-64 52.9 55.8 61.1 61.4 55.065+ 7.7 8.6 12.2 16.6 24.8
75+ 2.5 3.2 5.1 7.1 12.885+ 0.4 0.7 1.2 2.2 3.8
Source: Denton, Feaver, and Spencer, 1998, p85/90
Thus, over the next forty years, the percent of the population aged 65 and over will double, whilethe percent of the population aged 85 and over will more than triple. This has importantimplications for economic security programs as discussed later.
Trans 27th ICA Robert L. Brown (Canada)
17
III Other Demographic Shifts
Another important demographic shift that has taken place in both the United States and Canadain the last thirty years is presented in Figure 13.
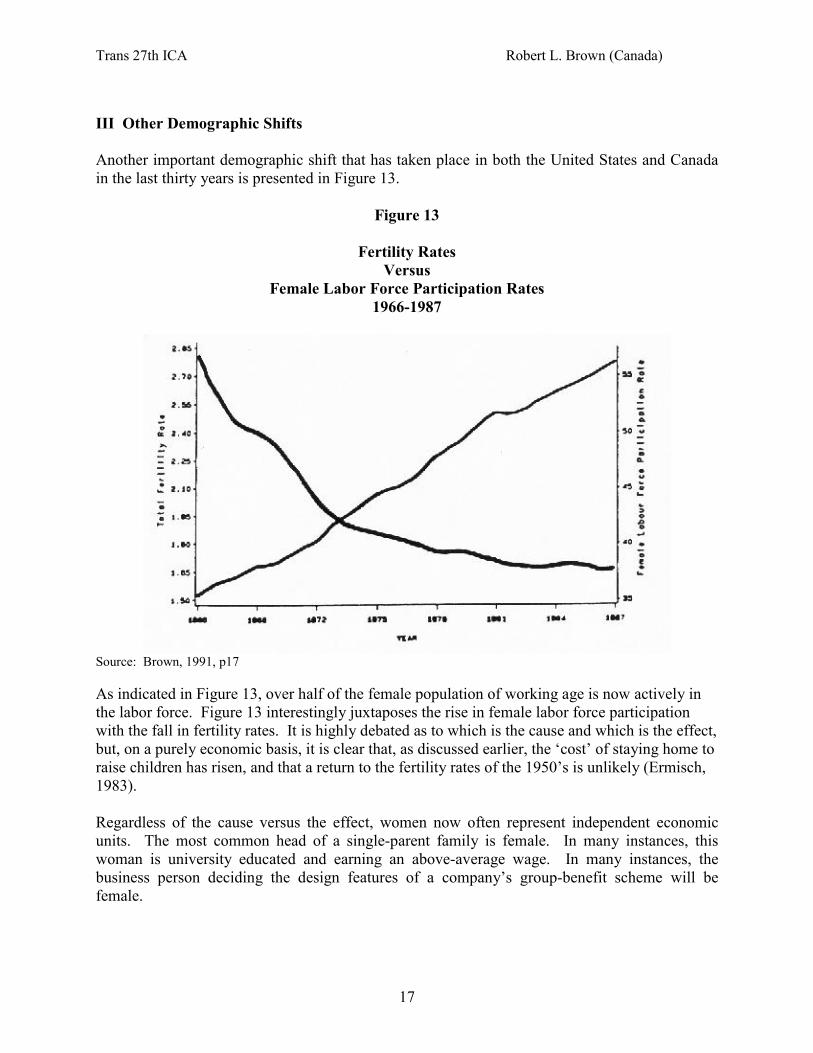
Figure 13
Fertility RatesVersus
Female Labor Force Participation Rates1966-1987
Source: Brown, 1991, p17
As indicated in Figure 13, over half of the female population of working age is now actively inthe labor force. Figure 13 interestingly juxtaposes the rise in female labor force participationwith the fall in fertility rates. It is highly debated as to which is the cause and which is the effect,but, on a purely economic basis, it is clear that, as discussed earlier, the ‘cost’ of staying home toraise children has risen, and that a return to the fertility rates of the 1950’s is unlikely (Ermisch,1983).
Regardless of the cause versus the effect, women now often represent independent economicunits. The most common head of a single-parent family is female. In many instances, thiswoman is university educated and earning an above-average wage. In many instances, thebusiness person deciding the design features of a company’s group-benefit scheme will befemale.

Trans 27th ICA Robert L. Brown (Canada)
18
These are demographic facts of which the insurance industry must be cognizant. Products mustbe designed for a workplace that is increasingly female. Individual products must be tailoredmore often to a female purchaser and insured. Group benefits must be flexible enough to handleboth the single-female household and the two-income family. There is little value in benefitsthat only duplicate those already available to the spouse under another plan. Thus a continuedrise in employee demand for flexible benefit plans (e.g. cafeteria plans) that allow for amultiplicity of living arrangements can be expected.
Further, it is the author’s contention that companies who employ females in the design andmarketing of economic security schemes will be more successful in this new demographicenvironment.
IV Impacts of Shifting Demographics on Economic Security Programs
1. The Government as Sponsor
Historically, government-sponsored economic security systems, including health care and socialsecurity, have been financed on a pay-as-you-go basis. That is, the costs of the plan in anyparticular year are paid for by contributions or taxes in that year. No (or very small) reserves areaccumulated, and workers cannot be said to be paying for their future benefits (rather they payfor the benefits of today’s recipients).
This system of financing works well, and worked well in the 1950’s and 1960’s, so long as thetax base or contribution base is growing faster than the cost of benefits. Thus, in the period whenthe labor force was growing rapidly, along with real wages, pay-as-you-go financing was wise.However, pay-as-you-go financing opens itself up to justifiable criticism when the costs of thebenefits for the scheme are growing faster than the tax base or contributions base. That is thecase today, and for the foreseeable future.
Because of the demographic shifts, and the slow rate of growth of real incomes, many workerstoday do not believe that their social security systems are a good deal. That is, they do notbelieve that they will get their money’s worth by continuing to contribute to social security.
Much analysis has been done on this issue, and the facts for Canada and the United States appearin the tables that follow.

Trans 27th ICA Robert L. Brown (Canada)
19
Table 4
OASDI (U.S.)RATIO OF BENEFITS TO ACCUMULATED TAXES
(at 2% Real)
Retirement WORKER AT AIW MAX-WAGE EARNERYear Single Male Single Female Couple Single Male Single Female Couple
1960 7.1 8.9 13.2 5.7 7.1 10.51980 2.8 3.5 5.2 2.5 3.2 4.72000 1.2 1.6 2.3 1.0 1.2 1.82020 1.1 1.4 2.1 0.8 1.0 1.4
Source: Myers and Schobel, 1992, p263/280
Analysis by the Canada Pension Plan actuary arrives at similar findings, but in a differentpresentation format.
Table 5
CANADA PENSION PLANMONEY’S WORTH ANALYSIS
Year of Ratio of InternalBirth Benefits to Contributions Rate of Return (%)
1911 47.7 31.31929 28.1 16.61948 11.7 9.01968 6.6 6.41988 5.4 5.22012 5.4 5.1
Source: Canada Pension Plan, 15th Actuarial Report, as at December, 1993, p101.
As an aside, the 5.1 percent rate of return presented in the Canada Pension Plan for the cohortborn in 2012 assumes an inflation rate of 3.5 percent per annum. Thus, the net real rate of returnfor this birth cohort is 1.5 percent per annum.
Clearly, these dropping rates of return to successive birth cohorts can be traced back to therapidly shifting ratios of retirees to workers (see Figures 9 to 11), and the slow rate of growth ofreal wages over the past decade. Raising contributions (taxes) or lowering benefits will notchange these disappointing trends.
Faced with these demographic trends, the governments of both Canada and the United Stateshave been studying a partial privatization of social security as a possible solution to the projected

Trans 27th ICA Robert L. Brown (Canada)
20
lower rates of return. In the United States, two of the three major proposed reforms of theOASDI system would see part of the social security system allocated to the equivalent ofIndividual Accounts, with the participant investing the funds in the private market. In Canada,contributions to the Canada/Quebec Pension Plans have been raised above the pay-as-you-go rateto create an investment fund that will be invested in the private sector. The argument presentedis that social security systems, and their participants, can earn a higher rate of return if some ofthe social security funds are invested in the stock market or in high-yield private sector assetsrather than low-yield government bonds as is the case today. While this is an appealingargument, that has wide and growing acceptance, actuaries who work regularly with thefinancing of social security systems are questioning its long-term validity.
Francisco Bayo (1988, p178), Deputy Chief Actuary of OASDI, has stated:
For Social Security, you cannot accumulate assets; that is, claims from somebody else’sproduction. If we have a large amount of money in the Social Security trust funds, we have aclaim on ourselves, which does not have much meaning. The truth is, whatever is going to beconsumed—be it a product that you can get a physical hold of, or services that are very difficult tohold—those products cannot be stockpiled. They have to be provided at the time of consumption.No matter what kind of financing we are going to have in our Social Security program, you willfind that the benefits that will be obtained by the beneficiary in the year 2050 will have to beproduced by the workers in the year 2050, or just a few years earlier.
Nicholas Barr (1993, p220) says it even more strongly:
The widely held (but false) view that funded schemes are inherently ‘safer’ than PAYGO is anexample of the fallacy of composition. For individuals the economic function of a pensionscheme is to transfer consumption over time. But (ruling out the case where current output isstored in holes in people’s gardens) this is not possible for society as a whole; the consumption ofpensioners as a group is produced by the next generation of workers. From an aggregateviewpoint, the economic function of pension schemes is to divide total production betweenworkers and pensioners, i.e. to reduce the consumption of workers so that sufficient outputremains for pensioners. Once this point is understood it becomes clear why PAYGO and fundedschemes, which are both simply ways of dividing output between workers and pensioners, shouldnot fare very differently in the face of demographic change.
In general, one should expect governments to continue to be concerned about the overall cost ofsocial security, and the intergenerational equity that the existing systems provide. One shouldexpect further attempts to cut benefits and privatize a least part of the existing system.
Not only do governments have to worry about the future financing of social security because ofthe shifting demographics, but, at the very same moment, they will be faced with rapidly risingcosts for health care.
This can be seen clearly in the following table.

Trans 27th ICA Robert L. Brown (Canada)
21
Table 6
Growth of Public Social Expenditures in the OECD1980 to 2040(1980 = 100)
Country Health Care Social Security Overall*
Australia 240 288 207Britain 121 130 110Canada 218 304 187France 119 172 128Germany 90 126 97Italy 108 134 107Japan 146 229 140Sweden 117 123 109United States 178 215 165
*Includes all social expenditures (e.g. education, unemployment)Source: Walker, 1990, p384
One can see that the countries which truly experienced the Baby-Boom/Baby-Bust are leaders inthe growth of public social expenditures (e.g. Australia, Canada and the United States). Further,many European countries already have ‘aged’ populations and face smaller growth rates forpublic social expenditures (e.g. Britain, Sweden, Germany and Italy).
The increase in public expenditures captured in Table 6 are those created purely by populationaging. The projections assume a constant level of service and benefit delivery, with noimprovement in the existing systems.
Age is one of the strongest determinants in predicting the need for health care services of anation as can be seen in Figure 14 that follows. In Canada, people aged 65 and over made up11.7 percent of the population in 1991/92, and 4.75 percent of the population were 75 and over.However, those 65 and over accounted for nearly 60 percent of hospital inpatient days, and 40percent of all days were provided to those 75 and over (Barer et al., 1995, p201).

Trans 27th ICA Robert L. Brown (Canada)
22
Figure 14
Relative Per Capita Costs of Health CareFor
Males and Females by Age
Source: Marshall, 1987
Thus, the aging of the population will continue to exert upward pressure on any government–sponsored health care benefits. In response, one should expect the government to continue tofind ways to off load their costs to the private sector.
In the United States, one would expect a continuation of the expansion of state-mandatedbenefits to be covered by employer plans and further pressure for employers to provide post-retirement coverage. Finally, one might also anticipate a rise in the age of eligibility forMedicare from its present age 65 (e.g. to rise with the OASDI normal retirement age).
In Canada, one should expect to see the provincial governments continue to decrease the benefitscovered where permissible (e.g. out-of-country coverage) and to continue to de-list proceduresthat are not medically necessary (e.g. physician check-ups to comply with insuranceapplications). One should also expect the government to move more to capitation payment fordoctors (if not outright salaries) and to provision of prescription drugs only through governmentrecognized formularies.
These moves will put more pressure on employer-sponsored and/or individual health care benefitschemes to provide the benefits de-listed by the government.

Trans 27th ICA Robert L. Brown (Canada)
23
2. Employer-sponsored Economic Security Programs
--Pension Plans
The aging population will put pressure on employer-sponsored pension plans in a variety ofinteresting ways. Many of the accepted norms of today may be reversed in the next forty years.
First, over the past two decades, there has been a consistent shift in plan design away fromDefined Benefit (D.B.) plans to Defined Contribution (D.C.) plans. There have been a numberof important reasons for this including: the high administrative costs of D.B. plans; the moremobile work force; high real rates of interest and strong investment rates of return; the desire ofemployers to have fixed costs for their pension plans.
As the population ages, and the workforce ages with it, older employees may return to a desirefor the security of one’s standard of living that only a Defined Benefit plan can provide.Younger workers, especially those who are highly mobile, are clearly better off to place theirdollars into Defined Contribution plans, especially when investments are returning such stellarrates. However, the retirement benefit in a Defined Contribution plan cannot be known until it isturned into a retirement annuity. Even when one is very close to retirement, rates of interestupon which annuities are priced can change so rapidly that one’s retirement income may still notbe assured. Older workers may prefer the security provided by a Defined Benefit plan, even if itturns out that the actual benefits are lower than what might have been achieved under a DefinedContribution plan for the same total cost.
Second, over the past forty years, ages at retirement have fallen, and fallen significantly as canbe seen in Table 7.
Table 7Average Retirement Age in Selected Countries
1950-1990
Country 1950 1970 1990 1990-1950
Canada 67.3 65.0 62.3 - 5.1U.K. 68.6 65.9 62.9 - 5.7United States 67.9 65.3 63.9 - 4.0Sweden 67.7 65.3 64.2 - 3.4Japan 67.0 69.5 67.6 +0.6
Source: Latulippe, 1996, p10/14
Trans 27th ICA Robert L. Brown (Canada)
24
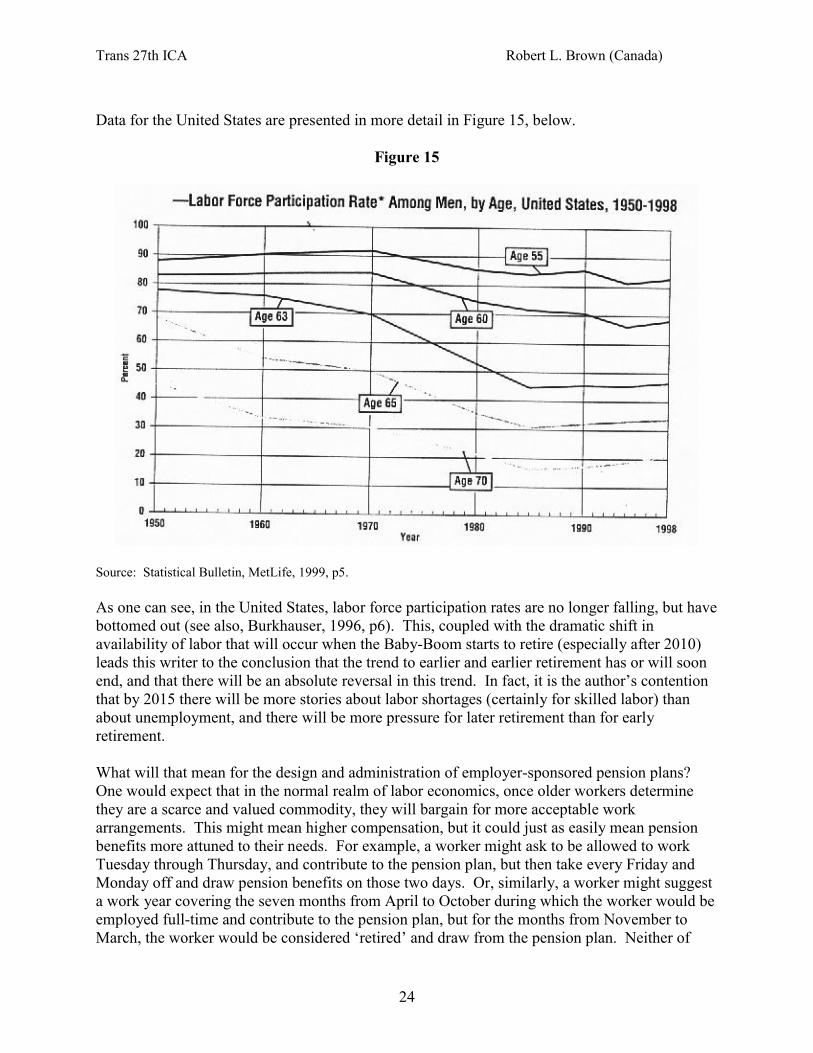
Data for the United States are presented in more detail in Figure 15, below.
Figure 15
Source: Statistical Bulletin, MetLife, 1999, p5.
As one can see, in the United States, labor force participation rates are no longer falling, but havebottomed out (see also, Burkhauser, 1996, p6). This, coupled with the dramatic shift inavailability of labor that will occur when the Baby-Boom starts to retire (especially after 2010)leads this writer to the conclusion that the trend to earlier and earlier retirement has or will soonend, and that there will be an absolute reversal in this trend. In fact, it is the author’s contentionthat by 2015 there will be more stories about labor shortages (certainly for skilled labor) thanabout unemployment, and there will be more pressure for later retirement than for earlyretirement.
What will that mean for the design and administration of employer-sponsored pension plans?One would expect that in the normal realm of labor economics, once older workers determinethey are a scarce and valued commodity, they will bargain for more acceptable workarrangements. This might mean higher compensation, but it could just as easily mean pensionbenefits more attuned to their needs. For example, a worker might ask to be allowed to workTuesday through Thursday, and contribute to the pension plan, but then take every Friday andMonday off and draw pension benefits on those two days. Or, similarly, a worker might suggesta work year covering the seven months from April to October during which the worker would beemployed full-time and contribute to the pension plan, but for the months from November toMarch, the worker would be considered ‘retired’ and draw from the pension plan. Neither of

Trans 27th ICA Robert L. Brown (Canada)
25
these arrangements exist today within a normal pension plan (in fact, they would not be allowedunder the regulations for Qualified/Registered plans), but there is nothing to stop them frombeing created actuarially.
Further, one must become aware of the fact that retirement is not a one-time, one-day event.Workers do not go from 40 hours a week to full-time leisure. It is now estimated that between30 and 50 percent of people move into their ‘final’ retirement via partial retirement, or use‘bridge jobs’ from their ‘career’ jobs into retirement, and that this process can take up to fiveyears. Further, it is the best educated workers who have been forced to retire early who are mostlikely to return to a bridge job (see McDonald, 1996, Burkhauser, 1996 and Quinn, 1997/99).Thus, what is needed is not costlier retirement benefits, but more flexible retirement benefits andadministration that can be tailored to the needs of the individual worker. The day of ‘one sizefits all’ should be over. What is needed are employers, pension plans and regulations that allowfor a longer-term transition from full-time work to full-time retirement. Workers should nothave to leave their primary or career employer to find ‘bridge jobs’. They should be able to find‘bridge jobs’ where their skills are most valuable, and that is within their career post. To dootherwise is to deny and waste a huge asset, namely the older worker.
Finally, Defined Benefit plans that are integrated with Social Security (i.e. OASDI and C/QPP)will have to be cognizant of any future benefits reductions by the government, since, dependingon the design of the plan, reductions in government benefits would be automatically matched byincreases in employer-sponsored benefits. In Canada, 82 percent of pension plan members are inintegrated plans.
--Group Benefits
As the population ages, so too will the labor force. Many of the risks covered by Employer-sponsored Group Benefits have age-related costs. Thus, as the members of the coveredworkforce age, on average there will be rising benefit costs associated with that aging.
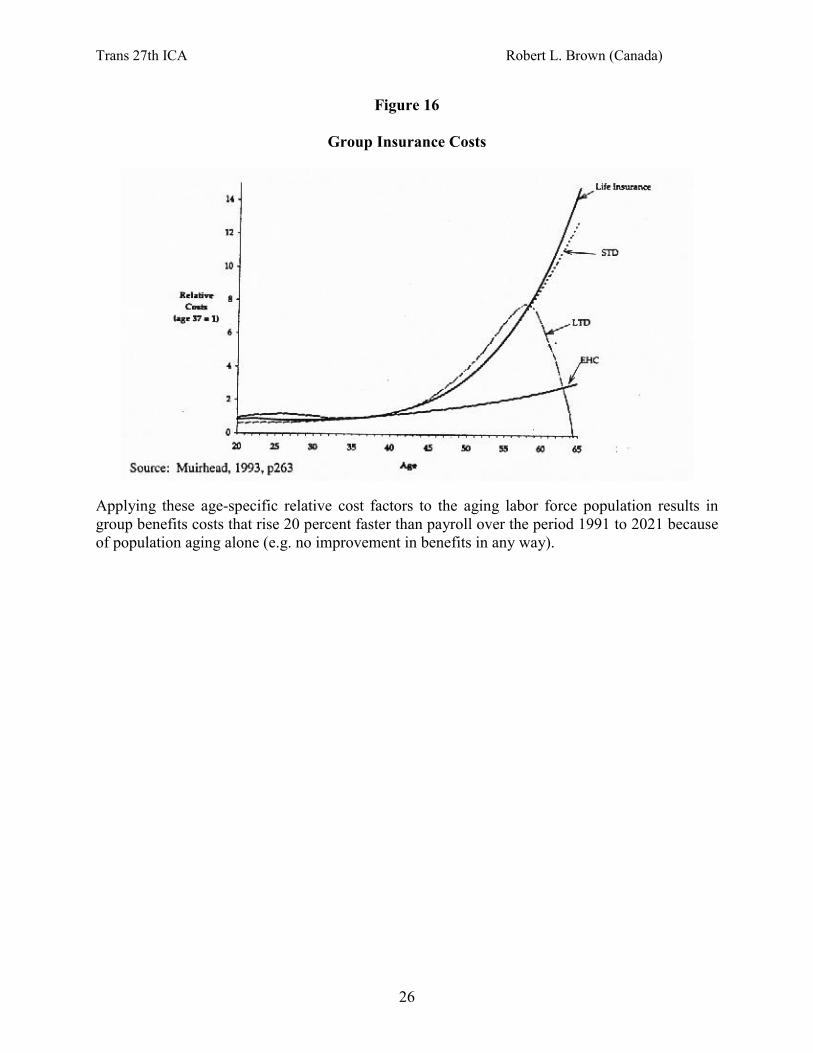
The impacts of the aging of the Canadian workforce were analyzed by Muirhead (1993). Thegrowth factors presented in his work would be similar for the United States, although theabsolute costs may differ.
Muirhead projected Group Life and Health benefits by assuming the demographics of theworkforce, by age, would mirror that of the general population from which the workforce isdrawn. Expected mortality comes from the 1985-87 Canada Life Tables. Extended Health Care(EHC) costs are based on age/sex specific Canadian cost factors. Long Term Disability (LTD)costs use the 1987 Group LTD Table and an interest rate of 8 percent. Short Term Disability(STD) is based on the 1985 CIDA Table. It is assumed that Group Dental costs are not affectedby population aging.
The relative size of these group benefit costs (age 37 = 1) is shown in Figure 16.
Trans 27th ICA Robert L. Brown (Canada)
26
Figure 16
Group Insurance Costs
Applying these age-specific relative cost factors to the aging labor force population results ingroup benefits costs that rise 20 percent faster than payroll over the period 1991 to 2021 becauseof population aging alone (e.g. no improvement in benefits in any way).
Trans 27th ICA Robert L. Brown (Canada)
27
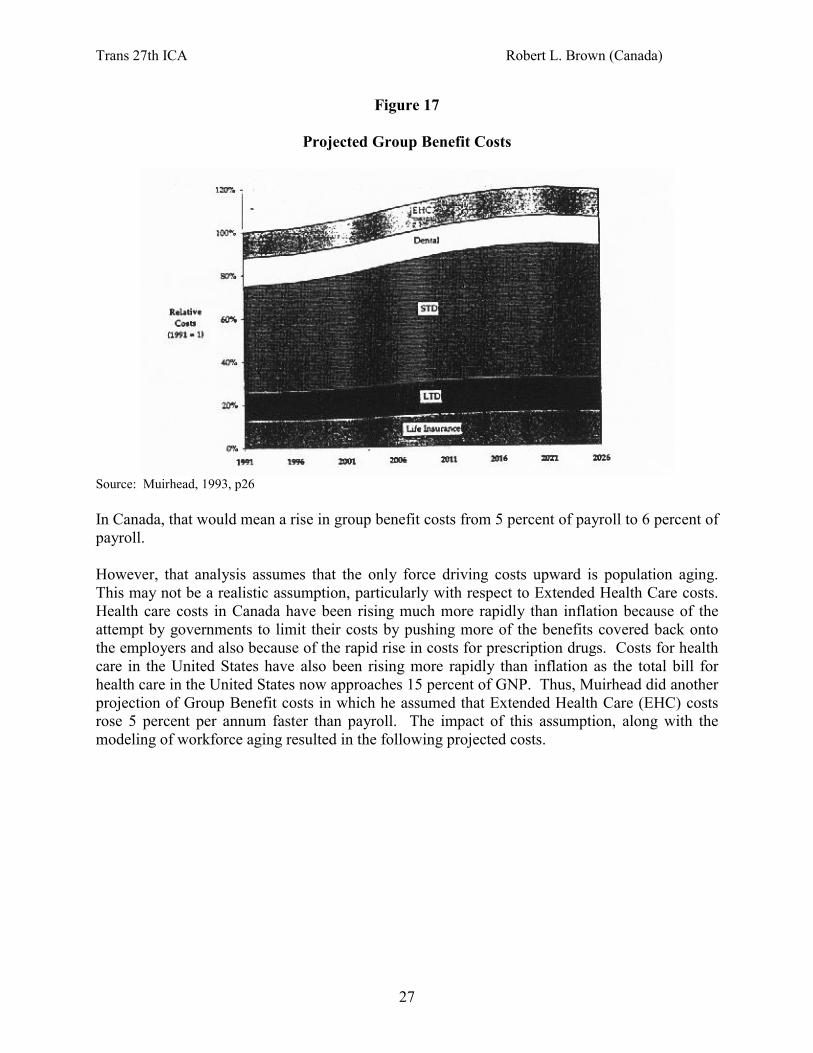
Figure 17
Projected Group Benefit Costs
Source: Muirhead, 1993, p26
In Canada, that would mean a rise in group benefit costs from 5 percent of payroll to 6 percent ofpayroll.
However, that analysis assumes that the only force driving costs upward is population aging.This may not be a realistic assumption, particularly with respect to Extended Health Care costs.Health care costs in Canada have been rising much more rapidly than inflation because of theattempt by governments to limit their costs by pushing more of the benefits covered back ontothe employers and also because of the rapid rise in costs for prescription drugs. Costs for healthcare in the United States have also been rising more rapidly than inflation as the total bill forhealth care in the United States now approaches 15 percent of GNP. Thus, Muirhead did anotherprojection of Group Benefit costs in which he assumed that Extended Health Care (EHC) costsrose 5 percent per annum faster than payroll. The impact of this assumption, along with themodeling of workforce aging resulted in the following projected costs.

Trans 27th ICA Robert L. Brown (Canada)
28
Figure 18
Projected Group Benefit Costs
Source: Muirhead, 1993, p266
In Canada, this would mean group benefit costs of 5 percent of payroll in 1991 would rise over60 percent to 8.3 of payroll in 2021, and 9 percent of payroll in 2031.
Obviously, employer/plan-sponsors will be looking for ways to minimize these impacts. Oneshould expect pressure on group benefit consultants to find ways to redesign plans in a mannerthat limits the cost risk to the employer. Thus, one should expect to see continued desires for‘Defined Contribution’ plans such as Cafeteria Plans. This also fits into the demographics thatwere explained earlier whereby employees can be expected to want a level of control over thebenefits they choose (especially if they contribute), particularly if their spouse has group benefitsthat might duplicate the coverage.
New products may have to be designed. For example, long-term care coverage, whether to fundfuture needs of existing workers, or to pay for parental care today, may be a product that will berequested by many workers and unions. It could also be offered as an individual product. This isa risk not covered by government plans in either Canada or the United States.
Finally, at the insurers’ level, labor force growth rates experienced over the last twenty years arenow history. The size of the labor force is not expected to change measurably in the near future.Thus, the ability to increase group coverage volume must come from increasing market shareand, thus, by taking business away from another carrier. Therefore, the industry should continueto expect sharp competitive pressures in this line of business.

Trans 27th ICA Robert L. Brown (Canada)
29
3. Individual Coverages
This paper has painted a gloomy picture of the capability of the government and the employer toprovide improved economic security programs in the face of population aging. However, these‘problems’ for governments and employers become opportunities for individual sales.
Individuals are extremely cynical about their security in relying on government promises forfuture social security benefits. In Canada, only 23 percent of those aged 30 to 39 are confidentthey will receive Old Age Security and C/QPP Benefits (Gallup Poll, 1994). In the UnitedStates, only 22 percent of those aged 35 to 44 expressed confidence that “in the years to come,the Social Security and Medicare systems will continue to provide benefits of equal value to thebenefits received by retirees today” (Greenwald & Associates, 1991).
Further, the level of economic security provided by government-sponsored programs is small. Inboth Canada and the United States, a worker who always earns exactly the Average IndustrialWage (AIW) and retires with nothing but social security will realize a 40 percent replacement offinal salary in retirement. That is clearly not enough to provide a consistent standard of living.Further, for workers who have wages higher than the AIW, their replacement ratio fromgovernment programs gets smaller and smaller as their wages rise.
Thus, individuals know that they must provide for their own retirement income security.Fortunately, the government provides significant tax incentives to encourage that activity.Hence, it should be an easy task for the insurance industry to promote these tax-advantagedproducts to a public that does not believe in their government-sponsored systems.
Take, for example, a worker at the Average Industrial Wage who wishes to retire with a 70percent replacement ratio. The worker has been told that the government social security systemwill provide 40 percent of that target, but that the other 30 percent must be met throughindividual savings. Assume, further, that the worker is allowed to make retirement contributionsout of before-tax income (or equivalently that these contributions are tax deductible) and that anyinvestment returns are not taxed until taken as income. Such products are called “Registered”products in Canada, and “Qualified” products in the United States.
Again, the goal of the worker is to retire with a 70 percent replacement ratio.
Were the worker to use an ordinary savings vehicle, without any tax advantages, Table 8 showsthe required percentage of salary that must be saved to fund a 70 percent replacement ratio.

Trans 27th ICA Robert L. Brown (Canada)
30
Table 8
Required Percentage of Salary that must beSaved Using Non-Tax-Advantaged Funds
For a 70 Percent Replacement Ratio
Gender Age at Which Age at RetirementSaving Starts 60 65
25 15.0 10.8Male 35 21.0 14.5
45 35.0 21.7
25 18.2 13.5Female 35 25.5 18.0
45 42.5 26.9Source: Author’s calculations
This table can be used for a number of purposes. First, it shows that without the use of qualifiedor registered funds, it is very difficult to achieve retirement income security with savings ratesthat are realistic. Second, it shows just how difficult it is to retire early. Finally, it displays thefunding requirement differences between males and females because of the longer lifeexpectancies of females (given that they buy gender-specific annuities in retirement).
Table 9, however, displays the same required percentage of salary that must be saved if one usestax-advantaged vehicles.

Trans 27th ICA Robert L. Brown (Canada)
31
Table 9
Required Percentage of Salary that must beSaved Using Tax-Advantaged FundsFor a 70 Percent Replacement Ratio
Gender Age at Which Age at RetirementSaving Starts 60 65
25 8.9 6.4Male 35 13.6 9.4
45 24.7 15.3
25 10.3 7.6Female 35 15.7 11.1
45 28.5 18.1
Source: Author’s calculations
Comparison of Tables 8 and 9 show that, depending on gender and the age at which savingsstart, the required savings rate is almost cut in half by using registered or qualified plans.However, it still costs a lot more to retire at age 60 versus age 65, and to provide income securityfor a woman than for a man.
Another example of how a problem that was previously identified in this paper can be turned intoan opportunity for an individual salesperson is the prediction that employers will try to controltheir group benefit costs in an aging workforce by limiting the total contribution they will maketo such benefit schemes and by passing the risk of higher costs over to the employee (e.g.through Defined-Contribution Cafeteria Plans). Any reduction in group benefits that resultsclearly creates the need for individual coverage to fill the gap. Also, a highly mobile workforceis one that may not feel secure about the constancy of group benefits. Now only will there beperiods of no coverage when one is between jobs, but there will be inconsistencies in coveragefrom one employer to the next that will encourage workers to provide more in the way ofindividual coverage. The growing percentage of workers who are self-employed and/or contractworkers will expand this market.
In total, the aging population, once understood, should be a positive force for those working inthe design and sales of individual economic security products.
V One Last Problem
So far, this paper has been a balance of problems and opportunities. In fact, each problem seemsto create an equal opportunity for someone in the industry.

Trans 27th ICA Robert L. Brown (Canada)
32
However, there is one economic reality that must be faced that may prove difficult for anindustry that promises to provide economic security for its customers and clients.
We are today in the midst of the longest bull market ever seen. Why is this? One reason has tobe the demographics of the investment market. The Baby-Boom is in its period of saving forretirement either individually or through an employer-sponsored pension plan. This shouldcontinue for at least another twenty years. That does not mean that there will be a continuousbull market for another twenty years—that will be decided by a myriad of economic forces (e.g.the Asian flu). However, it can be said that there will be a continuation of macro-economicsavings by individuals for the next twenty years which will provide upward pressure on stockvalues. (This basic economic law of supply and demand could be debated if one were to assumean infinite supply of good-quality shares).
But what happens when the Baby-Boom retires? What happens when they turn to theirconsumption phase and wish to liquidate their savings?
Figure 19 gives an indication of how rapidly and significantly these forces could change.

Trans 27th ICA Robert L. Brown (Canada)
33
Figure 19
Net Flow of Assets Into or Out ofPension and Retirement Savings
1995 to 2065
It is well and good to tout the marvels of the stock market when times are good, and when thesupply of investable dollars is large and growing. But what is the real value of those stocks (i.e.is it their quoted NYSE price listing)? Their real value is the goods and services produced by thecompanies they represent. If there is no production of goods and services, then there is zerovalue to these shares. Similarly, if there is no production of goods and services, there can be notransfer of wealth from workers to retirees through the proxy of a social security system.
But what happens to government-sponsored social security, to employer-sponsored pensionassets, and to individual savings when everyone wants to liquidate and consume, but notproduce? Will the projected liquidation displayed in Figure 18 happen? The answer is—itcannot. There will not be an absolute stock market meltdown, because other economic forceswill intervene. Clearly the world of Figure 18 is one where there would be more demand forconsumables than there would be production of consumable goods and services. This would beoccuring at the same time as the asset values of the retired population would, in theory, beplummeting (and this scenario would hold also for their fixed assets such as their homes) againbecause of a supply and demand dis-equilibrium.

Trans 27th ICA Robert L. Brown (Canada)
34
But Economics 101 has the answer to this apparent problem. Were there to be such a dis-equilibrium, the price of consumables would rise and the value of assets being liquidated wouldfall until a new equilibrium would be reached. That, in turn, implies that the retirees of the nextcentury will not do as well as they might today anticipate. They will have to pay more for goodsand services than they may anticipate, and pay these increased costs with deflated asset values.
But, fortunately, there is another solution--one to which the paper has already alluded.
The equilibrium between production and consumption (and the equilibrium that will assure sharevalues) can be maintained if we find a way to produce more goods and services when needed.That can be achieved in two ways. First, we can maintain or increase the size of the labor force.Second, we can increase the productivity of every worker.
Maintaining or increasing the size of the labor force will most likely necessitate the provision ofsignificant incentives for workers to stay active longer, as outlined earlier. Work by Brown,Damm and Sharara (1999) has shown that the extra period of work that would be necessary tomaintain economic balance, is not as dramatic a shift as one might presume.
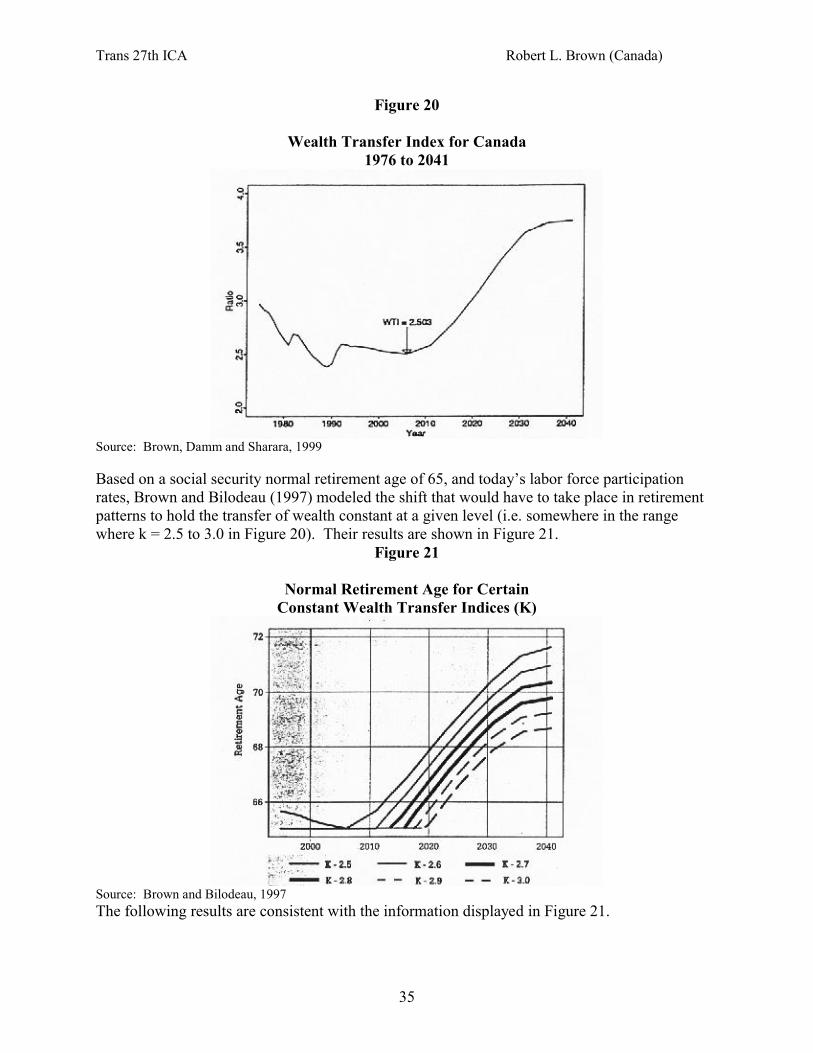
Brown et.al. looked at the demands that would exist for transfer of wealth as the Baby-Boomretired (i.e. demands from dependent Canadians to share in the production of workers). Theirresults are displayed in Figure 20. The numeric value of the Wealth Transfer Index has nomeaning in and of itself. It is only the shift in the demand for wealth transfers that is important.
Trans 27th ICA Robert L. Brown (Canada)
35
Figure 20
Wealth Transfer Index for Canada1976 to 2041
Source: Brown, Damm and Sharara, 1999
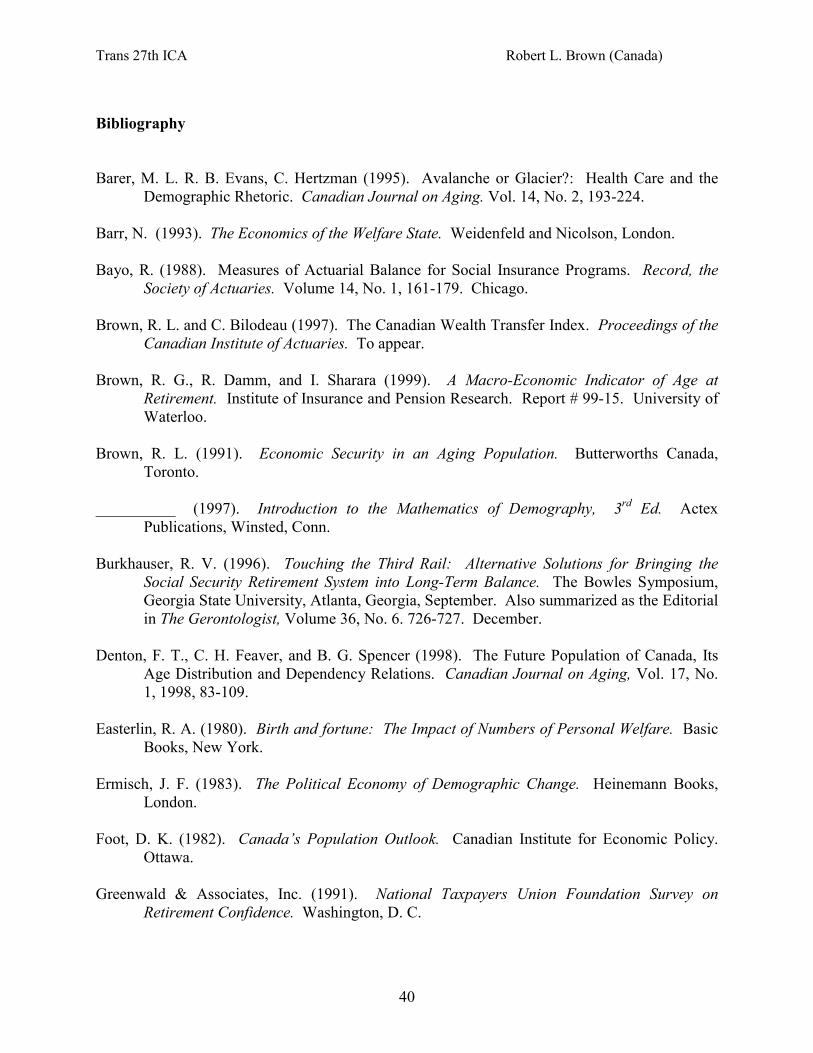
Based on a social security normal retirement age of 65, and today’s labor force participationrates, Brown and Bilodeau (1997) modeled the shift that would have to take place in retirementpatterns to hold the transfer of wealth constant at a given level (i.e. somewhere in the rangewhere k = 2.5 to 3.0 in Figure 20). Their results are shown in Figure 21.
Figure 21
Normal Retirement Age for CertainConstant Wealth Transfer Indices (K)
Source: Brown and Bilodeau, 1997The following results are consistent with the information displayed in Figure 21.

Trans 27th ICA Robert L. Brown (Canada)
36
If ‘society’ deemed that it would only support a wealth transfer index of 2.5, then the normalretirement age would have to shift from age 65, starting in 2006, to age 71.6 by 2041. If, on theother hand, a wealth transfer index of 3.0 is deemed affordable, then no shift in the normalretirement age would be necessary until 2019, and the normal retirement age in 2041 would be68.6.
The work of Brown and Bilodeau only analyzed government transfer of wealth througheducation, unemployment insurance, health care, and social security. However, the labor forceparticipation rate shifts that would have to take place on a macro-economic level would parallelthese indications. However, instead of talking about shifting the retirement age from 65 to 69(say), we might be looking at a worker who would now expect to retire at age 60 staying thelabor force until age 64. Thus, to maintain a constant wealth transfer capability should requireworkers to stay active between four and six extra years. That is all.
Brown and Bilodeau argue that that might be acceptable in terms of public policy because lifeexpectancy has improved measurably this half century with no commensurate rise in the age ofentitlement for social security. Brown and Bilodeau show for Canada (which introduced theC/QPP and GIS in 1966) the retirement age that would keep life expectancy (and hence theexpected period of receipt of social security benefits) constant at its 1966 level.
Table 10
Retirement Age for Equivalent Life Expectancy
Year Male Female Combined
1966 65.0 65.0 65.01981 66.5 67.8 67.22001 69.2 69.9 69.62021 71.5 71.7 71.62041 73.8 73.6 73.7
Source: Brown and Bilodeau, 1997
Thus, it can be seen that the shift required in labor force participation is less than the shift inimproved life expectancy over the period of analysis. It is this author’s opinion that this is,therefore, a saleable public policy stance. As an aside, it is interesting that while the UnitedStates has already announced a two-stage rise in the normal retirement age for OASDI, from age65 to age 67, Canada rejected that as a public policy initiative in the latest round of socialsecurity reforms.
What may be more important in this analysis is that the rise in normal retirement age proposedby Brown and Bilodeau (i.e. four to six years of extra labor force participation) does not includeany assumed improvement in worker productivity. This is an important element.
Today, in both Canada and the United States there are close to five workers for every retiredelderly person. However, by the year 2040 it is projected that that ratio will be closer to 2.5-to-

Trans 27th ICA Robert L. Brown (Canada)
37
one (assuming today’s labor force participation rates remain unchanged). This means aneffective doubling of the demands per worker to provide goods and services to the retiredelderly. However, if every worker could become twice as productive between now and 2040,then the required transfer of wealth from workers to retirees could occur without any shift inlabor force participation rates. A doubling of productivity over a forty year period requires only1.7 percent real growth in productivity per annum. These were growth rates that were achievedin the 1950’s, but have not been seen over the past decade. However, with proper education ofthe workforce and sufficient capital investment per worker, there is no reason why these growthrates could not be achieved, and the problem solved, with no shift in the age at retirement.
Brown, Damm and Sharara (1999) have analyzed the impact that productivity would have on themodels created by Brown and Bilodeau. Assuming a 0.9 percent per annum increase inproductivity (which is exactly what was achieved in Canada from 1976 to 1998) Brown et. al.showed that the following median retirement ages (in Canada) would result in a constantequilibrium between the production and consumption of goods and services.

Trans 27th ICA Robert L. Brown (Canada)
38
Figure 22
Median Retirement Age in Canada (1996 to 2047)
Source: Brown, Damm, Sharara, (1999, p8)
From Figure 22 we can see that the median retirement age needed to achieveproduction/consumption equilibrium can decrease until 2017, where it reaches a local minimumof 60.3 years. After this date, even with 0.9% per annum increases in productivity, the medianretirement age must rise to achieve the production/consumption equilibrium. The increase isprojected to last until 2034 when the median retirement age reaches a local maximum of 60.9years. After that, the retirement age is again projected to decrease (to 60.6 in 2041 and 60.0 in2047).
The author does not present this analysis as goals that can be achieved if correct public policy islegislated (e.g. a rise in the age of eligibility for social security) but rather events that areinevitable in a stable economy.
VI Conclusion
In discussing many of the aspects of population aging reviewed in this paper, many authors usethe word “crisis”. For example, a recent analysis of social security systems around the world bythe World Bank (1994) was entitled: “Averting the Old Age Crisis”.
The word “crisis” is very interesting. It requires two Chinese characters for a literal translation.In turn, if these two Chinese characters are translated back into English, their literal translationis: “dangerous opportunity”.

Trans 27th ICA Robert L. Brown (Canada)
39
For those responsible for the design, pricing and marketing of Life, Health and Pension products,the aging population is, indeed a “dangerous opportunity”. The workers and consumers of bothCanada and the United States are desperately seeking economic security. With each passing day,they have less and less faith in the ability of their governments to provide them with thatsecurity. Instead, they are looking to the private insurance sector to fill that void and supplythose products. This will be a challenge, but it will also be a great opportunity for those who areproperly prepared for it.
It is the author’s hope that some of the facts presented in this paper will help with that importantpreparation.
Trans 27th ICA Robert L. Brown (Canada)
40
Bibliography
Barer, M. L. R. B. Evans, C. Hertzman (1995). Avalanche or Glacier?: Health Care and theDemographic Rhetoric. Canadian Journal on Aging. Vol. 14, No. 2, 193-224.
Barr, N. (1993). The Economics of the Welfare State. Weidenfeld and Nicolson, London.
Bayo, R. (1988). Measures of Actuarial Balance for Social Insurance Programs. Record, theSociety of Actuaries. Volume 14, No. 1, 161-179. Chicago.
Brown, R. L. and C. Bilodeau (1997). The Canadian Wealth Transfer Index. Proceedings of theCanadian Institute of Actuaries. To appear.
Brown, R. G., R. Damm, and I. Sharara (1999). A Macro-Economic Indicator of Age atRetirement. Institute of Insurance and Pension Research. Report # 99-15. University ofWaterloo.
Brown, R. L. (1991). Economic Security in an Aging Population. Butterworths Canada,Toronto.
__________ (1997). Introduction to the Mathematics of Demography, 3rd Ed. ActexPublications, Winsted, Conn.
Burkhauser, R. V. (1996). Touching the Third Rail: Alternative Solutions for Bringing theSocial Security Retirement System into Long-Term Balance. The Bowles Symposium,Georgia State University, Atlanta, Georgia, September. Also summarized as the Editorialin The Gerontologist, Volume 36, No. 6. 726-727. December.
Denton, F. T., C. H. Feaver, and B. G. Spencer (1998). The Future Population of Canada, ItsAge Distribution and Dependency Relations. Canadian Journal on Aging, Vol. 17, No.1, 1998, 83-109.
Easterlin, R. A. (1980). Birth and fortune: The Impact of Numbers of Personal Welfare. BasicBooks, New York.
Ermisch, J. F. (1983). The Political Economy of Demographic Change. Heinemann Books,London.
Foot, D. K. (1982). Canada’s Population Outlook. Canadian Institute for Economic Policy.Ottawa.
Greenwald & Associates, Inc. (1991). National Taxpayers Union Foundation Survey onRetirement Confidence. Washington, D. C.

Trans 27th ICA Robert L. Brown (Canada)
41
Health and Welfare (1989). Charting Canada’s Future: A Report of the Demographic Review.Ministry of Supply and Services. Ottawa.
Hertzman, C., J. Frank, and R. G. Evans (1994). Heterogeneities in Health Status, in Why Aresome People Healthy and Others Not? Edited by R. G. Evans, M. L. Barer and T. R.Marmor, Aldine de Gruyter, New York.
Latulippe, D. (1996). Effective Retirement Age and Duration of Retirement in the IndustrialCountries Between 1950 and 1990. Issues in Social Protection. Discussion Paper No. 2,Social Security Dept. International Labour Office, Geneva.
Levy, F. and R. C. Michel (1985). Are Baby Boomers Selfish? American Demographics Vol. 7,No. 4, April, pp 39-44.
Maclean’s Magazine (1998). Women: Dominant Force in Automotive Market. AdvertisingSupplement, p6, August 17.
Marshall, V. W. (1987). Canada, Social Perspectives, 2nd ed. Fitzhenry and Whiteside,Markham, Ontario.
McDonald P. L. (1996). Transitions into Retirement: A Time for Retirement. Final Report.Human Resources Development, Canada. August.
Menard, Jean-Claude (1992). Presentation of the QPP Actuarial Report. Proceedings of theCanadian Institute of Actuaries. Vol. XXIII, No. 1, 261-271. Ottawa
MetLife (1999). Early Retirement in the United States. Statistical Bulletin. Vol. 80, No. 3,July-September, pp 2-7.
Muirhead, P. M. (1993). “The Aging Population”. Proceedings of the Canadian Institute ofActuaries. Vol. XXIV, No. 2, 248-271. Ottawa.
Myers, R. J. and B. C. Schobel (1992). “An Updated Money’s-Worth Analysis of SocialSecurity Benefits. Transactions of the Society of Actuaries, Vol. XLIV, 247-270.
Office of the Superintendent of Financial Institutions (1995). Canada Pension Plan FifteenthActuarial Report as at December 31, 1993. Ottawa.
Quinn, J. (1997a). The Role of Bridge Jobs in the Retirement Patterns of Older Americans. InPhilip deJong and Theodore Marmor (eds.), Social Security and the Labor Market.Ashgate Publishing Ltd., London, pp 91-116.
________ (1997b). Retirement Trends and Patterns in the 1990’s: The End of an Era?” ThePublic Policy Aging Report. Vol. 8, No. 3. Summer, pp 10-15.
________ (1998). New Paths to Retirement. Working Paper. To appear.

Trans 27th ICA Robert L. Brown (Canada)
42
Schieber, S. and J. Shoven (1996). “Where Your Bull Is?” New York Times, Sunday, March 10,New York.
Statistics Canada. Life Tables, Canada and the Provinces. Several. Ministry of Supply andServices. Ottawa.
United States, Bureau of the Census (1993). We the American Elderly. September.
United States Department of Commerce (1993). An Aging World II: International PopulationReport Series P-95:92-3. February. Wahington: Bureau of the Census.
United States National Center for Health Statistics. United States Life Tables. DHHS. Several.Hyattsville, Md.
Walker, A. (1990). The Economic ‘Burden’ of Ageing and the Prospect of IntergenerationalConflict. Ageing and Society (10), 377-394.
World Bank (1994). Averting the Old Age Crisis: Policies to Protect the Old and PromoteGrowth. A World Bank Policy Research Report, New York, Oxford University Press.