IMPACTS OF VEGETATION ON THE CHARACTERISTICS OF THE …utpedia.utp.edu.my/15635/1/Final...
41
IMPACTS OF VEGETATION ON THE CHARACTERISTICS OF THE FLOW: MANNING ROUGHNESS COEFFICIENTS FOR OPEN CHANNEL By NUR LIYANA AFIQAH BINTI ABD WAHID 14906 FINAL YEAR PROJECT REPORT Submitted to the Civil Engineering Programme in partial fulfilment of the requirement for the Bachelor of Engineering (Hons) (Civil Engineering) Universiti Teknologi PETRONAS Bandar Seri Iskandar 31750 Tronoh Perak Darul Ridzuan. © Copyright 2015 by Nur Liyana Afiqah binti Abd Wahid, 2015
Transcript of IMPACTS OF VEGETATION ON THE CHARACTERISTICS OF THE …utpedia.utp.edu.my/15635/1/Final...

IMPACTS OF VEGETATION ON THE CHARACTERISTICS OF THE FLOW:
MANNING ROUGHNESS COEFFICIENTS FOR OPEN CHANNEL
By
NUR LIYANA AFIQAH BINTI ABD WAHID
14906
FINAL YEAR PROJECT REPORT
Submitted to the Civil Engineering Programme in partial fulfilment of the requirement for the
Bachelor of Engineering (Hons)
(Civil Engineering)
Universiti Teknologi PETRONAS
Bandar Seri Iskandar
31750 Tronoh
Perak Darul Ridzuan.
© Copyright 2015
by
Nur Liyana Afiqah binti Abd Wahid, 2015

CERTIFICATION OF APPROVAL
IMPACTS OF VEGETATION ON THE CHARACTERISTICS OF THE FLOW:
MANNING ROUGHNESS COEFFICIENTS FOR OPEN CHANNEL
By
NUR LIYANA AFIQAH BINTI ABD WAHID
14906
A project dissertation submitted to the
Civil Engineering Programme Universiti Teknologi PETRONAS
in partial fulfilment of the requirement for the Bachelor of Engineering (Hons)
(Civil Engineering)
Approved:
______________________
ASSOC PROF HJ KHAMARUZAMAN B WAN YUSOF
Project Supervisor
UNIVERSITI TEKNOLOGI PETRONAS
TRONOH, PERAK
January 2015

2
CERTIFICATION OF ORIGINALITY
This is to certify that I am responsible for the work submitted in this project, that the original
work is my own except as specified in the references and acknowledgements, and that the
original work contained herein have not been undertaken or done by unspecified sources or
persons.
____________________________
Nur Liyana Afiqah binti Abd Wahid
3
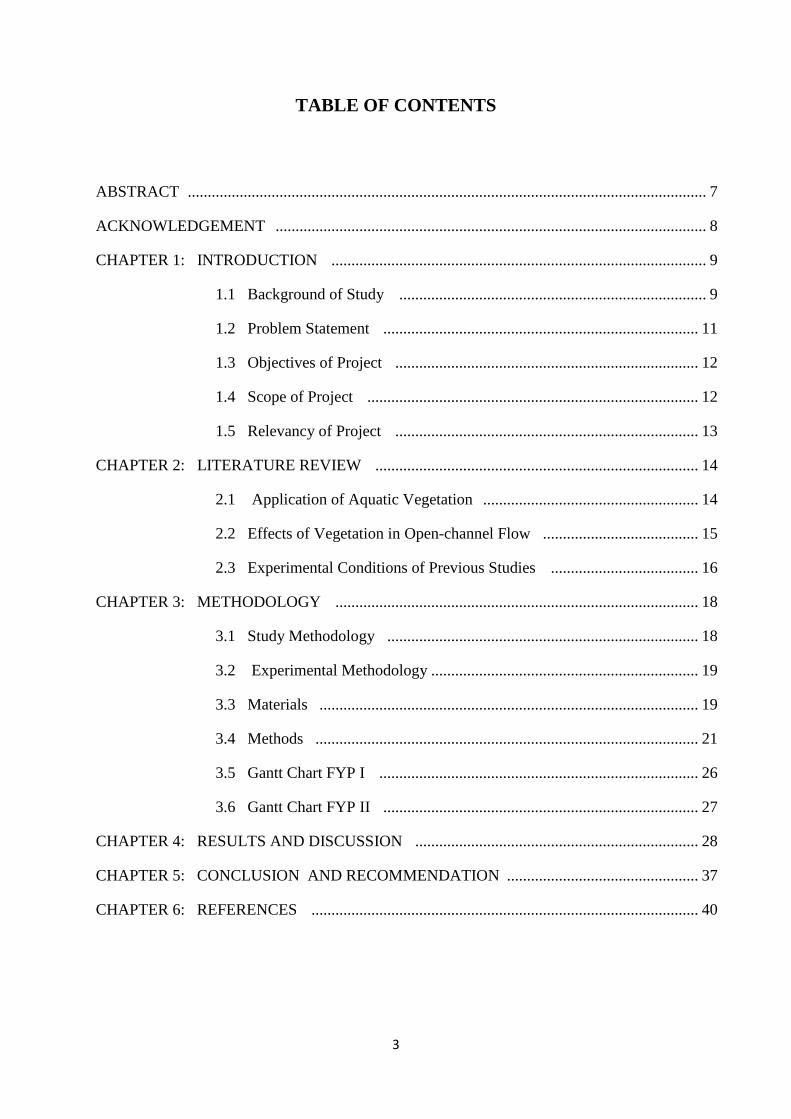
TABLE OF CONTENTS
ABSTRACT .................................................................................................................................. 7
ACKNOWLEDGEMENT ............................................................................................................ 8
CHAPTER 1: INTRODUCTION .............................................................................................. 9
1.1 Background of Study ............................................................................. 9
1.2 Problem Statement ............................................................................... 11
1.3 Objectives of Project ............................................................................ 12
1.4 Scope of Project ................................................................................... 12
1.5 Relevancy of Project ............................................................................ 13
CHAPTER 2: LITERATURE REVIEW ................................................................................. 14
2.1 Application of Aquatic Vegetation ...................................................... 14
2.2 Effects of Vegetation in Open-channel Flow ....................................... 15
2.3 Experimental Conditions of Previous Studies ..................................... 16
CHAPTER 3: METHODOLOGY ........................................................................................... 18
3.1 Study Methodology .............................................................................. 18
3.2 Experimental Methodology ................................................................... 19
3.3 Materials ............................................................................................... 19
3.4 Methods ................................................................................................ 21
3.5 Gantt Chart FYP I ................................................................................ 26
3.6 Gantt Chart FYP II ............................................................................... 27
CHAPTER 4: RESULTS AND DISCUSSION ....................................................................... 28
CHAPTER 5: CONCLUSION AND RECOMMENDATION ................................................ 37
CHAPTER 6: REFERENCES ................................................................................................. 40

LIST OF FIGURES
FIGURE 1 Example of Vegetated Plants, Limnocharis flava................................................... 9
FIGURE 2 Japanese Lawn Grass, Zoysia japonica Steud. ..................................................... 11
FIGURE 3 Cross Section of the Flume .................................................................................... 11
FIGURE 4 Channel of the Flume ............................................................................................. 12
FIGURE 5 Depth Gauge............................................................................................................ 13
FIGURE 6 Installation of Japanese Lawn Grass, Zoysia japonica Steud. ............................ 14
FIGURE 7 Overview of Study Methodology ........................................................................... 18
FIGURE 8 Proposed Experimental Approach ........................................................................ 19
FIGURE 9 Rectangular Flume ................................................................................................. 20
FIGURE 10 Illustration of Dimension of the Flume ............................................................... 20
FIGURE 11 Digital Depth Gauge ............................................................................................. 21
FIGURE 12 Current Meter ....................................................................................................... 21
FIGURE 13 Depth Gauge.......................................................................................................... 22
FIGURE 14 Vegetation Plank ................................................................................................... 22
FIGURE 15 Measurement of Japanese Lawn Grass .............................................................. 23
FIGURE 16 Flow Meter Reading ............................................................................................. 24
FIGURE 17 Schematic Diagram Inside of the Flume ............................................................ 28
FIGURE 18 Flow Transition for Vegetated Zone ................................................................... 29
FIGURE 19 Graph of Flow Depth vs Sections in Flume for 1:500 Slope .............................. 33
FIGURE 20 Graph of Flow Depth vs Sections in Flume for 1:300 Slope .............................. 35

5
LIST OF TABLES
TABLE 1 Studies on Vegetated Open-channel Flow ............................................................. 16
TABLE 2 Other Names of Japanese Lawn Grass .................................................................. 23
TABLE 3 Height Vegetation Readings .................................................................................... 30
TABLE 4 Data Analysis for Slope 1:500 ................................................................................. 31
TABLE 5 Manning’s Roughness Computation for the slope at 1:500 ................................. 32
TABLE 6 Data Analysis for Slope 1:300 ................................................................................. 33
TABLE 7 Manning’s Roughness Computation for the slope at 1:300 ................................. 34
6
Abbreviations and Nomenclature
UTP Universiti Teknologi PETRONAS
FYP Final Year Project
JLG Japanese Lawn Grass

7
ABSTRACT
The presence of vegetation in waterways plays an important role from ecological point of
view as it can be used to improve water quality and reduce soil erosion by altering the flow
magnitude. Vegetation roughness is an important parameter in describing flow through river
systems. Vegetation impedes the flow, which affects the stage-discharge curve and may
increase flood risks. To understand the impact of vegetation flow, an experimental approach
using a field channel is adopted. The present study will consider natural vegetation in a
rectangular flume located in Universiti Teknologi PETRONAS. Geometrical dimensions of
the drainage system, vegetation properties and flow parameters such as flow depth, velocity
and discharges will be measured for different inflow scenarios into the drainage system.
Subsequently, several flow scenarios will be allowed to pass through the vegetation array
emerging from the water surface and when fully submerged.
Vegetation can influence the transport of sediment and contaminants by changing the mean
velocity and turbulent flow structure in channels. It is important to understand the hydraulics
of the flow over vegetation in order to manage the process. Experiments in an open-channel
flume with natural vegetation were carried out to study the influence of vegetation on the
flows. In a half channel with different densities, slope, flow velocity, the height of the natural
vegetation and the flow transition between the vegetated zone and non-vegetated zones in
different flow regimes. In this paper a number of roughness descriptions are compared. All
descriptions give a reasonable fit to experimental flume data. At large submergence ratios
vegetation roughness can be approximated by a constant Manning coefficient.

8
ACKNOWLEDGEMENTS
All praise to Almighty for his mercy as He gave the author the strength and ability to
complete Final Year Project. The author is very pleased to acknowledge all of those
individuals and organizations that helped make this book possible. Firstly the author would
like to acknowledge her project supervisor, Assoc Prof Hj Khamaruzaman B Wan Yusof for
the invaluable advice and supervision throughout the progress of the research. During the
progress of FYP, Mr. Mujahid Muhammad, a PhD student has provided me lots of
information that is related to the project as well as provided valuable experience on the
subject as this topic was under his research too.
The author would also like to dedicate this appreciation to Dr Izma and Dr Raza for their
assistance and guidance and to a number of people for their cooperation in easing the learning
process. Last but not least, the author dedicate thousands appreciation to the beloved family,
colleagues and also to those who were involved directly or indirectly in guiding the author
throughout the whole duration of Final Year Project and completing this final report.
9
CHAPTER 1
INTRODUCTION
1.1 Background of Study
Vegetation can be found growing naturally on the beds of channels or on the riverbanks or
where it has been purposely planted. It is often classified by its shape and the locations where
it grows. Vegetation growing on the river floodplains typically comprises various
combinations of trees, herbs, shrubs, hedges, bushes and grasses. The vegetation in channel
usually consists of aquatic plants and these may be divided into four categories: emergent,
submerged, floating-leaf, and free-floating leaf. The presence of vegetation in river channels
provides both benefits and problems. From an environmental point of view, aquatic plants are
essential parts of natural aquatic systems and form the basis of a water body’s health and
productivity. And from an engineering point of view, vegetation can improve the strength of
bank materials through buttressing and root reinforcement.
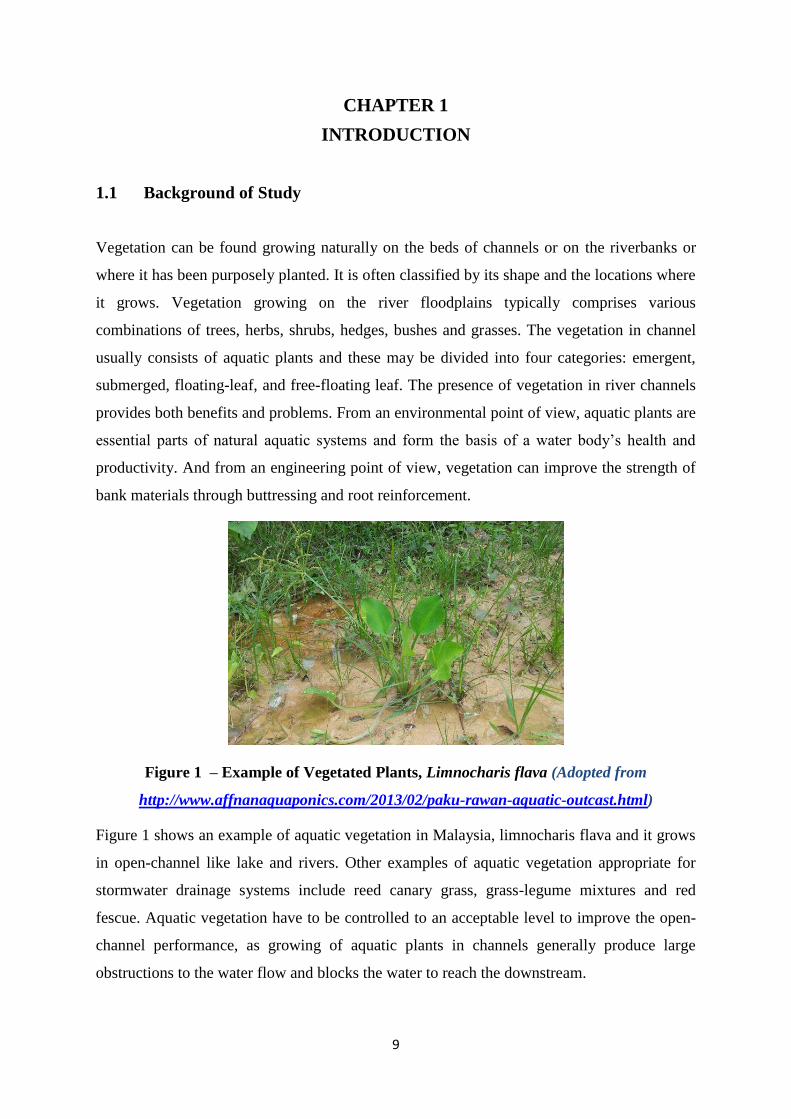
Figure 1 – Example of Vegetated Plants, Limnocharis flava (Adopted from
http://www.affnanaquaponics.com/2013/02/paku-rawan-aquatic-outcast.html)
Figure 1 shows an example of aquatic vegetation in Malaysia, limnocharis flava and it grows
in open-channel like lake and rivers. Other examples of aquatic vegetation appropriate for
stormwater drainage systems include reed canary grass, grass-legume mixtures and red
fescue. Aquatic vegetation have to be controlled to an acceptable level to improve the open-
channel performance, as growing of aquatic plants in channels generally produce large
obstructions to the water flow and blocks the water to reach the downstream.
10
The aquatic vegetation along the bed and banks of rivers, mainly the open-channel plays an
important role on the hydrodynamic behaviour, the ecological equilibrium and the
characteristics of the river. The aquatic vegetation in open-channel faces the problem of
resistance that formed by concentrated colonies of vegetation. The presence of vegetation
plays an important role from ecological point of view as it can be used to improve water
quality and reduce soil erosion.
This vegetation inside and at the edge of rivers may significantly affect hydrodynamic
behaviour of the flow, and will also affect the sediment transport by obstructing the flow and
changing the flow characteristic such as the mean velocity and turbulence flow structure in
channels. Most of the previously studies focus on the flow resistance, using traditional
numerical simulations based only on the algebraic stress model with the vegetation as an
internal resistance as stated by Wang (2008).
Stormwater management has been promoted for number of years in response to a need to
manage urban runoff. Storwater usually discharge to open-channel like rivers and lake and
increasing of runoff may cause flooding. Urban areas tend to have more runoff and less
infiltration and evaporation than forested or grassland areas. Stormwater is rainwater that
runs off streets, lawns, drains and other sites. When stormwater is absorbed into the ground, it
is filtered and ultimately replenished aquifers or flows. Open-channel systems involve a free
surface subject to atmospheric pressure and treat this stormwater runoff through combination
of filtration through vegetative cover and infiltration. However, the presence of vegetation in
open-channel flow sometimes regarded as a problem because it can reduce flow capacity,
with implications for flooding. Floods occur when large volumes of runoff flow quickly into
streams and rivers. Konrad(1993) stated that removing vegetation and soil, grading the land
surface, and constructing drainage networks increase runoff to streams from rainfall and
snowmelt. As a result, the peak discharge, volume, and frequency of floods increase in
nearby streams.
The study of the impact of vegetation on water flow in an open-channel has its particular
importance. The presence of vegetation in open-channels like rivers influences significantly
the velocity and the depth flow. The vegetation properties like height, size and density will be
measured and studied. There will be three types of flow that going to pass through the
vegetation like laminar, transitional and turbulent flow. The velocity and discharge profiles
11
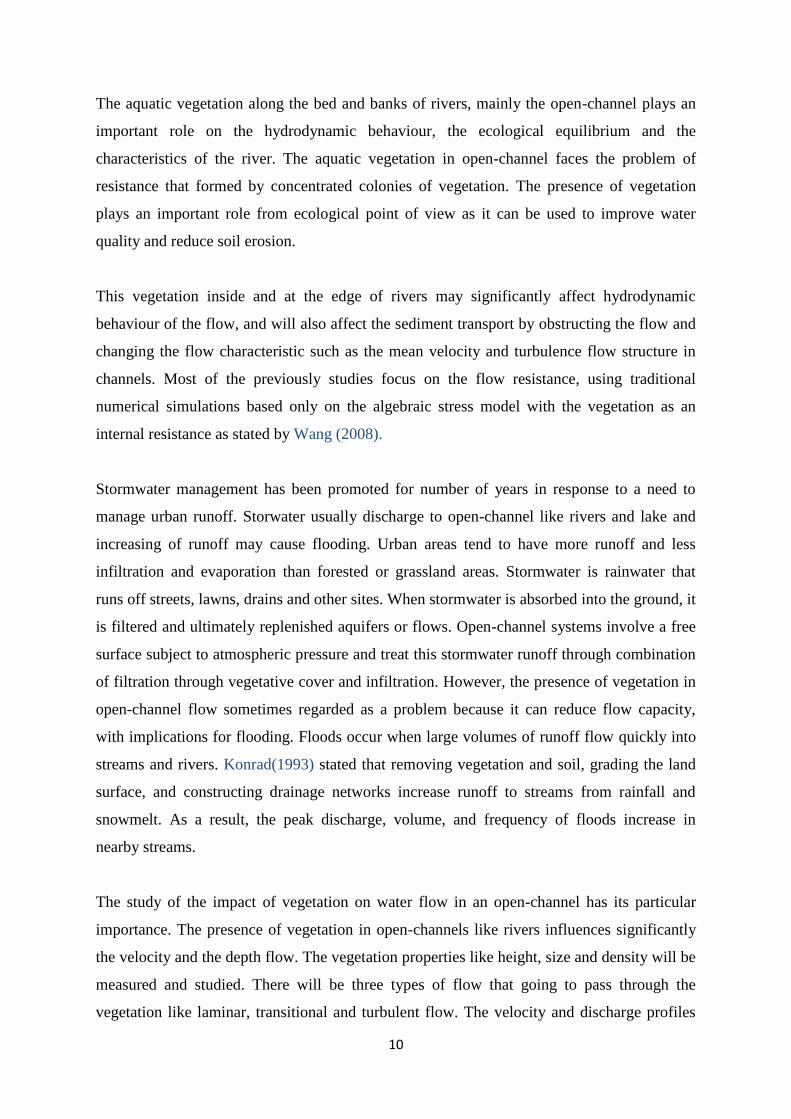
will be drawn based on the vegetation roughness. A good management of stormwater
drainage systems at the source will give a better water quality at the downstream area.
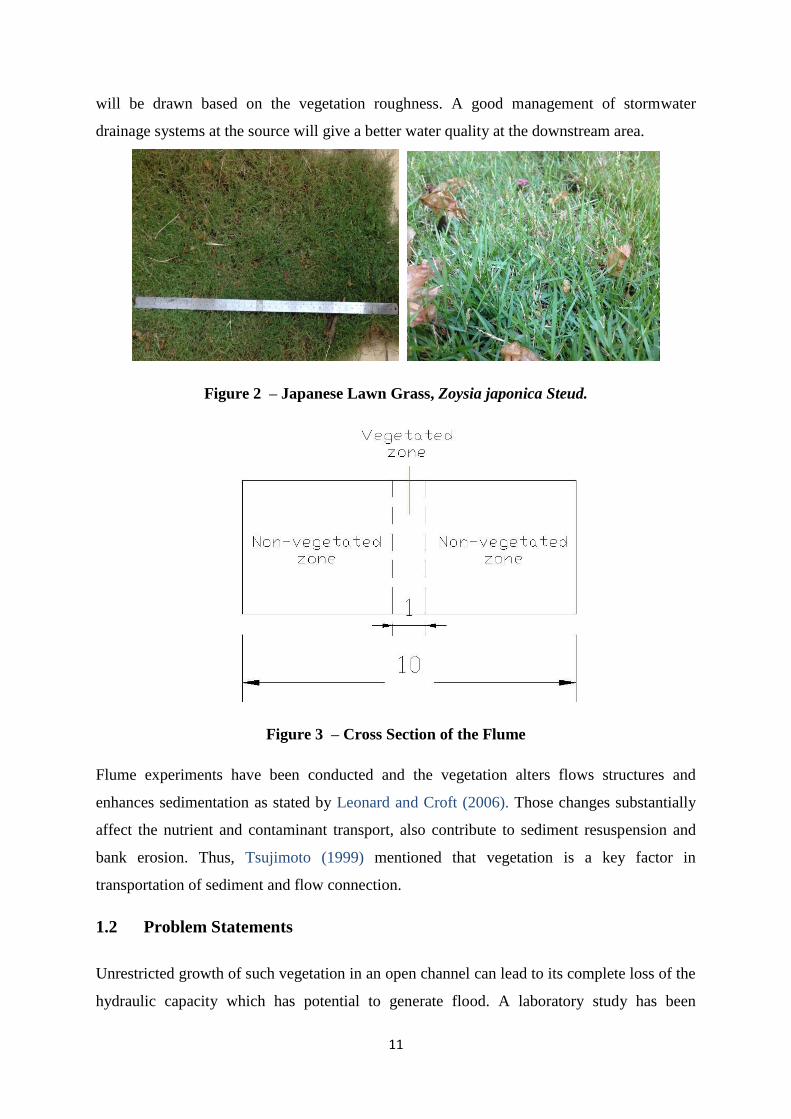
Figure 2 – Japanese Lawn Grass, Zoysia japonica Steud.
Figure 3 – Cross Section of the Flume
Flume experiments have been conducted and the vegetation alters flows structures and
enhances sedimentation as stated by Leonard and Croft (2006). Those changes substantially
affect the nutrient and contaminant transport, also contribute to sediment resuspension and
bank erosion. Thus, Tsujimoto (1999) mentioned that vegetation is a key factor in
transportation of sediment and flow connection.
1.2 Problem Statements
Unrestricted growth of such vegetation in an open channel can lead to its complete loss of the
hydraulic capacity which has potential to generate flood. A laboratory study has been

12
conducted to analyse the effects of different types of vegetation to the velocity and on the
Manning roughness coefficient, n in an open channel on the hydraulic roughness. Vegetation
was being eliminated in waterways to improve conveyance capacity without pay attention on
potential ecological benefits. The presence of vegetation in open-channel is sometimes
regarded as a problem because it can reduce flow capacity, with implications for flooding.
The constant Manning's value is normally used in practice for all flow and vegetation
conditions. Effect of flow depth and velocity on vegetation roughness is considered.
1.3 Objectives of Study
The objectives of this study are listed as follows:
i. To determine the effect of vegetation on flow characteristics.
ii. To establish relationship between Manning’s vegetative roughness and flow depth and
density of vegetation.
1.4 Scopes of Study
This study is limited towards examining the flow of water by using the vegetated field
channel of Universiti Teknologi PETRONAS. There will be planting of natural vegetation in
part of the channel cross-section of a flume and allow the flow of water to pass through the
vegetation.
Figure 4 – Channel of Flume
Instruments like depth gauge, digital water velocity meter and current meter will be used in
measuring the depth flow, velocity and magnitude of discharge as shown in Figure.
Manning’s equation will be used in modelling the hydraulic characteristics of flow through
the vegetated open-channel flow.

13
Figure 5 – Depth Gauge
1.5 Relevancy of Study
It is very important to determine the predicted velocity, depth of flow and magnitude of
discharge of water in order to address the related issues like flood impact. Therefore, the
conventional method is applied to gather and monitor the forecasted data which is the flume
experiments. In this study, the impact of vegetation on the characteristics of the flow in an
open-channel is being investigated experimentally. The presence of aquatic vegetation in an
open-channel and rivers influences significantly the velocity, the depth flow and magnitude
of discharge. Therefore, the study is very vital for understanding and managing rivers,
wetlands, flood plains and any similar aquatic environment through the application of open-
channel flow principles.
14
CHAPTER 2
LITERATURE REVIEW
2.1 Application of Aquatic Vegetation
Vegetation is an important part of any aquatic system, but sometimes it can get out of control
and create problems. Aquatic vegetation is generally divided into three major classes which
are the submerged, emergent, floating plants as proposed by Yang et. Al. (2001). Submerged
plants are rooted plants with most of their vegetative mass below the water surface, although
some portions may stick above the water. One discerning characteristic of submerged plants
is their flaccid or soft stems. Emergent plants are rooted plants often stand above the surface
of the waters. The stems of emergent plants are stiff and firm. Floating plants, however,
growing mainly in areas of slow flow waters and being rarely seen around open-channels,
hence, will not be covered in this study.
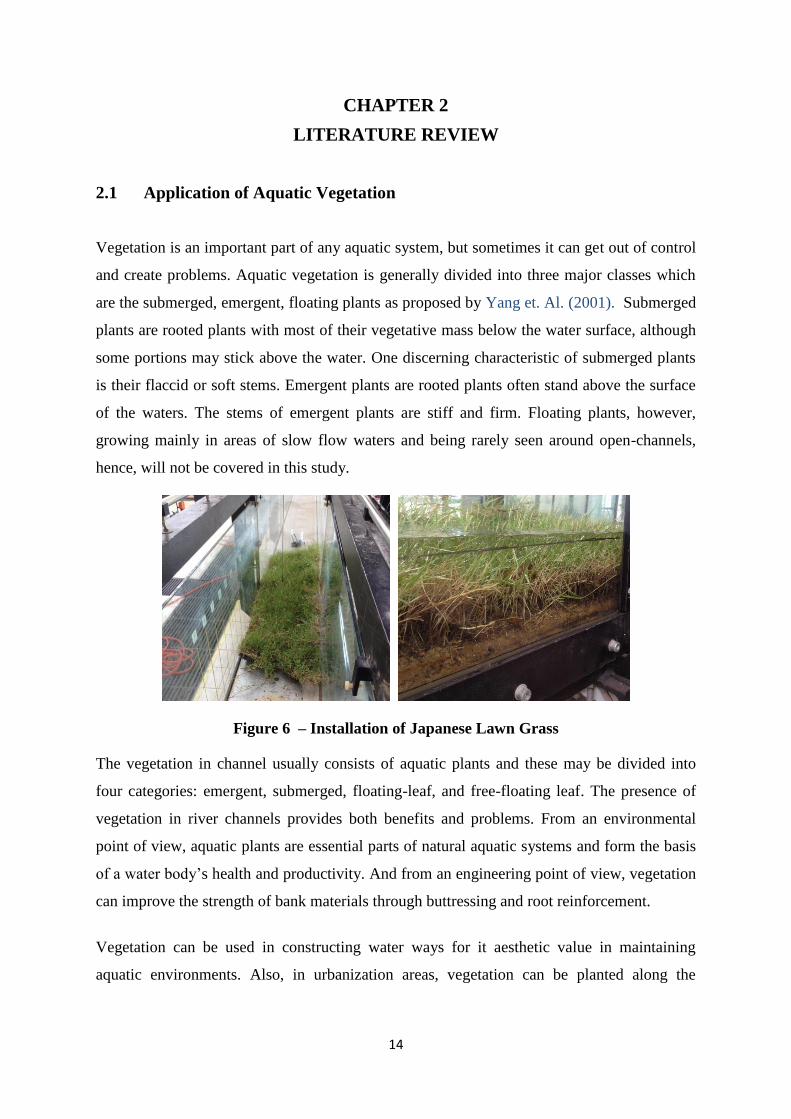
Figure 6 – Installation of Japanese Lawn Grass
The vegetation in channel usually consists of aquatic plants and these may be divided into
four categories: emergent, submerged, floating-leaf, and free-floating leaf. The presence of
vegetation in river channels provides both benefits and problems. From an environmental
point of view, aquatic plants are essential parts of natural aquatic systems and form the basis
of a water body’s health and productivity. And from an engineering point of view, vegetation
can improve the strength of bank materials through buttressing and root reinforcement.
Vegetation can be used in constructing water ways for it aesthetic value in maintaining
aquatic environments. Also, in urbanization areas, vegetation can be planted along the

15
drainage system in order to improve the water quality by at least the settling of sediments as a
result of decrease in flow velocity in vegetated open-channel flow.
2.2 Effects of Vegetation in Open-channel Flow
There are numbers of studies (as in the case of Helmio (2005); Chen et al. (2009); Afzalimehr
et al. (2011); Huthoff (2013); Wu et al. (1999); Freeman et al. (2000); Kuwen and Fathi
Moghadem (2000) which proposed for several application of forecasting technique to predict
the water flow in the open-channel. In fact, an accurate and reliable forecasting technique is
vital to maintain the operational open-channel management as well as to prevent and
minimize the flooding impact.
However, invariably aquatic plants become over abundant or unsightly and require control.
The obvious problems related to excessive growth are retardation, a reduction in hydraulic
capacity and flooding. The effects of vegetation on the open channel vary depending on the
species, distribution, density and size of vegetation as stated by Jain (2001). Although the
flow capacity can be increased by complete or partial removal of vegetation, this solution will
lead to erosion of the banks and increase the sediment load carried by flowing water. On the
other way, unrestricted growth of such vegetation in an open channel can led to its complete
loss of the hydraulic capacity. Many studies have been conducted in previous years to
investigate the resistance to flow provide by the vegetation, using either artificial or real
vegetation at the open channel. Fathi Maghadam and N. Kouwen (1997) used pine and cedar
tree samplings to model the resistance to flow in a water flume.
The effects of vegetation on the flow structures are investigated in this paper. In previous
studies of modelling a few vegetated flows, the model was applied to an experiment flume to
study the flow field of vegetation. To study the impact of vegetation on flow, the artificial
vegetation was used to simulate vegetation roughness in the past. The estimation of these
friction factors depends on the roughness where it is a very critical point in open hydraulic
flume.
2.3 Numerous Model Equations
16
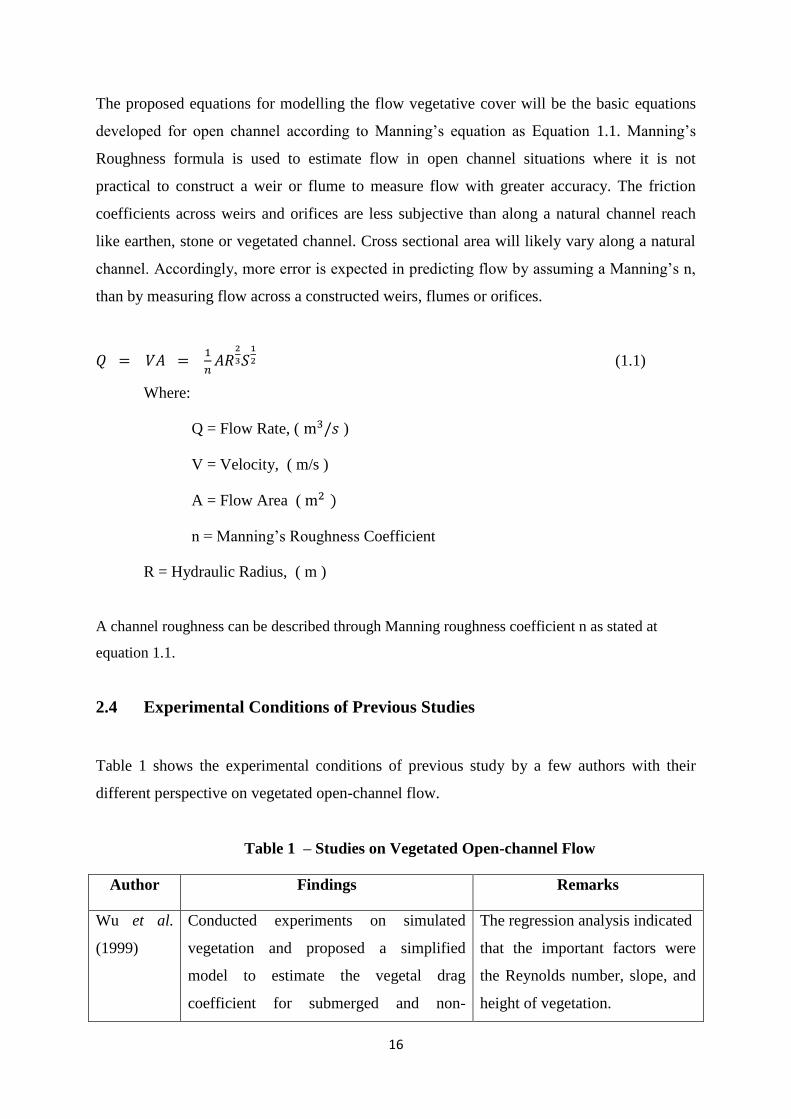
The proposed equations for modelling the flow vegetative cover will be the basic equations
developed for open channel according to Manning’s equation as Equation 1.1. Manning’s
Roughness formula is used to estimate flow in open channel situations where it is not
practical to construct a weir or flume to measure flow with greater accuracy. The friction
coefficients across weirs and orifices are less subjective than along a natural channel reach
like earthen, stone or vegetated channel. Cross sectional area will likely vary along a natural
channel. Accordingly, more error is expected in predicting flow by assuming a Manning’s n,
than by measuring flow across a constructed weirs, flumes or orifices.
𝑄 = 𝑉𝐴 = 1
𝑛𝐴𝑅
2
3𝑆1
2 (1.1) Where:
Q = Flow Rate, ( m3/𝑠 )
V = Velocity, ( m/s )
A = Flow Area ( m2 )
n = Manning’s Roughness Coefficient
R = Hydraulic Radius, ( m )
A channel roughness can be described through Manning roughness coefficient n as stated at
equation 1.1.
2.4 Experimental Conditions of Previous Studies
Table 1 shows the experimental conditions of previous study by a few authors with their
different perspective on vegetated open-channel flow.
Table 1 – Studies on Vegetated Open-channel Flow
Author Findings Remarks
Wu et al.
(1999)
Conducted experiments on simulated
vegetation and proposed a simplified
model to estimate the vegetal drag
coefficient for submerged and non-
The regression analysis indicated
that the important factors were
the Reynolds number, slope, and
height of vegetation.

17
submerged vegetation.
Freeman et
al.(2000)
Conducted flume experiments for 20
natural plant species with both
homogeneous and mixed plant spacing.
There is need for the vegetation
to be tested in different height
and sizes in order to improve it.
Kouwen
and Fathi-
Moghadam
(2000)
Used coniferous trees in air experiments
and concluded that the friction factor has
good correlation with the flow velocity.
The friction factor varied greatly
with the mean flow velocity due
to bending of the vegetation and
with flow depth caused by an
increase in the submerged
momentum absorbing area.
Helmio,
(2005)
Developed 1D flow model which was
applied to a river with partially vegetated
floodplains and found that the estimated
discharges and water depths has a good
correlation when compared to the
observed.
There is need for the model to be
tested in different sizes and
shapes of rivers, in order to
improve it.
Huthoff,
(2003)
Uses a simple hydraulic resistance model
that give slight discrepancies in estimating
flow in vegetated waterways.
Vegetation roughness changes
under submerged condition have
not been addressed.
Fathi-
Moghadam
(2006)
He studied effects of land slope and flow
depth on friction factors for non-canalized
flow.
It was found that friction factors
decrease significantly with
increase of land slope as result of
increase of flow velocity. The
friction factor increased with
increase of flow depth due to
increasing of more submerged
elements.
Baptist and
et al. (2007)
Compared some methods and solved one-
dimensional k-3 equation using an
artificial network for calculation of
Suggested that a two-
dimensional model for
calculation depth- average

18
vegetation friction factor velocity and shear stress for flow
in straight compound channel
with flood plain vegetation.
Chen et. al
(2009)
Demonstrated that the resistance
coefficient due to the vegetation is highly
related to the Manning number
exponentially.
Used a constant plant height of
10cm throughout the experiment
under submerged condition only.
Afzalimehr,
et. al.
(2011)
Investigated the turbulence characteristics
in channel with dense vegetation, and
pointed out that there is a turning point
along the velocity profile that coincides
with the maximum turbulence intensity
just above the vegetation cover.
Considers only two aspect ratios
under submerged, this will not
give adequate room to vary the
flow.

19
CHAPTER 3
METHODOLOGY
3.1 Study Methodology
Experimental approach will be adopted using a field open-channel to investigate the
hydrodynamics relating to natural vegetation instead of artificial vegetation. The final
outcomes will be finalized in a final report. The component of study methodology has been
summarized in Figure 2.
Figure 7– Overview of Study Methodology
3.2 Experimental Methodology
The present study will adopt an experimental approach using a field channel to investigate the
hydrodynamics relating to natural vegetation, by employing the principles of open-channel
flow. The proposed experimental methodology is shown as per below in order to achieve the
stated objective. The proposed experimental methodology will be executed during Final Year
Project II. Subsequently, the materials and methods to be adopted will be presented in this
study. Below is the proposed of experimental approach where the experimental tests and
measurements of the flow in an open-channel were performed using vegetation in a flume.
Literature Survey
Understanding fundamental theories
and concepts
Data Collection
Identify suitable parameter, method and
tools for the study
Laboratory Survey
Surveying on Hydraulics Lab of UTp for
experiment
Experimental Approach
Refer to Figure 8
Analysis of Results
Compare the results obtained from
experimental approach
Final Report
Compilation of all research findings,
literature reviews and final outcomes

20
Characterization of flow resistance (friction factors) due to vegetation flexible roughness for
different plant parameters was attained.
Pg
Figure 8 – Proposed Experimental Approach
3.3 Materials
3.3.1 Flume Channel
Experimental Setup
Measure the flow of water
without vegetation
Measure the flow of water
with vegetation
Setting Parameter of
Vegetation (eg. Thickness,
Height)
Allow the vegetation to grow
and record the parameter
Allow several discharge to
pass through the vegetation
Measure the depth of flow,
outflow and velocity after
vegetation
Compare

21
Figure 9 – Rectangular Flume
Figure 10 – Illustration of Dimension of the Flume
3.3.2 Depth Gauge
The depth gauge is a precision measuring instrument, designed specifically and used by
engineers to measure depths of flow. Figure 11 below shows one of the depth gauge that has
been used in the laboratory:

22
Figure 11 – Digital Depth Gauge (Adopted from
http://www.tresnainstrument.com/how_to_use_and_read_a_digital_depth_gauge.html)
3.3.3 Weighing Scale
This weighing scale will be put at the end of the open-channel to measure and calibrate the
mass of water that passes through the aquatic vegetation. The mass will be recorded at the
end of the experiment.
3.3.4 Current Meter
A current meter is an instrument used to measure the velocity of flowing water. The principle
of operation is based on the proportionality between the velocity of the water and the
resulting angular velocity of the meter rotor.
Figure 12 – Current Meter
3.4 Methods
3.4.1 Field Experimental Procedure
Flume experiment will be conducted in the laboratory of Universiti Teknologi PETRONAS.
The experiment will be conducted in the hydraulics laboratory in a rectangular flume. The
flume has length, width and height of a x b x c respectively.

23
Figure 13 – Depth Gauge
Subsequently, several discharges will be allowed to pass through the submerged vegetation
where the upstream depth of water will be measure by depth gauge, similarly the depth of the
downstream.
Figure 14 – Vegetation Plank
The experiment work will start by planting natural vegetation at the midpoint of the
rectangular flume occupying 1m length, which it will be allowed to grow. Then, the average
height of the vegetation will be determined. Subsequently, several discharges will be allowed
to pass through the submerged vegetation where the upstream depth of water will be measure
by depth gauge, similarly the depth of the downstream.

24
Figure 15 – Measurement of Japanese Lawn Grass
Table 2 – Other Names of Japanese Lawn Grass
Vegetation
(Common Name)
Scientific Name Family Name
Japanese Lawn Grass Zoysia japonica Steud. Poaceae (Gramineae)
Life Stage and Characteristic:
Plant Division : Angiosperms (Flowering Seed Plants) (Monocotyledon)
Plant Growth Form : Shrub (Creeper; Trailing), Grass & Grass-like Plant
Mode of Nutrition : Autotrophic
Plant Shape : Compact
Foliar:
Foliage Retention :
Evergreen
Mature Foliage Colour(s) :
Green

25
Mature Foliage Texture(s) :
Papery, Thin
Foliar Venation :
Parallel
Typical Foliar Area :
Microphyll ( 2.25cm2 - 20.25 cm2 )
Also, in each run the inlet discharge as well as the outlet discharges will be determined using
current meter with the rectangular flume been kept horizontal. Velocity profiles will be
measured along three cross section at x = 3.5m, 5m and 7.5m using velocity meter.
Figure 16 – Flow Meter Reading
3.4.2 Manning’s Equation (Open-channel)
Manning coefficient was highly correlated to vegetation density and inflow rate with
empirical equations that has been proposed. The Manning’s equation is an empirical equation
that applies to uniform flow in open-channels and is a function of the channel velocity, flow
area and channel slope. The Manning’s vegetation roughness was computed for different
flow rates and vegetation densities and is shown as per below:
𝑄 = 𝑉𝐴 = 1
𝑛𝐴𝑅
2
3𝑆1
2 (2)
Where:
Q = Flow Rate, ( m3/𝑠 )
V = Velocity, ( m/s )
A = Flow Area ( m2 )
n = Manning’s Roughness Coefficient

26
R = Hydraulic Radius, ( m )
S = Channel Slope, ( m )
Based on the Equation 2, the author can conclude that the higher the density of vegetation,
the value of Manning’s roughness coefficient, n is higher, hence the value of flow rate, Q will
be lower as it is inversely proportional.
The Manning’s Roughness Coefficient, n represents the roughness of friction applied to the
flow by the channel. Manning’s Roughness Coefficient is often selected from tables. In many
flow conditions the selection of a Manning’s roughness coefficient can greatly affect
computational results.
3.4.3 Mean Velocity Profiles
The vegetation in channels results in the loss of energy form and the retardance of flowing
water. However, it helps to stabilize the slopes and bottoms of open-channel. Recently,
according to Chen and Kao (2010), vegetated channels have been utilized to improve the
quality of surface water and reduce the delivery of sediment and nutrient to rivers and open-
channels. Accordingly, understanding the velocity distribution of vegetated channels is
important.
A vegetated channel, because of its flexible bed, is very different from channel beds with
rigid boundaries. Accurate discharge estimates, flow patterns and hydraulic characteristics in
vegetated channels can be obtained by studying their velocity distribution.
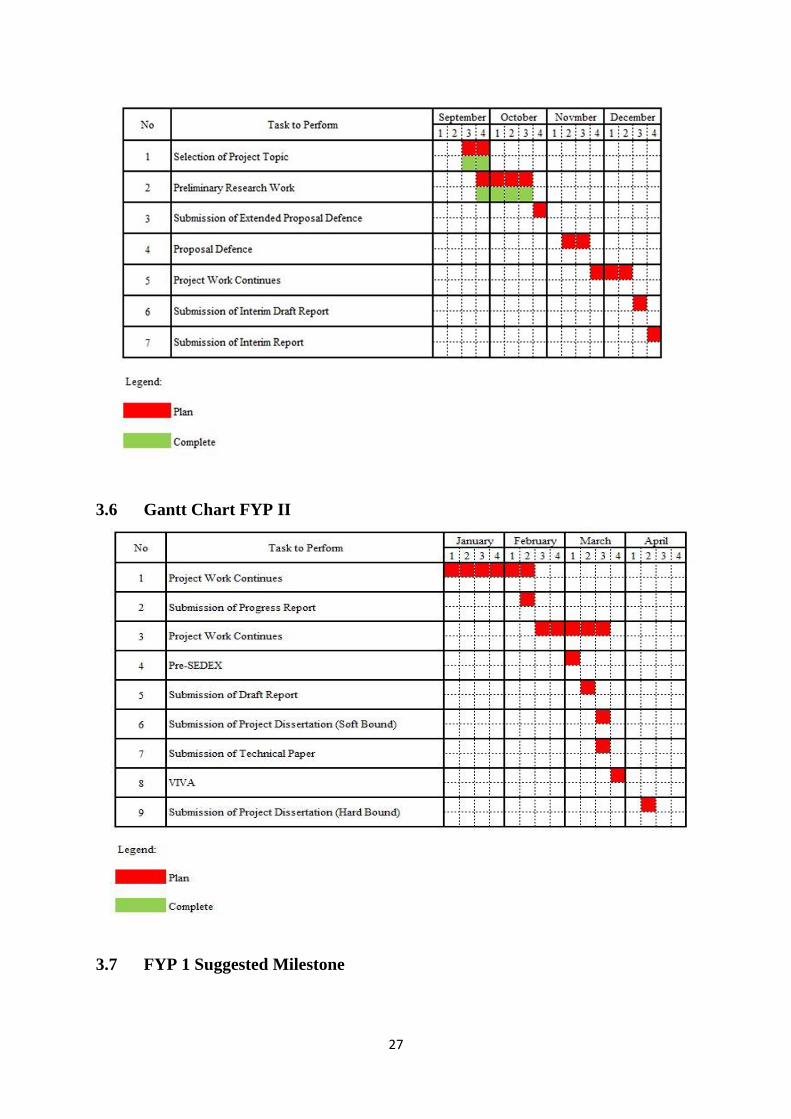
3.5 Gantt Chart FYP I
27
3.6 Gantt Chart FYP II
3.7 FYP 1 Suggested Milestone

28
3.8 FYP 2 Suggested Milestone

29
CHAPTER 4
RESULTS AND DISCUSSION
The results obtained from the laboratory experiment were then analysed in order to get the
Manning’s roughness value, n. Manning’s equation method has been used for the analysis.
The method used is shown below:
𝑄 = 1
𝑛𝑅
2
3𝑆1
2 (SI units)
Where:
R : Hydraulic radius, in m
Q : Discharge, in m3/s
Analyses have been done after getting all the parameters needed from the experiments. The
parameter measurement has been repeated a few times to reduce error towards the outcome
and results by the end of analysis. The average of Manning’s roughness coefficient, n was
calculated using Manning’s equation.
Field Study and Data Collection
The experiment was conducted in a 10 m x 0.31 m x 0.25 m glass-wall flume as shown
schematically in Figure 17 in the Hydraulics Laboratory of Universiti Teknologi
PETRONAS. The purpose of the experimental program was to obtain spatial patterns of flow
characteristic in a flume with natural vegetation. The natural vegetation was arranged
uniformly in the flume of 1m long. The length of the flume was 10 m and the author decided
to put 1 m length of vegetation inside the flume.
Figure 17 – Schematic Diagram Inside of the Flume

30
Depth gauge has been used to measure the depth of flow. The flow of water has a consistent
value for certain point along the flume and few readings were taken to be compared. The
results show the flow of water varies according to its slope. In open channel flow prediction,
it is usually assumed that the flow is parallel and has a uniform velocity distribution (steady-
uniform flow). As the velocity is varied, the author can conclude that with the slope available
in the flume, the velocity is getting faster while the depth of water is decreasing at both
upstream and downstream of the flume. By comparing the experiment conditions for different
works as in experiment without vegetation and with involving vegetation, the author
confirmed that the differences may be attributed to the slope although the difference of this
value is slightly not same.
Based on the above assumptions, a series of empirical methods of discharge estimation in
open channels has been developed. The simplest of these are uniform flow equations
attributed to Manning. In analysing the flow through open channels of regular sectional shape
and hydraulic roughness, it is sufficient, in general, to use the overall hydraulic radius as the
parameter, which characterized the properties of cross section.
Figure 18 shows the flow transition in vegetated zone where there is a different between the
vegetated and non-vegetated zone in flow regimes. The results show that the flow depth of
water in vegetated zone is much higher compare to non-vegetated zone. With the slope, the
flow velocity is getting faster while the depth is decreasing.
Figure 18 – Flow Transition for Vegetated Zone
When discharge remains the same and depth does not change then we have uniform steady
flow. In this condition, the surface of water is parallel to the bed of the flume or S = Sw.

31
Where S is the slope of the channel. The slope of the channel can be expressed as an angle, as
per cent or as a fraction.
The slope of the flume also has been set up into three different levels which are + 1:500 and
+ 1:300. Flow discharges have been selected from 0.001519 m3/s – 0.002889m3/s, based on
available flow discharges at the Hydraulics Laboratory. To obtain an aspect ratio of
0.001519 m3/s for the first run until 0.002889 m3/s for the last run, the author need to
monitor the meter that connect to the pump. The average height of the natural vegetation is
0.630 m and all reading is shown as per Table.
Table 3 –Height Vegetation Readings
Reading Height (m)
1st 0.130
2nd 0.128
3rd 0.700
4th 0.970
5th 0.950
6th 0.900
Average Height 0.630
The Manning’s vegetation roughness shows the higher the density of vegetation, the value of
Manning’s roughness coefficient, n is higher; hence the value of flow rate, Q will be lower as
it is inversely proportional. According to the Manning’s vegetation roughness below, the
value of flow rate depends on the value of n which is the roughness coefficient. To get the
higher value of Q, the value of n should be lower.
𝑄 = 𝑉𝐴 = 1
𝑛𝐴𝑅
23𝑆
12
Where:
Q = Flow Rate, ( m3/𝑠 )
V = Velocity, ( m/s )
A = Flow Area ( m2 )
n = Manning’s Roughness Coefficient
R = Hydraulic Radius, ( m )

32
S = Channel Slope, ( m )
Table 4 shows a flume experiment for the slope of 1:500 without and with vegetation where
the reading of flow depth is taken during the experiment. There are five selected sections in
the flume where every section shows a different reading.
Table 4 – Data Analysis for Slope 1:500
Discharge,
(m3/s)
Sections in the Flume
3
(Non-
Vegetated)
4
(Non-
Vegetated)
5a
(Vegetated
Zone)
5b
(Vegetated
Zone)
5c
(Vegetated
Zone)
Flow Depth, y (m) Average
y (m)
Flow Depth, y (m) Average
y (m)
0.001519 0.120 0.127 0.1235 0.186 0.197 0.194 0.1790
0.001794 0.122 0.123 0.1225 0.181 0.192 0.191 0.1880
0.002022 0.127 0.129 0.1280 0.183 0.193 0.195 0.1903
0.002350 0.132 0.134 0.1330 0.183 0.195 0.192 0.1900
0.002633 0.136 0.139 0.1375 0.186 0.199 0.194 0.1930
0.002889 0.138 0.140 0.1390 0.189 0.203 0.196 0.1960
Table 5 shows a computation of Manning’s roughness coefficient at that particular slope
which is 1:500. Results shows that the value of Manning’s roughness is higher at the
vegetated zone compare to non-vegetated zone. Table 5 also shows that the higher the value
of discharge, the smaller the value of Manning’s roughness.
Table 5 – Manning’s Roughness Computation for the slope at 1:500
Discharge,
(m3/s)
Average Flow
Depth at Non
Vegetated (m)
Manning’s
Roughness
Average Flow
Depth at Vegetated
Zone(m)
Manning’s
Roughness
0.001519 0.1235 0.189 0.1790 0.311
0.001794 0.1225 0.158 0.1880 0.280
0.002022 0.1280 0.149 0.1903 0.253
0.002350 0.1330 0.135 0.1900 0.217

33
0.002633 0.1375 0.126 0.1930 0.197
0.002889 0.1390 0.116 0.1960 0.184
Figure 16 below shows a graph of flow depth against the sections in the flume for the
particular slope. At the slope of 1:500, the value of flow depth is increasing when the water
flow pass through the vegetated zone.
Figure 19 – Graph of Flow Depth vs Sections in Flume for 1:500 Slope
Table 6 shows a flume experiment for the slope of 1:300 without and with vegetation where
the reading of flow depth is taken during the experiment. There are five selected sections in
the flume where every section shows a different reading.
Table 6 – Data Analysis for Slope 1:300
Discharge,
(m3/s)
Sections in the Flume
3
(Non-
Vegetated)
4
(Non-
Vegetated)
5a
(Vegetated
Zone)
5b
(Vegetated
Zone)
5c
(Vegetated
Zone)
Flow Depth, y (m) Average
y (m)
Flow Depth, y (m) Average
y (m)

34
0.001519 0.060 0.067 0.0635 0.126 0.137 0.134 0.1323
0.001794 0.067 0.067 0.0645 0.121 0.132 0.128 0.1270
0.002022 0.069 0.069 0.0680 0.123 0.133 0.131 0.1288
0.002350 0.074 0.074 0.073 0.124 0.135 0.130 0.1300
0.002633 0.079 0.079 0.0775 0.126 0.139 0.133 0.1327
0.002889 0.080 0.080 0.0790 0.129 0.143 0.136 0.1360
Table7 shows a computation of Manning’s roughness coefficient at that particular slope
which is 1:300. Results shows that the value of Manning’s roughness is higher at the
vegetated zone compare to non-vegetated zone. Table 7 also shows that the higher the value
of discharge, the smaller the value of Manning’s roughness. In open channel, Manning
formula has been widely used to determine the roughness coefficient, n. The variation of
roughness coefficient, n occurs due to the many contributing factors, for instance surface
roughness, vegetation, channel irregularity, channel alignment and obstruction. For this
study, the author was focused more on the surface roughness and vegetation itself.
Table 7 – Manning’s Roughness Computation for the slope at 1:300
Discharge,
(m3/s)
Average Flow
Depth at Non
Vegetated (m)
Manning’s
Roughness
Average Flow
Depth at Vegetated
Zone(m)
Manning’s
Roughness
0.001519 0.0635 0.090 0.1323 0.254
0.001794 0.0645 0.077 0.1270 0.203
0.002022 0.0680 0.074 0.1288 0.184
0.002350 0.073 0.071 0.1300 0.160
0.002633 0.0775 0.069 0.1327 0.147
0.002889 0.0790 0.065 0.1360 0.139
From the graph below, it is shown that the value of roughness increases when the flow depth
increasing. It is also found that the value of n increasing with the increasing of the flow
depth. This results show an agreement with the statement of Jarvela (2002) which the
roughness coefficient value is depending on the flow depth where the Manning;s roughness
coefficient is increasing while velocity is decreasing due to the friction. Vegetation exerts a
strong influence on stream-channel. It is expected at the end of this study, a few outcome will

35
be accomplished according to two objectives that have been setting up earlier. The expected
outcome will be able to determine the effect of vegetation on flow characteristics and be able
to establish relationship Manning’s vegetative roughness and the flow depth.
Figure 20 – Graph of Flow Depth vs Sections in Flume for 1:300 Slope
According to the calculated data, the author can conclude that the value of Manning’s
roughness is higher when there is varying roughness and alignment. The highest the value of
Manning’s roughness is for extremely bad alignment, deep pools, and vegetation or
floodways with heavy stand of timber and underbrush. With the least value of this Manning’s
roughness shows the very smooth and true surfaces without projections.
It is expected at the end of this research, the determination of the velocity distribution will
serve as an indicator for sediments deposition based on the degree of the vegetation
roughness. The roughness resistance due vegetation will be established by Manning’s
vegetation roughness. The flume was divided into vegetated zone and non-vegetated zone.
For the vegetated zone, the author decided to save 1 m length out of 10 m length of the flume.
The natural vegetation was planted in order to investigate the pattern of the water flow. Since
early of February 2015, data collection of water flow has been carried out in the laboratory.
The selected grass for this experiment is the grass which has the scattered pattern and the
random one. During the experiment that has been conducted in the laboratory, the author
36
realized that the grass is not fully submerged and no longer enough for the water to flow
completely along the rectangular flume. However, the results still shows a positive value
where it is completely follow the concept of previous studies where the value of Manning’s
roughnes should be higher where there is a varying roughness and alignment. The Manning’s
roughness value increases along with the increment of the flow depth of vegetation in an
open channel. In this case, it were found that on 0.18 m depth, the value of n increases about
475%, 200% at 0.20 m depth and 90%.

37
CHAPTER 5
CONCLUSION AND RECOMMENDATION
Unrestricted growth of such vegetation in an open channel can lead to its complete loss of the
hydraulic capacity which has potential to generate flood. A laboratory study has been
conducted to analyse the effects of different types of vegetation to the velocity and on the
Manning roughness coefficient (n) in an open channel on the hydraulic roughness. This study
investigated the impact of vegetation on flow and mostly natural vegetation will be used in a
flume experiments. The effect of vegetation density on flow characteristics is studied and the
relationship between flow resistance and Manning number is established experimentally. By
comparing the experiment conditions for different works as in experiment without vegetation
and with involving vegetation, the author confirmed that the differences may be attributed to
the vegetation densities. With increasing vegetation density, the velocity and corresponding
flow rate increased.
The vegetation selected for this experiment is Japanese Lawn Grass (Zoysia japonica Steud.).
From the experiment conducted that the roughness of Japanese Lawn Grass is in range of
0.139 – 0.254 for slope of 1:300 and 0.184 – 0.311 for slope of 1:500. It is also found that the
increasing of Manning’s n value is depending on the increasing of flow depth. The increasing
of Manning’s n value also identified when density of vegetation increased. The values of
velocity and flow rate were proportionally inversed with Manning’s n. The Manning’s
vegetation roughness was computed for different flow rates and vegetation densities. From
the expected result, the author can conclude that the higher the density of vegetation, the
value of Manning’s roughness coefficient, n is higher; hence the value of flow rate, Q will be
lower as it is inversely proportional. This relationship will be used as an alternative solution
for channel designs for the benefit of practitioners in determining a more accurate roughness
and discharge values. As there are a few problems that has been faced by the author as in the
selected grass is not fully submerged and the grass in no longer enough for the water to fully
developed at that area, the results still gave the value that the author was looking for. The
flow of depth is decreasing when the slope is increasing.

38
The occurrence of vegetation in water courses has numerous impacts by at least altering the
magnitude and direction of flow which will affect the shape of velocity profile, turbulence
structures and sediment transport in an open-channel flow. Aquatic vegetation in a channel
reduces flow speed and increase the water level. When channel velocity increases, the aquatic
vegetation slows the flow at the bottom of the channel. Therefore, aquatic vegetation protects
the bottom of the channel and reduces erosion.

39
REFERENCES
Azazi, Z. et al. (2003), “Performance of A Sustainable Urban Drainage System in
Malaysia”, Thesis of PhD of Universiti Sains Malaysia, Nibong Tebal, Seberang Prai
Selatan.
David, L. (2008). “Flow through Rigid Vegetation Hydrodynamics”, Thesis of Master of
Science, Virginia Polytechnic Institute and State University.
Konrad, C.P. (2002). Effects of Urban Development on Floods. Lake Oswego, OR: Green
House Network. Retrieved from website: http://pubs.usgs.gov/fs/fs07603/
Lauren, N.A (2007). “Laboratory Experiments and Numerical Modeling of Wave Attenuation
Through Artificial Vegetation”, MSc, Ocean Engineering, Texas A&M University.
McNaughton, J. (2009), “Laboratory Modelling of Open-channel Flow Past Emergent
Vegetation”, Thesis of Master of University of Manchester. Manchester, UK.
Morris, H. M. and Wiggert, J. M. (1971).“Applied Hydraulics in Engineering.” John Wiley
& Sons, Inc.
Mitchell, D.S. (1974), “The Effects of Excessive Aquatic Plant Populations, In:Mitchell, D.S
(Ed.) Aquatic Vegetation and its Control”, UNESCO, Paris.
Nepf, H. (1999), “Drag, Turbulence and Diffusion in Flow Through Emergent Vegetation”,
Water Resources Research, Vol. 35, pp 479-489.
Stephan, U., and Guthnecht, D. (2002). “Hydraulic resistance of submerged flexible
vegetation”. J. of Hydrology, 269(1-2):27-34

40