Impacts of Treated Wood in the Florida Disposal … · Impacts of Treated Wood . in the Florida...
97
Impacts of Treated Wood in the Florida Disposal Sector (DRAFT) Release to TAG on November 2, 2017 Authors Helena Solo-Gabriele, Ph.D., P.E. Athena Jones Juniper Marini University of Miami, Coral Gables, FL Department of Civil, Architectural and Environmental Engineering Timothy Townsend, Ph.D., P.E. Nicole Robey University of Florida, Gainesville, FL Department of Environmental Engineering Sciences Hinkley Center for Solid and Hazardous Waste Management University of Florida P. O. Box 116016 Gainesville, FL 32611 www.hinkleycenter.org Report # XXX
Transcript of Impacts of Treated Wood in the Florida Disposal … · Impacts of Treated Wood . in the Florida...
Impacts of Treated Wood
in the Florida Disposal Sector
(DRAFT)
Release to TAG on November 2, 2017
Authors
Helena Solo-Gabriele, Ph.D., P.E. Athena Jones
Juniper Marini University of Miami, Coral Gables, FL
Department of Civil, Architectural and Environmental Engineering
Timothy Townsend, Ph.D., P.E. Nicole Robey
University of Florida, Gainesville, FL Department of Environmental Engineering Sciences
Hinkley Center for Solid and Hazardous Waste Management University of Florida
P. O. Box 116016 Gainesville, FL 32611 www.hinkleycenter.org
Report # XXX
ii
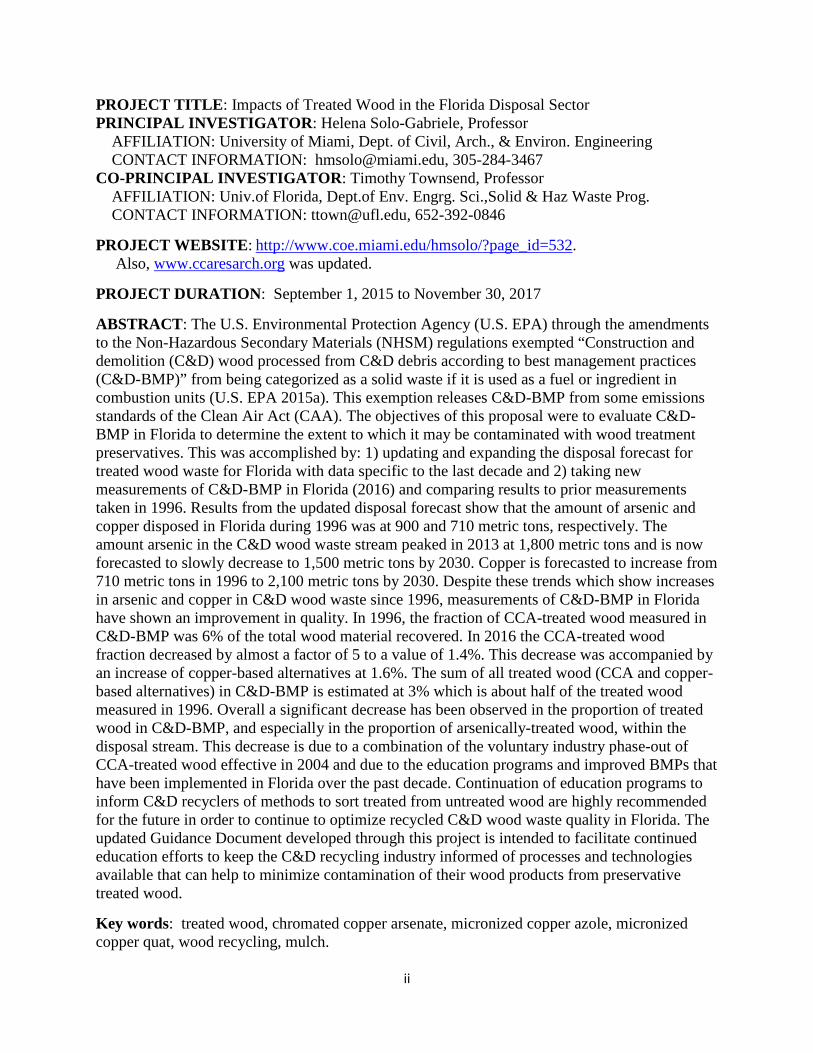
PROJECT TITLE: Impacts of Treated Wood in the Florida Disposal Sector PRINCIPAL INVESTIGATOR: Helena Solo-Gabriele, Professor AFFILIATION: University of Miami, Dept. of Civil, Arch., & Environ. Engineering CONTACT INFORMATION: [email protected], 305-284-3467 CO-PRINCIPAL INVESTIGATOR: Timothy Townsend, Professor AFFILIATION: Univ.of Florida, Dept.of Env. Engrg. Sci.,Solid & Haz Waste Prog. CONTACT INFORMATION: [email protected], 652-392-0846 PROJECT WEBSITE: http://www.coe.miami.edu/hmsolo/?page_id=532. Also, www.ccaresarch.org was updated. PROJECT DURATION: September 1, 2015 to November 30, 2017 ABSTRACT: The U.S. Environmental Protection Agency (U.S. EPA) through the amendments to the Non-Hazardous Secondary Materials (NHSM) regulations exempted “Construction and demolition (C&D) wood processed from C&D debris according to best management practices (C&D-BMP)” from being categorized as a solid waste if it is used as a fuel or ingredient in combustion units (U.S. EPA 2015a). This exemption releases C&D-BMP from some emissions standards of the Clean Air Act (CAA). The objectives of this proposal were to evaluate C&D-BMP in Florida to determine the extent to which it may be contaminated with wood treatment preservatives. This was accomplished by: 1) updating and expanding the disposal forecast for treated wood waste for Florida with data specific to the last decade and 2) taking new measurements of C&D-BMP in Florida (2016) and comparing results to prior measurements taken in 1996. Results from the updated disposal forecast show that the amount of arsenic and copper disposed in Florida during 1996 was at 900 and 710 metric tons, respectively. The amount arsenic in the C&D wood waste stream peaked in 2013 at 1,800 metric tons and is now forecasted to slowly decrease to 1,500 metric tons by 2030. Copper is forecasted to increase from 710 metric tons in 1996 to 2,100 metric tons by 2030. Despite these trends which show increases in arsenic and copper in C&D wood waste since 1996, measurements of C&D-BMP in Florida have shown an improvement in quality. In 1996, the fraction of CCA-treated wood measured in C&D-BMP was 6% of the total wood material recovered. In 2016 the CCA-treated wood fraction decreased by almost a factor of 5 to a value of 1.4%. This decrease was accompanied by an increase of copper-based alternatives at 1.6%. The sum of all treated wood (CCA and copper-based alternatives) in C&D-BMP is estimated at 3% which is about half of the treated wood measured in 1996. Overall a significant decrease has been observed in the proportion of treated wood in C&D-BMP, and especially in the proportion of arsenically-treated wood, within the disposal stream. This decrease is due to a combination of the voluntary industry phase-out of CCA-treated wood effective in 2004 and due to the education programs and improved BMPs that have been implemented in Florida over the past decade. Continuation of education programs to inform C&D recyclers of methods to sort treated from untreated wood are highly recommended for the future in order to continue to optimize recycled C&D wood waste quality in Florida. The updated Guidance Document developed through this project is intended to facilitate continued education efforts to keep the C&D recycling industry informed of processes and technologies available that can help to minimize contamination of their wood products from preservative treated wood. Key words: treated wood, chromated copper arsenate, micronized copper azole, micronized copper quat, wood recycling, mulch.
iii
METRICS REPORTING This page will be omitted from the report when it is published. Student researchers: Full Name: Athena Jones Email: [email protected] Anticipated Degree: Ph.D. in Civil Engineering (Environmental Emphasis) Department: Department of Civil, Architectural and Environmental Engineering, University of Miami, Coral Gables, FL Full Name: Juniper Marini Email: [email protected] Anticipated Degree: B.S. in Environmental Engineering, B.S. in Chemistry Department: Department of Environmental Engineering Sciences Full Name: Nicole Robey Email: [email protected] Anticipated Degree: Ph.D. in Civil Engineering Department: Department of Environmental Engineering Sciences Metrics: 1. Research publications from THIS Hinkley Center Project.
• Solo-Gabriele, H.M., Jones, A., Marini, J., Townsend, T.G., and Robey, N., 2017. Trends in Waterborne Treated Wood Production and Implications for Wood Waste Disposal. Proceedings of the 112th Annual Meeting of the American Wood Protection Association held in San Juan, Puerto Rico, May 2016, p. 151-162.
• Jones, A., Marini, J., Solo-Gabriele, H., 2018. Waterborne Treated Wood Production Trends, Disposal Forecast, and Fate of Metals. Proceedings of the 113th Annual Meeting of the American Wood Protection Association held in Las Vegas, Nevada, (in press).
• Jones, A.S., Marini, J.M., Solo-Gabriele, H.M. (2017). Review of Leaching Experiment of CCA-Treated Wood and Wood Treated with Copper-Based Alternatives. IRG/WP 17-50330. International Research Group on Wood Preservation, Stockholm, Sweden.
• This work is currently being rewritten for inclusion in to journal papers, one focused on the disposal model and another focused on the treated wood levels in recycled wood waste from C&D facilities.
2. Research presentations resulting from THIS Hinkley Center Project. • “Treated Wood in the Disposal Sector.” May 2015. USEPA, Office of Resource
Conservation & Recovery. Washington DC. (Presentation to Sasha Gerhard and George Faison, by Helena Solo-Gabriele)
• “Impacts of CCA-Treated Wood in the Florida Disposal Sector.” September 2015. Hinkley Center Research Forum, Tallahassee, FL. (poster presentation by Kimberley
iv
Stricklan. Poster authors, Helena Solo-Gabriele, Athena Jones, Juniper Marini, Timothy Townsend, and Kimberly Stricklan)
• A sequence of five presentations were provided during the October 9, 2015 TAG meeting held in Gainesville, FL. These presentations focused on the history of treated wood research, new wood preservative systems, plans for projecting disposal forecasts, plans for documenting the characteristics of treated wood waste in Florida, and plans for updating the treated wood disposal guidance document. These presentations were made by Helena Solo-Gabriele , Athena Jones, Juniper Marini, Timothy Townsend, and Kimberly Stricklan.
• A sequence of five presentations were provided during the May 23, 2016 TAG meeting held in Miami, FL. These presentations focused on the history of treated wood research, details concerning wood waste processing, and research updates concerning the modeling of the disposal of treated wood and results from sampling wood at C&D recycling facilities. These presentation were made by Helena Solo-Gabriele, Timothy Townsend, Athena Jones, Juniper Marini, and Nicole Robey.
• “Characteristics and Quantities of Treated Wood Waste.” May 2016. American Wood Protection Association National Meeting, San Juan, Puerto Rico. (speaker presentation by Helena Solo-Gabriele).
• A sequence of five presentations were provided during the March 217, 2017 TAG meeting held in Tallahassee, FL. These presentation focused on describing the results of the disposal forecast model and the results from the C&D-BMP measurements. These presentation were made by Helena Solo-Gabriele, Timothy Townsend, Athena Jones, Juniper Marini, and Nicole Robey.
• “Trends in Waterborne Treated Wood Production and Implications for Wood Waste Disposal.” April 2017. American Wood Protection Association National Meeting, Las Vegas, NV. (speaker presentation by Athena Jones).
• “Review of Leaching Experiments of CCA-Treated Wood and Wood Treated with Copper-based Alternatives.” June 2017. 48th Annual Meeting of the International Research Group on Wood Preservation, Ghent, Belgium. (speaker presentation by Athena Jones).
• “Impacts of Treated Wood in the Florida Disposal Sector.” July 2017. SWANA FL 2017, Summer conference and Hinkley Center Colloquium, July 25, 2017, Ft. Myers, FL (speaker presentation by Helena Solo-Gabriele).
3. List who has referenced or cited your publications from this project. Pending. Of note Drs.
Solo-Gabriele and Townsend’s research on treated wood is highly cited. Please see Google Scholar for citation details
(http://scholar.google.com/scholar?hl=en&q=helena+solo-gabriele&btnG=&as_sdt=1%2C10&as_sdtp= ) OR (http://scholar.google.com/scholar?q=timothy+g.+townsend&btnG=&hl=en&as_sdt=0%2C10 )
4. How have the research results from THIS Hinkley Center project been leveraged to secure
additional research funding?
v
• Dr. Solo-Gabriele received internal University of Miami funds to help support this project. This includes one additional year of stipend funds for a PhD students supported on this project estimated at a cost of about $55,000.
• Dr. Solo-Gabriele has collaborated with Dr. Sung Hee Joo in submitting a proposal focused on bioenergy with the U.S. Department of Agriculture. The purpose of this proposal is to develop bioenergy curriculums for students. Processing of wood waste will be one of the topics in the curriculum. Harvey Schneider of Florida Wood Recycling has provided a letter of support.
• Dr. Solo-Gabriele has discussed on several occasions the potential submission of an NSF-STTR proposal submission with Rick Comtois of Austin AI. The focus of the proposal is on XRF sorting for treated wood. However, after exchanging several email messages and speaking with the NSF program officer we decided to not pursue this opportunity.
• The University of Miami was a partner institution in a large Dept. of Energy proposal on Clean Energy Manufacturing Innovation Institute for Reducing Embodied-energy And Decreasing Emissions (REMADE) in Materials Manufacturing. The lead University is Rochester Institute of Technology. This large proposal was funded at $70 million. For this proposal we received letters of support from Florida Wood Recycling, New Hope Power Company (Okeelanta), and the Hinkley Center. Florida Wood Recycling and New Hope Power committed to yearly membership for a period of 5 years. There’s a recycling component in this proposal and Dr. Solo-Gabriele has proposed the inclusion of wood waste sorting process as part of the clean energy manufacturing initiative.
• Three additional opportunities were pursued for support of Athena Jones, the PhD student who has developed the disposal forecast. She has received travel grants for participation in the International Research Group on Wood Preservation (IRG) annual conference in Belgium and the American Wood Protection Association (AWPA) annual meeting in Las Vegas, NV. She also submitted a fellowship proposal to EREF.
5. What new collaborations were initiated based on THIS Hinkley Center project?
• Rick Comtois of Austin AI had indicated an interest in submitting an NSF-STTR proposal to evaluate sorting technologies for treated wood waste. Harvey Schneider of Florida Wood Recycling has shown an interest with the possibility of sorting using an optical system coupled with XRF. University collaborators for this proposal would be Dr. Helena Solo-Gabriele and Dr. Tim Townsend. After discussions with NSF, we decided not to pursue the NSF-STTR.
• Dr. Sung Hee Joo of UM has submitted a proposal to the U.S. Department of Agriculture for education on the topic of bioenergy. Wood waste is to be included through Dr. Solo-Gabriele’s contributions. As a result, letters of collaboration have been obtained from Harvey Schneider of Florida Wood Reycling and a request has been made from Kelly Russell of INEOS.
• A large group of Universities (25) and National Labs (6) have come together around the REMADE initiative described above. We are currently evaluating the contribution that can be made through this Hinkley-funded wood waste research.
• We have re-initiated our collaborations / interactions with the wood treatment sector and the solid waste disposal sector. Michael Freeman, a well known wood scientist, has been very supportive. Kevin Archer has been providing advice. Thabet Tolaymat has been very helpful in providing advice concerning connecting with the U.S. EPA.
vi
6. How have the results from THIS Hinkley Center funded project been used by the FDEP or
other stakeholders. • Wood waste recyclers have used our results (IRC Recyclers – Beatrice Garcia-Sartor) to
refine their sorting operations and to discuss possible markets for their recycled wood waste. Harvey Schneider has shown considerable interest in expanding his operations to include bioenergy production and enhanced sorting of his wood waste product. Danny Kreiser has also been very engaged in TAG meetings and very open to collaborations.
• The guidance document for sorting treated wood will be updated and available for posting by the Hinkley Center for use by the wood disposal sector. Cory Dilmore of the FDEP has been contacted and is willing to facilitate updating the Florida Administrative Code reference to describe the new 2017 document.
vii
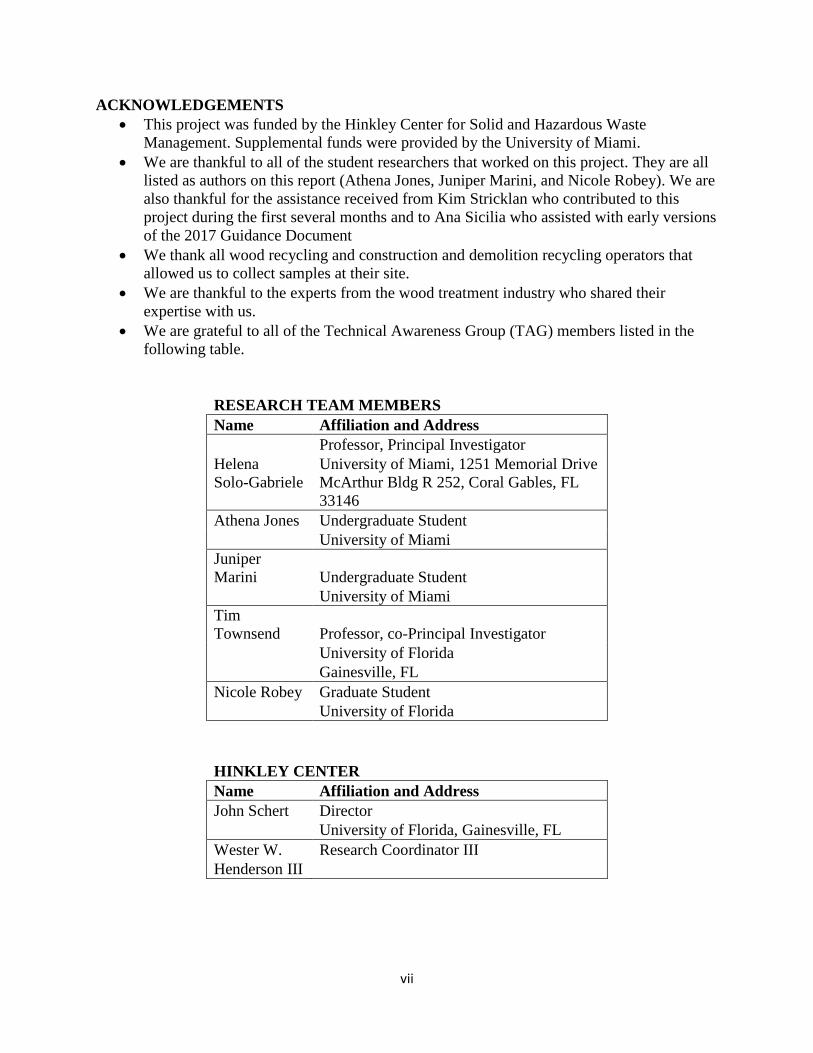
ACKNOWLEDGEMENTS • This project was funded by the Hinkley Center for Solid and Hazardous Waste
Management. Supplemental funds were provided by the University of Miami. • We are thankful to all of the student researchers that worked on this project. They are all
listed as authors on this report (Athena Jones, Juniper Marini, and Nicole Robey). We are also thankful for the assistance received from Kim Stricklan who contributed to this project during the first several months and to Ana Sicilia who assisted with early versions of the 2017 Guidance Document
• We thank all wood recycling and construction and demolition recycling operators that allowed us to collect samples at their site.
• We are thankful to the experts from the wood treatment industry who shared their expertise with us.
• We are grateful to all of the Technical Awareness Group (TAG) members listed in the following table.
RESEARCH TEAM MEMBERS Name Affiliation and Address
Helena Solo-Gabriele
Professor, Principal Investigator University of Miami, 1251 Memorial Drive McArthur Bldg R 252, Coral Gables, FL 33146
Athena Jones Undergraduate Student University of Miami Juniper Marini Undergraduate Student University of Miami Tim Townsend Professor, co-Principal Investigator University of Florida Gainesville, FL Nicole Robey Graduate Student University of Florida
HINKLEY CENTER Name Affiliation and Address John Schert Director University of Florida, Gainesville, FL Wester W. Research Coordinator III Henderson III
viii
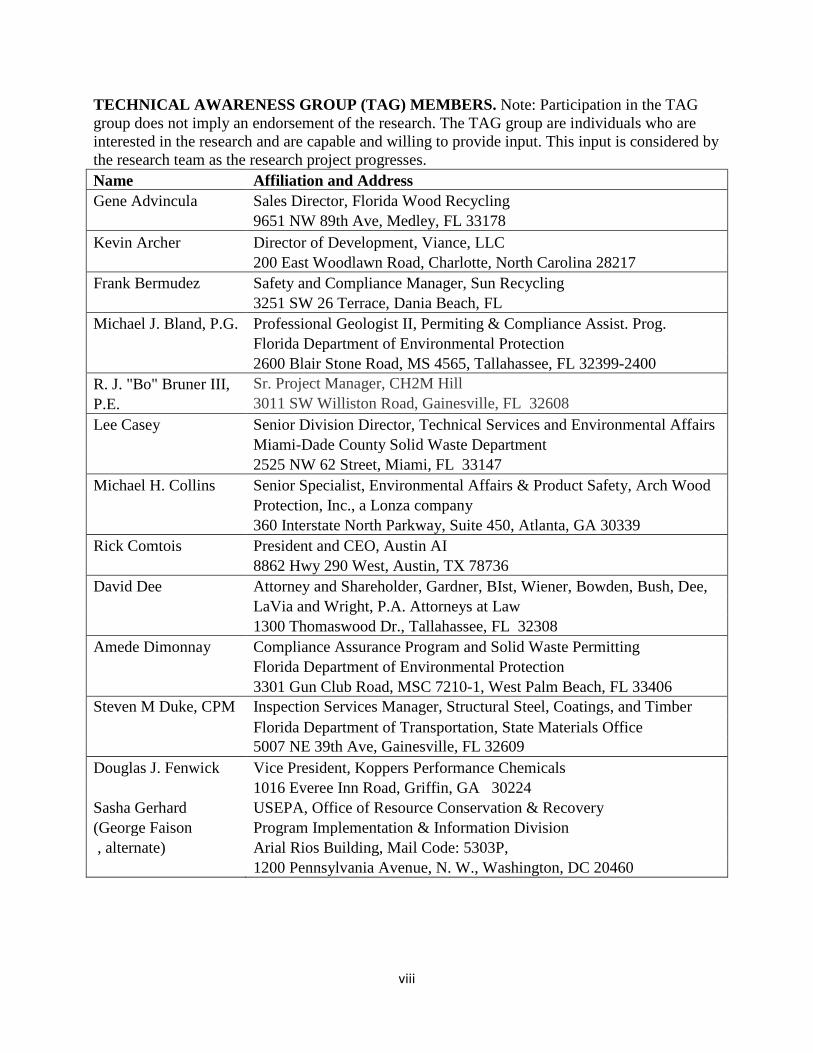
TECHNICAL AWARENESS GROUP (TAG) MEMBERS. Note: Participation in the TAG group does not imply an endorsement of the research. The TAG group are individuals who are interested in the research and are capable and willing to provide input. This input is considered by the research team as the research project progresses. Name Affiliation and Address Gene Advincula Sales Director, Florida Wood Recycling 9651 NW 89th Ave, Medley, FL 33178 Kevin Archer Director of Development, Viance, LLC 200 East Woodlawn Road, Charlotte, North Carolina 28217 Frank Bermudez Safety and Compliance Manager, Sun Recycling 3251 SW 26 Terrace, Dania Beach, FL Michael J. Bland, P.G. Professional Geologist II, Permiting & Compliance Assist. Prog. Florida Department of Environmental Protection 2600 Blair Stone Road, MS 4565, Tallahassee, FL 32399-2400 R. J. "Bo" Bruner III, Sr. Project Manager, CH2M Hill P.E. 3011 SW Williston Road, Gainesville, FL 32608 Lee Casey Senior Division Director, Technical Services and Environmental Affairs Miami-Dade County Solid Waste Department 2525 NW 62 Street, Miami, FL 33147 Michael H. Collins Senior Specialist, Environmental Affairs & Product Safety, Arch Wood Protection, Inc., a Lonza company 360 Interstate North Parkway, Suite 450, Atlanta, GA 30339 Rick Comtois President and CEO, Austin AI 8862 Hwy 290 West, Austin, TX 78736 David Dee Attorney and Shareholder, Gardner, BIst, Wiener, Bowden, Bush, Dee, LaVia and Wright, P.A. Attorneys at Law 1300 Thomaswood Dr., Tallahassee, FL 32308 Amede Dimonnay Compliance Assurance Program and Solid Waste Permitting Florida Department of Environmental Protection 3301 Gun Club Road, MSC 7210-1, West Palm Beach, FL 33406 Steven M Duke, CPM Inspection Services Manager, Structural Steel, Coatings, and Timber Florida Department of Transportation, State Materials Office 5007 NE 39th Ave, Gainesville, FL 32609 Douglas J. Fenwick Vice President, Koppers Performance Chemicals 1016 Everee Inn Road, Griffin, GA 30224 Sasha Gerhard USEPA, Office of Resource Conservation & Recovery (George Faison Program Implementation & Information Division , alternate) Arial Rios Building, Mail Code: 5303P, 1200 Pennsylvania Avenue, N. W., Washington, DC 20460
ix
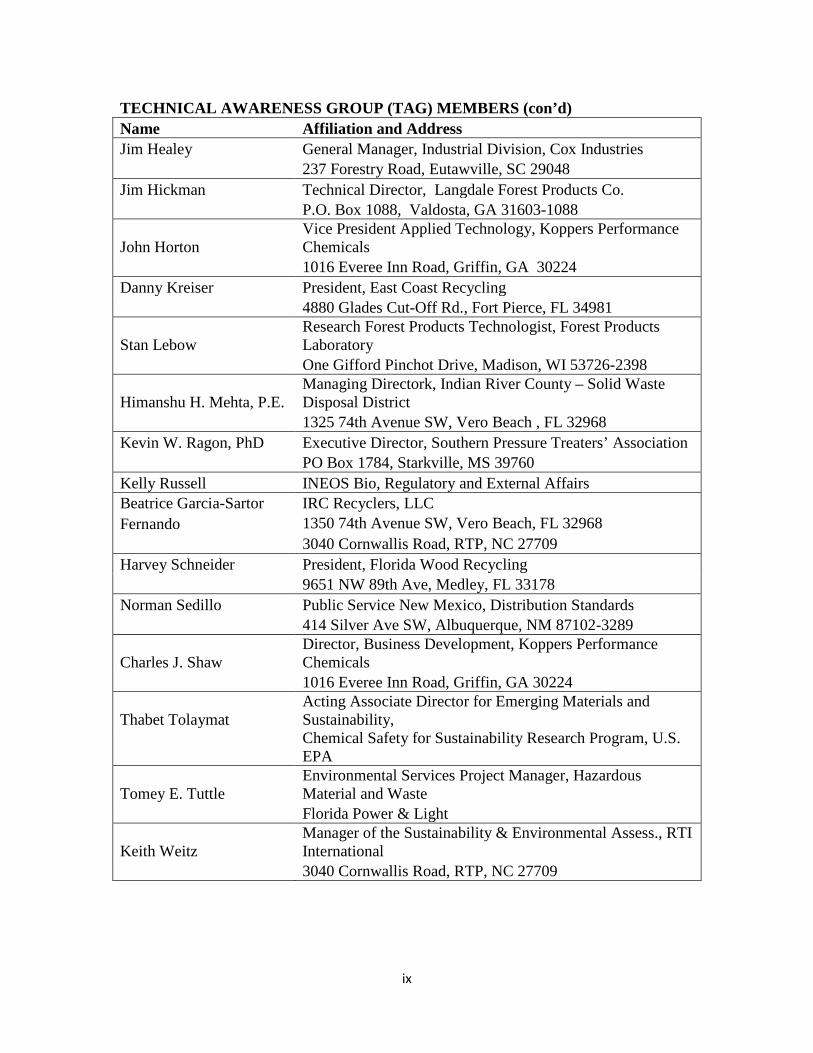
TECHNICAL AWARENESS GROUP (TAG) MEMBERS (con’d) Name Affiliation and Address Jim Healey General Manager, Industrial Division, Cox Industries 237 Forestry Road, Eutawville, SC 29048 Jim Hickman Technical Director, Langdale Forest Products Co. P.O. Box 1088, Valdosta, GA 31603-1088
John Horton Vice President Applied Technology, Koppers Performance Chemicals
1016 Everee Inn Road, Griffin, GA 30224 Danny Kreiser President, East Coast Recycling 4880 Glades Cut-Off Rd., Fort Pierce, FL 34981
Stan Lebow Research Forest Products Technologist, Forest Products Laboratory
One Gifford Pinchot Drive, Madison, WI 53726-2398
Himanshu H. Mehta, P.E. Managing Directork, Indian River County – Solid Waste Disposal District
1325 74th Avenue SW, Vero Beach , FL 32968 Kevin W. Ragon, PhD Executive Director, Southern Pressure Treaters’ Association PO Box 1784, Starkville, MS 39760 Kelly Russell INEOS Bio, Regulatory and External Affairs Beatrice Garcia-Sartor IRC Recyclers, LLC Fernando 1350 74th Avenue SW, Vero Beach, FL 32968 3040 Cornwallis Road, RTP, NC 27709 Harvey Schneider President, Florida Wood Recycling 9651 NW 89th Ave, Medley, FL 33178 Norman Sedillo Public Service New Mexico, Distribution Standards 414 Silver Ave SW, Albuquerque, NM 87102-3289
Charles J. Shaw Director, Business Development, Koppers Performance Chemicals
1016 Everee Inn Road, Griffin, GA 30224
Thabet Tolaymat Acting Associate Director for Emerging Materials and Sustainability,
Chemical Safety for Sustainability Research Program, U.S. EPA
Tomey E. Tuttle Environmental Services Project Manager, Hazardous Material and Waste
Florida Power & Light
Keith Weitz Manager of the Sustainability & Environmental Assess., RTI International
3040 Cornwallis Road, RTP, NC 27709
x
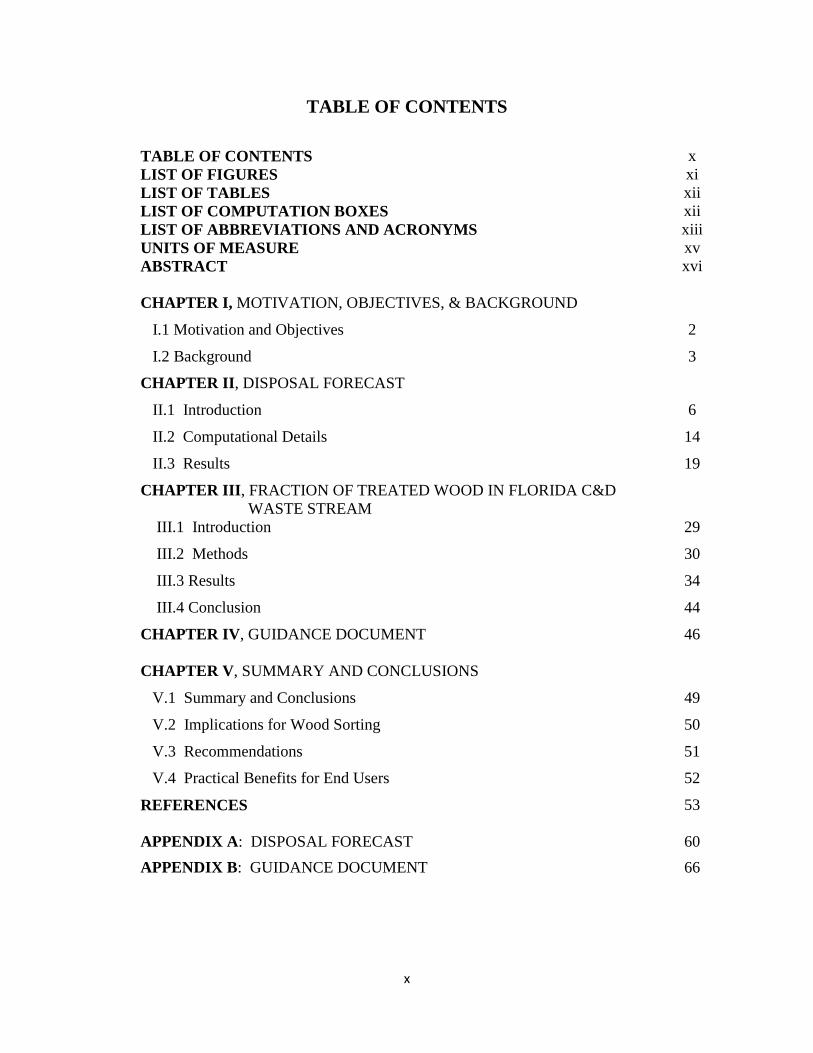
TABLE OF CONTENTS TABLE OF CONTENTS LIST OF FIGURES LIST OF TABLES LIST OF COMPUTATION BOXES LIST OF ABBREVIATIONS AND ACRONYMS UNITS OF MEASURE ABSTRACT
x xi xii xii xiii xv xvi
CHAPTER I, MOTIVATION, OBJECTIVES, & BACKGROUND
I.1 Motivation and Objectives 2
I.2 Background 3
CHAPTER II, DISPOSAL FORECAST
II.1 Introduction 6
II.2 Computational Details 14
II.3 Results 19
CHAPTER III, FRACTION OF TREATED WOOD IN FLORIDA C&D WASTE STREAM
III.1 Introduction 29
III.2 Methods 30
III.3 Results 34
III.4 Conclusion 44
CHAPTER IV, GUIDANCE DOCUMENT
46
CHAPTER V, SUMMARY AND CONCLUSIONS
V.1 Summary and Conclusions 49
V.2 Implications for Wood Sorting 50
V.3 Recommendations 51
V.4 Practical Benefits for End Users 52
REFERENCES
53
APPENDIX A: DISPOSAL FORECAST 60 APPENDIX B: GUIDANCE DOCUMENT 66
xi
LIST OF FIGURES
Figure II.1 Number of Wood Treatment Plants in the United States Versus Year
Figure II.2 Proportion of Wood Volume Production Treated with Different Categories of Wood Treatment Preservatives
Figure II.3 Amount of Oilborne and Waterborne Preservative Produced Over Time
Figure II.4 Fraction of arsenic, chromium, and copper leached from CCA-treated wood for different leaching standardized accelerated and environmental leaching tests
Figure II.5 The treated wood life cycle separated by a) wood and b) preservative
Figure II.6 (a) Wood volume associated with total treated wood production from 1909 through 2020 in the U.S. (b) Wood volume by preservative from major wood preservatives
Figure II.7 Metric Tons of Metals associated with Treated Wood Production from 1970 to 2020 in the U.S. Note: Florida represents 10% of the above values.
Figure II.8 Production of Metals from Wood Preservation by Commodity (left) and by Preservative (right) in the U.S. Note: Roughly 10% of the above values are representative of Florida.
Figure II.9 Disposal of Metals from Wood Preservation by Commodity (left) and by Preservative (right) in the U.S. Note: Roughly 10% of the above values are representative of Florida.
Figure II.10 Leaching of Metals from Wood Preservation by Commodity (left) and by Preservative (right) in the U.S. Note: Roughly 10% of the above values are representative of Florida.
Figure II.11 Overall Production, Leaching, and Disposal of Arsenic from Treated Wood Products (top), Overall Production, Leaching, and Disposal of Copper from Treated Wood Products (middle), Overall Production, Leaching, and Disposal of Chromium from Treated Wood products (bottom)
Figure III.1 Mean total concentrations of arsenic, copper, and chromium in each sample
Figure III.2 Total arsenic, copper and chromium concentrations derived by XRF vs. digestion analysis
Figure III.3 Fraction CCA- and copper alternative-treated wood derived by XRF vs. digestion analysis.
Figure III.4 Mean fractions of CCA- and copper-alternative-treated wood in each sample based upon laboratory digestion data; number of positive XRF results (out of 20) for CCA- or copper-alternative-treated wood
Figure III.5 Mean fractions of CCA-treated wood in each sample based upon laboratory digestion followed by ICP analysis; number of positive XRF results (out of 20) for above-background-levels of arsenic (2 mg/kg) (indicating CCA-treated)
Figure III.6 Mean fractions of copper alternative-treated wood in each sample based upon laboratory digestion data; number of positive XRF results (out of 20) for above-background-levels of copper (3.7 mg/kg) (indicating copper-alternative-treated)
Figure IV.1 Illustration of new arsenic specific stain to identify CCA-treated wood. This technology is not mentioned in the 2006 Guidance Document.
xii
LIST OF FIGURES (con’d)
Figure IV.2 XRF Technology has been evaluated at the full scale since the publication of the 2006 Guidance Document and the information obtained from the studies should be included in the updated version.
Figure A.1 Flow diagram of computations used in order to forecast treated wood disposal
LIST OF TABLES Table II.1 FDEP SCTLs for Metals Included in Popular Waterborne Wood Preservatives
Table II.2 Commodities Simulated in the Disposal Model
Table II.3 Use Category and Definition
Table II.4 Retention Levels Based on Preservative and Commodity
Table II.5 Estimated Average Service Lives Based on Commodity (from Jones et al. 2017a)
Table II.6 FDEP Soil Cleanup Target Levels (SCTLs) Compared to Scaled Metals
Table III.1 Description of facilities where samples were collected
Table III.2 Mean total concentrations of arsenic, copper, and chromium in each sample as analyzed by laboratory digestion method and XRF
Table III.3 Fractions CCA- and copper-alternative-treated wood as determined by laboratory digestion and XRF method
Table III.4 Correlation values between XRF and digestion/ICP results
Table A.1 Waterborne chemical formulations included in the analysis of treated wood production
Table A.2 Descriptions of treated wood leaching tests evaluated in Jones et al. 2017b
Table A.3 Documents used to compile wood preservation statistics
COMPUTATION BOXES
Computation Box A.1 MATLAB methods explanation
Computation Box A.2 Equations used to convert retention values to kg of metals
Computation Box A.3 Scaling of amount of metals leached in terms of the upper 1 inch of Florida
xiii
LIST OF ABBREVIATIONS AND ACRONYMS
As Arsenic
ACC Acid Copper Chromate
ACQ Ammoniacal Copper Quaternary
ACZA Ammoniacal Copper Zinc Arsenate
AWPA American Wood Protection Association
AWPI American Wood Preservation Institute
B Boron
BB Below Baseline
BBL Below Baseline Levels
BDL Below Detection Limit
CA Copper Azole
CBA Copper Boron Azole
CC Copper Citrate
CCA Chromated Copper Arsenate
CDD Construction and Demolition Debris
CDDC Copper Dimethyldithiolcarbamate
C&D Construction and Demolition
CPSC Consumer Product Safety Commission
Cr Chromium
Cu Copper
CZC Chromated Zinc Chloride
DI De-ionized
EL2 Ecolife 2 (Dichlorooctylisothiazolinone (DCOI) – Imidicloprid - Stabilizer)
FDEP Florida Department of Environmental Protection
HCSHWM Hinkley Center for Solid and Hazardous Waste Management
LIBS Laser Induced Breakdown Spectroscopy
MATLAB Matrix Laboratory, Mathworks
xiv
LIST OF ABBREVIATIONS AND ACRONYMS (con’d)
MCA Micronized Copper Azole
MCQ Micronized Copper Quaternary
MDL Minimum Detection Limit
MSW Municipal Solid Waste
PTI Propiconazole – Tebuconazole - Imidacloprid
RTA Railway Tie Association
SCTL Soil Cleanup Target Level
SPLP Synthetic Precipitation Leaching Procedure
TAG Technical Awareness Group
TCLP Toxicity Characteristic Leaching Procedure
UCS Use Category System
UF University of Florida
UM University of Miami
USDA United States Departmet of Agriculture
US EPA U.S. Environmental Protection Agency
USGS United States Geological Survey
XRF X-ray Fluorescence Spectroscopy
Zn Zinc
xv
UNITS OF MEASURE
% Parts per hundred
μg Microgram oC Degrees Celsius
g Grams
kg/m3 Kilograms of chemical per cubic meter of wood. Chemical typically refers to CCA on an oxide basis.
L Liter
LD50 Lethal Dose at which 50% of the Experimental Population Dies
mg Milligrams
mg/kg Milligrams of chemical per kilogram of wood
mg/L Milligrams per liter
mL Milliliter
nm Nanometer
pcf Pounds of chemical per cubic foot of wood. Chemical typically refers to CCA on an oxide basis.
pH Measure of the hydrogen ion activity
ppm Parts per million
tons Metric ton (1000 kg)
xvi
EXECUTIVE SUMMARY The U.S. Environmental Protection Agency recently exempted Construction and Demolition (C&D) wood from being categorized as a solid waste if processed according to Best Management Practices (BMPs). C&D wood processed in this way, C&D-BMP, would be subject to different emission standards of the Clean Air Act. One class of contaminant of recycled C&D wood with potential impacts on air emissions is wood treatment preservatives. The goal of this proposal was to document the effectiveness of existing BMPs for C&D wood. Two approaches were used. First a disposal model was developed to evaluate the history and forecast the future of treated wood disposal. The disposal model provides an estimate of the amount of metals entering the C&D waste stream over time. Second samples of C&D-BMP were collected from wood recycling facilities in Florida to document the fraction of arsenic-treated and copper-treated wood. C&D wood samples collected were measured using traditional laboratory methods and using new methods based upon hand-held X-ray fluorescence (XRF). Results from the disposal model and sampling efforts were then compared to evaluate the degree to which BMPs are effectively being used by C&D wood recyclers in Florida. The disposal model projected a large increase in arsenic-treated wood disposal in the form of residential lumber and timbers from the 1980 (50 metric tons of arsenic) to its peak during 2013 (1,800 metric tons). After 2013 the quantity of arsenic disposed from treated wood is project to slowly decline to 1,500 metric tons in 2030. The majority of the disposed arsenic-treated wood in the future will be in the form of highway, marine, and farm uses of lumber and timbers plus a contribution from CCA-treated utility poles. The transfer of CCA-treated wood towards commercial and industrial markets makes it easier to separate out this form of treated wood waste. By 2030 the major metal in disposed treated wood will be copper (estimated at 2,100 metric tons). Although copper has a lower toxicity threshold to humans than arsenic, the ecological toxicity of copper warrants further study due to the increases in copper use and disposal coupled with the susceptibility of aquatic organisms to copper. The forecasted amounts of arsenic-treated wood in the disposal sector were compared to measurements taken at C&D wood recycling facilities within the State of Florida. Tolaymat et al. (2000) measured the fraction of CCA-treated wood in the recycling stream at a value of 6% in 1996. In the current study, this fraction decreased to 1.4%. The decrease in the proportion of CCA-treated wood was partially offset by an increase in copper-alternative treatment chemicals. The copper-alternatives were measured at 1.6%. In sum, the total amount of preservative treated wood found in C&D-BMP was 3%. This represents a 50% reduction in the fraction observed two decades prior. This reduction is significant, especially given the projected increase of arsenic in the disposal stream between 1996 (920 metric tons) and 2016 (1700 metric tons). Overall the proportion of CCA-treated wood has decreased in the disposal sector. Current levels of 1.4% are still elevated if recyclers would like to market the product as mulch. In order to do so, recyclers should consider implementation of sorting technologies that integrate knowledge about the C&D supplier with visual sorting. For very high quality mulch, these BMPs should be coupled with technologies such as XRF available to supplement the basic BMP methods. These BMPs including the more technologically intensive methods are described in the updated version
xvii
of the Guidance Document which was facilitated through this project. It is highly recommended that the C&D industry continues to be informed of the availability of this information. Ultimately such educational materials can help minimize possible negative impacts associated with the contamination of C&D wood with wood preservative chemicals.
1
CHAPTER I
MOTIVATION, OBJECTIVES, AND BACKGROUND
2
CHAPTER I
MOTIVATION, OBJECTIVES, AND BACKGROUND
This chapter focuses on describing the motivation and objectives (Section I.1) and the project background (Section I.2) for this study.
I.1 MOTIVATION AND OBJECTIVES
At the time this proposal was submitted, the U.S. Environmental Protection Agency (U.S. EPA) was in the process of finalizing a new rule which was eventually released February 2016. This rule which is part of the amendments to the Non-Hazardous Secondary Materials (NHSM) regulations exempt “Construction and demolition (C&D) wood processed from C&D debris according to best management practices (C&D-BMP)” from being categorized as a solid waste if it is used as a fuel or ingredient in combustion units (U.S. EPA 2016). This exemption in turn releases C&D-BMP from some emissions standards of the Clean Air Act (CAA). This is significant as it may increase the recycling of C&D wood for cogeneration due to relaxed rules on air emissions. However, one major deficiency in the rule during its proposal stage was that it did not define BMPs for C&D wood that would meet the “solid waste” exclusion. The State of Florida has been at the forefront in developing BMPs for C&D wood, establishing BMPs effective 2006. This puts the State in a unique position to document the effectiveness of existing BMPs as a means of developing its own guidelines in response to national regulations focused on C&D wood exemptions from classification as solid waste when used as fuel. Also the State, through its prior Innovative Recycling Grants Program, funded a sequence of studies to test new technologies for identifying and separating “clean” C&D wood from C&D wood contaminated with wood treatment preservatives. Through this research project we capitalized on this unique history of C&D management and research funding in Florida. The goal of this proposal was to develop a better understanding of the potential for C&D wood contamination and methods to minimize this contamination in an effort to identify BMPs that could correspond to the new NHSM regulations. We reached this goal through the following three research objectives.
• Objective #1: Document the amounts of treated wood and corresponding metals (e.g., arsenic and copper) entering the wood waste stream from treated wood products. We addressed this objective by updating and expanding the disposal forecast for treated wood waste for Florida with data specific to the last decade.
• Objective #2: Evaluate the effectiveness of current BMPs in Florida for minimizing the contamination from treated wood. This was accomplished by comparing the results from objective 1 with the amount of metals currently entering the wood waste stream in Florida (through measurements at wood recycling facilities).
• Objective #3: Evaluate innovations in measurements and sorting technologies relevant to wood waste BMPs. We evaluated publications in detection technologies with an
3
emphasis on evaluating innovations in XRF and conveyor technologies. This information was integrated into a Guidance Document for C&D wood recyclers.
The knowledge gained from this work was used to establish: the amount of treated wood entering the wood waste stream, the extent to which treated wood has been reduced in the Florida disposal sector through existing BMPs, and to identify the potential sorting technologies given the innovations during the past decade. The results of this study have been distributed through reports, publications, a sequence of TAG meetings and recommended updates to the Center’s www.ccaresearch.org web site. Strong efforts were made to reach out to those within the disposal sector and within the regulatory community. Ultimately the work can be used by the recycling sector to minimize contamination of C&D wood. The information obtained through this study can also be used by State solid waste officials in addressing the new federal rules that exempt C&D wood as a solid waste when used as fuel. Most importantly the results were used to update the current BMPs published in 2006, as they were outdated given changes in the wood waste stream.
I.2 BACKGROUND
The construction and demolition (C&D) wood issue was placed on the Hinkley Center research agenda back in 1995 (about 20 years ago) due to a disposal problem that consisted of elevated levels of arsenic, chromium, and copper in the ash from wood cogeneration plants. Upon recognizing possible contamination of C&D wood from wood treatment preservatives the Hinkley Center subsequently funded from 1996 through 2005 a successful series of research projects that quantified the amount of treated wood, and identified methods to appropriately dispose of this waste. The C&D wood issue has resurfaced on the agenda in 2013 and 2014 due to current initiatives at the federal level concerning the acceptable quality of boiler fuel and wood fuel used for cogeneneration (See U.S. EPA 2015b). During the late 90’s wood cogeneration plants in Florida, that were initially designed to combust bagasse, began to accept recycled wood from construction and demolition (C&D) recycling facilities. The inclusion of C&D wood within the cogeneration feed coincided with ash levels that occasionally failed U.S. EPA guidelines for toxicity. As a result the ash from the wood cogeneration plants could no longer be land applied as originally intended. This ash was to be disposed via landfill, a much more expensive option. The surprise at the time was the extent to which waste wood was treated with a chemical preservative known as chromated copper arsenate (CCA). At the time the disposal community was not aware that the amounts disposed were sufficient to cause the elevated levels of metals within the ash at these cogeneration plants. C&D wood can be treated with a wide range of preservatives. These preservatives can be separated into oilborne versus waterborne preservatives. The oilborne preservatives (e.g., creosote and pentachlorophenol) are used for industrial applications such as for railroad ties and utility poles. These industrial applications have distinct dimensions, are almost always treated, and thus are easy to identify visually and separate in the disposal sector. The primary waterborne preservative used in the U.S. through 2004 was CCA. One of the difficulties with CCA-treated wood, besides the elevated levels of metals (Table I.1), is that it is used to treated lumber and timbers which also have a significant untreated wood market. Both untreated and treated lumber and timbers are commingled in C&D debris making it difficult to identify and separate “clean”
4
wood from wood containing preservatives. Thus wood treated with waterborne preservatives frequently contaminates recycled C&D wood. As a result of this concern, the “CCA Team”, the core of which included the research groups from Dr. H. Solo-Gabriele of U.Miami and T. Townsend of U.Florida, submitted proposals to address the problem. The “base” funding for this research came from the Hinkley Center during the 1995 to 2005 period, with supplemental awards provided through the National Science Foundation, National Institutes of Health, plus local support through the Florida Innovative Recycling Grants Program and Florida Power and Light Company. Through their research the CCA Team found a considerable amount of CCA-treated wood inadvertently being recycled as wood cogeneration fuel and also as mulch (Solo-Gabriele and Townsend 1999, Jacobi, et al. 2007a Shibata et al. 2007). They identified the impacts of the wood product during disposal (Jambeck et al. 2008, Dubey et al. 2009) and developed methods to identify and sort treated wood (Blassino et al. 2002, Block et al. 2007, Jacobi et al. 2007b). The most practical of the sorting methods were included within a “Guidance Document” developed by the Hinkley Center in 2006 (HCSHWM 2006).
Part of the urgency for evaluating CCA-treated wood was because of the large quantities that were being produced and sold throughout the U.S. Early on during the study, a treated wood and arsenic disposal forecast was developed based upon readily available production statistics coupled with information about the typical service lives of the treated wood product. The main goal of the current proposed project is to develop an understanding for the potential for C&D wood contamination from waterborne wood preservatives and to identify methods to minimize contamination which can then be incorporated into BMPs. Specifically we addressrf this goal through the following:
• Updated the disposal forecast projections for waterborne-treated wood and corresponding arsenic/copper within the disposal sector given the most recent treated wood production statistics (Chapter II).
• Evaluated the effectiveness of existing BMPs by estimating the amount of treated wood recycled through C&D waste in 2016 and comparing the results to the amount predicted from the Task 1’s disposal forecast (Chapter III).
• Identified BMPs and update the Hinkley Center’s document entitled, Guidance for the Management and Disposal of CCA-Treated Wood, with an emphasis on re-evaluating the cost effectiveness of sorting technologies given technological advances (Chapter IV).
This study provides a unique opportunity to document the changes in the wood waste stream and the impact of the Center’s and FDEP’s efforts to develop BMPs to reduce CCA-treated wood from disposal within unlined landfills or as mulch. Such information would be useful to address proposed federal regulations focused on exemptions of non-hazardous secondary treated wood biomass. Results can be used by State regulators to define BMPs for C&D wood that would meet the “solid waste” exclusion.
5
CHAPTER II
DISPOSAL FORECAST
6
CHAPTER II
DISPOSAL FORECAST This chapter focuses on describing the updated version of the treated wood disposal forecast. This model differs from earlier versions in that it simulates disposal for 6 different commodities (poles, piles, railway ties, lumber and timbers, fence posts, and other) and accounts for 3 different metals (arsenic, copper, and chromium) from 8 different waterborne preservative formulations (CZC, CCA, ACC, ACZA, ACQ, MCQ, CBA, MCA). Wood treatment industry statistics were used to document treated wood production volumes from 1909 through the mid-1980s. After the 1980s, industry reporting was sporadic and in different formats requiring interpolation and extrapolation from various sources. From the available wood production values, wood disposal including leaching of metals from treated wood during in-service use, was estimated using a computational model that was based upon mass balance considerations. This chapter describes the components of the model by first providing an introduction (Section II.1). The introduction includes a summary of input data relevant to the model including background about the metals simulated, retention levels for treated wood, service lives for the commodities simulated, and leaching rates. Computational details for the model are described in Section II.2. The results are described in Section II.3, along with a list of variables.
II.1 INTRODUCTION
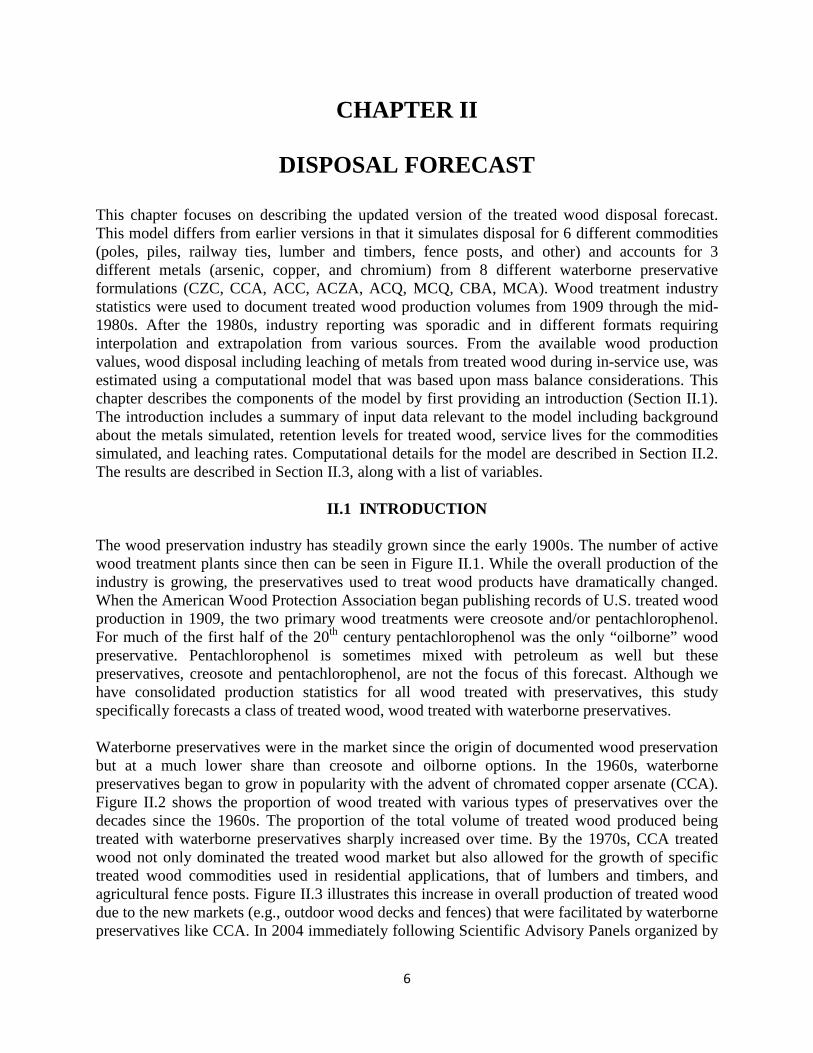
The wood preservation industry has steadily grown since the early 1900s. The number of active wood treatment plants since then can be seen in Figure II.1. While the overall production of the industry is growing, the preservatives used to treat wood products have dramatically changed. When the American Wood Protection Association began publishing records of U.S. treated wood production in 1909, the two primary wood treatments were creosote and/or pentachlorophenol. For much of the first half of the 20th century pentachlorophenol was the only “oilborne” wood preservative. Pentachlorophenol is sometimes mixed with petroleum as well but these preservatives, creosote and pentachlorophenol, are not the focus of this forecast. Although we have consolidated production statistics for all wood treated with preservatives, this study specifically forecasts a class of treated wood, wood treated with waterborne preservatives.
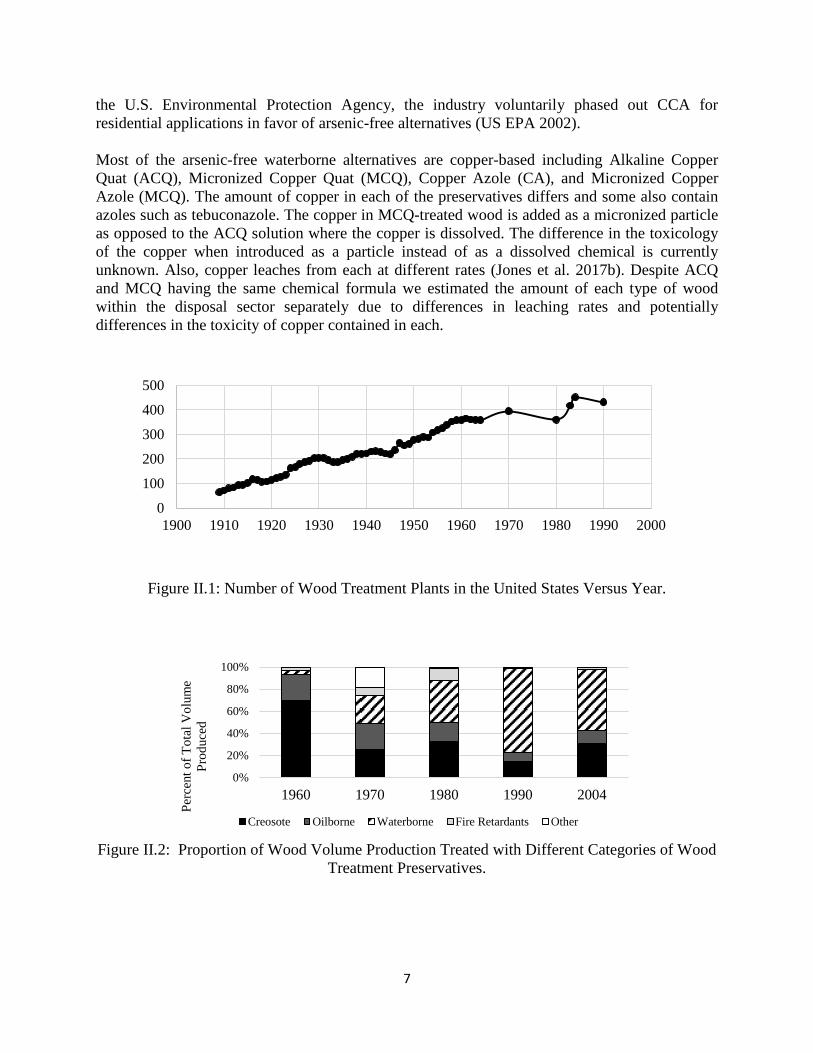
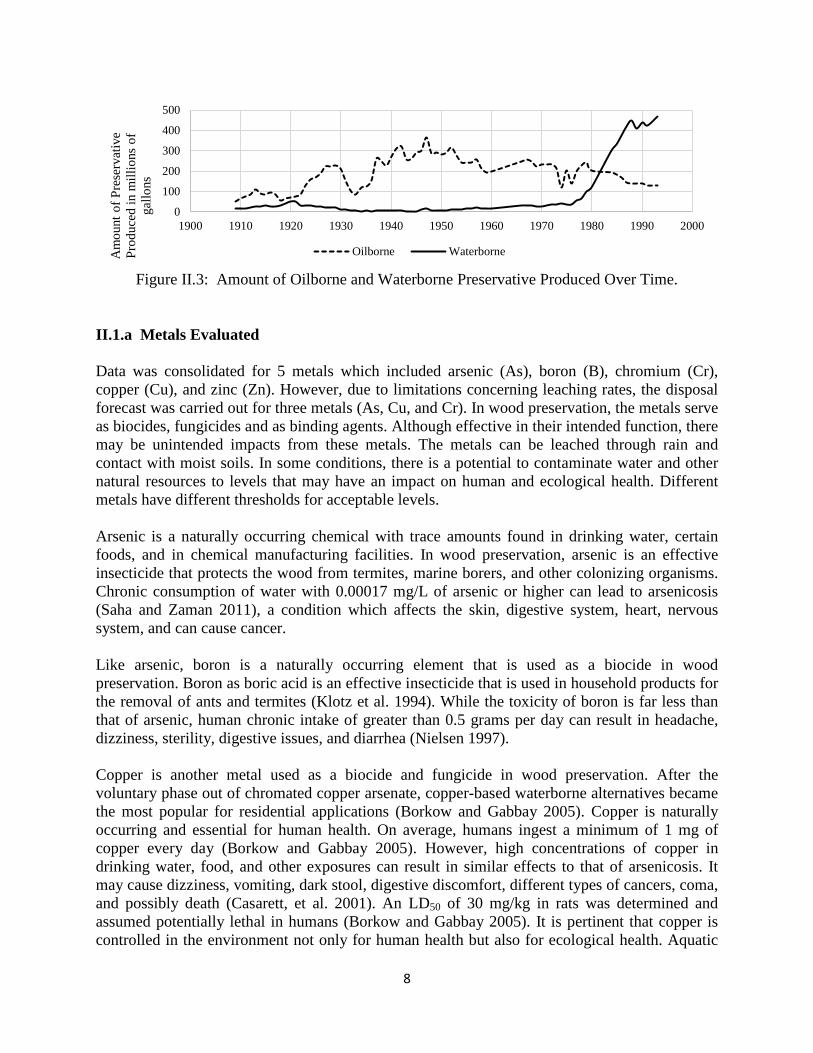
Waterborne preservatives were in the market since the origin of documented wood preservation but at a much lower share than creosote and oilborne options. In the 1960s, waterborne preservatives began to grow in popularity with the advent of chromated copper arsenate (CCA). Figure II.2 shows the proportion of wood treated with various types of preservatives over the decades since the 1960s. The proportion of the total volume of treated wood produced being treated with waterborne preservatives sharply increased over time. By the 1970s, CCA treated wood not only dominated the treated wood market but also allowed for the growth of specific treated wood commodities used in residential applications, that of lumbers and timbers, and agricultural fence posts. Figure II.3 illustrates this increase in overall production of treated wood due to the new markets (e.g., outdoor wood decks and fences) that were facilitated by waterborne preservatives like CCA. In 2004 immediately following Scientific Advisory Panels organized by
7
the U.S. Environmental Protection Agency, the industry voluntarily phased out CCA for residential applications in favor of arsenic-free alternatives (US EPA 2002). Most of the arsenic-free waterborne alternatives are copper-based including Alkaline Copper Quat (ACQ), Micronized Copper Quat (MCQ), Copper Azole (CA), and Micronized Copper Azole (MCQ). The amount of copper in each of the preservatives differs and some also contain azoles such as tebuconazole. The copper in MCQ-treated wood is added as a micronized particle as opposed to the ACQ solution where the copper is dissolved. The difference in the toxicology of the copper when introduced as a particle instead of as a dissolved chemical is currently unknown. Also, copper leaches from each at different rates (Jones et al. 2017b). Despite ACQ and MCQ having the same chemical formula we estimated the amount of each type of wood within the disposal sector separately due to differences in leaching rates and potentially differences in the toxicity of copper contained in each.
Figure II.1: Number of Wood Treatment Plants in the United States Versus Year.
Figure II.2: Proportion of Wood Volume Production Treated with Different Categories of Wood
Treatment Preservatives.
0
100
200
300
400
500
1900 1910 1920 1930 1940 1950 1960 1970 1980 1990 2000
0%
20%
40%
60%
80%
100%
1960 1970 1980 1990 2004
Perc
ent o
f Tot
al V
olum
e Pr
oduc
ed
Creosote Oilborne Waterborne Fire Retardants Other
8
Figure II.3: Amount of Oilborne and Waterborne Preservative Produced Over Time.
II.1.a Metals Evaluated Data was consolidated for 5 metals which included arsenic (As), boron (B), chromium (Cr), copper (Cu), and zinc (Zn). However, due to limitations concerning leaching rates, the disposal forecast was carried out for three metals (As, Cu, and Cr). In wood preservation, the metals serve as biocides, fungicides and as binding agents. Although effective in their intended function, there may be unintended impacts from these metals. The metals can be leached through rain and contact with moist soils. In some conditions, there is a potential to contaminate water and other natural resources to levels that may have an impact on human and ecological health. Different metals have different thresholds for acceptable levels. Arsenic is a naturally occurring chemical with trace amounts found in drinking water, certain foods, and in chemical manufacturing facilities. In wood preservation, arsenic is an effective insecticide that protects the wood from termites, marine borers, and other colonizing organisms. Chronic consumption of water with 0.00017 mg/L of arsenic or higher can lead to arsenicosis (Saha and Zaman 2011), a condition which affects the skin, digestive system, heart, nervous system, and can cause cancer. Like arsenic, boron is a naturally occurring element that is used as a biocide in wood preservation. Boron as boric acid is an effective insecticide that is used in household products for the removal of ants and termites (Klotz et al. 1994). While the toxicity of boron is far less than that of arsenic, human chronic intake of greater than 0.5 grams per day can result in headache, dizziness, sterility, digestive issues, and diarrhea (Nielsen 1997). Copper is another metal used as a biocide and fungicide in wood preservation. After the voluntary phase out of chromated copper arsenate, copper-based waterborne alternatives became the most popular for residential applications (Borkow and Gabbay 2005). Copper is naturally occurring and essential for human health. On average, humans ingest a minimum of 1 mg of copper every day (Borkow and Gabbay 2005). However, high concentrations of copper in drinking water, food, and other exposures can result in similar effects to that of arsenicosis. It may cause dizziness, vomiting, dark stool, digestive discomfort, different types of cancers, coma, and possibly death (Casarett, et al. 2001). An LD50 of 30 mg/kg in rats was determined and assumed potentially lethal in humans (Borkow and Gabbay 2005). It is pertinent that copper is controlled in the environment not only for human health but also for ecological health. Aquatic
0
100
200
300
400
500
1900 1910 1920 1930 1940 1950 1960 1970 1980 1990 2000
Am
ount
of P
rese
rvat
ive
Prod
uced
in m
illio
ns o
f ga
llons
Oilborne Waterborne
9
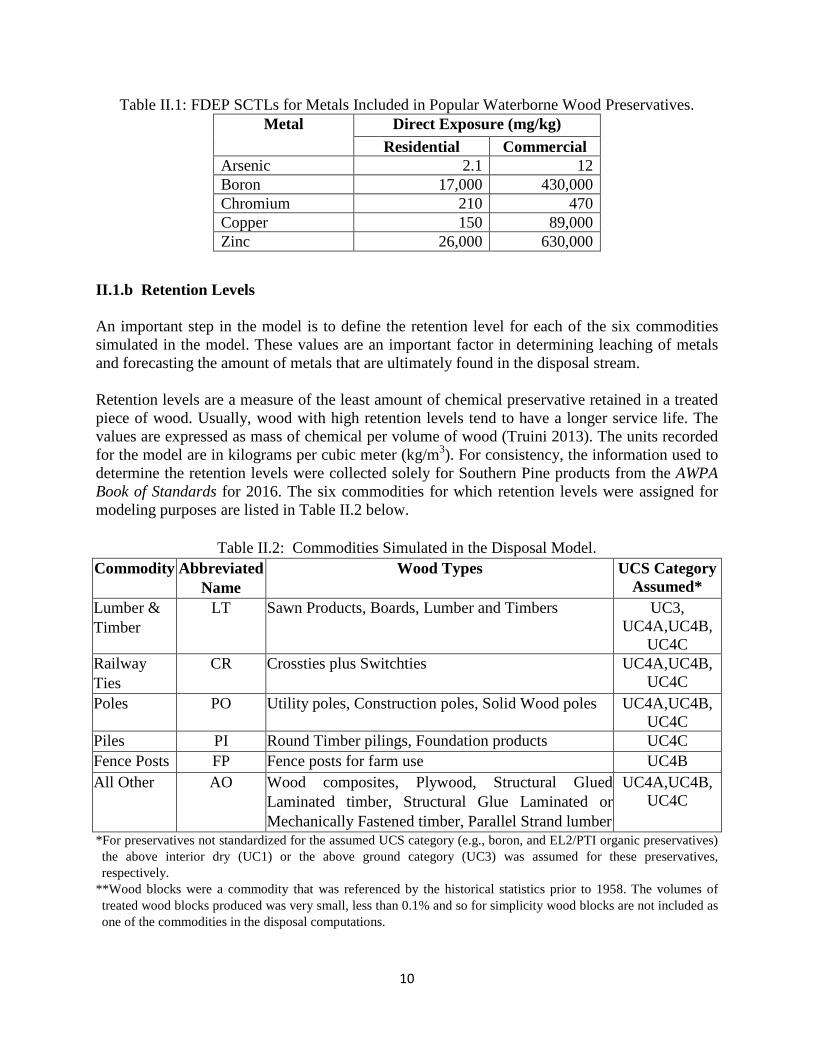
organisms tend to be very sensitive to copper levels in water. Among the metals evaluated in this study, copper is the one most closely associated with impacts to aquatic organisms. Chromium occurs in two main forms: the naturally occurring trivalent chromium Cr (III) or hexavalent chromium Cr (VI) that is almost always anthropogenic (WHO 2003). The naturally occurring trivalent chromium Cr (III) is not as toxic as the hexavalent form since it is poorly absorbed (De Mattia et al. 2004). Hexavalent chromium is harmful to living organisms because it is more readily absorbed. Hexavalent chromium can cause respiratory distress, skin breakdown, gastrointestinal discomfort, renal inefficiency, and cancers of certain organs (WHO 2003). Chromium is used in wood preserving as a binding agent for other preserving components and secondarily a biocide. Chromium fixes other chemicals to wood, binding them through chemical complexes to the wood's cellulose and lignin (Vergara et al. 2013). Chromium commonly used in wood preserving is chromate that contains the more toxic harmful hexavalent chromium Cr (VI). Upon addition of Cr (VI) to wood, it transforms to less toxic Cr (III). The last metal evaluated was zinc, a naturally occurring metal found in abundance at the Earth’s crust. As a wood preservative, usually in the form of zinc chloride, it is considered hazardous to human and environmental health. Zinc is also an essential nutrient for human health. If a large zinc exposure occurs, a person may experience nausea, vomiting, diarrhea, respiratory effects, anemia, and pancreatic effects (ASTDR 2005). One way to compare the toxicity of the preservative metals quantitatively is through environmental regulatory standards. For instance, the FDEP uses soil cleanup target levels (SCTLs) to regulate the concentration of contaminants in soils for both residential and commercial zones. In Table II.1 the SCTLs for the five metals included in this study are listed. The toxicity of each metal contaminant is inversely proportional to the allowable limit in soils with arsenic having the highest human toxicity and zinc having the least. It is important to remember that SCTLs only consider human toxicity. Copper is known to be less harmless to humans but more toxic to marine and aquatic organisms. In comparing the residential SCTLs, arsenic has the lowest threshold level and thus comparatively the most toxic among the five metals evaluated. Threshold levels for copper and chromium are 75 to 100 times higher than those for arsenic. Comparatively, boron and zinc are much less toxic with threshold levels that are 8000 to 12,000 times higher than those for arsenic. Substitution of copper for arsenic in wood treatment preservatives, has reduced potential relative human toxicity by a factor of two to three orders of magnitude in terms of SCTLs. Of note, this comparison does not consider aquatic toxicity nor does it take into account unknown potential toxicities associated with differences in leaching and possible effects from micronized formulations for copper.
10
Table II.1: FDEP SCTLs for Metals Included in Popular Waterborne Wood Preservatives. Metal Direct Exposure (mg/kg)
Residential Commercial Arsenic 2.1 12 Boron 17,000 430,000 Chromium 210 470 Copper 150 89,000 Zinc 26,000 630,000
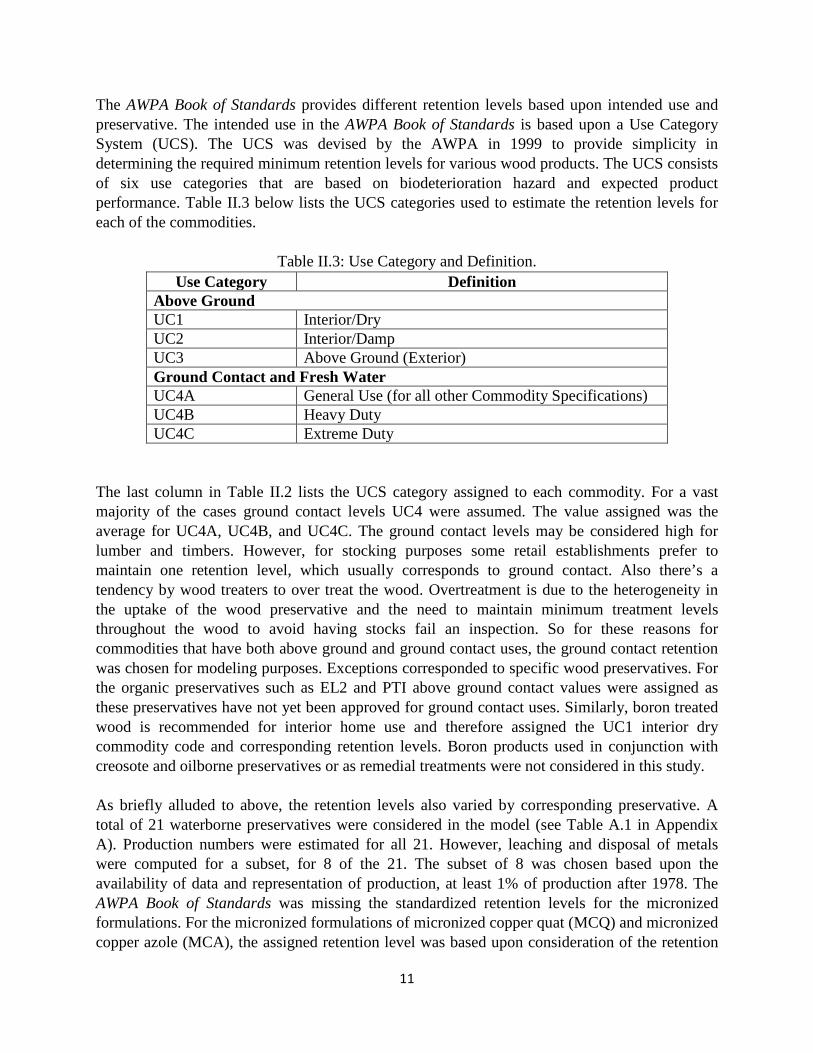
II.1.b Retention Levels An important step in the model is to define the retention level for each of the six commodities simulated in the model. These values are an important factor in determining leaching of metals and forecasting the amount of metals that are ultimately found in the disposal stream. Retention levels are a measure of the least amount of chemical preservative retained in a treated piece of wood. Usually, wood with high retention levels tend to have a longer service life. The values are expressed as mass of chemical per volume of wood (Truini 2013). The units recorded for the model are in kilograms per cubic meter (kg/m3). For consistency, the information used to determine the retention levels were collected solely for Southern Pine products from the AWPA Book of Standards for 2016. The six commodities for which retention levels were assigned for modeling purposes are listed in Table II.2 below.
Table II.2: Commodities Simulated in the Disposal Model. Commodity Abbreviated
Name Wood Types UCS Category
Assumed* Lumber & Timber
LT Sawn Products, Boards, Lumber and Timbers UC3, UC4A,UC4B,
UC4C Railway Ties
CR Crossties plus Switchties UC4A,UC4B, UC4C
Poles PO Utility poles, Construction poles, Solid Wood poles UC4A,UC4B, UC4C
Piles PI Round Timber pilings, Foundation products UC4C Fence Posts FP Fence posts for farm use UC4B All Other AO Wood composites, Plywood, Structural Glued
Laminated timber, Structural Glue Laminated or Mechanically Fastened timber, Parallel Strand lumber
UC4A,UC4B, UC4C
*For preservatives not standardized for the assumed UCS category (e.g., boron, and EL2/PTI organic preservatives) the above interior dry (UC1) or the above ground category (UC3) was assumed for these preservatives, respectively.
**Wood blocks were a commodity that was referenced by the historical statistics prior to 1958. The volumes of treated wood blocks produced was very small, less than 0.1% and so for simplicity wood blocks are not included as one of the commodities in the disposal computations.
11
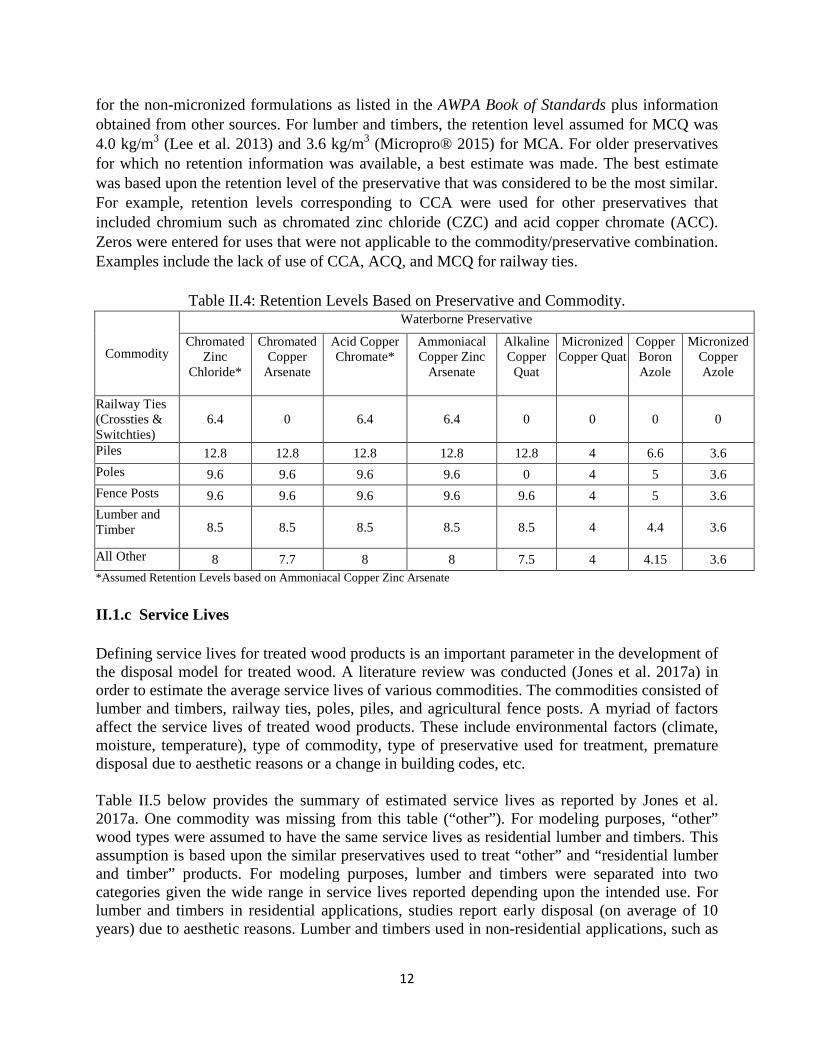
The AWPA Book of Standards provides different retention levels based upon intended use and preservative. The intended use in the AWPA Book of Standards is based upon a Use Category System (UCS). The UCS was devised by the AWPA in 1999 to provide simplicity in determining the required minimum retention levels for various wood products. The UCS consists of six use categories that are based on biodeterioration hazard and expected product performance. Table II.3 below lists the UCS categories used to estimate the retention levels for each of the commodities.
Table II.3: Use Category and Definition. Use Category Definition
Above Ground UC1 Interior/Dry UC2 Interior/Damp UC3 Above Ground (Exterior) Ground Contact and Fresh Water UC4A General Use (for all other Commodity Specifications) UC4B Heavy Duty UC4C Extreme Duty
The last column in Table II.2 lists the UCS category assigned to each commodity. For a vast majority of the cases ground contact levels UC4 were assumed. The value assigned was the average for UC4A, UC4B, and UC4C. The ground contact levels may be considered high for lumber and timbers. However, for stocking purposes some retail establishments prefer to maintain one retention level, which usually corresponds to ground contact. Also there’s a tendency by wood treaters to over treat the wood. Overtreatment is due to the heterogeneity in the uptake of the wood preservative and the need to maintain minimum treatment levels throughout the wood to avoid having stocks fail an inspection. So for these reasons for commodities that have both above ground and ground contact uses, the ground contact retention was chosen for modeling purposes. Exceptions corresponded to specific wood preservatives. For the organic preservatives such as EL2 and PTI above ground contact values were assigned as these preservatives have not yet been approved for ground contact uses. Similarly, boron treated wood is recommended for interior home use and therefore assigned the UC1 interior dry commodity code and corresponding retention levels. Boron products used in conjunction with creosote and oilborne preservatives or as remedial treatments were not considered in this study. As briefly alluded to above, the retention levels also varied by corresponding preservative. A total of 21 waterborne preservatives were considered in the model (see Table A.1 in Appendix A). Production numbers were estimated for all 21. However, leaching and disposal of metals were computed for a subset, for 8 of the 21. The subset of 8 was chosen based upon the availability of data and representation of production, at least 1% of production after 1978. The AWPA Book of Standards was missing the standardized retention levels for the micronized formulations. For the micronized formulations of micronized copper quat (MCQ) and micronized copper azole (MCA), the assigned retention level was based upon consideration of the retention
12
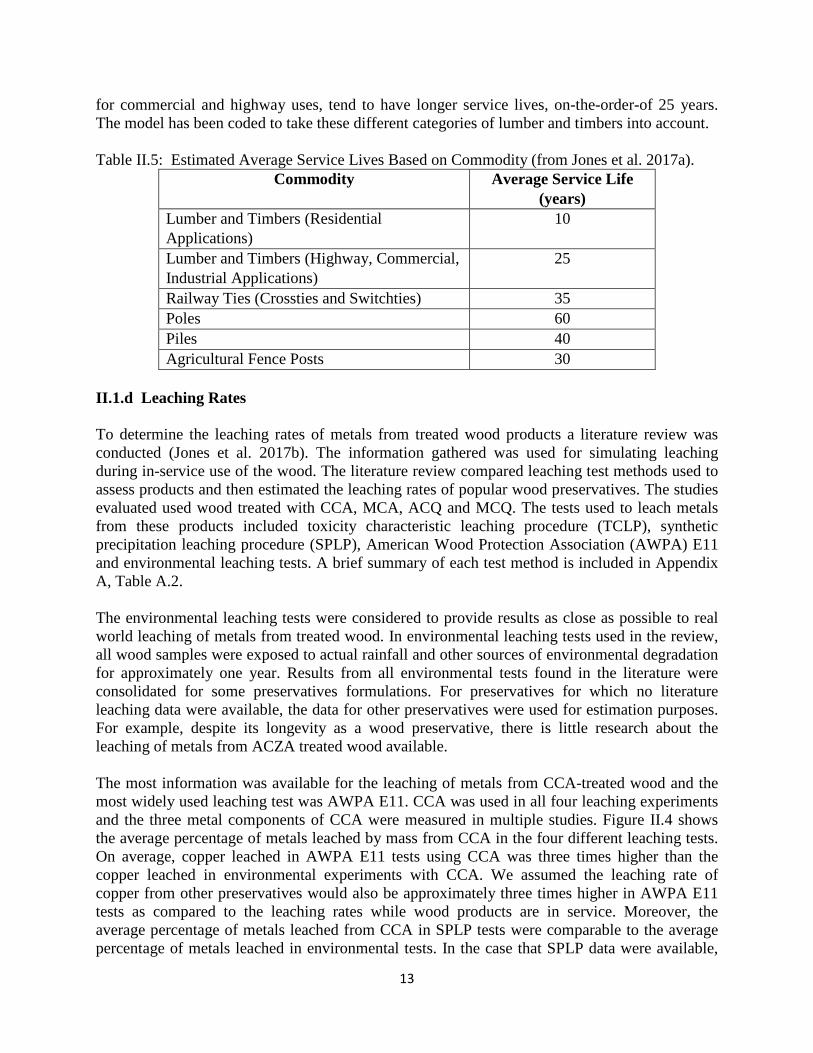
for the non-micronized formulations as listed in the AWPA Book of Standards plus information obtained from other sources. For lumber and timbers, the retention level assumed for MCQ was 4.0 kg/m3 (Lee et al. 2013) and 3.6 kg/m3 (Micropro® 2015) for MCA. For older preservatives for which no retention information was available, a best estimate was made. The best estimate was based upon the retention level of the preservative that was considered to be the most similar. For example, retention levels corresponding to CCA were used for other preservatives that included chromium such as chromated zinc chloride (CZC) and acid copper chromate (ACC). Zeros were entered for uses that were not applicable to the commodity/preservative combination. Examples include the lack of use of CCA, ACQ, and MCQ for railway ties.
Table II.4: Retention Levels Based on Preservative and Commodity.
Commodity
Waterborne Preservative
Chromated Zinc
Chloride*
Chromated Copper
Arsenate
Acid Copper Chromate*
Ammoniacal Copper Zinc
Arsenate
Alkaline Copper
Quat
Micronized Copper Quat
Copper Boron Azole
Micronized Copper Azole
Railway Ties (Crossties & Switchties)
6.4 0 6.4 6.4 0 0 0 0
Piles 12.8 12.8 12.8 12.8 12.8 4 6.6 3.6 Poles 9.6 9.6 9.6 9.6 0 4 5 3.6 Fence Posts 9.6 9.6 9.6 9.6 9.6 4 5 3.6 Lumber and Timber 8.5 8.5 8.5 8.5 8.5 4 4.4 3.6
All Other 8 7.7 8 8 7.5 4 4.15 3.6 *Assumed Retention Levels based on Ammoniacal Copper Zinc Arsenate II.1.c Service Lives Defining service lives for treated wood products is an important parameter in the development of the disposal model for treated wood. A literature review was conducted (Jones et al. 2017a) in order to estimate the average service lives of various commodities. The commodities consisted of lumber and timbers, railway ties, poles, piles, and agricultural fence posts. A myriad of factors affect the service lives of treated wood products. These include environmental factors (climate, moisture, temperature), type of commodity, type of preservative used for treatment, premature disposal due to aesthetic reasons or a change in building codes, etc. Table II.5 below provides the summary of estimated service lives as reported by Jones et al. 2017a. One commodity was missing from this table (“other”). For modeling purposes, “other” wood types were assumed to have the same service lives as residential lumber and timbers. This assumption is based upon the similar preservatives used to treat “other” and “residential lumber and timber” products. For modeling purposes, lumber and timbers were separated into two categories given the wide range in service lives reported depending upon the intended use. For lumber and timbers in residential applications, studies report early disposal (on average of 10 years) due to aesthetic reasons. Lumber and timbers used in non-residential applications, such as
13
for commercial and highway uses, tend to have longer service lives, on-the-order-of 25 years. The model has been coded to take these different categories of lumber and timbers into account. Table II.5: Estimated Average Service Lives Based on Commodity (from Jones et al. 2017a).
Commodity Average Service Life (years)
Lumber and Timbers (Residential Applications)
10
Lumber and Timbers (Highway, Commercial, Industrial Applications)
25
Railway Ties (Crossties and Switchties) 35 Poles 60 Piles 40 Agricultural Fence Posts 30
II.1.d Leaching Rates
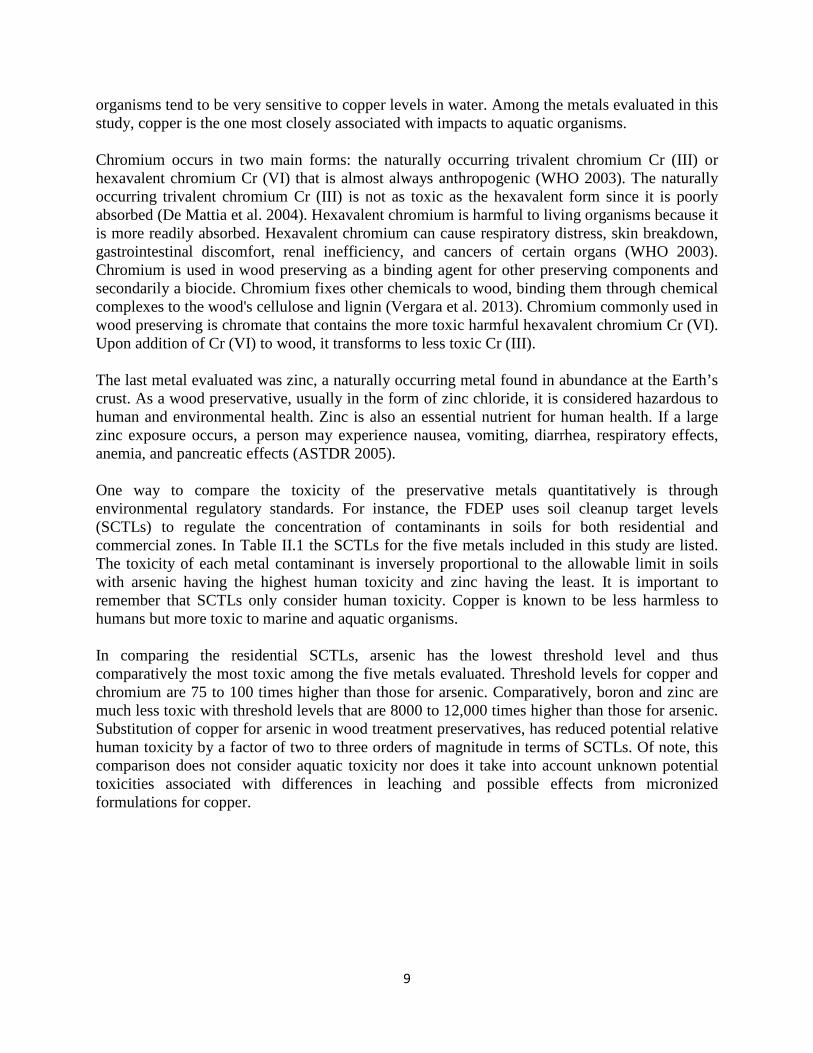
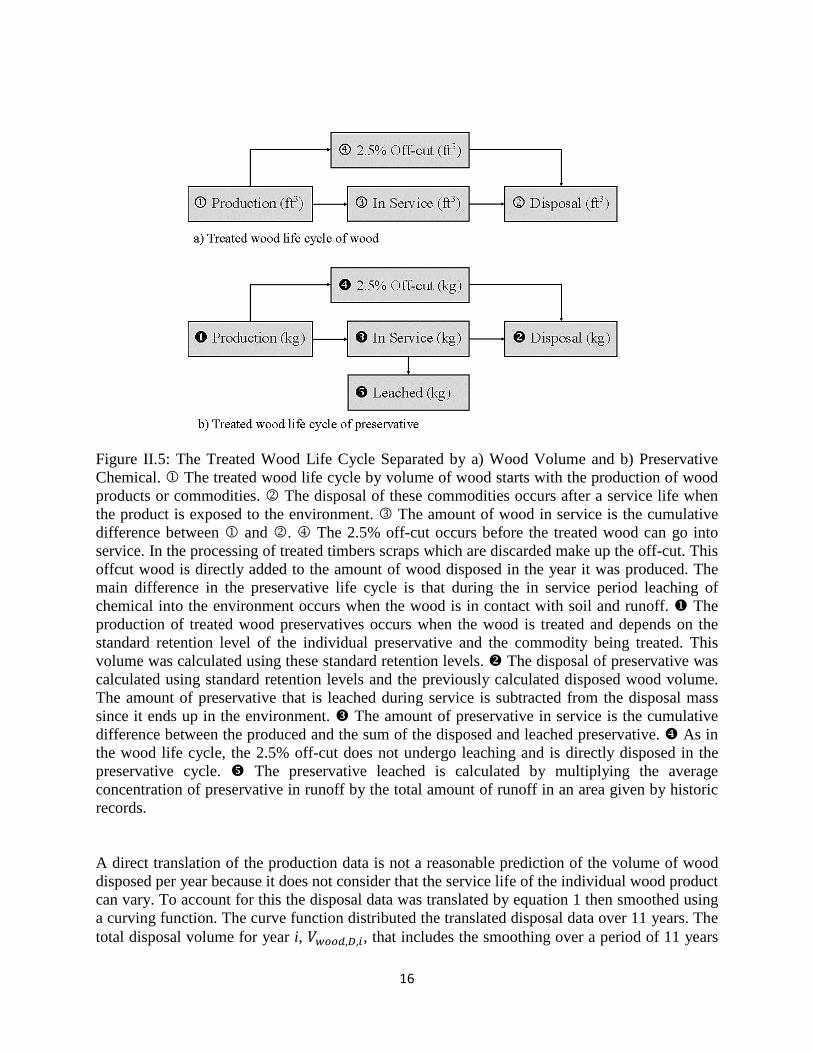
To determine the leaching rates of metals from treated wood products a literature review was conducted (Jones et al. 2017b). The information gathered was used for simulating leaching during in-service use of the wood. The literature review compared leaching test methods used to assess products and then estimated the leaching rates of popular wood preservatives. The studies evaluated used wood treated with CCA, MCA, ACQ and MCQ. The tests used to leach metals from these products included toxicity characteristic leaching procedure (TCLP), synthetic precipitation leaching procedure (SPLP), American Wood Protection Association (AWPA) E11 and environmental leaching tests. A brief summary of each test method is included in Appendix A, Table A.2. The environmental leaching tests were considered to provide results as close as possible to real world leaching of metals from treated wood. In environmental leaching tests used in the review, all wood samples were exposed to actual rainfall and other sources of environmental degradation for approximately one year. Results from all environmental tests found in the literature were consolidated for some preservatives formulations. For preservatives for which no literature leaching data were available, the data for other preservatives were used for estimation purposes. For example, despite its longevity as a wood preservative, there is little research about the leaching of metals from ACZA treated wood available. The most information was available for the leaching of metals from CCA-treated wood and the most widely used leaching test was AWPA E11. CCA was used in all four leaching experiments and the three metal components of CCA were measured in multiple studies. Figure II.4 shows the average percentage of metals leached by mass from CCA in the four different leaching tests. On average, copper leached in AWPA E11 tests using CCA was three times higher than the copper leached in environmental experiments with CCA. We assumed the leaching rate of copper from other preservatives would also be approximately three times higher in AWPA E11 tests as compared to the leaching rates while wood products are in service. Moreover, the average percentage of metals leached from CCA in SPLP tests were comparable to the average percentage of metals leached in environmental tests. In the case that SPLP data were available,
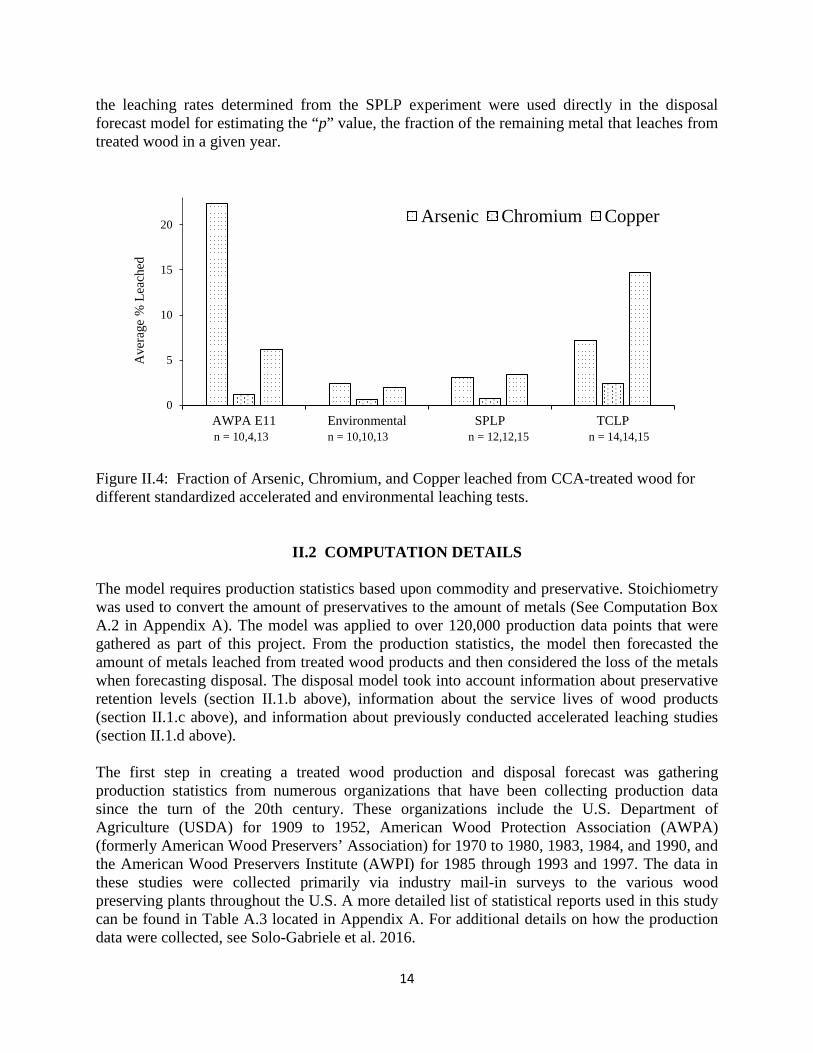
14
the leaching rates determined from the SPLP experiment were used directly in the disposal forecast model for estimating the “p” value, the fraction of the remaining metal that leaches from treated wood in a given year.
Figure II.4: Fraction of Arsenic, Chromium, and Copper leached from CCA-treated wood for different standardized accelerated and environmental leaching tests.
II.2 COMPUTATION DETAILS The model requires production statistics based upon commodity and preservative. Stoichiometry was used to convert the amount of preservatives to the amount of metals (See Computation Box A.2 in Appendix A). The model was applied to over 120,000 production data points that were gathered as part of this project. From the production statistics, the model then forecasted the amount of metals leached from treated wood products and then considered the loss of the metals when forecasting disposal. The disposal model took into account information about preservative retention levels (section II.1.b above), information about the service lives of wood products (section II.1.c above), and information about previously conducted accelerated leaching studies (section II.1.d above). The first step in creating a treated wood production and disposal forecast was gathering production statistics from numerous organizations that have been collecting production data since the turn of the 20th century. These organizations include the U.S. Department of Agriculture (USDA) for 1909 to 1952, American Wood Protection Association (AWPA) (formerly American Wood Preservers’ Association) for 1970 to 1980, 1983, 1984, and 1990, and the American Wood Preservers Institute (AWPI) for 1985 through 1993 and 1997. The data in these studies were collected primarily via industry mail-in surveys to the various wood preserving plants throughout the U.S. A more detailed list of statistical reports used in this study can be found in Table A.3 located in Appendix A. For additional details on how the production data were collected, see Solo-Gabriele et al. 2016.
0
5
10
15
20
AWPA E11 Environmental SPLP TCLP
Ave
rage
% L
each
ed
Arsenic Chromium Copper
n = 10,4,13 n = 10,10,13 n = 12,12,15 n = 14,14,15
15
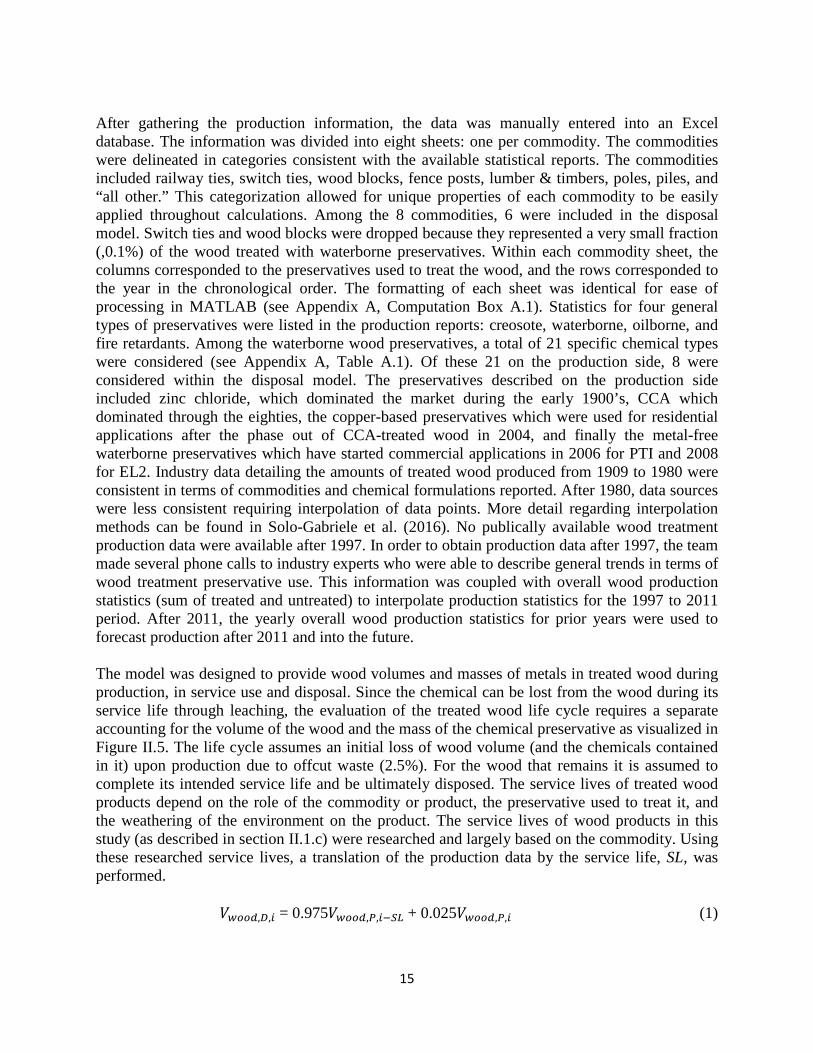
After gathering the production information, the data was manually entered into an Excel database. The information was divided into eight sheets: one per commodity. The commodities were delineated in categories consistent with the available statistical reports. The commodities included railway ties, switch ties, wood blocks, fence posts, lumber & timbers, poles, piles, and “all other.” This categorization allowed for unique properties of each commodity to be easily applied throughout calculations. Among the 8 commodities, 6 were included in the disposal model. Switch ties and wood blocks were dropped because they represented a very small fraction (,0.1%) of the wood treated with waterborne preservatives. Within each commodity sheet, the columns corresponded to the preservatives used to treat the wood, and the rows corresponded to the year in the chronological order. The formatting of each sheet was identical for ease of processing in MATLAB (see Appendix A, Computation Box A.1). Statistics for four general types of preservatives were listed in the production reports: creosote, waterborne, oilborne, and fire retardants. Among the waterborne wood preservatives, a total of 21 specific chemical types were considered (see Appendix A, Table A.1). Of these 21 on the production side, 8 were considered within the disposal model. The preservatives described on the production side included zinc chloride, which dominated the market during the early 1900’s, CCA which dominated through the eighties, the copper-based preservatives which were used for residential applications after the phase out of CCA-treated wood in 2004, and finally the metal-free waterborne preservatives which have started commercial applications in 2006 for PTI and 2008 for EL2. Industry data detailing the amounts of treated wood produced from 1909 to 1980 were consistent in terms of commodities and chemical formulations reported. After 1980, data sources were less consistent requiring interpolation of data points. More detail regarding interpolation methods can be found in Solo-Gabriele et al. (2016). No publically available wood treatment production data were available after 1997. In order to obtain production data after 1997, the team made several phone calls to industry experts who were able to describe general trends in terms of wood treatment preservative use. This information was coupled with overall wood production statistics (sum of treated and untreated) to interpolate production statistics for the 1997 to 2011 period. After 2011, the yearly overall wood production statistics for prior years were used to forecast production after 2011 and into the future. The model was designed to provide wood volumes and masses of metals in treated wood during production, in service use and disposal. Since the chemical can be lost from the wood during its service life through leaching, the evaluation of the treated wood life cycle requires a separate accounting for the volume of the wood and the mass of the chemical preservative as visualized in Figure II.5. The life cycle assumes an initial loss of wood volume (and the chemicals contained in it) upon production due to offcut waste (2.5%). For the wood that remains it is assumed to complete its intended service life and be ultimately disposed. The service lives of treated wood products depend on the role of the commodity or product, the preservative used to treat it, and the weathering of the environment on the product. The service lives of wood products in this study (as described in section II.1.c) were researched and largely based on the commodity. Using these researched service lives, a translation of the production data by the service life, SL, was performed.
𝑉𝑤𝑤𝑤𝑤,𝐷,𝑖 = 0.975𝑉𝑤𝑤𝑤𝑤,𝑃,𝑖−𝑆𝑆 + 0.025𝑉𝑤𝑤𝑤𝑤,𝑃,𝑖 (1)
16
Figure II.5: The Treated Wood Life Cycle Separated by a) Wood Volume and b) Preservative Chemical. The treated wood life cycle by volume of wood starts with the production of wood products or commodities. The disposal of these commodities occurs after a service life when the product is exposed to the environment. The amount of wood in service is the cumulative difference between and . The 2.5% off-cut occurs before the treated wood can go into service. In the processing of treated timbers scraps which are discarded make up the off-cut. This offcut wood is directly added to the amount of wood disposed in the year it was produced. The main difference in the preservative life cycle is that during the in service period leaching of chemical into the environment occurs when the wood is in contact with soil and runoff. The production of treated wood preservatives occurs when the wood is treated and depends on the standard retention level of the individual preservative and the commodity being treated. This volume was calculated using these standard retention levels. The disposal of preservative was calculated using standard retention levels and the previously calculated disposed wood volume. The amount of preservative that is leached during service is subtracted from the disposal mass since it ends up in the environment. The amount of preservative in service is the cumulative difference between the produced and the sum of the disposed and leached preservative. As in the wood life cycle, the 2.5% off-cut does not undergo leaching and is directly disposed in the preservative cycle. The preservative leached is calculated by multiplying the average concentration of preservative in runoff by the total amount of runoff in an area given by historic records. A direct translation of the production data is not a reasonable prediction of the volume of wood disposed per year because it does not consider that the service life of the individual wood product can vary. To account for this the disposal data was translated by equation 1 then smoothed using a curving function. The curve function distributed the translated disposal data over 11 years. The total disposal volume for year i, 𝑉𝑤𝑤𝑤𝑤,𝐷,𝑖, that includes the smoothing over a period of 11 years
17
would then be expressed by equation 2. The disposal from year i becomes 10% of the translated disposal volume from years i-2 through i+2, 8.33% of the disposal volume from years i-3 through i-5 and i+3 through i+5, and 2.5% of the production volume from year i in the form of the offcut, 0.025𝑉𝑤𝑤𝑤𝑤,𝑃,𝑖.
𝑉′𝑤𝑤𝑤𝑤,𝐷,𝑖 = 0.0833𝑉𝑤𝑤𝑤𝑤,𝐷,𝑖−5 + 0.0833𝑉𝑤𝑤𝑤𝑤,𝐷,𝑖−4 + 0.0833𝑉𝑤𝑤𝑤𝑤,𝐷,𝑖−3
+ 0.1𝑉𝑤𝑤𝑤𝑤,𝐷,𝑖−2 + 0.1𝑉𝑤𝑤𝑤𝑤,𝐷,𝑖−1 + 0.1𝑉𝑤𝑤𝑤𝑤,𝐷,𝑖 + 0.1𝑉𝑤𝑤𝑤𝑤,𝐷,𝑖+1 + 0.1𝑉𝑤𝑤𝑤𝑤,𝐷,𝑖+2 (2) + 0.0833𝑉𝑤𝑤𝑤𝑤,𝐷,𝑖+3 + 0.0833𝑉𝑤𝑤𝑤𝑤,𝐷,𝑖+4 + 0.0833𝑉𝑤𝑤𝑤𝑤,𝐷,𝑖+5 + 0.025𝑉𝑤𝑤𝑤𝑤,𝑃,𝑖
The volume of wood in service, 𝑉𝑤𝑤𝑤𝑤,𝐼𝑆,𝑖 at any given time was calculated from mass balance considerations as the cumulative difference between the production volume for year i, 𝑉𝑤𝑤𝑤𝑤,𝑃,𝑖 and the disposal volume, 𝑉′𝑤𝑤𝑤𝑤,𝐷,𝑖 (equation 3).
𝑉𝑤𝑤𝑤𝑤,𝐼𝑆,𝑖 = � (𝑖
1909 0.975𝑉𝑤𝑤𝑤𝑤,𝑃,𝑖 − 𝑉′𝑤𝑤𝑤𝑤,𝐷,𝑖) (3) This volume of wood in service was then used to calculate the mass of preservative and its constituents in service. The standard retention level, 𝑅𝑅𝑝𝑝𝑝𝑝 of a preservative in a treated wood product is given in mass of preservative per unit volume of wood (as described in section II.1.b). Therefore the mass, 𝑚𝑝𝑝𝑝𝑝,𝐼𝑆,𝑖, of preservative in service during a year is given by equation 4. In a similar fashion the mass of a chemical constituent present in the in service volume before leaching, 𝑚𝑚𝑝𝑡𝑎𝑎,𝐼𝑆,𝑖 is given by equation 5 in which 𝑓 is the percentage composition on an oxide basis of that chemical by weight.
𝑚𝑝𝑝𝑝𝑝,𝐼𝑆,𝑖 = 𝑉𝑤𝑤𝑤𝑤,𝐼𝑆,𝑖 𝑥 𝑅𝑅𝑝𝑝𝑝𝑝 (4)
𝑚𝑚𝑝𝑡𝑎𝑎,𝐼𝑆,𝑖 = 𝑉𝑤𝑤𝑤𝑤,𝐼𝑆,𝑖 𝑥 𝑅𝑅𝑝𝑝𝑝𝑝 𝑥 𝑓 (5) The masses of preservative and metals in the treated wood production, 𝑚𝑝𝑝𝑝𝑝,𝑃,𝑖 and 𝑚𝑚𝑝𝑡𝑎𝑎,𝑃,𝑖, and disposed, 𝑚𝑝𝑝𝑝𝑝,𝐷,𝑖 and 𝑚𝑚𝑝𝑡𝑎𝑎,𝐷,𝑖 were calculated in a similar fashion as in equations 4 and 5 above. The leaching data in this study was calculated using information gathered by Jones et. al 2017 in the International Research Group on Wood Protection’s annual proceedings. The literature review includes numerous wood preservative leaching studies of different procedures. The information gathered was used to arrive at an average annual percentage of metals leached, p, which is unique to each preservative. In order to calculate the amount of metals that are leached, each year’s production mass was treated individually then combined to get annual leaching data. The treated wood produced in year, i, will be exposed to leaching forces for the number of years that it is in service or its service life, SL. Each year during the service life, a percentage of metals leaches and is subtracted from the original mass of metals produced as per the following sample calculation. Example:
18
This mass of metal goes into service in 1970, 𝑚(1970)𝑚𝑝𝑡𝑎𝑎,𝑃,1970, and has a service life of 15 years means that the wood will be disposed in 1985. For year subsequent year that it is in service after 1970, it leaches metals proportionally, p, to the metals left in the material by the following equation set. (1) 𝑚(1970)𝑚𝑝𝑡𝑎𝑎,𝑆,1970 = 𝑝 ∗ 𝑚(1970)𝑚𝑝𝑡𝑎𝑎,𝑃,1970 The mass of metals remaining in the treated wood product, 𝑚(1970)𝑚𝑝𝑡𝑎𝑎,𝑅,1971, is equal to the original mass minus the mass leached. (2) 𝑚(1970)𝑚𝑝𝑡𝑎𝑎,𝑅,1971 = 𝑚(1970)𝑚𝑝𝑡𝑎𝑎,𝑃,1970 − 𝑚(1970)𝑚𝑝𝑡𝑎𝑎,𝑆,1970 After the initial set-up in steps (1) and (2), steps (3) and (4) are repeated until the end of the service life is reached. (3) 𝑚(1970)𝑚𝑝𝑡𝑎𝑎,𝑆,1971 = 𝑝 ∗ 𝑚(1970)𝑚𝑝𝑡𝑎𝑎,𝑅,1971 (4) 𝑚(1970)𝑚𝑝𝑡𝑎𝑎,𝑅,1972 = 𝑚(1970)𝑚𝑝𝑡𝑎𝑎,𝑅,1971 − 𝑚(1970)𝑚𝑝𝑡𝑎𝑎,𝑆,1971 (3) 𝑚(1970)𝑚𝑝𝑡𝑎𝑎,𝑆,1972 = 𝑝 ∗ 𝑚(1970)𝑚𝑝𝑡𝑎𝑎,𝑅,1972 (4) 𝑚(1970)𝑚𝑝𝑡𝑎𝑎,𝑅,1973 = 𝑚(1970)𝑚𝑝𝑡𝑎𝑎,𝑅,1972 − 𝑚(1970)𝑚𝑝𝑡𝑎𝑎,𝑆,1972
When the end of the service life is reached, step (3) is repeated once more and the loop ends. (3) 𝑚(1970)𝑚𝑝𝑡𝑎𝑎,𝑆,1985 = 𝑝 ∗ 𝑚(1970)𝑚𝑝𝑡𝑎𝑎,𝑅,1984 In the generalized equation set (6) we refer to the year of production as capital I and the year of leaching at lower case i. (1) 𝑚(𝐼)𝑚𝑝𝑡𝑎𝑎,𝑆,𝑖 = 𝑝 ∗ 𝑚(𝐼)𝑚𝑝𝑡𝑎𝑎,𝑃,𝑖 (2) 𝑚(𝐼)𝑚𝑝𝑡𝑎𝑎,𝑅,𝑖+1 = 𝑚(𝐼)𝑚𝑝𝑡𝑎𝑎,𝑃,𝑖 − 𝑚(𝐼)𝑚𝑝𝑡𝑎𝑎,𝑆,𝑖 (6) (3) 𝑚(𝐼)𝑚𝑝𝑡𝑎𝑎,𝑆,𝑖+1 = 𝑝 ∗ 𝑚(𝐼)𝑚𝑝𝑡𝑎𝑎,𝑅,𝑖+1 (4) 𝑚(𝐼)𝑚𝑝𝑡𝑎𝑎,𝑅,𝑖+2 = 𝑚(𝐼)𝑚𝑝𝑡𝑎𝑎,𝑅,𝑖+1 − 𝑚(𝐼)𝑚𝑝𝑡𝑎𝑎,𝑆,𝑖+1 In order to calculate the mass of metals leached from all treated wood in service in a given year, i, the metals leached from wood in service during all prior years, I, must be added. Example: To calculate the mass of metals leached in 1985 from all of the wood produced from 1970-1985 the calculation would be as follows:
𝑚𝑚𝑝𝑡𝑎𝑎,𝑆,1985 = 𝑚(1970)𝑚𝑝𝑡𝑎𝑎,𝑆,1985 + 𝑚(1971)𝑚𝑝𝑡𝑎𝑎,𝑆,1985 … + 𝑚(1985)𝑚𝑝𝑡𝑎𝑎,𝑆,1985
19
In more general format the above equation can be expressed as follows:
𝑚𝑚𝑝𝑡𝑎𝑎,𝑆,𝑖 = 𝑚(𝐼)𝑚𝑝𝑡𝑎𝑎,𝑆,𝑖 + 𝑚(𝐼 + 1)𝑚𝑝𝑡𝑎𝑎,𝑆,𝑖 … + 𝑚(𝐼 + 𝑆𝑆)𝑚𝑝𝑡𝑎𝑎,𝑆,𝑖 (7) Note: for each commodity having a different service life, the number of iterations of the above equations would vary. The final step in the treated wood disposal and leaching model is to compute the mass of metals disposed accounting for leaching, m’. This value is computed by subtracting the mass of metals leached from treated wood products while in service from the mass of metals that would have been disposed if no leaching were to occur. In order to account for the delay in disposal while wood is in service, the mass of metals leached, 𝑚𝑚𝑝𝑡𝑎𝑎,𝑆,𝑖 is subtracted from the mass of metals in the disposal prior to leaching at a time lag corresponding to the commodity service life, SL, as per equation 8.
𝑚′𝑚𝑝𝑡𝑎𝑎,𝐷,𝑖 = 𝑚𝑚𝑝𝑡𝑎𝑎,𝐷,𝑖 − 𝑚𝑚𝑝𝑡𝑎𝑎,𝑆,𝑖−𝑆𝑆 (8)
While the volume of wood in service was calculated by equation 1 and was the cumulative difference between the production and disposal of treated wood, the cumulative metals in service will also take leaching into account. The equation that describes the cumulative mass of metals in service after leaching is given by equation 9.
𝑚′𝑚𝑝𝑡𝑎𝑎,𝐼𝑆,𝑖 = � (𝑚𝑚𝑝𝑡𝑎𝑎,𝑃,𝑖
𝑖1909 − 𝑚′𝑚𝑝𝑡𝑎𝑎,𝐷,𝑖 − 𝑚𝑚𝑝𝑡𝑎𝑎,𝑆,𝑖) (9)
II.3 RESULTS
Plots in this section correspond to U.S. statistics. Estimates for Florida can be obtained by multiplying the U.S. statistics by 0.1 as Florida represents about 10% of the U.S. treated wood production.
II.3.a Volumes of Treated Wood Results show that the volumes of waterborne treated wood increased greatly during the 1980’s through to 2005 (Figure II.6). This increase is attributed to the increase in treated lumber and timber, presumably due to an increasing residential market for outdoor wooden decks and docks. The”other” category has also increased in recent years due to specialty wood treated markets, such as garden trellises and glue laminates. Interestingly the model suggests that the volume of treated poles, piles, and fence posts has remained relatively constant from the 1940s onward. The chemical used to treat wood has also varied over the years. Creosote dominated the market up through 1970. CCA dominated between 1980 through 2004. After 2004, a sequence of copper-based alternatives dominated the market, starting with ACQ and transitioning to the micronized formulation, MCQ, and ultimately to MCA.
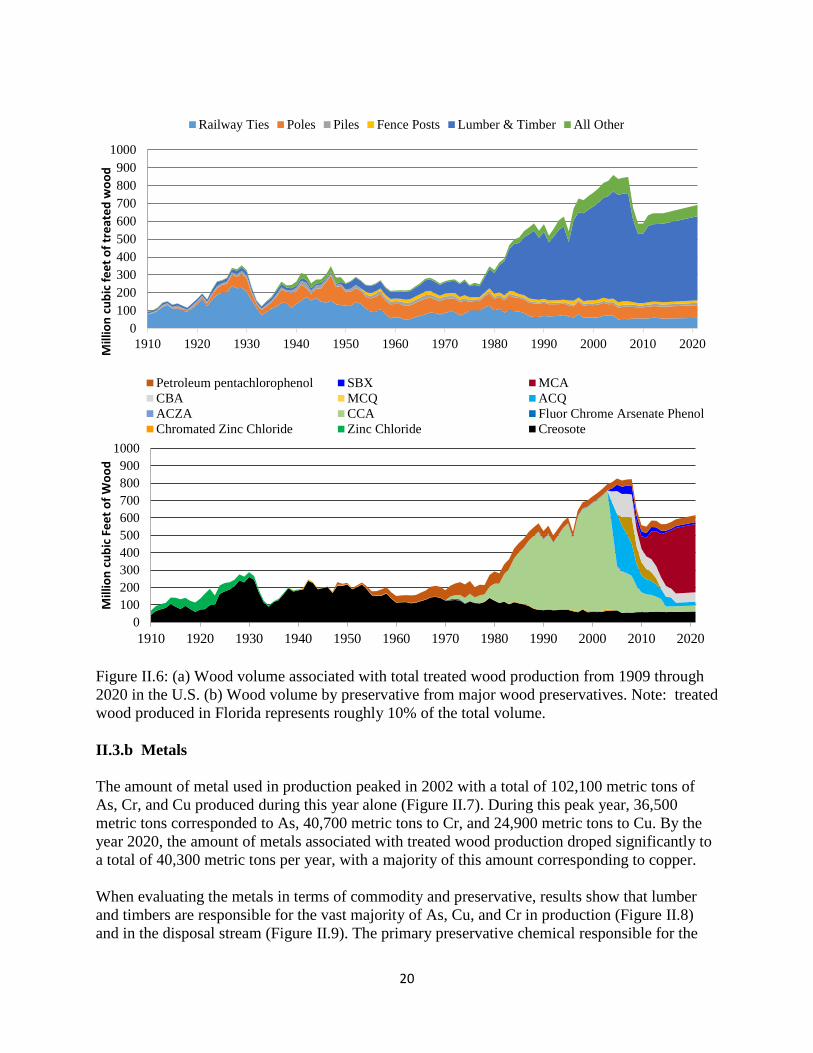
20
Figure II.6: (a) Wood volume associated with total treated wood production from 1909 through 2020 in the U.S. (b) Wood volume by preservative from major wood preservatives. Note: treated wood produced in Florida represents roughly 10% of the total volume. II.3.b Metals The amount of metal used in production peaked in 2002 with a total of 102,100 metric tons of As, Cr, and Cu produced during this year alone (Figure II.7). During this peak year, 36,500 metric tons corresponded to As, 40,700 metric tons to Cr, and 24,900 metric tons to Cu. By the year 2020, the amount of metals associated with treated wood production droped significantly to a total of 40,300 metric tons per year, with a majority of this amount corresponding to copper. When evaluating the metals in terms of commodity and preservative, results show that lumber and timbers are responsible for the vast majority of As, Cu, and Cr in production (Figure II.8) and in the disposal stream (Figure II.9). The primary preservative chemical responsible for the
0100200300400500600700800900
1000
1910 1920 1930 1940 1950 1960 1970 1980 1990 2000 2010 2020Mill
ion
cubi
c fe
et o
f tre
ated
woo
d Railway Ties Poles Piles Fence Posts Lumber & Timber All Other
0100200300400500600700800900
1000
1910 1920 1930 1940 1950 1960 1970 1980 1990 2000 2010 2020
Mill
ion
cubi
c Fe
et o
f Woo
d
Petroleum pentachlorophenol SBX MCACBA MCQ ACQACZA CCA Fluor Chrome Arsenate PhenolChromated Zinc Chloride Zinc Chloride Creosote
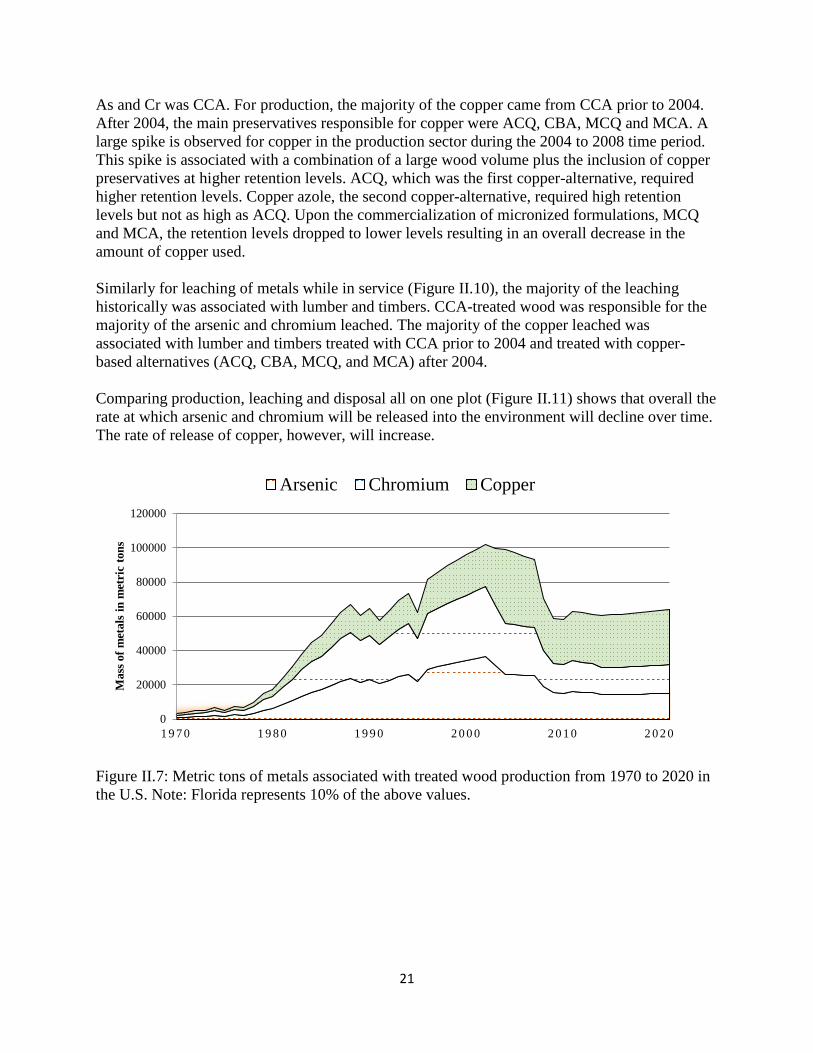
21
As and Cr was CCA. For production, the majority of the copper came from CCA prior to 2004. After 2004, the main preservatives responsible for copper were ACQ, CBA, MCQ and MCA. A large spike is observed for copper in the production sector during the 2004 to 2008 time period. This spike is associated with a combination of a large wood volume plus the inclusion of copper preservatives at higher retention levels. ACQ, which was the first copper-alternative, required higher retention levels. Copper azole, the second copper-alternative, required high retention levels but not as high as ACQ. Upon the commercialization of micronized formulations, MCQ and MCA, the retention levels dropped to lower levels resulting in an overall decrease in the amount of copper used. Similarly for leaching of metals while in service (Figure II.10), the majority of the leaching historically was associated with lumber and timbers. CCA-treated wood was responsible for the majority of the arsenic and chromium leached. The majority of the copper leached was associated with lumber and timbers treated with CCA prior to 2004 and treated with copper-based alternatives (ACQ, CBA, MCQ, and MCA) after 2004. Comparing production, leaching and disposal all on one plot (Figure II.11) shows that overall the rate at which arsenic and chromium will be released into the environment will decline over time. The rate of release of copper, however, will increase.
Figure II.7: Metric tons of metals associated with treated wood production from 1970 to 2020 in the U.S. Note: Florida represents 10% of the above values.
0
20000
40000
60000
80000
100000
120000
1 9 7 0 1 9 8 0 1 9 9 0 2 0 0 0 2 0 1 0 2 0 2 0
Mas
s of m
etal
s in
met
ric
tons
Arsenic Chromium Copper
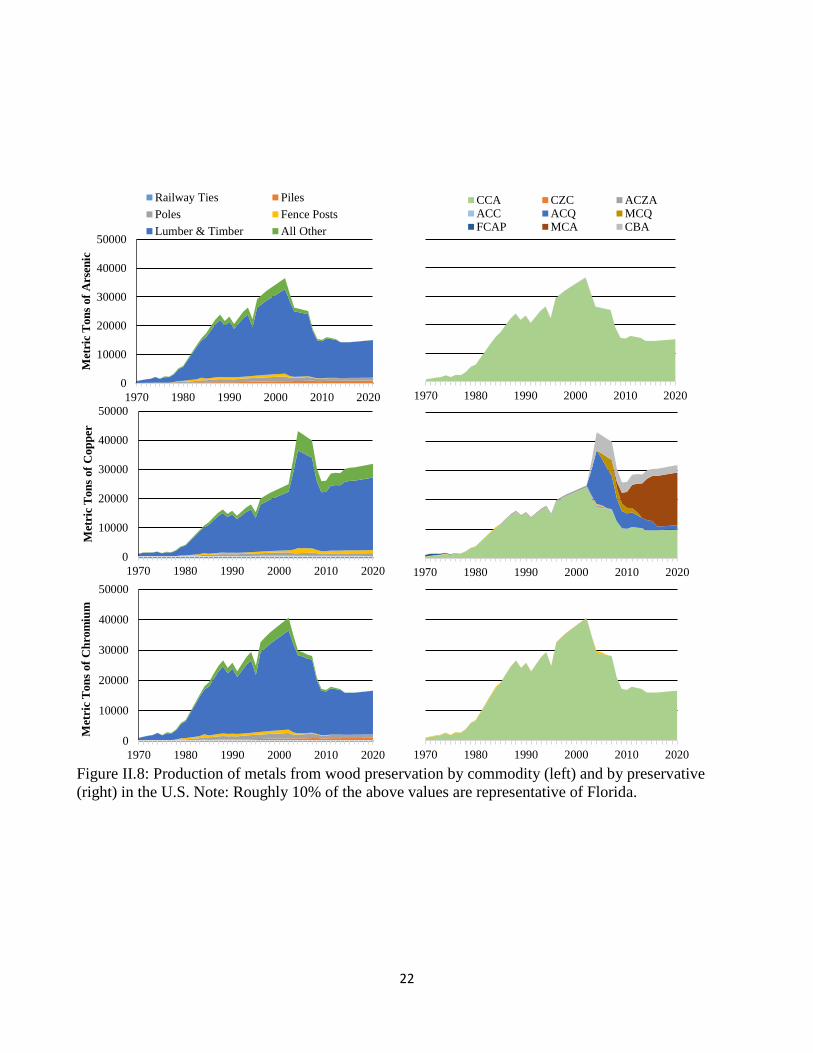
22
Figure II.8: Production of metals from wood preservation by commodity (left) and by preservative (right) in the U.S. Note: Roughly 10% of the above values are representative of Florida.
0
10000
20000
30000
40000
50000
1970 1980 1990 2000 2010 2020
Met
ric
Ton
s of A
rsen
ic
Railway Ties PilesPoles Fence PostsLumber & Timber All Other
1970 1980 1990 2000 2010 2020
CCA CZC ACZAACC ACQ MCQFCAP MCA CBA
0
10000
20000
30000
40000
50000
1970 1980 1990 2000 2010 2020
Met
ric
Ton
s of C
oppe
r
1970 1980 1990 2000 2010 2020
0
10000
20000
30000
40000
50000
1970 1980 1990 2000 2010 2020
Met
ric
Ton
s of C
hrom
ium
1970 1980 1990 2000 2010 2020
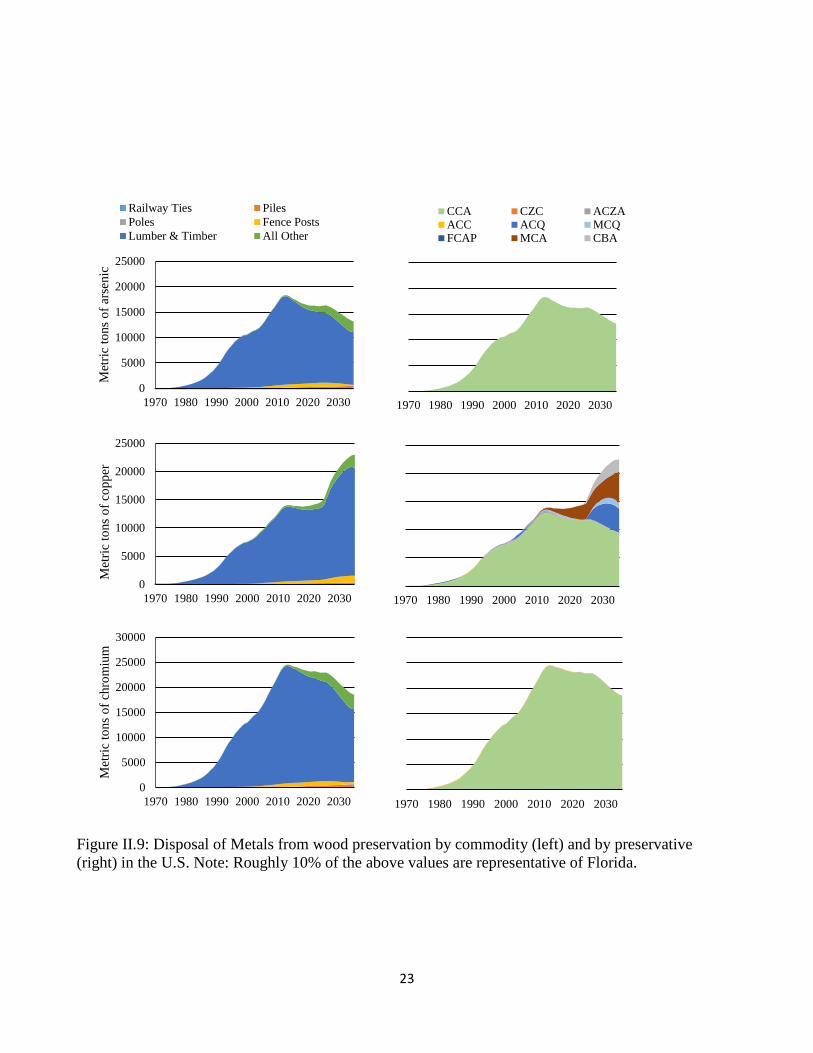
23
Figure II.9: Disposal of Metals from wood preservation by commodity (left) and by preservative (right) in the U.S. Note: Roughly 10% of the above values are representative of Florida.
0
5000
10000
15000
20000
25000
1970 1980 1990 2000 2010 2020 2030
Met
ric to
ns o
f ars
enic
Railway Ties PilesPoles Fence PostsLumber & Timber All Other
1970 1980 1990 2000 2010 2020 2030
CCA CZC ACZAACC ACQ MCQFCAP MCA CBA
0
5000
10000
15000
20000
25000
1970 1980 1990 2000 2010 2020 2030
Met
ric to
ns o
f cop
per
1970 1980 1990 2000 2010 2020 2030
0
5000
10000
15000
20000
25000
30000
1970 1980 1990 2000 2010 2020 2030
Met
ric to
ns o
f chr
omiu
m
1970 1980 1990 2000 2010 2020 2030
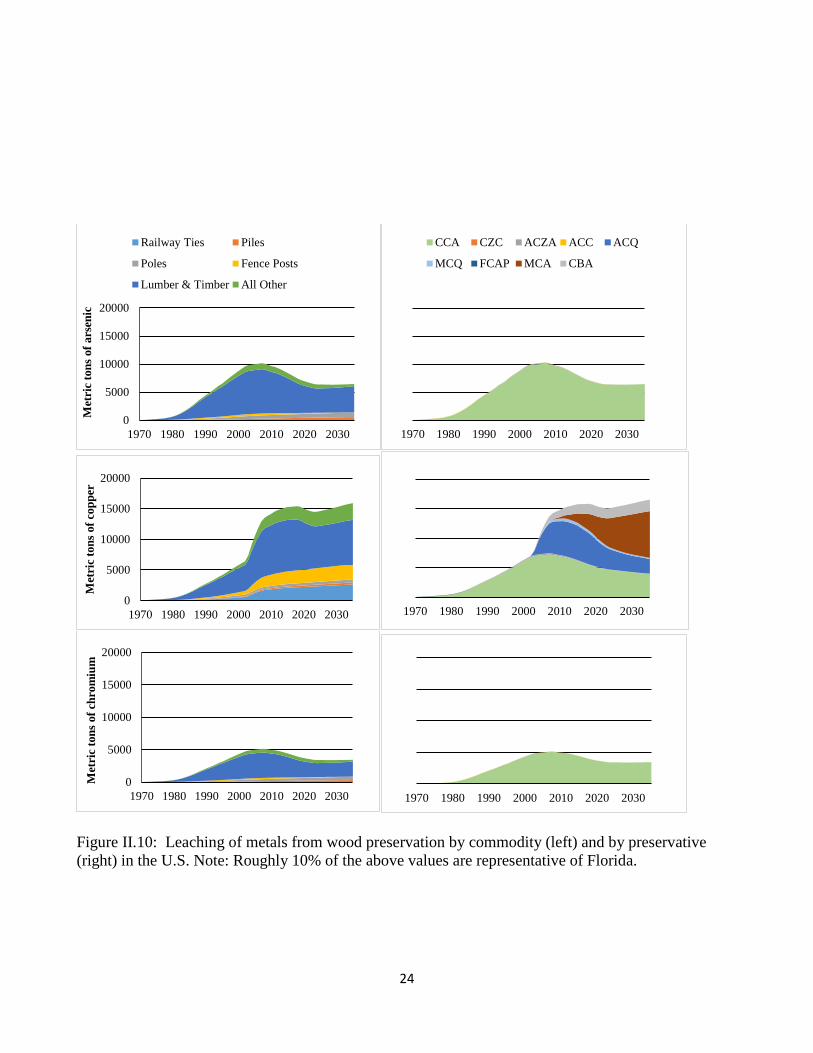
24
Figure II.10: Leaching of metals from wood preservation by commodity (left) and by preservative (right) in the U.S. Note: Roughly 10% of the above values are representative of Florida.
0
5000
10000
15000
20000
1970 1980 1990 2000 2010 2020 2030
Met
ric
tons
of a
rsen
ic
Railway Ties Piles
Poles Fence Posts
Lumber & Timber All Other
1970 1980 1990 2000 2010 2020 2030
CCA CZC ACZA ACC ACQ
MCQ FCAP MCA CBA
0
5000
10000
15000
20000
1970 1980 1990 2000 2010 2020 2030
Met
ric
tons
of c
oppe
r
1970 1980 1990 2000 2010 2020 2030
0
5000
10000
15000
20000
1970 1980 1990 2000 2010 2020 2030
Met
ric
tons
of c
hrom
ium
1970 1980 1990 2000 2010 2020 2030
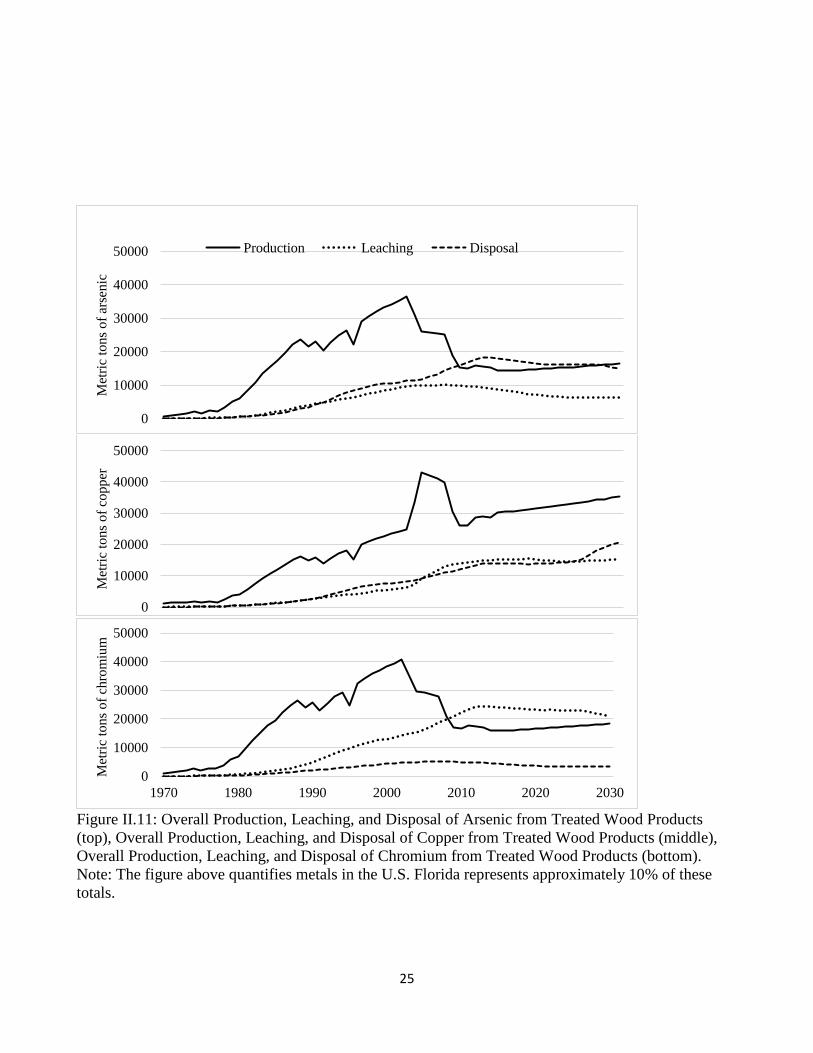
25
Figure II.11: Overall Production, Leaching, and Disposal of Arsenic from Treated Wood Products (top), Overall Production, Leaching, and Disposal of Copper from Treated Wood Products (middle), Overall Production, Leaching, and Disposal of Chromium from Treated Wood Products (bottom). Note: The figure above quantifies metals in the U.S. Florida represents approximately 10% of these totals.
0
10000
20000
30000
40000
50000
Met
ric to
ns o
f ars
enic
Production Leaching Disposal
0
10000
20000
30000
40000
50000
Met
ric to
ns o
f cop
per
0
10000
20000
30000
40000
50000
1970 1980 1990 2000 2010 2020 2030
Met
ric to
ns o
f chr
omiu
m
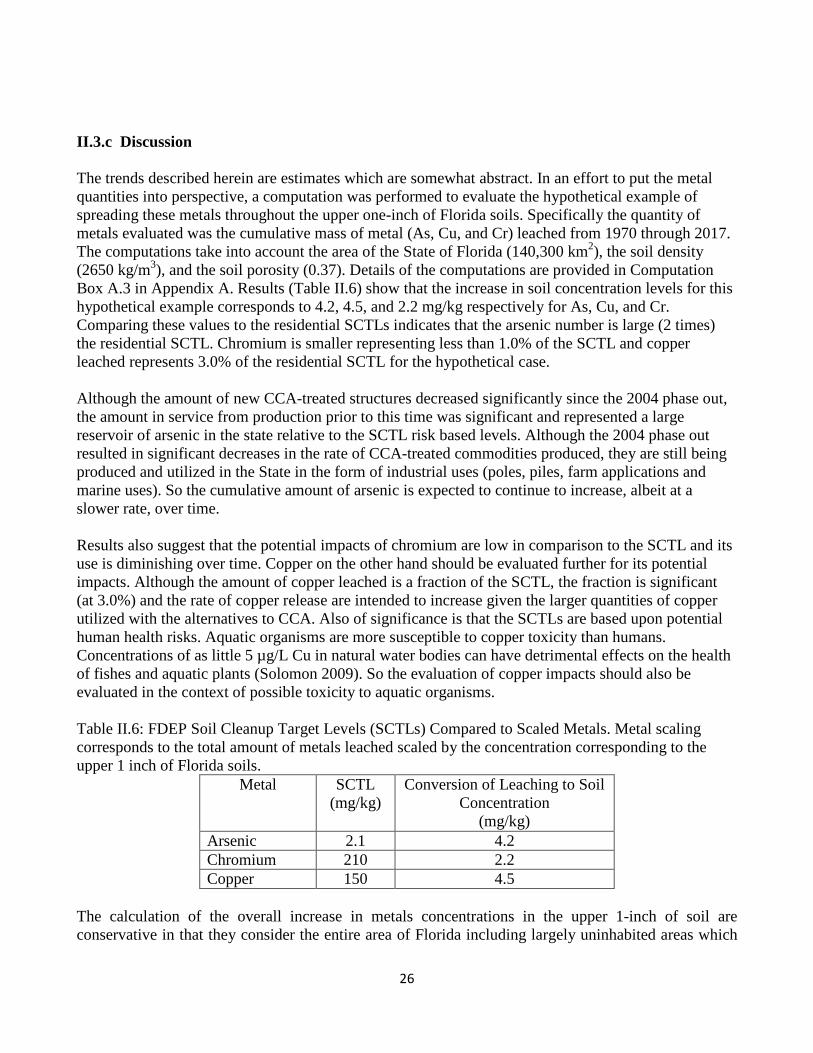
26
II.3.c Discussion The trends described herein are estimates which are somewhat abstract. In an effort to put the metal quantities into perspective, a computation was performed to evaluate the hypothetical example of spreading these metals throughout the upper one-inch of Florida soils. Specifically the quantity of metals evaluated was the cumulative mass of metal (As, Cu, and Cr) leached from 1970 through 2017. The computations take into account the area of the State of Florida (140,300 km2), the soil density (2650 kg/m3), and the soil porosity (0.37). Details of the computations are provided in Computation Box A.3 in Appendix A. Results (Table II.6) show that the increase in soil concentration levels for this hypothetical example corresponds to 4.2, 4.5, and 2.2 mg/kg respectively for As, Cu, and Cr. Comparing these values to the residential SCTLs indicates that the arsenic number is large (2 times) the residential SCTL. Chromium is smaller representing less than 1.0% of the SCTL and copper leached represents 3.0% of the residential SCTL for the hypothetical case. Although the amount of new CCA-treated structures decreased significantly since the 2004 phase out, the amount in service from production prior to this time was significant and represented a large reservoir of arsenic in the state relative to the SCTL risk based levels. Although the 2004 phase out resulted in significant decreases in the rate of CCA-treated commodities produced, they are still being produced and utilized in the State in the form of industrial uses (poles, piles, farm applications and marine uses). So the cumulative amount of arsenic is expected to continue to increase, albeit at a slower rate, over time. Results also suggest that the potential impacts of chromium are low in comparison to the SCTL and its use is diminishing over time. Copper on the other hand should be evaluated further for its potential impacts. Although the amount of copper leached is a fraction of the SCTL, the fraction is significant (at 3.0%) and the rate of copper release are intended to increase given the larger quantities of copper utilized with the alternatives to CCA. Also of significance is that the SCTLs are based upon potential human health risks. Aquatic organisms are more susceptible to copper toxicity than humans. Concentrations of as little 5 µg/L Cu in natural water bodies can have detrimental effects on the health of fishes and aquatic plants (Solomon 2009). So the evaluation of copper impacts should also be evaluated in the context of possible toxicity to aquatic organisms. Table II.6: FDEP Soil Cleanup Target Levels (SCTLs) Compared to Scaled Metals. Metal scaling corresponds to the total amount of metals leached scaled by the concentration corresponding to the upper 1 inch of Florida soils.
Metal SCTL (mg/kg)
Conversion of Leaching to Soil Concentration
(mg/kg) Arsenic 2.1 4.2 Chromium 210 2.2 Copper 150 4.5
The calculation of the overall increase in metals concentrations in the upper 1-inch of soil are conservative in that they consider the entire area of Florida including largely uninhabited areas which
27
will likely not accept the leaching load. For instance, it is expected that the area of Everglades National Park will not experience an increase in background arsenic concentration because treated wood structures are not typically constructed throughout the park. However, the arsenic has entered the Florida environment and it is likely that the impacts are concentrated in pockets of areas where treated wood has been used resulting in locally elevated arsenic levels.
II.3.d Variables 𝑓 = percentage of metal oxide in preservative
𝑚′𝑚𝑝𝑡𝑎𝑎,𝐷,𝑖 = mass of metal disposed after leaching, year i
𝑚′𝑚𝑝𝑡𝑎𝑎,𝐼𝑆,𝑖 = mass of metal in service after leaching, year i
𝑚𝑚𝑝𝑡𝑎𝑎,𝑃,𝑖 = mass of metal produced, year i
𝑚𝑚𝑝𝑡𝑎𝑎,𝐷,𝑖 = mass of metal disposed before leaching, year i
𝑚𝑚𝑝𝑡𝑎𝑎,𝐼𝑆,𝑖 = mass of metal in service before leaching, year i
𝑚𝑚𝑝𝑡𝑎𝑎,𝑆,𝑖= mass of metals leached, year i
𝑚𝑝𝑝𝑝𝑝,𝐼𝑆,𝑖 = mass of preservative in service, year i
𝑝 = annual percentage of metal leached from wood
𝑅𝑅𝑝𝑝𝑝𝑝 = retention level of preservative in treated wood product
𝑆𝑆 = service life of wood product in years
𝑉′𝑤𝑤𝑤𝑤,𝐷,𝑖 = Curved volume of wood disposed, year i
𝑉𝑤𝑤𝑤𝑤,𝐷,𝑖= Volume of wood disposed, year i
𝑉𝑤𝑤𝑤𝑤,𝐼𝑆,𝑖 = Volume of wood in service, year i
𝑉𝑤𝑤𝑤𝑤,𝑃,𝑖= Volume of wood produced, year i
28
CHAPTER III
FRACTION OF TREATED WOOD IN
FLORIDA C&D WASTE STREAM
29
CHAPTER III
FRACTION OF TREATED WOOD IN FLORIDA C&D
WASTE STREAM This chapter focuses on describing the results from sample collection of C&D wood mulch from processing facilities throughout the state of Florida. The chapter provides some introductory material (Section III.1) and includes the methodology, results, and conclusions at the end (Sections III.2, III.3, and III.4).
III.1 INTRODUCTION
Construction and demolition debris (CDD) makes up a substantial portion of the municipal solid waste (MSW) stream globally (Zheng et al. 2017, Rodríguez et al. 2007). The U.S. Environmental Protection Agency (US EPA) found that in 2014, 534 million tons of CDD were generated in the US. After road materials (asphalt and portland cement concrete), which are produced in vast quantities during roadway demolition and repaving, wood products make up the largest fraction of CDD materials, or approximately 7% by mass (38.7 million tons annually) (US EPA 2016). The practice of using chemical treatment to preserve wood products in outdoor applications has been common since the industrial revolution, but only recently has the scientific community taken a close look at the impacts of those wood preservatives on the environment over time, including after disposal (Solo-Gabriele and Townsend 1999). While much of the wood materials found in CDD is disposed of in a landfill (either a designated CDD landfill or a lined MSW landfill), a lot of it may be recycled, either as wood mulch or fuel (Ormondroyd et al. 2016). For several decades, one of the most common wood preservatives has been chromated copper arsenate (CCA). Arsenic’s toxic properties and propensity to leach from wood are well documented (Khan et al. 2004, 2006, Shibata et al. 2006, Townsend et al. 2003). Tolaymat et al. (2000) investigated the prevalence of CCA-treated lumber in recycled wood products (e.g., garden and playground mulch). Their findings contributed towards the industry-wide changes in pressure-treated lumber production and sales. In December 2003, manufacturers of the chemicals used in CCA-treatment of lumber voluntarily suspended sales to residential customers, though the EPA has never pursued a complete ban on the products. So CCA-treated wood is still in use and production for some commercial and industrial applications. The EPA explicitly discourages using CCA-treated wood products as mulch or fuel, and the prevalence of these products in the recycled wood product stream is of concern. The self-imposed industry ban on residential use of CCA-treated wood products has helped to reduce the amount of CCA-treated wood entering the waste stream. In addition, many wood recycling operations have implemented best management practices (BMPs) which aim to reduce or eliminate pressure treated wood from their final product. The research described herein seeks to determine the effects of these practices on the fraction of CCA-treated wood in the recycled wood product stream by utilizing the methods employed in Tolaymat et al. (2000) who documented CCA-treated wood in the recycled wood waste stream during 1996. The results from
30
samples collected from December 2015 to May of 2017 for the current study will be compared to the results from Tolaymat et al. to document the impacts in wood quality from BMP implementation coupled with the phase out of wood from residential applications. Wood preservation technology is an ever-advancing field, and new copper-based formulas have replaced much of the market previously occupied by CCA products (Solo-Gabriele et al. 2016). Therefore, in addition to analyzing the CCA-treated fraction of recycled wood products, this study includes estimates of the so-called “copper alternative” treated fraction. While arsenic was the constituent of greatest concern during the original research, levels of copper in the new wood product formulations merits evaluation. This study focused on evaluating both CCA-treated wood and copper-alternatives at CDD processing facilities using traditional laboratory methods and also using newer methods based upon X-ray fluorescence spectroscopy (XRF).
III.2 METHODS
III.2.a Sampling Construction and demolition debris materials recycling facilities (CDD MRFs) throughout the state of Florida, U.S., were contacted, requesting permission to collect samples of ground C&D lumber material (i.e., C&D mulch). Inclusion criteria for a facility required that the team be invited and be provided the opportunity to tour the site to identify different characteristics of the source material. Seven facilities met the inclusion criteria (See Table III.1). Upon inspection, different zones of the site were identified depending upon the differences and ages in the source materials. For example, some facilities would segregate pallet source material from other source wood materials. If the source material was considered different because of the nature of the wood source or the age of the pile, then more than one sample would be collected from the site to capture these differences. In order to augment the number of samples included in this study, Three facilities were sampled a second time over one year later for a total of 15 samples at seven different facilities. At participating facilities, material was removed from a stockpile. In some cases, when safety was a concern, material was removed using a front-end loader, and deposited in a safe area as a mini-stockpile. Using clean shovels, C&D mulch was filled one-third full within a 5 gallon bucket, and then placed onto a clean tarp (in order to reduce contamination) in 20 subsamples. At this time, each of the 20 subsamples was scanned using a portable hand-held X-ray fluorescence spectrometer (Innov-X Systems Inc., model alpha-2000s) using a 6 second analytical time (Jacobi et al. 2007). Subsamples were then mixed thoroughly on the tarp and placed in a clean, 32-gallon container, covered, labeled, and sealed for transportation to the laboratory.
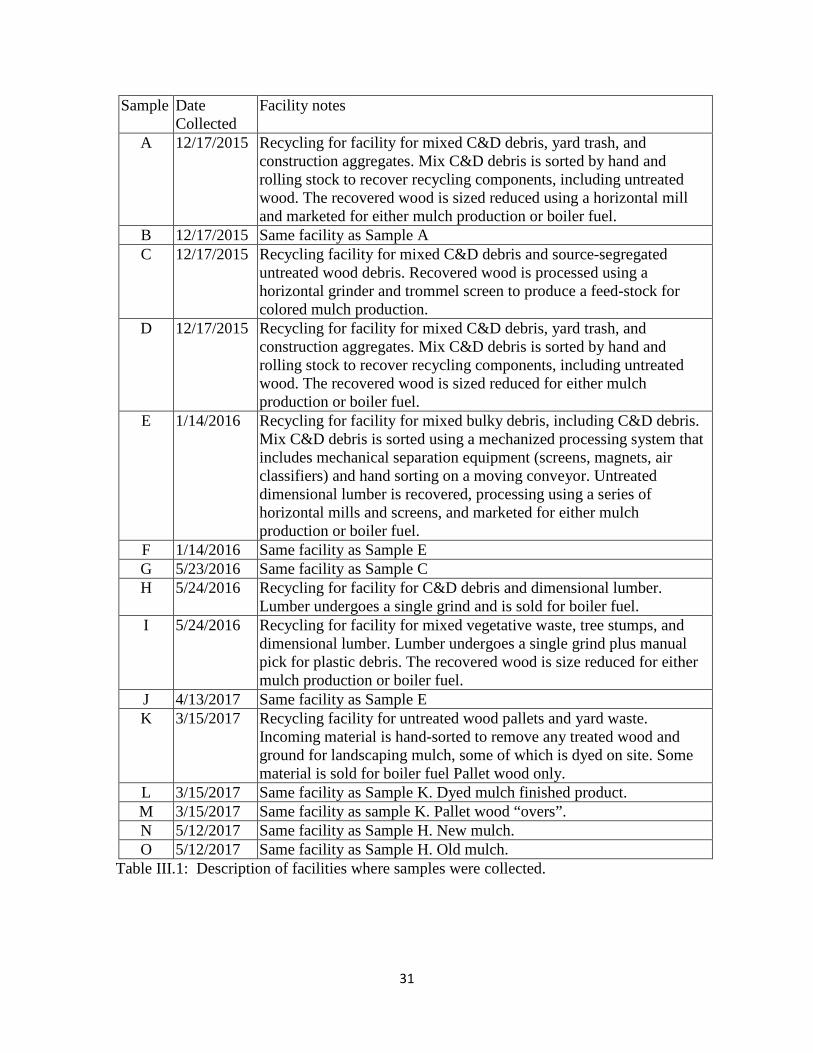
31
Sample Date Collected
Facility notes
A 12/17/2015 Recycling for facility for mixed C&D debris, yard trash, and construction aggregates. Mix C&D debris is sorted by hand and rolling stock to recover recycling components, including untreated wood. The recovered wood is sized reduced using a horizontal mill and marketed for either mulch production or boiler fuel.
B 12/17/2015 Same facility as Sample A C 12/17/2015 Recycling facility for mixed C&D debris and source-segregated
untreated wood debris. Recovered wood is processed using a horizontal grinder and trommel screen to produce a feed-stock for colored mulch production.
D 12/17/2015 Recycling for facility for mixed C&D debris, yard trash, and construction aggregates. Mix C&D debris is sorted by hand and rolling stock to recover recycling components, including untreated wood. The recovered wood is sized reduced for either mulch production or boiler fuel.
E 1/14/2016 Recycling for facility for mixed bulky debris, including C&D debris. Mix C&D debris is sorted using a mechanized processing system that includes mechanical separation equipment (screens, magnets, air classifiers) and hand sorting on a moving conveyor. Untreated dimensional lumber is recovered, processing using a series of horizontal mills and screens, and marketed for either mulch production or boiler fuel.
F 1/14/2016 Same facility as Sample E G 5/23/2016 Same facility as Sample C H 5/24/2016 Recycling for facility for C&D debris and dimensional lumber.
Lumber undergoes a single grind and is sold for boiler fuel. I 5/24/2016 Recycling for facility for mixed vegetative waste, tree stumps, and
dimensional lumber. Lumber undergoes a single grind plus manual pick for plastic debris. The recovered wood is size reduced for either mulch production or boiler fuel.
J 4/13/2017 Same facility as Sample E K 3/15/2017 Recycling facility for untreated wood pallets and yard waste.
Incoming material is hand-sorted to remove any treated wood and ground for landscaping mulch, some of which is dyed on site. Some material is sold for boiler fuel Pallet wood only.
L 3/15/2017 Same facility as Sample K. Dyed mulch finished product. M 3/15/2017 Same facility as sample K. Pallet wood “overs”. N 5/12/2017 Same facility as Sample H. New mulch. O 5/12/2017 Same facility as Sample H. Old mulch.
Table III.1: Description of facilities where samples were collected.
32
III.2.b Sample Processing In the laboratory, samples were analyzed in a fashion very similar to that described by Tolaymat et al. (2000). In summary, the procedure required further mixing and size-reduction as necessary using pruning shears. Three representative subsamples of approximately 1200 g were removed from the sample container. These subsamples were weighed, dried in an oven at 100° C for 24 hours, and then weighed again to determine the moisture content. Samples were then transferred to a muffle furnace, where they were ignited at 550° C in order to further size reduce while conserving the metals of interest. Because the analytical method used for this research requires only 1 g samples, incinerating the dried wood samples allows for an effectively larger quantity of material to be analyzed. Percent volatile solids were calculated using the mass of material before and after ignition. The wood ash samples were transferred to sterile glass jars with HDPE lids, and stored at 0° C until they were digested using a combination of nitric acid, hydrogen peroxide and hydrochloric acid according to EPA Method 3050b (US EPA 1996). Any remaining solids in the digested samples were removed with 80-micron nominal pore-size paper filters, and the digestate was then analyzed by inductively coupled plasma atomic emission spectroscopy (ICP-AES) (Thermo Scientific iCAP 6200). III.2.c Sample Analysis ICP-AES analysis uses an argon torch to atomize nebulized liquid samples, then uses the wavelength and intensity of the light emitted during the process to determine the concentration of inorganic elements in the sample. ICP-AES results are reported in parts per million, and the concentration (mg of element/kg-dry wood) in the samples was calculated from the mass and proportions corresponding to moisture and volatile solids. Detection limits of the ICP-AES instrument for the metals of interest are 0.004 mg/kg for arsenic and 0.002 mg/kg for chromium and copper. Detection limits for the handheld XRF were determined by repeated analysis on untreated wood. The XRF provides detection limits for every reading, and these vary with each reading. In order to determine a typical detection limit, the XRF was used 20 times on untreated wood; detection limits were recorded and averaged. The detection values provided by the XRF were 16, 44, and 133 mg/kg for As, Cu, and Cr, respectively. To these values the calibration curve equations (Block et al. 2007, Hasan et al. 2011) were applied for concentrations that are equivalent to atomic absorption spectroscopy concentration values. The calibrated detection limits were 5.7 mg/kg, 0.4 mg/kg, and 33.3 mg/kg, for arsenic, copper, and chromium, respectively, for the 6 s analysis time used in this study. III.2.d Calculation of CCA Wood Concentration in Samples The fraction of the C&D mulch which consists of CCA-treated wood was computed using two different methods, one corresponding to the ash digestates and another corresponding to the XRF analysis. For the method based upon the ash digestates, the method described in Tolaymat et al. (2000) was used. This method uses the results from the ICP-AES analysis as well as background levels of these metals found in natural wood and known retention rates and ratios of the constituent metals (chromium, copper and arsenic) used in the wood treatment process. Because
33
of the relative volatility of arsenic at high temperatures, and the potential presence of copper due to the use of alternative copper treatment methods, chromium concentrations were used to calculate the fraction of CCA treated wood in the samples. The mass balance equation for a given metal species in the wood samples is:
𝑀𝑚x = 𝑀𝑚xother + 𝑀𝑚xcca (1) where: Mmx = the mass of a metal in the wood, x = the metal of interest, 𝑀𝑚xother= the mass of metal x contributed by naturally occurring levels in the untreated wood, and 𝑀𝑚xcca= the mass of metal x contributed by CCA treated wood (background levels plus CCA). The mass of a given metal in the wood samples may also be calculated if one knows the concentration of metal in the wood, using the following equation:
𝑀𝑚x = 𝑀w ∙ 𝐶x (2)
where: Mw = the total mass of wood, and Cx = the concentration of a metal in the wood. These equations may be combined to produce the following:
𝑀w ∙ 𝐶x = 𝑀other ∙ 𝐶xother + 𝑀cca ∙ 𝐶xcca (3)
If Fcca is the fraction of CCA treated wood in the sample, or:
𝐹cca = 𝑀cca𝑀w
(4)
then the following equation can be used to calculate the fraction of CCA-treated wood using the concentration of a given metal (chromium) in the wood sample:
𝐹cca = 𝐶x−𝐶xother𝐶xcca−𝐶xother
(5)
Following previous work by Tolaymat et al. (2000), Type C CCA-treated wood with a retention level of 0.25 pcf was used as a treated wood reference, which equates to 1,120 mg-Cr/kg of dry wood and 1,871 mg-Cu/kg of dry wood. Background levels of chromium and copper in the wood were assumed to be 7.0 mg/kg and 3.7 mg/kg, respectively (Tolaymat et al. 2000). For the XRF, the fraction of CCA wood was based upon the metal concentrations in ppm, and calibration curves relating XRF results with direct measurements using ash digestates conducted on control wood samples as determined previously (Block et al. 2007, Hasan et al. 2011). The equations of the line of best fit for arsenic, copper and chromium, for instance, are:
𝐴𝐴As = 0.26(𝑋𝑅𝐹As1.12) (6) 𝐴𝐴Cu = 0.0002(𝑋𝑅𝐹Cu2 ) (7)
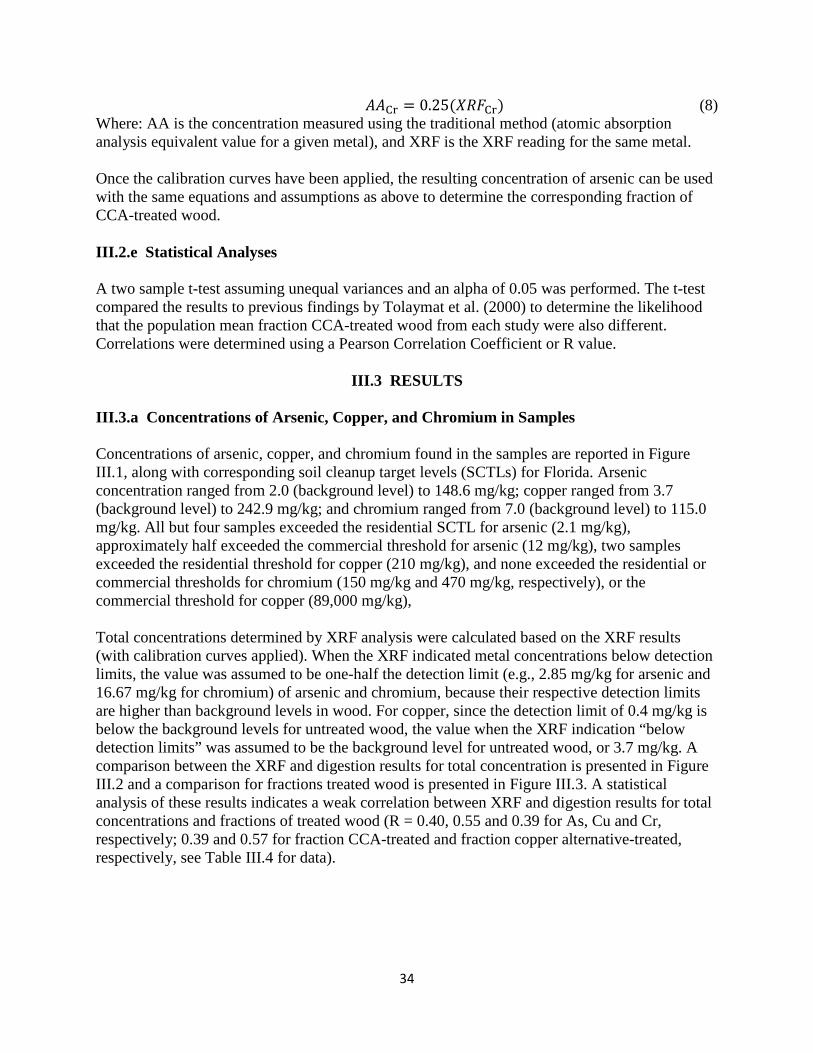
34
𝐴𝐴Cr = 0.25(𝑋𝑅𝐹Cr) (8) Where: AA is the concentration measured using the traditional method (atomic absorption analysis equivalent value for a given metal), and XRF is the XRF reading for the same metal. Once the calibration curves have been applied, the resulting concentration of arsenic can be used with the same equations and assumptions as above to determine the corresponding fraction of CCA-treated wood. III.2.e Statistical Analyses A two sample t-test assuming unequal variances and an alpha of 0.05 was performed. The t-test compared the results to previous findings by Tolaymat et al. (2000) to determine the likelihood that the population mean fraction CCA-treated wood from each study were also different. Correlations were determined using a Pearson Correlation Coefficient or R value.
III.3 RESULTS III.3.a Concentrations of Arsenic, Copper, and Chromium in Samples Concentrations of arsenic, copper, and chromium found in the samples are reported in Figure III.1, along with corresponding soil cleanup target levels (SCTLs) for Florida. Arsenic concentration ranged from 2.0 (background level) to 148.6 mg/kg; copper ranged from 3.7 (background level) to 242.9 mg/kg; and chromium ranged from 7.0 (background level) to 115.0 mg/kg. All but four samples exceeded the residential SCTL for arsenic (2.1 mg/kg), approximately half exceeded the commercial threshold for arsenic (12 mg/kg), two samples exceeded the residential threshold for copper (210 mg/kg), and none exceeded the residential or commercial thresholds for chromium (150 mg/kg and 470 mg/kg, respectively), or the commercial threshold for copper (89,000 mg/kg), Total concentrations determined by XRF analysis were calculated based on the XRF results (with calibration curves applied). When the XRF indicated metal concentrations below detection limits, the value was assumed to be one-half the detection limit (e.g., 2.85 mg/kg for arsenic and 16.67 mg/kg for chromium) of arsenic and chromium, because their respective detection limits are higher than background levels in wood. For copper, since the detection limit of 0.4 mg/kg is below the background levels for untreated wood, the value when the XRF indication “below detection limits” was assumed to be the background level for untreated wood, or 3.7 mg/kg. A comparison between the XRF and digestion results for total concentration is presented in Figure III.2 and a comparison for fractions treated wood is presented in Figure III.3. A statistical analysis of these results indicates a weak correlation between XRF and digestion results for total concentrations and fractions of treated wood (R = 0.40, 0.55 and 0.39 for As, Cu and Cr, respectively; 0.39 and 0.57 for fraction CCA-treated and fraction copper alternative-treated, respectively, see Table III.4 for data).
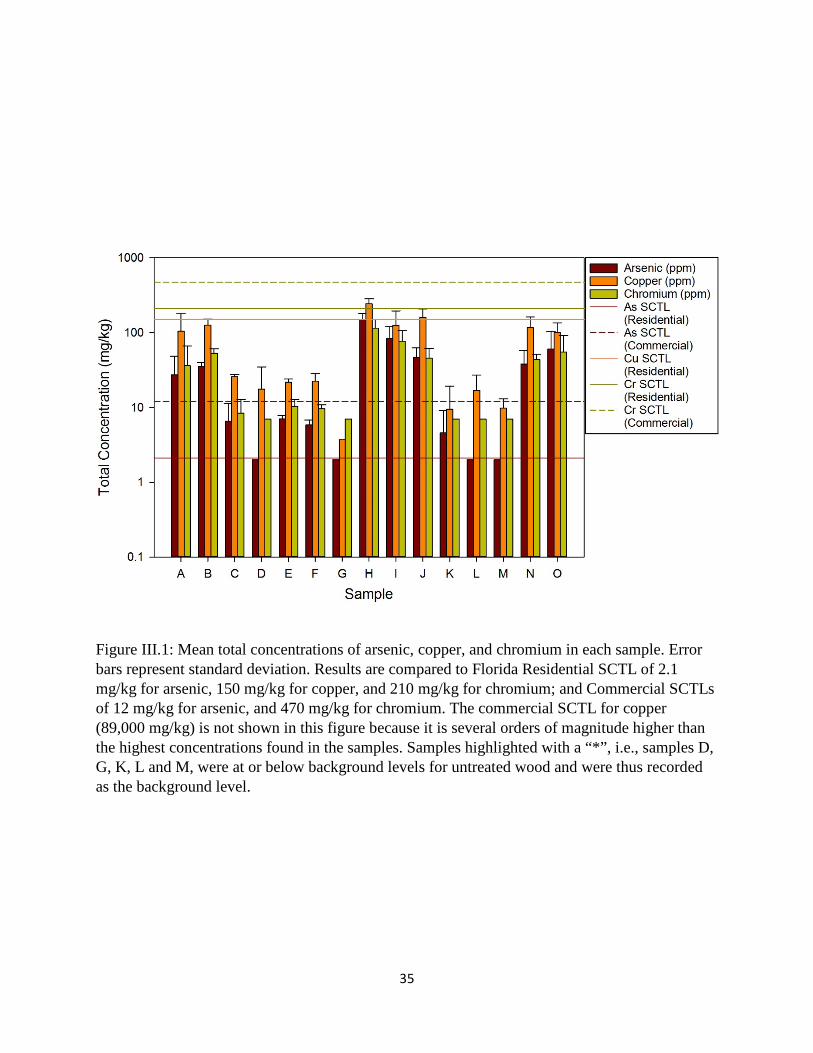
35
Figure III.1: Mean total concentrations of arsenic, copper, and chromium in each sample. Error bars represent standard deviation. Results are compared to Florida Residential SCTL of 2.1 mg/kg for arsenic, 150 mg/kg for copper, and 210 mg/kg for chromium; and Commercial SCTLs of 12 mg/kg for arsenic, and 470 mg/kg for chromium. The commercial SCTL for copper (89,000 mg/kg) is not shown in this figure because it is several orders of magnitude higher than the highest concentrations found in the samples. Samples highlighted with a “*”, i.e., samples D, G, K, L and M, were at or below background levels for untreated wood and were thus recorded as the background level.
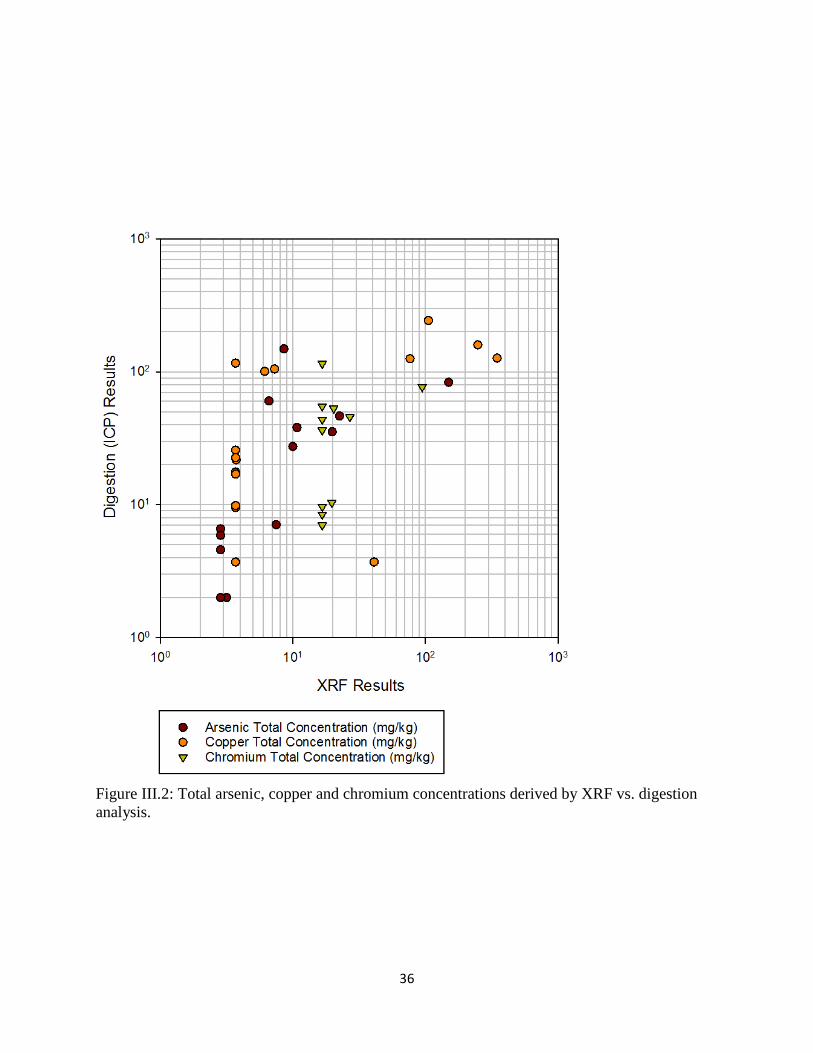
36
Figure III.2: Total arsenic, copper and chromium concentrations derived by XRF vs. digestion analysis.
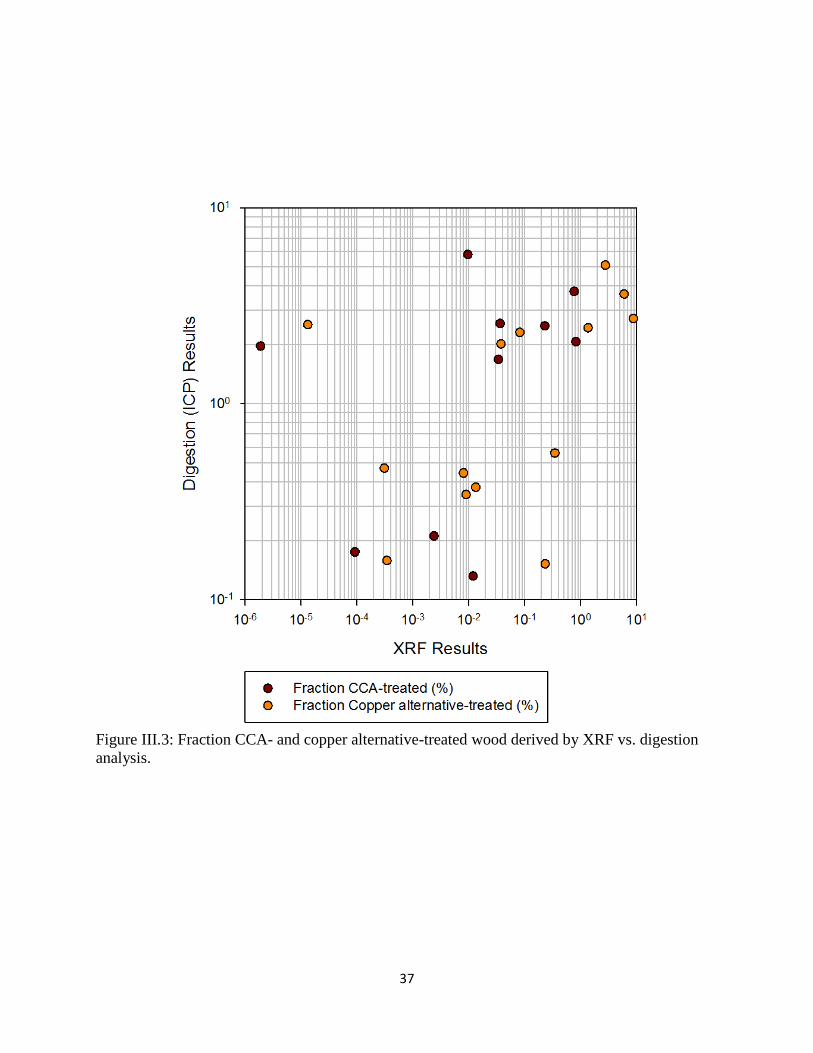
37
Figure III.3: Fraction CCA- and copper alternative-treated wood derived by XRF vs. digestion analysis.
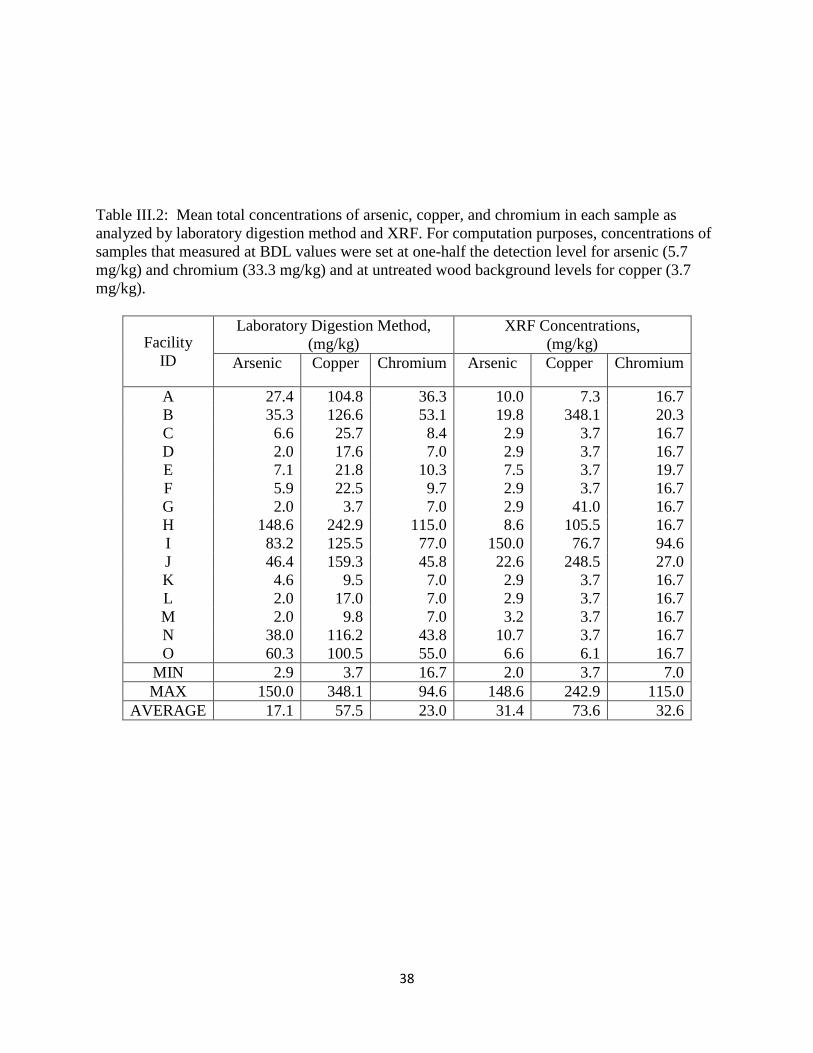
38
Table III.2: Mean total concentrations of arsenic, copper, and chromium in each sample as analyzed by laboratory digestion method and XRF. For computation purposes, concentrations of samples that measured at BDL values were set at one-half the detection level for arsenic (5.7 mg/kg) and chromium (33.3 mg/kg) and at untreated wood background levels for copper (3.7 mg/kg).
Facility ID
Laboratory Digestion Method, (mg/kg)
XRF Concentrations, (mg/kg)
Arsenic Copper Chromium Arsenic Copper Chromium
A 27.4 104.8 36.3 10.0 7.3 16.7 B 35.3 126.6 53.1 19.8 348.1 20.3 C 6.6 25.7 8.4 2.9 3.7 16.7 D 2.0 17.6 7.0 2.9 3.7 16.7 E 7.1 21.8 10.3 7.5 3.7 19.7 F 5.9 22.5 9.7 2.9 3.7 16.7 G 2.0 3.7 7.0 2.9 41.0 16.7 H 148.6 242.9 115.0 8.6 105.5 16.7 I 83.2 125.5 77.0 150.0 76.7 94.6 J 46.4 159.3 45.8 22.6 248.5 27.0 K 4.6 9.5 7.0 2.9 3.7 16.7 L 2.0 17.0 7.0 2.9 3.7 16.7 M 2.0 9.8 7.0 3.2 3.7 16.7 N 38.0 116.2 43.8 10.7 3.7 16.7 O 60.3 100.5 55.0 6.6 6.1 16.7
MIN 2.9 3.7 16.7 2.0 3.7 7.0 MAX 150.0 348.1 94.6 148.6 242.9 115.0
AVERAGE 17.1 57.5 23.0 31.4 73.6 32.6
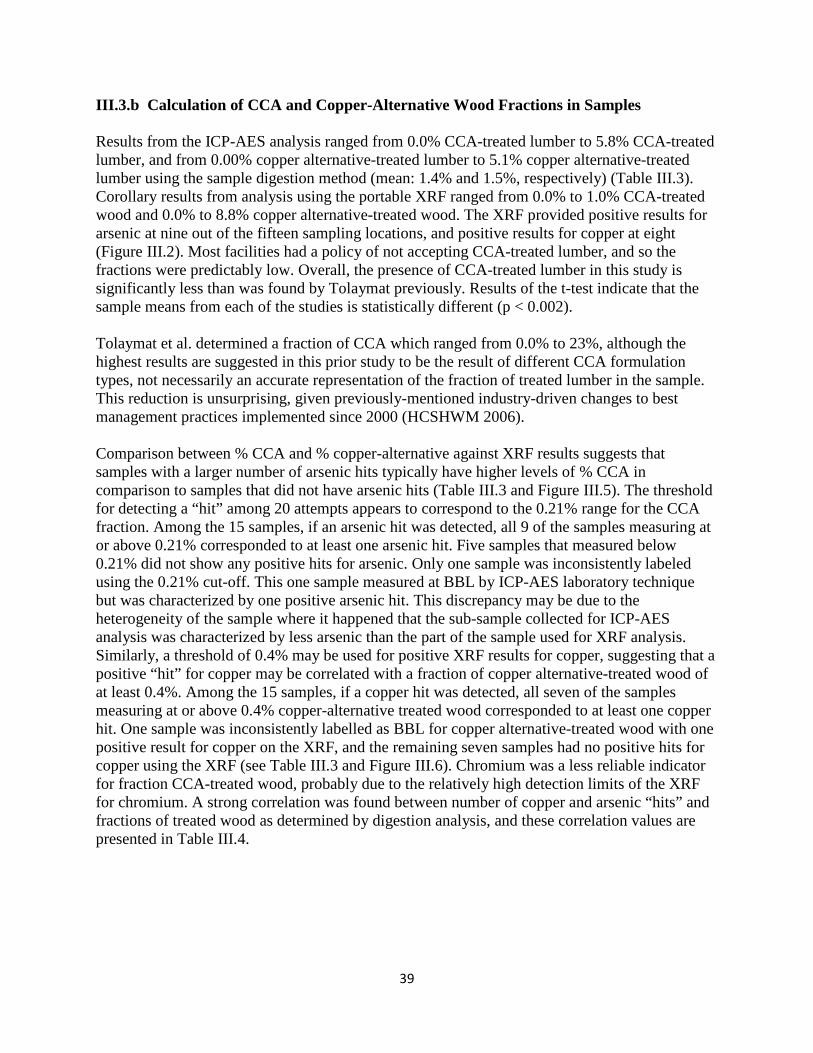
39
III.3.b Calculation of CCA and Copper-Alternative Wood Fractions in Samples Results from the ICP-AES analysis ranged from 0.0% CCA-treated lumber to 5.8% CCA-treated lumber, and from 0.00% copper alternative-treated lumber to 5.1% copper alternative-treated lumber using the sample digestion method (mean: 1.4% and 1.5%, respectively) (Table III.3). Corollary results from analysis using the portable XRF ranged from 0.0% to 1.0% CCA-treated wood and 0.0% to 8.8% copper alternative-treated wood. The XRF provided positive results for arsenic at nine out of the fifteen sampling locations, and positive results for copper at eight (Figure III.2). Most facilities had a policy of not accepting CCA-treated lumber, and so the fractions were predictably low. Overall, the presence of CCA-treated lumber in this study is significantly less than was found by Tolaymat previously. Results of the t-test indicate that the sample means from each of the studies is statistically different (p < 0.002). Tolaymat et al. determined a fraction of CCA which ranged from 0.0% to 23%, although the highest results are suggested in this prior study to be the result of different CCA formulation types, not necessarily an accurate representation of the fraction of treated lumber in the sample. This reduction is unsurprising, given previously-mentioned industry-driven changes to best management practices implemented since 2000 (HCSHWM 2006). Comparison between % CCA and % copper-alternative against XRF results suggests that samples with a larger number of arsenic hits typically have higher levels of % CCA in comparison to samples that did not have arsenic hits (Table III.3 and Figure III.5). The threshold for detecting a “hit” among 20 attempts appears to correspond to the 0.21% range for the CCA fraction. Among the 15 samples, if an arsenic hit was detected, all 9 of the samples measuring at or above 0.21% corresponded to at least one arsenic hit. Five samples that measured below 0.21% did not show any positive hits for arsenic. Only one sample was inconsistently labeled using the 0.21% cut-off. This one sample measured at BBL by ICP-AES laboratory technique but was characterized by one positive arsenic hit. This discrepancy may be due to the heterogeneity of the sample where it happened that the sub-sample collected for ICP-AES analysis was characterized by less arsenic than the part of the sample used for XRF analysis. Similarly, a threshold of 0.4% may be used for positive XRF results for copper, suggesting that a positive “hit” for copper may be correlated with a fraction of copper alternative-treated wood of at least 0.4%. Among the 15 samples, if a copper hit was detected, all seven of the samples measuring at or above 0.4% copper-alternative treated wood corresponded to at least one copper hit. One sample was inconsistently labelled as BBL for copper alternative-treated wood with one positive result for copper on the XRF, and the remaining seven samples had no positive hits for copper using the XRF (see Table III.3 and Figure III.6). Chromium was a less reliable indicator for fraction CCA-treated wood, probably due to the relatively high detection limits of the XRF for chromium. A strong correlation was found between number of copper and arsenic “hits” and fractions of treated wood as determined by digestion analysis, and these correlation values are presented in Table III.4.
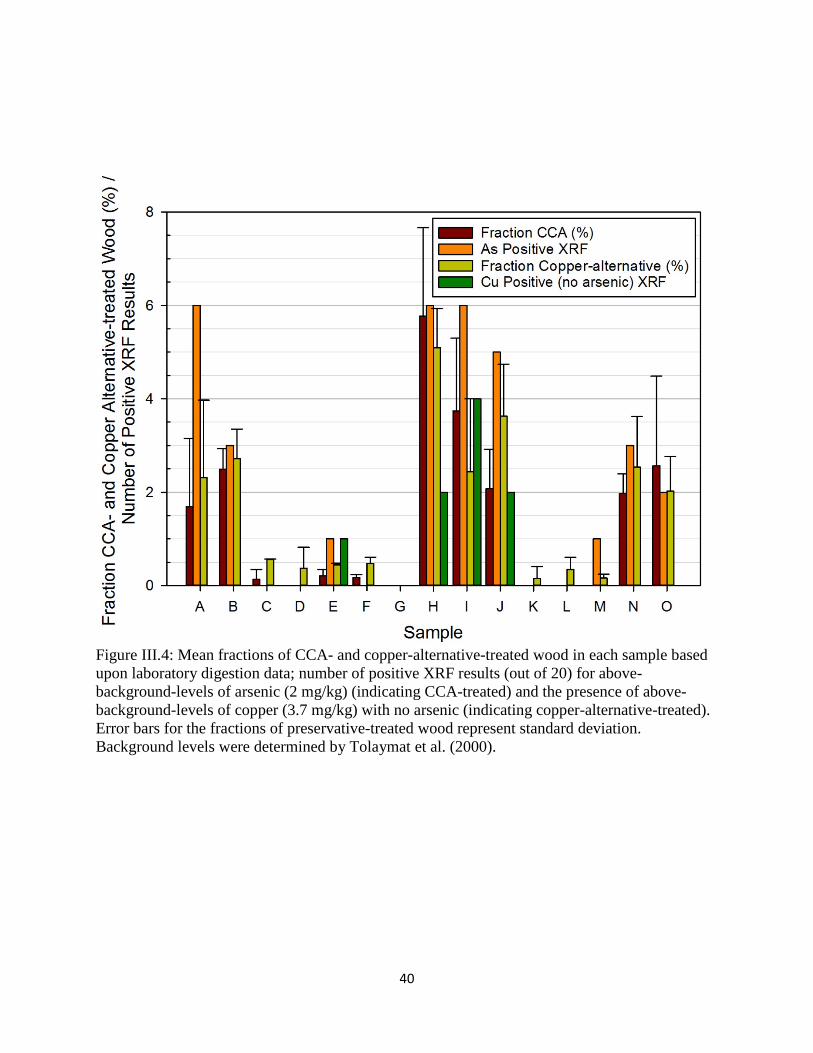
40
Figure III.4: Mean fractions of CCA- and copper-alternative-treated wood in each sample based upon laboratory digestion data; number of positive XRF results (out of 20) for above-background-levels of arsenic (2 mg/kg) (indicating CCA-treated) and the presence of above-background-levels of copper (3.7 mg/kg) with no arsenic (indicating copper-alternative-treated). Error bars for the fractions of preservative-treated wood represent standard deviation. Background levels were determined by Tolaymat et al. (2000).
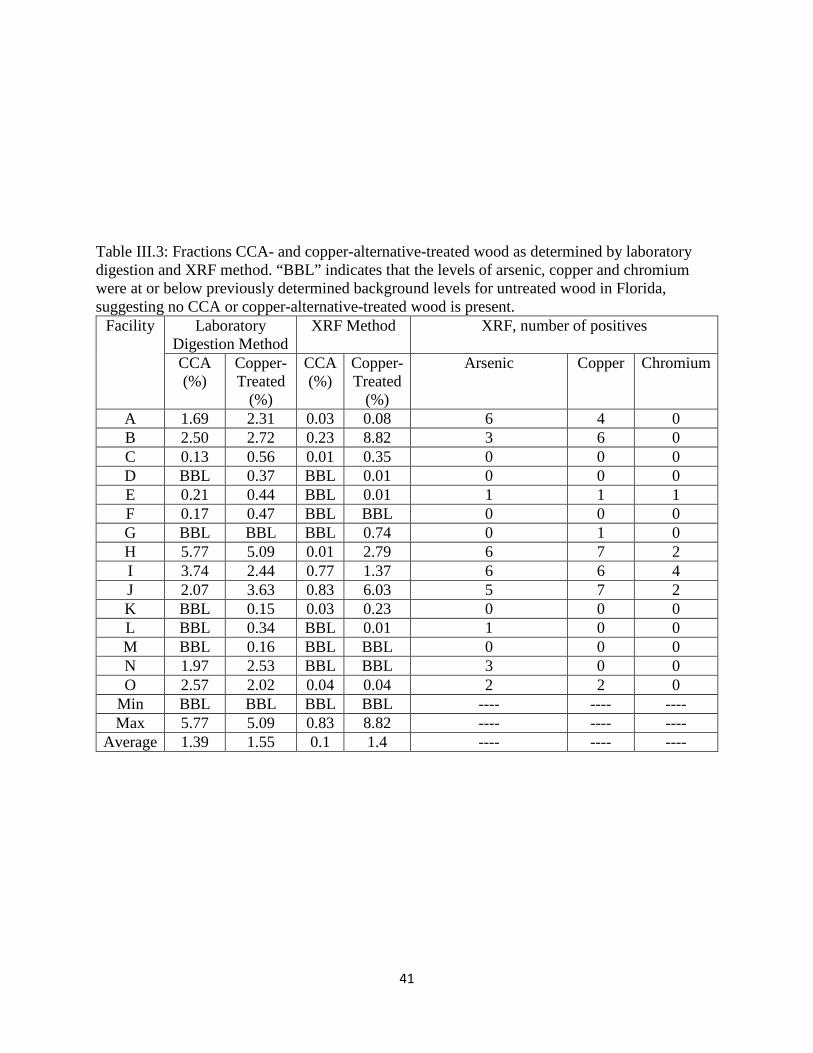
41
Table III.3: Fractions CCA- and copper-alternative-treated wood as determined by laboratory digestion and XRF method. “BBL” indicates that the levels of arsenic, copper and chromium were at or below previously determined background levels for untreated wood in Florida, suggesting no CCA or copper-alternative-treated wood is present.
Facility Laboratory Digestion Method
XRF Method XRF, number of positives
CCA (%)
Copper-Treated
(%)
CCA (%)
Copper-Treated
(%)
Arsenic Copper Chromium
A 1.69 2.31 0.03 0.08 6 4 0 B 2.50 2.72 0.23 8.82 3 6 0 C 0.13 0.56 0.01 0.35 0 0 0 D BBL 0.37 BBL 0.01 0 0 0 E 0.21 0.44 BBL 0.01 1 1 1 F 0.17 0.47 BBL BBL 0 0 0 G BBL BBL BBL 0.74 0 1 0 H 5.77 5.09 0.01 2.79 6 7 2 I 3.74 2.44 0.77 1.37 6 6 4 J 2.07 3.63 0.83 6.03 5 7 2 K BBL 0.15 0.03 0.23 0 0 0 L BBL 0.34 BBL 0.01 1 0 0 M BBL 0.16 BBL BBL 0 0 0 N 1.97 2.53 BBL BBL 3 0 0 O 2.57 2.02 0.04 0.04 2 2 0
Min BBL BBL BBL BBL ---- ---- ---- Max 5.77 5.09 0.83 8.82 ---- ---- ----
Average 1.39 1.55 0.1 1.4 ---- ---- ----
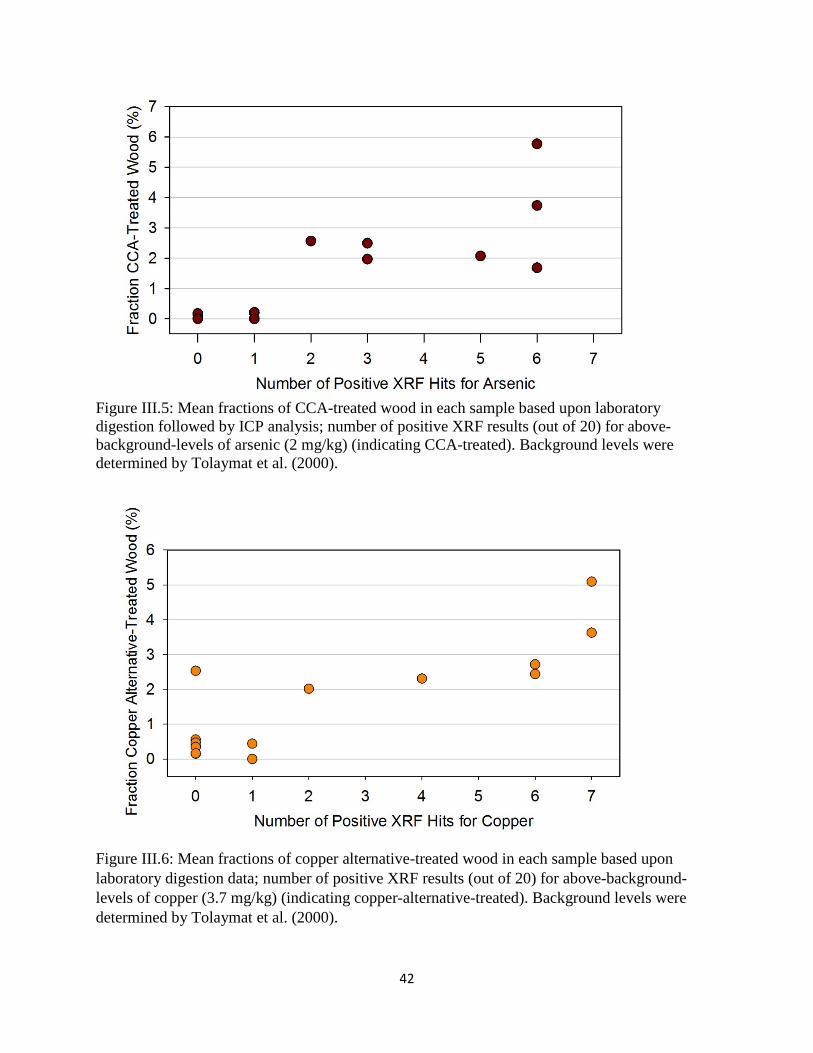
42
Figure III.5: Mean fractions of CCA-treated wood in each sample based upon laboratory digestion followed by ICP analysis; number of positive XRF results (out of 20) for above-background-levels of arsenic (2 mg/kg) (indicating CCA-treated). Background levels were determined by Tolaymat et al. (2000).
Figure III.6: Mean fractions of copper alternative-treated wood in each sample based upon laboratory digestion data; number of positive XRF results (out of 20) for above-background-levels of copper (3.7 mg/kg) (indicating copper-alternative-treated). Background levels were determined by Tolaymat et al. (2000).
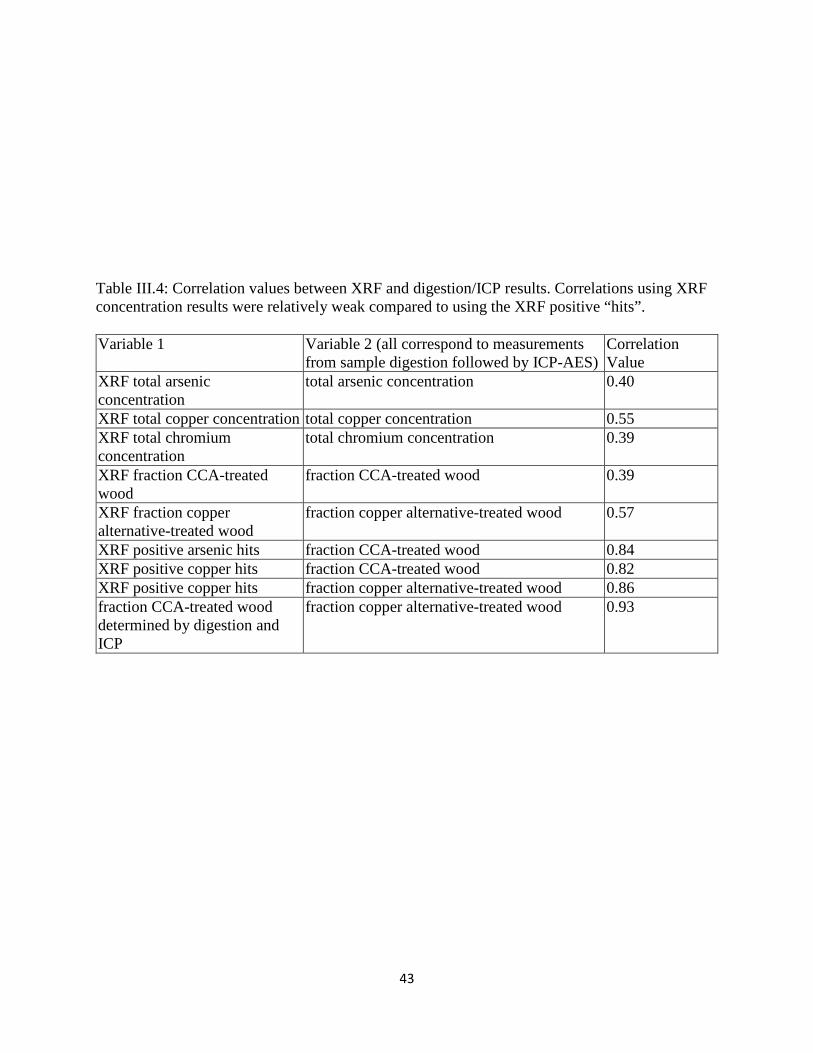
43
Table III.4: Correlation values between XRF and digestion/ICP results. Correlations using XRF concentration results were relatively weak compared to using the XRF positive “hits”. Variable 1 Variable 2 (all correspond to measurements
from sample digestion followed by ICP-AES) Correlation Value
XRF total arsenic concentration
total arsenic concentration 0.40
XRF total copper concentration total copper concentration 0.55 XRF total chromium concentration
total chromium concentration 0.39
XRF fraction CCA-treated wood
fraction CCA-treated wood 0.39
XRF fraction copper alternative-treated wood
fraction copper alternative-treated wood 0.57
XRF positive arsenic hits fraction CCA-treated wood 0.84 XRF positive copper hits fraction CCA-treated wood 0.82 XRF positive copper hits fraction copper alternative-treated wood 0.86 fraction CCA-treated wood determined by digestion and ICP
fraction copper alternative-treated wood 0.93
44
III.4 CONCLUSION The current study used the methodology by Tolaymat et al. (2000) in order to determine the fraction of recycled wood that is CCA-treated and copper-alternative-treated. The results from the current study were then compared to those published by Tolaymat et al. In the almost 20 years which have elapsed, the percentage CCA-treated wood has dropped from an average of almost 6% to 1.4%. The findings indicate that the suspension of CCA-treated wood sales for residential use, in conjunction with industry BMPs (HCSHWM 2006) has led to a substantial reduction in treated wood fractions in recycled wood products. Several of the participating facilities exclusively process waste pallet wood, for example, nearly eliminating the possibility of CCA-treated wood contamination in their finished product. The observed reduction is due to the combined effects of the BMPs plus the movement in the wood preservative market towards copper-alternative, and possibly other chemical formulas (Solo-Gabriele et al. 2016). In an effort to quantify the potential impacts of the BMPs, copper-alternative treated wood was measured at 1.6%. Combining the fractions from CCA and copper-alternative, the total treated wood fraction is on the order of 3%. It appears as though at least a 50% reduction (from 6% to 3%) is likely associated with the implementation of BMPs. Another aspect of this study, simultaneous analysis by XRF, allows the comparison of field results to lab testing results. While XRF results were not necessarily reliable gauge of the fraction of pressure treated wood in the entire sample, the number of positive results often correlated with the fractions of CCA- and copper-alternative-treated wood as determined by ICP-AES analysis. This finding may suggest that use of an XRF device in the field can be a fair indicator, if not a definitive one, for the presence of pressure treated wood. A rough guideline would be that one or more positive hits out of 20 for arsenic is suggestive of CCA at the 0.21 percent level. Less than three positives for arsenic by XRF would suggest CCA at a fraction of a percent level (<1%).
45
CHAPTER IV
UPDATED GUIDANCE DOCUMENT
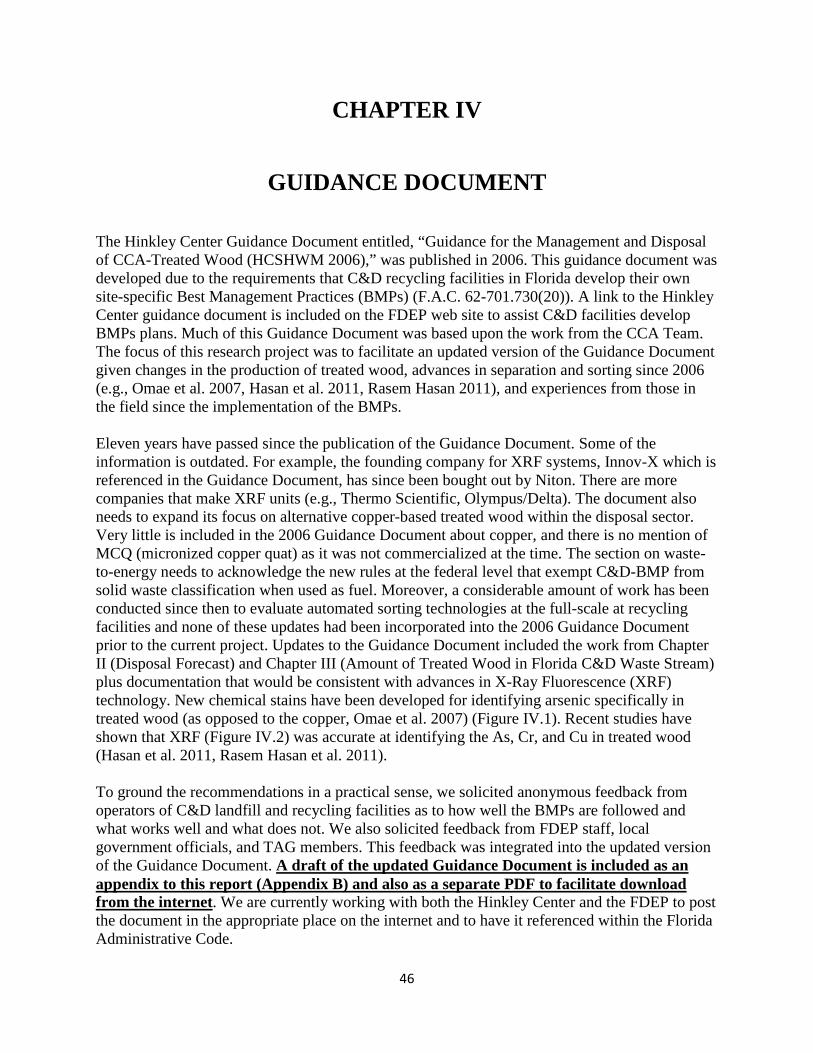
46
CHAPTER IV
GUIDANCE DOCUMENT
The Hinkley Center Guidance Document entitled, “Guidance for the Management and Disposal of CCA-Treated Wood (HCSHWM 2006),” was published in 2006. This guidance document was developed due to the requirements that C&D recycling facilities in Florida develop their own site-specific Best Management Practices (BMPs) (F.A.C. 62-701.730(20)). A link to the Hinkley Center guidance document is included on the FDEP web site to assist C&D facilities develop BMPs plans. Much of this Guidance Document was based upon the work from the CCA Team. The focus of this research project was to facilitate an updated version of the Guidance Document given changes in the production of treated wood, advances in separation and sorting since 2006 (e.g., Omae et al. 2007, Hasan et al. 2011, Rasem Hasan 2011), and experiences from those in the field since the implementation of the BMPs. Eleven years have passed since the publication of the Guidance Document. Some of the information is outdated. For example, the founding company for XRF systems, Innov-X which is referenced in the Guidance Document, has since been bought out by Niton. There are more companies that make XRF units (e.g., Thermo Scientific, Olympus/Delta). The document also needs to expand its focus on alternative copper-based treated wood within the disposal sector. Very little is included in the 2006 Guidance Document about copper, and there is no mention of MCQ (micronized copper quat) as it was not commercialized at the time. The section on waste-to-energy needs to acknowledge the new rules at the federal level that exempt C&D-BMP from solid waste classification when used as fuel. Moreover, a considerable amount of work has been conducted since then to evaluate automated sorting technologies at the full-scale at recycling facilities and none of these updates had been incorporated into the 2006 Guidance Document prior to the current project. Updates to the Guidance Document included the work from Chapter II (Disposal Forecast) and Chapter III (Amount of Treated Wood in Florida C&D Waste Stream) plus documentation that would be consistent with advances in X-Ray Fluorescence (XRF) technology. New chemical stains have been developed for identifying arsenic specifically in treated wood (as opposed to the copper, Omae et al. 2007) (Figure IV.1). Recent studies have shown that XRF (Figure IV.2) was accurate at identifying the As, Cr, and Cu in treated wood (Hasan et al. 2011, Rasem Hasan et al. 2011). To ground the recommendations in a practical sense, we solicited anonymous feedback from operators of C&D landfill and recycling facilities as to how well the BMPs are followed and what works well and what does not. We also solicited feedback from FDEP staff, local government officials, and TAG members. This feedback was integrated into the updated version of the Guidance Document. A draft of the updated Guidance Document is included as an appendix to this report (Appendix B) and also as a separate PDF to facilitate download from the internet. We are currently working with both the Hinkley Center and the FDEP to post the document in the appropriate place on the internet and to have it referenced within the Florida Administrative Code.
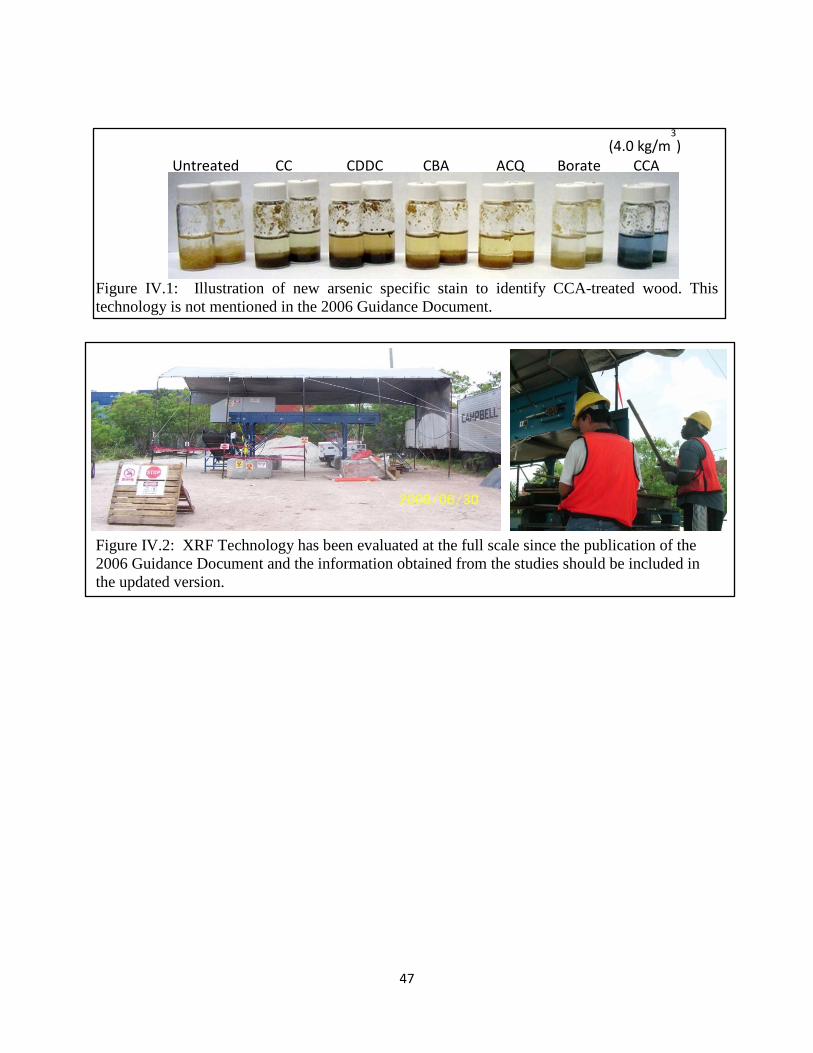
47
Figure IV.1: Illustration of new arsenic specific stain to identify CCA-treated wood. This technology is not mentioned in the 2006 Guidance Document. Figure IV.2: XRF Technology has been evaluated at the full scale since the publication of the 2006 Guidance Document and the information obtained from the studies should be included in the updated version.
(4.0 kg/m3)
Untreated CC CDDC CBA ACQ Borate CCA
48
CHAPTER V
SUMMARY AND CONCLUSIONS
49
CHAPTER V
SUMMARY AND CONCLUSIONS
V.1 SUMMARY AND CONCLUSIONS
This study computed the quantities of metals from treated wood in the disposal sector by compiling production statistics, estimating treated wood service lives and by estimating leaching during in-service use. This study estimated that the peak disposal for arsenic-treated wood in Florida occurred during 2013 corresponding to 1,800 tons of arsenic. The cumulative leaching of arsenic through 2017 was estimated at 25,000 tons. To provide a comparable scale to this quantity, an equivalent concentration increase was computed assuming that the cumulative quantity of arsenic impacted the upper 1 inch of soil in the State of Florida. Results indicate that the amount of arsenic leached is equivalent to a 4.2 mg/kg increase in surface arsenic levels. This increase is large in comparison to the residential Florida soil clean up target level for arsenic of 2.1 mg/kg. Although the amount of arsenic from treated wood is significant, the rate at which arsenic is entering the environment through treated wood production decreased significantly in 2004 due to the industry phase-out of CCA for residential uses. This phase out is reflected in the disposal forecast, but at a lag given the long service lives of treated wood products. The disposal forecast predicts that the peak in arsenic disposed occurred in 2013 at 1,800 metric tons. This amount is forecasted to slowly decrease over time with an estimate of 1,500 metric tons disposed during 2030. The model predicts an almost 2 fold increase between the amount of arsenic disposed with treated wood between 1996 (920 metric tons) and 2016 (1700 metric tons).
This increase in arsenic in the C&D wood waste stream from treated wood has been overcome by wood recyclers. During 1996 Tolaymat et al estimated that CCA-treated wood represented 6% of recycled C&D wood. In 2016, through the current study, the fraction of CCA-treated wood in C&D wood is estimated at 1.3%. The five-fold decrease in measured values is attributable to the combination of the CCA-treated wood industry phase out and the education programs and BMPs that have been put in place within the C&D recycling sector since the time of the Tolaymat et al. study. Part of the decrease in the CCA-treated wood has been compensated by an increase in wood treated with the copper-based alternative preservatives which measured at 1.5%. The sum of all treated wood measured in this study within C&D-BMP is at about 3% which is about half of the treated wood fraction measured in 1996. This 50% decrease is likely attributable to the implementation of the BMPs at C&D wood recycling facilities throughout the State.

50
V.2 IMPLICATIONS FOR WOOD SORTING
The disposal forecast included projections for total waterborne treated wood disposal (wood volume basis) plus disposal of arsenic and copper (mass basis). Arsenic and copper are chosen because they are the metals that would trigger exceedance of risk-based regulatory guidelines. When looking at the levels of metals in the various types of treated wood, the main limiting factor continues to be the amount of arsenic (Table V.1). Using the FDEP residential soil cleanup target levels for residential applications as a benchmark (FDEP 2005), the amount of CCA-treated wood that can be mixed with not-treated wood and still meet the residential soil clean up target level (SCTL) is 0.4 % (Table V.1). This is a very small fraction which indicates that recycled C&D wood needs to be essentially free from CCA. With the copper-based alternatives, since the copper SCTL is higher, the fraction of copper-treated wood that can be mixed with non-treated wood is in the 2 to 3% range. This is still a small proportion, but higher by a factor of 5 to 8 higher than for arsenic in CCA-treated wood. Given these percentages, BMPs would still be needed for CCA-treated and copper-based treated wood, but these BMPs would not need to be as strict as they were prior to the 2004 voluntary-industry phase-out of CCA-treated wood. Chromium, the remaining ingredient in CCA, would be exceeded if CCA-treated wood represented more than 11% of the wood waste stream. So the most sensitive ingredients in waterborne wood treatment preservatives that would cause exceedance of risk-based regulatory guidelines are primarily arsenic (from CCA) and secondarily copper (from the copper-based alternatives). BMPs should continue to be implemented. The updated Guidance Document developed as part of this project can be used as part of educational programs designed to inform C&D wood recyclers of options available for identifying and sorting CCA-treated wood out of the C&D waste stream. If C&D wood were to be recycled for the production of mulch, sorting would need to be augmented with technologies such as XRF to get the fraction of CCA-treated wood to below the 0.4 % threshold level.
Treated Wood Type
Assumed retention
(ground contact) kg/m3
mg metal per kg wood
Allowable percent of treated wood mixed with not-treated wood
As Cr Cu As Cr Cu Not treated (from Solo-Gabriele et al.1998)
2.0 7.0 3.7 N/A N/A N/A
CCA, chromated copper arsenate 6.4 2,800 1,800 3,100 0.4 11 4.8 MCQ, micronized copper quat 6.4 -- -- 6,200 -- -- 2.4 MCA, micronized copper azole 3.3 -- -- 4,900 -- -- 3.0 Residential Guideline Levels (from FDEP 2005)
2.1 210 150
N/A = not applicable Table V.1: Levels of metals in the most common waterborne wood preservatives in production during 2015 (Retention levels from AWPA 2014).
51
V.3 RECOMMENDATIONS
The effectiveness of treated wood BMPs should be evaluated in the future and should be expanded to include wood coatings such as lead-based paint. During our measurements at recycling facilities in Florida, the XRF would occasionally provide positive hits for lead which we attribute to coatings on wood waste. So studies like the ones included in this project should continue to periodically monitor the quality of the wood waste stream. This monitoring should include other potential contaminants in addition to contaminants from wood treatment preservatives. In order to justify more elaborate sorting technologies for C&D wood efforts should also focus on identifying high-end markets for the recycled product. If the value of the product is greater, and this value is tied to the quality of the recycled wood, then the costs can be used to justify more elaborate technologies for sorting treated wood. This should be evaluated for not only C&D wood but for recycled C&D as a whole.
52
V.4 PRACTICAL BENEFITS FOR END USERS
This project has resulted in the update of a readily-available Guidance Document. The updated document has information concerning the disposal of CCA-treated wood and its copper-based alternatives given the last decade of changes within the industry and additional research on the topic. This project has served to document the life cycle of treated wood products within the Florida disposal sector which is important for estimating the relative magnitude of the metals (arsenic, chromium, and copper) from wood treatment preservatives. The study has provided quantitative evidence about the extent to which the prior BMP’s, published in 2006, and its corresponding education programs have helped minimize the inadvertent inclusion of CCA in recycled wood waste. This study can be used to document the impact of the Center’s and FDEP’s efforts to reduce wood treated with chromated copper arsenate (CCA) from disposal sector, in particular its disposal as mulch or within unlined landfills. Results can be used to address the impacts of categorizing recycled C&D wood as a non-waste as currently proposed under the recent U.S. EPA regulations.
53
REFERENCES AND PERTINENT LITERATURE
Agency for Toxic Substances and Disease Registry (ASTDR). (2005). Public Health Statement Zinc. ASTDR. Retrieved from http://www.atsdr.cdc.gov/ToxProfiles/tp60-c1-b.pdf.
American Lumber & Treating. (1935). Wolman salts, a universal wood preservative: Demonstrably accomplish more in protection of wood than any other known method of salt treatment. Chicago: American Lumber & Treating.
American Wood Preservers Institute. (1997). The 1996 Wood Preserving Industry Production Statistical Report. American Wood Preservers Institute, Fairfax, VA.
American Wood Preservers’ Association. (1960-1981, 1983-1988, 1990-1991, 1997). Annual Proceedings of the American Wood Preservers Association. AWPA: Selma, AL, 1960-1981, 1983-1988, 1990-1991, 1997.
American Wood Preservers’ Association (AWPA). (1999). AWPA Book of Standards. Selma, AL.
American Wood Protection Association (AWPA). (2014). AWPA Book of Standards. Birmingham, AL.
American Wood Protection Association (AWPA). (2016). AWPA Book of Standards. Birmingham, AL.
Blassino, M., Solo-Gabriele, H., and Townsend, T. (2002). “Pilot Scale Evaluation of Sorting Technologies for CCA-Treated Wood Waste.” Waste Management and Research, 20: 290-301.
Block, C. N., Shibata, T., Solo-Gabriele, H. M., & Townsend, T. G. (2007). Use of handheld X-ray fluorescence spectrometry units for identification of arsenic in treated wood. Environmental Pollution, 148(2), 627–633. https://doi.org/10.1016/j.envpol.2006.11.013
Borkow, G. and Gabbay, J. (2005). Copper as a biocidal tool. Current Medicinal Chemistry. Vol 12. pp 2163-2175.
Casarett, L. J., Doull, J., and Klaassen, C. D. (2001). Casarett and Doull's toxicology: The basic science of poisons. Medical Pubishing Division. pp 715. New York: McGraw-Hill Medical Pub.
De Mattia, G., M. C. Bravi, et al. (2004). Impairment of cell and plasma redox state in subjects professionally exposed to chromium. American Journal of Industrial Medicine 46(2): 120-5. Retrieved 2016-07-10 from http://www.atsdr.cdc.gov/csem/chromium/docs/chromium.pdf.
Dubey, B., Spalvins, E., Townsend, T.G., Solo-Gabriele, H.M., 2009. Comparison of Metals Leaching from CCA- and ACQ-Treated Wood in Simulated Construction and Demolition Debris Landfills. Journal of Environmental Engineering, October: 910-917.
Florida Administrative Code, 2012. 62-701.730 (20), Construction and Demolition Debris Disposal and Recycling. Florida Department of Environmental Protection, Tallahassee, FL.
Florida Department of Environmental Protection (FDEP), 2005. Soil Cleanup Target Levels, Comparison of Chapter 62-777, F.A.C. – May 26, 1999 Values vs. April 17, 2005 Values. Available at:
54
http://www.dep.state.fl.us/waste/quick_topics/publications/wc/brownfields/CompTables/SoilCleanupTargetLevels.pdf
Florida Department of Environmental Protection (FDEP), 2014. Solid Waste Management in Florida. 2012 Annual Report. FDEP, Tallahassee, FL. Available at: http://www.dep.state.fl.us/waste/categories/recycling/SWreportdata/13_data.htm
Florida Department of Environmental Protection (FDEP). (2015). Table II Soil Cleanup Target Levels. June 9, 2015. Retrieved from https://www.dep.state.fl.us/waste/quick_topics/rules/documents/62-777/62-777_TableII_SoilCTLs.pdf.
Gill, T. G., Phelps, R. B. (1971). Wood Preservation Statistics 1970. Report presented at the Sixty-Seventh Annual Meeting of the American Wood-Preservers’ Association: Miami Beach, Florida. Published in Washington D.C. AWPA. Retrieved from University of Miami libraries.
Hafizoglu, H. (2015). Preservation of Wood Material by Chemical Techniques. Republic of Turkey. Retrieved from http://www.kulturturizm.gov.tr/EN,98770/preservation-of-wood-material-by-chemical-techniques.html
Hasan, A. R., Schindler, J., Solo-Gabriele, H. M., Townsend, T.G. (2011a). Online sorting of recovered wood waste by automated XRF-technology. Part I: Detection of preservative-treated wood waste. Waste Management. 31: 688-694. http://dx.doi.org/10.1016/j.wasman.2010.11.010
Hasan, A.R., Schindler, J., Solo-Gabriele, H.M., Townsend, T.G., 2011a. Online sorting of recovered wood waste by automated XRF-technology. Part I: Detection of preservative-treated wood waste. Waste Manage., 31: 688-694.
Hasan, A.R., Solo-Gabriele, H., Townsend, T. (2011b). Online sorting of recovered wood waste by automated XRF-technology: Part II. Sorting efficiencies. Waste Management. 31: 695-704. Retrieved from http://dx.doi.org/10.1016/j.wasman.2010.10.024.
Hasan, A.R., Solo-Gabriele, H., Townsend, T., 2011. Online sorting of recovered wood waste by automated XRF-technology: Part II. Sorting efficiencies. Waste Manag., 31: 695-704. http://dx.doi.org/10.1016/j.wasman.2010.10.024
Hinkley Center for Solid and Hazardous Waste Management (HCSHWM), 2006. Guidance for the Management and Disposal of CCA-Treated Wood. HCSHWM, Gainesville, FL. Available on the HCSHWM site at: http://www.ccaresearch.org/CCA%20BMP%20cor.pdf
J. D. Ferry Associates. (1981). Wood Preservation Statistics 1980. Report presented at the Seventy-Seventh Annual Meeting of the American Wood-Preservers’ Association: Kissimmee, Florida. Published in Bethesda, Maryland.
Jacobi, G., Solo-Gabriele, H., Dubey, B., Townsend, T., Shibata, T. (2007a). Evaluation of Commercial Landscaping Mulch for Possible Contamination from CCA. Waste Management, 27: 1765–1773.
Jacobi, G., Solo-Gabriele, H., Townsend, T., Dubey, B. (2007b). Evaluation of Methods for Sorting CCA-treated Wood. Waste Management, 27: 1617-1625.
55
Jambeck, J.R., Townsend, T.G., Solo-Gabriele, H.M. (2008). Landfill disposal of CCA-treated wood with construction and demolition (C&D) debris: arsenic, chromium, and copper concentrations in leachate. Environmental Science & Technology, 42(15): 5740-5745.
Jones, A., Marini, J., Solo-Gabriele, H. M. (2017a). Waterborne treated wood production trends, disposal forecast, and fate of metals. Proceedings of the 113th Annual Meeting of the American Wood Protection Association held in Las Vegas, Nevada, (in press).
Jones, A., Marini, J., Solo-Gabriele, H. M. (2017b). Review of leaching experiment of CCA-treated wood and wood treated with copper-based alternatives. IRG/WP 17-50330. International Research Group on Wood Preservation, Stockholm, Sweden.
Jones, W. T. (1956). The penetration of osmosalts and the effect of osmosalt treatment on some strength properties of loblolly pine (Pinus taeda L.). (Master’s thesis). Retrieved from https://www.worldcat.org/search?q=&qt=results_page.
Khan, B. I., Solo-Gabriele, H. M., Dubey, B. K., Townsend, T. G., & Cai, Y. (2004). Arsenic speciation of solvent-extracted leachate from new and weathered CCA-treated wood. Environmental Science & Technology, 38(17), 4527-4534.
Khan, B. I., Solo-Gabriele, H. M., Townsend, T. G., Cai, Y. (2006). Release of Arsenic to the Environment from CCA-Treated Wood. 1. Leaching and Speciation during Service. Environ. Sci. & Tech., 40(3): 988-993.
Khan, B.I., Jambeck, J., Solo-Gabriele, H. M., Townsend, T.G., Cai, Y. (2006). Release of arsenic to the environment from CCA-treated wood. 2. Leaching and speciation during disposal. Environmental Science & Technology. 40(3): 994-999. Retrieved from http://dx.doi.org/10.1021/es051471u .
Klotz, J. H., Moss, J. I., Zhao, R., Davis Jr., L. R., Patterson, R. S. (1994). Oral toxicity of boric acid and other boron compounds to immature cat fleas (Siphonaptera: Pulicidae). J. Econ. Entomol. 87, pp 1534–1536.
Lee, H., Huang, W., Lee, H., and Son, D. (2016). Wood Decay Properties of Difference MCQ Retention Levels. J. Korean Science Technology. 44(5): 716-725.
Merrick, G. D. (1956). Quantity of wood treated and preservatives used in the United States in 1955. Report presented at the Fifty-Second Annual Meeting of the American Wood-Preservers’ Association. New Orleans, Louisiana. Published in Washington D.C. Retrieved from University of Miami libraries.
Merrick, G. D. (1961). Quantity of wood treated and preservatives used in the United States in 1960. Report presented at the Fifty-Seventh Annual Meeting of the American Wood-Preservers’ Association. Banff, Alberta, Canada. Published in Washington D.C.
Merrick, G. D. (1965). Quantity of wood treated and preservatives used in the United States in 1964. Report presented at the Sixty-First Annual Meeting of the American Wood-Preservers’ Association.
Merrick, G. D. (1967). Wood Preservation Statistics 1966. Report presented at the Sixty-Third Annual Meeting of the American Wood-Preservers’ Association. Published in Washington D.C.
56
Micklewright, J. T. (1986). (Consulting Forest Products). Wood Preservation Statistics, 1983 & 1984. Final report 1986. American Wood Preservers’ Association. Washington, D.C. Retrieved from University of Georgia Libraries.
Micklewright, J. T. (1992). (Consulting Forest Products). Wood Preservation Statistics, 1990. Final report 1992. Washington, D.C.: American Wood Preservers’ Association. Retrieved from Forest Products Laboratory Library.
Micklewright, J. T. (1998). (Consulting Forest Products). Wood Preservation Statistics 1997. Final report 1998. Washington, D.C.: American Wood Preservers’ Association. Retrieved from Forest Products Laboratory Library.
Micropro® (2015). Micropro® Preservative Retention. Retrieved from http://www.kopperspc.com/micropro/micropro-preservative-retention.html.
Nielsen, F. H. (1997). Boron in human and animal nutrition. Netherlands: Kluwer Academic Publishers. Plant and Soil 193, 199–208.
Omae, A., Solo-Gabriele, H., Townsend, T. (2007). A Chemical Stain for Identifying Arsenic-Treated Wood Products. Journal of Wood Chemistry and Technology, 27(3-4): 201-217.
Ormondroyd, G. A., Spear, M. J., Skinner, C. (2016). The Opportunities and Challenges for Re-use and Recycling of Timber and Wood Products Within the Construction Sector. In A. Kutnar & S. S. Muthu (Eds.), Environmental Impacts of Traditional and Innovative Forest-based Bioproducts (pp. 45–103). Singapore: Springer Singapore. https://doi.org/10.1007/978-981-10-0655-5_3
Railway Tie Association. (2014). Wood crosstie insertions in the United States, class 1 railroads. Retrieved from http://www.rta.org/historical-trends.
Rasem Hasan, A., Schindler, J., Solo-Gabriele, H.M., Townsend, T.G. (2011). Online sorting of recovered wood waste by automated XRF-technology. Part I: Detection of preservative-treated wood waste. Waste Manag., 31: 688-694.
Rodríguez, G., Alegre, F. J., & Martínez, G. (2007). The contribution of environmental management systems to the management of construction and demolition waste: The case of the Autonomous Community of Madrid (Spain). Resources, Conservation and Recycling, 50(3), 334–349. https://doi.org/10.1016/j.resconrec.2006.06.008
Saha, N., Zaman, M. R. (2011). Concentration of selected toxic metals in groundwater and some cereals grown in Shibganj area of Chapai Nawabganj, Rajshahi, Bangladesh. Current Science. pp 429. Retrieved June 1, 2016 Test ID: ASU.
Shibata, T., Solo-Gabriele, H. M., Dubey, B., Townsend, T. G., Jacobi, G. A. (2006). Arsenic leaching from mulch made from recycled construction and demolition wood and impacts of iron-oxide colorants. Environmental Science & Technology, 40(16), 5102-5107.
Shibata, T., Solo-Gabriele, H.M., Fleming, L., Cai, Y., Townsend, T.G., 2007. A Mass Balance Approach for Evaluating Leachable Arsenic and Chromium from an In-Service CCA-Treated Wood Structure. The Science of the Total Environment, 372: 624-635.
Solo-Gabriele, H. Townsend, T. (1999). Disposal practices and management alternatives for CCA-treated wood waste. Waste Management and Research, 17: 378–389. 1999. doi:10.1034/j.1399-3070.1999.00054.x

57
Solo-Gabriele, H. M., Jones, A., Marini, J., Townsend, T. G., Robey, N. (2016). Trends in waterborne treated wood production and implications for wood waste disposal. Proceedings of the 112th Annual Meeting of the American Wood Protection Association held in San Juan, Puerto Rico, May 2016, p. 151-162.
Solo-Gabriele, H.M., Townsend, T. (1999). Disposal Practices and Management Alternatives for CCA-Treated Wood Waste. Waste Management Research, 17: 378-389.
Solo-Gabriele, H.M., Jones, A., Marini, J., Townsend, T.G., Robey, N. (2016). Trends in Waterborne Treated Wood Production and Implications for Wood Waste Disposal. Proceedings of the 112th Annual Meeting of the American Wood Protection Association held in San Juan, Puerto Rico, p. 151-162.
Solo-Gabriele, H.M., Townsend, T., Penha, J., Tolaymat, T., Calitu, V. (1998). Generation, Use, Disposal, and Management Options for CCA-Treated Wood, Final Technical Report #98-01. Florida Center for Solid and Hazardous Waste Management, Gainesville, FL.
Solomon, F. (2009). Impacts of copper on aquatic ecosystems and human health. Environment and Communities. January 2009. Retrieved from http://www.ushydrotech.com/files /6714/1409/9604/Impacts_of_Copper_on_Aquatic_Ecosystems_and_human_Health.pdf.
Steer, H.B. (1953). Quantity of wood treated and preservatives used in the United States in 1952. Report presented at the Fourty-Eighth Annual Meeting of the American Wood-Preservers’ Association.
Stirling, R., Morris, P.I. (2010). Mobility of Copper from MCQ in Shell-Treated Wood Exposed Above Ground. Proceedings IRG Annual Meeting, IRG/WP 10-30534. International Research Group on Wood Preservation, Stockholm, Sweden
Taylor, J.L., Cooper, P.A. (2001). Effect of climate, species, preservative concentration and water repellent on leaching rom CCA-treated lumber exposed above ground. Proceedings IRG Annual Meeting, IRG/WP 01-50178. International Research Group on Wood Preservation, Stockholm, Sweden.
Tolaymat, T. M., Townsend, T. G., Solo-Gabriele, H. (2000). Chromated copper arsenate-treated wood in recovered wood. Environmental Engineering Science 17.1 (2000): 19-28.
Townsend, T., Solo-Gabriele, H., Tolaymat, T., Stook, K., Hosein, N. (2003). Chromium, copper, and arsenic concentrations in soil underneath CCA-treated wood structures. Soil and Sediment Contamination, 12(6), 779-798.
Townsend, T., Tolaymat, T., Solo-Gabriele, H., Dubey, B., Stook, K., Wadanambi, L. (2004). Leaching of CCA-treated wood: implications for waste disposal. Journal of Hazardous Materials. B114 75-91.
Truini, J. (2013). Your Guide to Dealing with Pressure Treated Wood. Popular Mechanics. July 2013. Retrieved from http://www.popularmechanics.com/home/outdoor-projects/how-to/a3103/your-guide-to-working-with-pressure-treated-lumber-15655848.
US Environmental Protection Agency (US EPA). (1996). Acid Digestion of Sediments, Sludges, and Soils, EPA 3050B; Washington, DC, 1996.
US Environmental Protection Agency (US EPA). (1996). Test Methods For Evaluating Solid Waste, SW846, vol. 3, Office of Solid Waste and Emergency Response, Washington, DC.
58
US Environmental Protection Agency. (2002). Federal Register, Notice of Receipt of Requests to Cancel Certain Chromated Copper Arsenate (CCA) Wood Preservative Products and Amend to Terminate Certain Uses of CCA Products (February 22, 2002), Volume 67, Number 36: 8244-8246. FRL-6826-8. US Environmental Protection Agency (EPA), Washington, DC, USA.
US Environmental Protection Agency. (2015b). Petition for Determination Identifying Non-Hazardous Secondary Treated Wood Biomass as a Non-Waste under 40 CFR 241.4(a). U.S. EPA web page: http://www2.epa.gov/aboutepa/petition-determination-identifying-non-hazardous-secondary-treated-wood-biomass-non-waste)
US Environmental Protection Agency. (2016). Additions to List of Categorical Non-Waste Fuels. Code of Federal Regulations, 40 CFR 241, Federal Register, 81 FR 6687, p. 6688-6743). Document Number, 2016-01866. Agency/Docket Numbers, EPA-HQ-RCRA-2013-0110, FRL-9929-56-OLEM.
US Environmental Protection Agency (US EPA). (2016). Advancing Sustainable Materials Management: 2014 Fact Sheet. 2016. EPA530-R-17-01.
US Geological Survey (USGS). (2017). Precipitation records data available on the World Wide Web (USGS precipitation records). Retrieved from https://wa.water.usgs.gov/projects/preciprecords.
Vergara, P., Uribe, E., and Cortes, A. (2013). Optimization of a quality model for CCA industrial impregnation of Pinus radiate D. Don agricultural fencing stakes. Wood Research. Volume 58, Number 1. Retrieved from http://aldia.utem.cl/wp-content/uploads/2013/03/Vergara_Uribe_Cortes.pdf.
Vlosky, R.P. (2009). Statistical Overview of the U.S. Wood Preserving Industry. Louisiana State University.
World Health Organization (WHO). (2003). Chromium in drinking-water. Background document for preparation of WHO Guidelines for drinking-water quality. International Programme on Chemical Safety. Environmental Health Criteria 61 – Chromium. Geneva, Switzerland. Retrieved 2016-08-15 from http://www.inchem.org/documents/ehc/ehc/ehc61.htm.
Zheng, L., Wu, H., Zhang, H., Duan, H., Wang, J., Jiang, W., Dong, B., Liu, G., Zuo, J., Song, Q. (2017). Characterizing the generation and flows of construction and demolition waste in China. Construction and Building Materials, 136, 405–413. https://doi.org/10.1016/j.conbuildmat.2017.01.055
59
APPENDIX A
DISPOSAL FORECAST
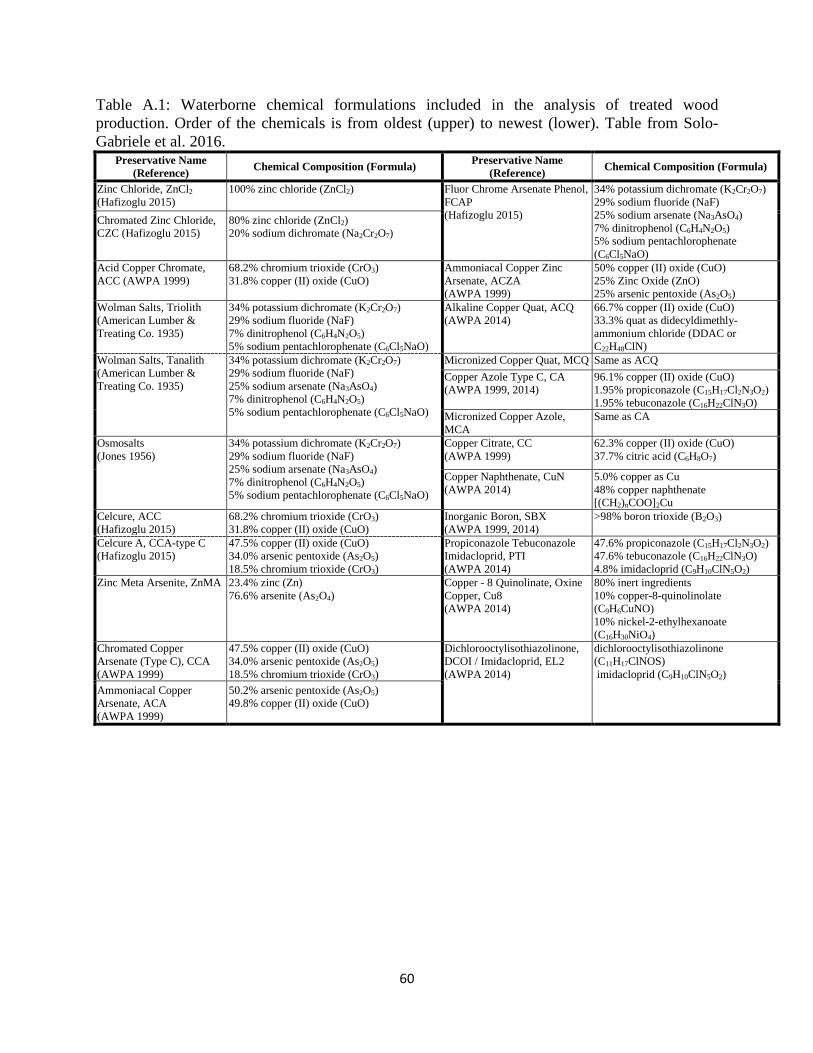
60
Table A.1: Waterborne chemical formulations included in the analysis of treated wood production. Order of the chemicals is from oldest (upper) to newest (lower). Table from Solo-Gabriele et al. 2016.
Preservative Name (Reference) Chemical Composition (Formula) Preservative Name
(Reference) Chemical Composition (Formula)
Zinc Chloride, ZnCl2 (Hafizoglu 2015)
100% zinc chloride (ZnCl2) Fluor Chrome Arsenate Phenol, FCAP (Hafizoglu 2015)
34% potassium dichromate (K2Cr2O7) 29% sodium fluoride (NaF) 25% sodium arsenate (Na3AsO4) 7% dinitrophenol (C6H4N2O5) 5% sodium pentachlorophenate (C6Cl5NaO)
Chromated Zinc Chloride, CZC (Hafizoglu 2015)
80% zinc chloride (ZnCl2) 20% sodium dichromate (Na2Cr2O7)
Acid Copper Chromate, ACC (AWPA 1999)
68.2% chromium trioxide (CrO3) 31.8% copper (II) oxide (CuO)
Ammoniacal Copper Zinc Arsenate, ACZA (AWPA 1999)
50% copper (II) oxide (CuO) 25% Zinc Oxide (ZnO) 25% arsenic pentoxide (As2O5)
Wolman Salts, Triolith (American Lumber & Treating Co. 1935)
34% potassium dichromate (K2Cr2O7) 29% sodium fluoride (NaF) 7% dinitrophenol (C6H4N2O5) 5% sodium pentachlorophenate (C6Cl5NaO)
Alkaline Copper Quat, ACQ (AWPA 2014)
66.7% copper (II) oxide (CuO) 33.3% quat as didecyldimethly-ammonium chloride (DDAC or C22H48ClN)
Wolman Salts, Tanalith (American Lumber & Treating Co. 1935)
34% potassium dichromate (K2Cr2O7) 29% sodium fluoride (NaF) 25% sodium arsenate (Na3AsO4) 7% dinitrophenol (C6H4N2O5) 5% sodium pentachlorophenate (C6Cl5NaO)
Micronized Copper Quat, MCQ Same as ACQ Copper Azole Type C, CA (AWPA 1999, 2014)
96.1% copper (II) oxide (CuO) 1.95% propiconazole (C15H17Cl2N3O2) 1.95% tebuconazole (C16H22ClN3O)
Micronized Copper Azole, MCA
Same as CA
Osmosalts (Jones 1956)
34% potassium dichromate (K2Cr2O7) 29% sodium fluoride (NaF) 25% sodium arsenate (Na3AsO4) 7% dinitrophenol (C6H4N2O5) 5% sodium pentachlorophenate (C6Cl5NaO)
Copper Citrate, CC (AWPA 1999)
62.3% copper (II) oxide (CuO) 37.7% citric acid (C6H8O7)
Copper Naphthenate, CuN (AWPA 2014)
5.0% copper as Cu 48% copper naphthenate [(CH2)nCOO]2Cu
Celcure, ACC (Hafizoglu 2015)
68.2% chromium trioxide (CrO3) 31.8% copper (II) oxide (CuO)
Inorganic Boron, SBX (AWPA 1999, 2014)
>98% boron trioxide (B2O3)
Celcure A, CCA-type C (Hafizoglu 2015)
47.5% copper (II) oxide (CuO) 34.0% arsenic pentoxide (As2O5) 18.5% chromium trioxide (CrO3)
Propiconazole Tebuconazole Imidacloprid, PTI (AWPA 2014)
47.6% propiconazole (C15H17Cl2N3O2) 47.6% tebuconazole (C16H22ClN3O) 4.8% imidacloprid (C9H10ClN5O2)
Zinc Meta Arsenite, ZnMA 23.4% zinc (Zn) 76.6% arsenite (As2O4)
Copper - 8 Quinolinate, Oxine Copper, Cu8 (AWPA 2014)
80% inert ingredients 10% copper-8-quinolinolate (C9H6CuNO) 10% nickel-2-ethylhexanoate (C16H30NiO4)
Chromated Copper Arsenate (Type C), CCA (AWPA 1999)
47.5% copper (II) oxide (CuO) 34.0% arsenic pentoxide (As2O5) 18.5% chromium trioxide (CrO3)
Dichlorooctylisothiazolinone, DCOI / Imidacloprid, EL2 (AWPA 2014)
dichlorooctylisothiazolinone (C11H17ClNOS) imidacloprid (C9H10ClN5O2)
Ammoniacal Copper Arsenate, ACA (AWPA 1999)
50.2% arsenic pentoxide (As2O5) 49.8% copper (II) oxide (CuO)
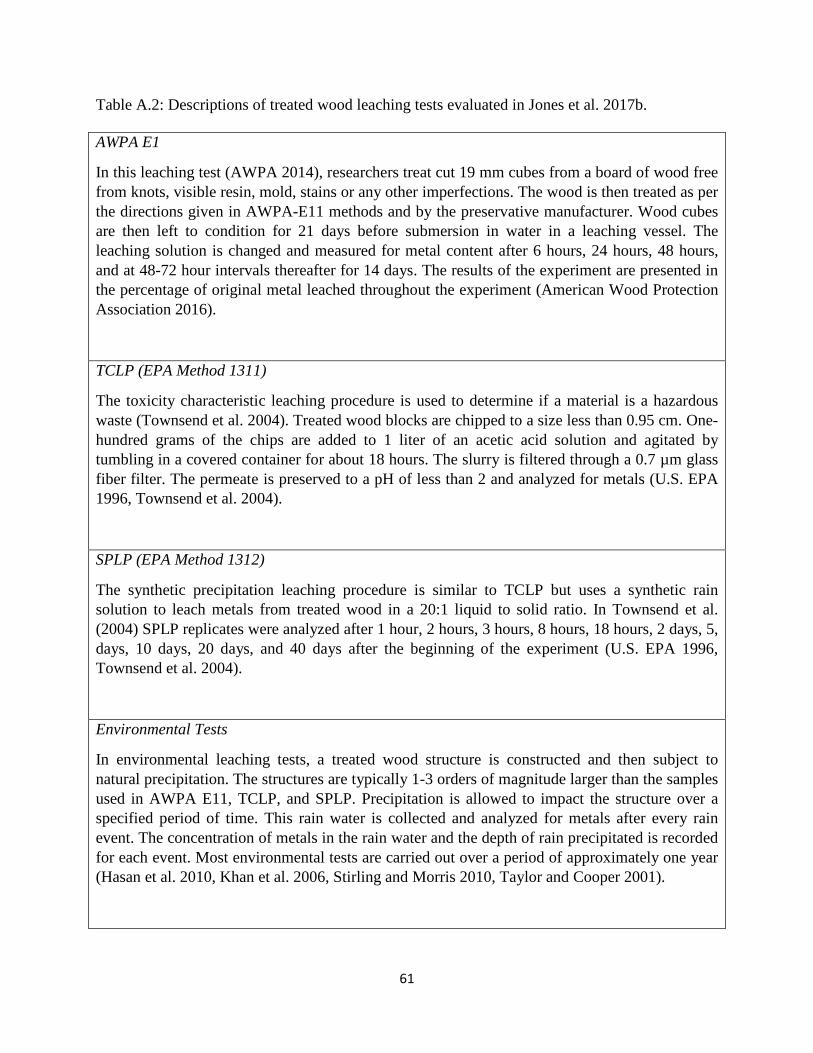
61
Table A.2: Descriptions of treated wood leaching tests evaluated in Jones et al. 2017b. AWPA E1
In this leaching test (AWPA 2014), researchers treat cut 19 mm cubes from a board of wood free from knots, visible resin, mold, stains or any other imperfections. The wood is then treated as per the directions given in AWPA-E11 methods and by the preservative manufacturer. Wood cubes are then left to condition for 21 days before submersion in water in a leaching vessel. The leaching solution is changed and measured for metal content after 6 hours, 24 hours, 48 hours, and at 48-72 hour intervals thereafter for 14 days. The results of the experiment are presented in the percentage of original metal leached throughout the experiment (American Wood Protection Association 2016).
TCLP (EPA Method 1311)
The toxicity characteristic leaching procedure is used to determine if a material is a hazardous waste (Townsend et al. 2004). Treated wood blocks are chipped to a size less than 0.95 cm. One-hundred grams of the chips are added to 1 liter of an acetic acid solution and agitated by tumbling in a covered container for about 18 hours. The slurry is filtered through a 0.7 µm glass fiber filter. The permeate is preserved to a pH of less than 2 and analyzed for metals (U.S. EPA 1996, Townsend et al. 2004).
SPLP (EPA Method 1312)
The synthetic precipitation leaching procedure is similar to TCLP but uses a synthetic rain solution to leach metals from treated wood in a 20:1 liquid to solid ratio. In Townsend et al. (2004) SPLP replicates were analyzed after 1 hour, 2 hours, 3 hours, 8 hours, 18 hours, 2 days, 5, days, 10 days, 20 days, and 40 days after the beginning of the experiment (U.S. EPA 1996, Townsend et al. 2004).
Environmental Tests
In environmental leaching tests, a treated wood structure is constructed and then subject to natural precipitation. The structures are typically 1-3 orders of magnitude larger than the samples used in AWPA E11, TCLP, and SPLP. Precipitation is allowed to impact the structure over a specified period of time. This rain water is collected and analyzed for metals after every rain event. The concentration of metals in the rain water and the depth of rain precipitated is recorded for each event. Most environmental tests are carried out over a period of approximately one year (Hasan et al. 2010, Khan et al. 2006, Stirling and Morris 2010, Taylor and Cooper 2001).
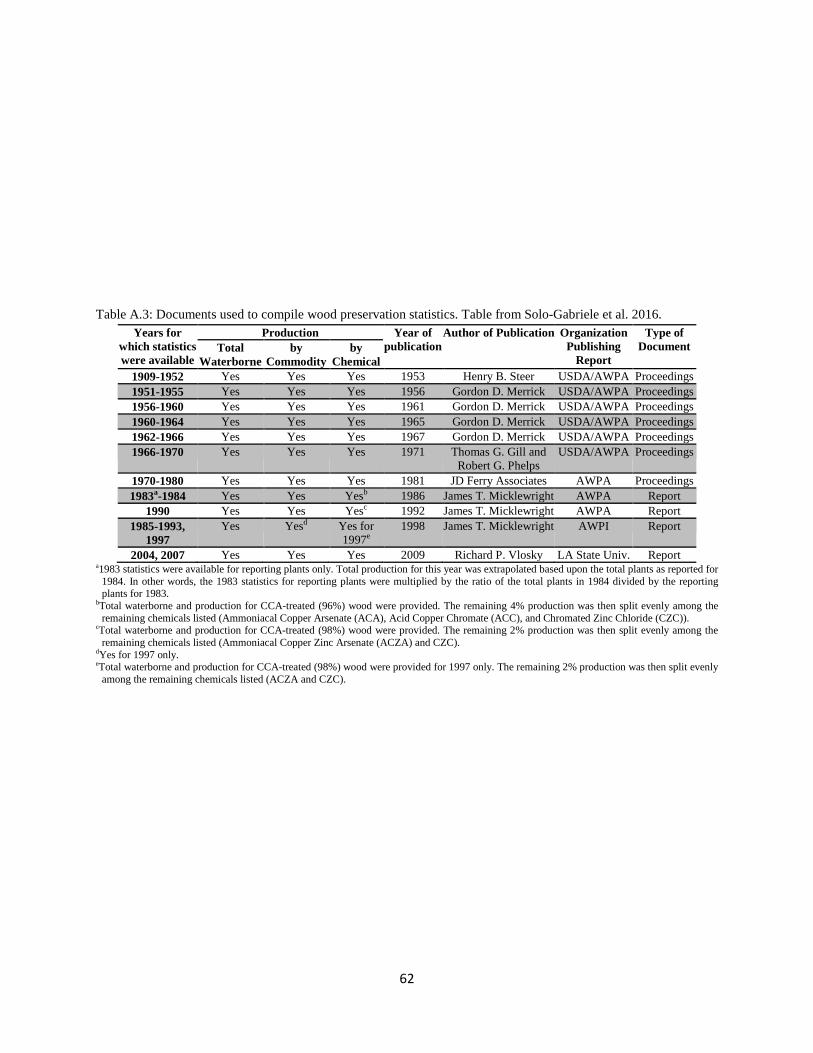
62
Table A.3: Documents used to compile wood preservation statistics. Table from Solo-Gabriele et al. 2016.
Years for which statistics were available
Production Year of publication
Author of Publication Organization Publishing
Report
Type of Document Total
Waterborne by
Commodity by
Chemical 1909-1952 Yes Yes Yes 1953 Henry B. Steer USDA/AWPA Proceedings 1951-1955 Yes Yes Yes 1956 Gordon D. Merrick USDA/AWPA Proceedings 1956-1960 Yes Yes Yes 1961 Gordon D. Merrick USDA/AWPA Proceedings 1960-1964 Yes Yes Yes 1965 Gordon D. Merrick USDA/AWPA Proceedings 1962-1966 Yes Yes Yes 1967 Gordon D. Merrick USDA/AWPA Proceedings 1966-1970 Yes Yes Yes 1971 Thomas G. Gill and
Robert G. Phelps USDA/AWPA Proceedings
1970-1980 Yes Yes Yes 1981 JD Ferry Associates AWPA Proceedings 1983a-1984 Yes Yes Yesb 1986 James T. Micklewright AWPA Report
1990 Yes Yes Yesc 1992 James T. Micklewright AWPA Report 1985-1993,
1997 Yes Yesd Yes for
1997e 1998 James T. Micklewright AWPI Report
2004, 2007 Yes Yes Yes 2009 Richard P. Vlosky LA State Univ. Report a1983 statistics were available for reporting plants only. Total production for this year was extrapolated based upon the total plants as reported for
1984. In other words, the 1983 statistics for reporting plants were multiplied by the ratio of the total plants in 1984 divided by the reporting plants for 1983.
bTotal waterborne and production for CCA-treated (96%) wood were provided. The remaining 4% production was then split evenly among the remaining chemicals listed (Ammoniacal Copper Arsenate (ACA), Acid Copper Chromate (ACC), and Chromated Zinc Chloride (CZC)).
cTotal waterborne and production for CCA-treated (98%) wood were provided. The remaining 2% production was then split evenly among the remaining chemicals listed (Ammoniacal Copper Zinc Arsenate (ACZA) and CZC).
dYes for 1997 only. eTotal waterborne and production for CCA-treated (98%) wood were provided for 1997 only. The remaining 2% production was then split evenly
among the remaining chemicals listed (ACZA and CZC).
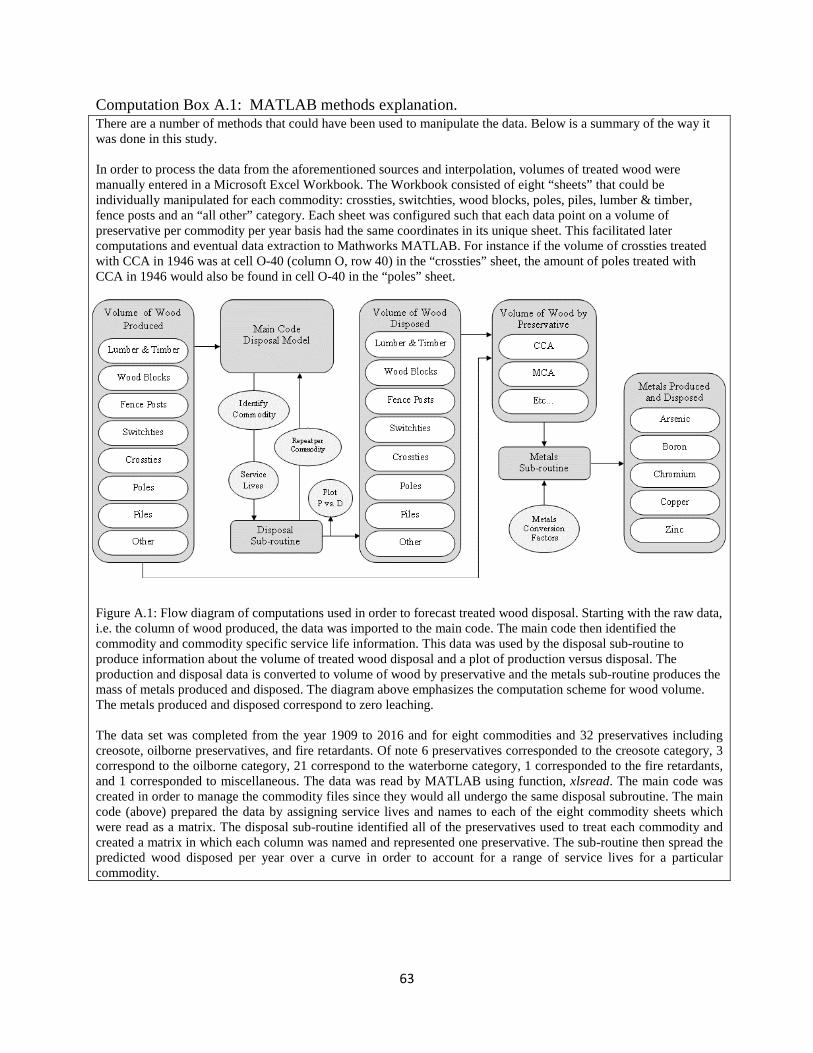
63
Computation Box A.1: MATLAB methods explanation. There are a number of methods that could have been used to manipulate the data. Below is a summary of the way it was done in this study. In order to process the data from the aforementioned sources and interpolation, volumes of treated wood were manually entered in a Microsoft Excel Workbook. The Workbook consisted of eight “sheets” that could be individually manipulated for each commodity: crossties, switchties, wood blocks, poles, piles, lumber & timber, fence posts and an “all other” category. Each sheet was configured such that each data point on a volume of preservative per commodity per year basis had the same coordinates in its unique sheet. This facilitated later computations and eventual data extraction to Mathworks MATLAB. For instance if the volume of crossties treated with CCA in 1946 was at cell O-40 (column O, row 40) in the “crossties” sheet, the amount of poles treated with CCA in 1946 would also be found in cell O-40 in the “poles” sheet.
Figure A.1: Flow diagram of computations used in order to forecast treated wood disposal. Starting with the raw data, i.e. the column of wood produced, the data was imported to the main code. The main code then identified the commodity and commodity specific service life information. This data was used by the disposal sub-routine to produce information about the volume of treated wood disposal and a plot of production versus disposal. The production and disposal data is converted to volume of wood by preservative and the metals sub-routine produces the mass of metals produced and disposed. The diagram above emphasizes the computation scheme for wood volume. The metals produced and disposed correspond to zero leaching. The data set was completed from the year 1909 to 2016 and for eight commodities and 32 preservatives including creosote, oilborne preservatives, and fire retardants. Of note 6 preservatives corresponded to the creosote category, 3 correspond to the oilborne category, 21 correspond to the waterborne category, 1 corresponded to the fire retardants, and 1 corresponded to miscellaneous. The data was read by MATLAB using function, xlsread. The main code was created in order to manage the commodity files since they would all undergo the same disposal subroutine. The main code (above) prepared the data by assigning service lives and names to each of the eight commodity sheets which were read as a matrix. The disposal sub-routine identified all of the preservatives used to treat each commodity and created a matrix in which each column was named and represented one preservative. The sub-routine then spread the predicted wood disposed per year over a curve in order to account for a range of service lives for a particular commodity.
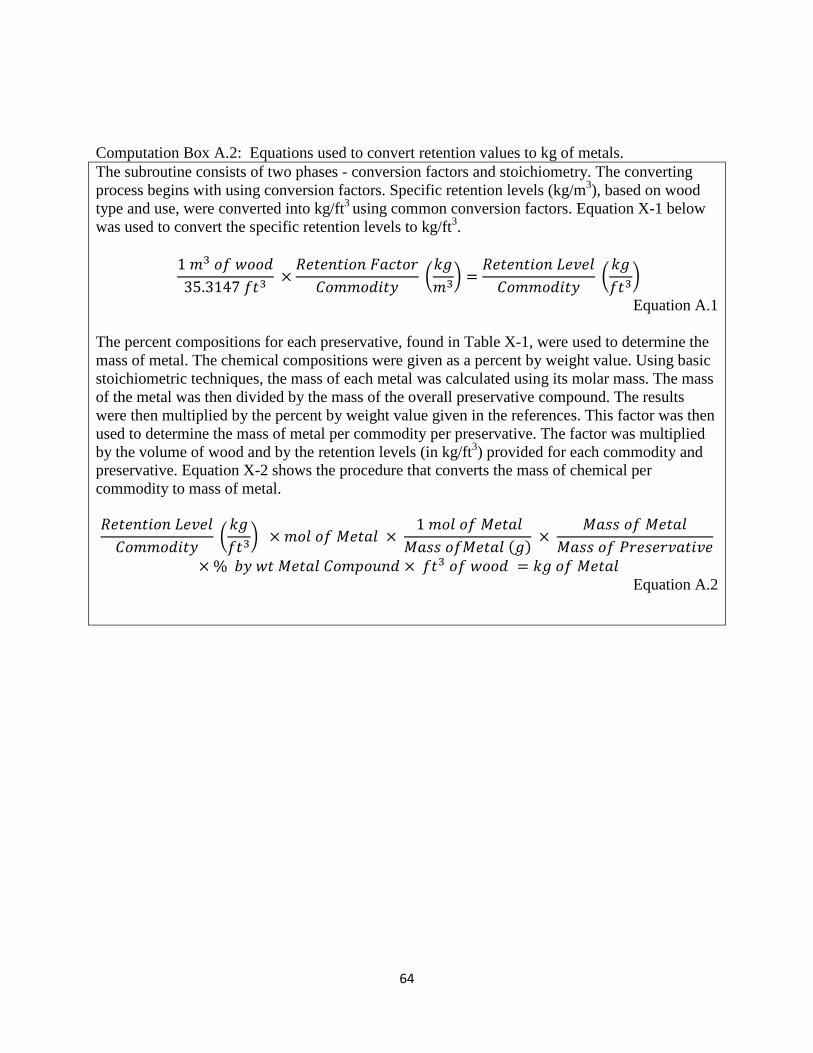
64
Computation Box A.2: Equations used to convert retention values to kg of metals. The subroutine consists of two phases - conversion factors and stoichiometry. The converting process begins with using conversion factors. Specific retention levels (kg/m3), based on wood type and use, were converted into kg/ft3 using common conversion factors. Equation X-1 below was used to convert the specific retention levels to kg/ft3.
1 𝑚3 𝑜𝑓 𝑤𝑜𝑜𝑤35.3147 𝑓𝑓3
×𝑅𝑅𝑓𝑅𝑅𝑓𝑅𝑜𝑅 𝐹𝐹𝐹𝑓𝑜𝐹
𝐶𝑜𝑚𝑚𝑜𝑤𝑅𝑓𝐶 �𝑘𝑘𝑚3� =
𝑅𝑅𝑓𝑅𝑅𝑓𝑅𝑜𝑅 𝑆𝑅𝐿𝑅𝐿𝐶𝑜𝑚𝑚𝑜𝑤𝑅𝑓𝐶
�𝑘𝑘𝑓𝑓3
�
Equation A.1 The percent compositions for each preservative, found in Table X-1, were used to determine the mass of metal. The chemical compositions were given as a percent by weight value. Using basic stoichiometric techniques, the mass of each metal was calculated using its molar mass. The mass of the metal was then divided by the mass of the overall preservative compound. The results were then multiplied by the percent by weight value given in the references. This factor was then used to determine the mass of metal per commodity per preservative. The factor was multiplied by the volume of wood and by the retention levels (in kg/ft3) provided for each commodity and preservative. Equation X-2 shows the procedure that converts the mass of chemical per commodity to mass of metal. 𝑅𝑅𝑓𝑅𝑅𝑓𝑅𝑜𝑅 𝑆𝑅𝐿𝑅𝐿𝐶𝑜𝑚𝑚𝑜𝑤𝑅𝑓𝐶
�𝑘𝑘𝑓𝑓3
� × 𝑚𝑜𝐿 𝑜𝑓 𝑀𝑅𝑓𝐹𝐿 × 1 𝑚𝑜𝐿 𝑜𝑓 𝑀𝑅𝑓𝐹𝐿𝑀𝐹𝑀𝑀 𝑜𝑓𝑀𝑅𝑓𝐹𝐿 (𝑘) ×
𝑀𝐹𝑀𝑀 𝑜𝑓 𝑀𝑅𝑓𝐹𝐿𝑀𝐹𝑀𝑀 𝑜𝑓 𝑃𝐹𝑅𝑀𝑅𝐹𝐿𝐹𝑓𝑅𝐿𝑅
× % 𝑏𝐶 𝑤𝑓 𝑀𝑅𝑓𝐹𝐿 𝐶𝑜𝑚𝑝𝑜𝐶𝑅𝑤 × 𝑓𝑓3 𝑜𝑓 𝑤𝑜𝑜𝑤 = 𝑘𝑘 𝑜𝑓 𝑀𝑅𝑓𝐹𝐿 Equation A.2
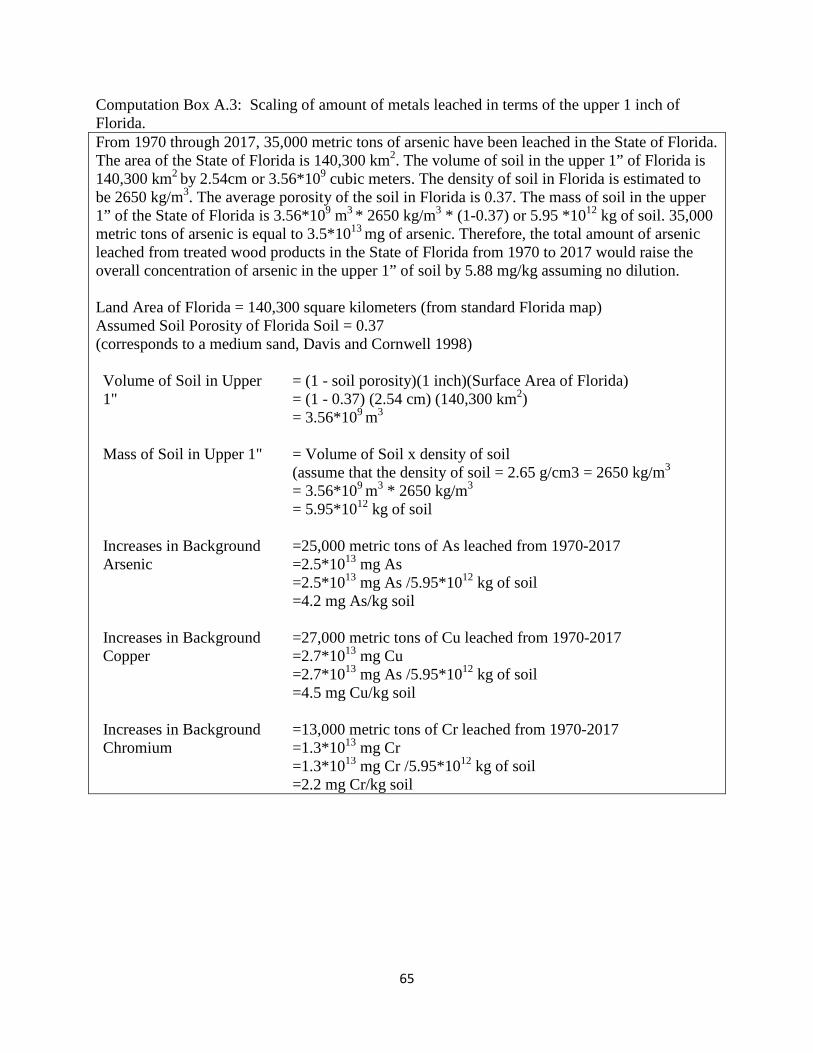
65
Computation Box A.3: Scaling of amount of metals leached in terms of the upper 1 inch of Florida. From 1970 through 2017, 35,000 metric tons of arsenic have been leached in the State of Florida. The area of the State of Florida is 140,300 km2. The volume of soil in the upper 1” of Florida is 140,300 km2 by 2.54cm or 3.56*109 cubic meters. The density of soil in Florida is estimated to be 2650 kg/m3. The average porosity of the soil in Florida is 0.37. The mass of soil in the upper 1” of the State of Florida is 3.56*109 m3 * 2650 kg/m3 * (1-0.37) or 5.95 *1012 kg of soil. 35,000 metric tons of arsenic is equal to 3.5*1013 mg of arsenic. Therefore, the total amount of arsenic leached from treated wood products in the State of Florida from 1970 to 2017 would raise the overall concentration of arsenic in the upper 1” of soil by 5.88 mg/kg assuming no dilution. Land Area of Florida = 140,300 square kilometers (from standard Florida map) Assumed Soil Porosity of Florida Soil = 0.37 (corresponds to a medium sand, Davis and Cornwell 1998) Volume of Soil in Upper 1"
= (1 - soil porosity)(1 inch)(Surface Area of Florida) = (1 - 0.37) (2.54 cm) (140,300 km2)
= 3.56*109 m3
Mass of Soil in Upper 1" = Volume of Soil x density of soil
(assume that the density of soil = 2.65 g/cm3 = 2650 kg/m3 = 3.56*109 m3 * 2650 kg/m3
= 5.95*1012 kg of soil
Increases in Background Arsenic
=25,000 metric tons of As leached from 1970-2017 =2.5*1013 mg As
=2.5*1013 mg As /5.95*1012 kg of soil =4.2 mg As/kg soil Increases in Background Copper
=27,000 metric tons of Cu leached from 1970-2017 =2.7*1013 mg Cu
=2.7*1013 mg As /5.95*1012 kg of soil =4.5 mg Cu/kg soil Increases in Background Chromium
=13,000 metric tons of Cr leached from 1970-2017 =1.3*1013 mg Cr
=1.3*1013 mg Cr /5.95*1012 kg of soil =2.2 mg Cr/kg soil
66
APPENDIX B
GUIDANCE DOCUMENT
A draft of the updated Guidance Document is included on the following pages.
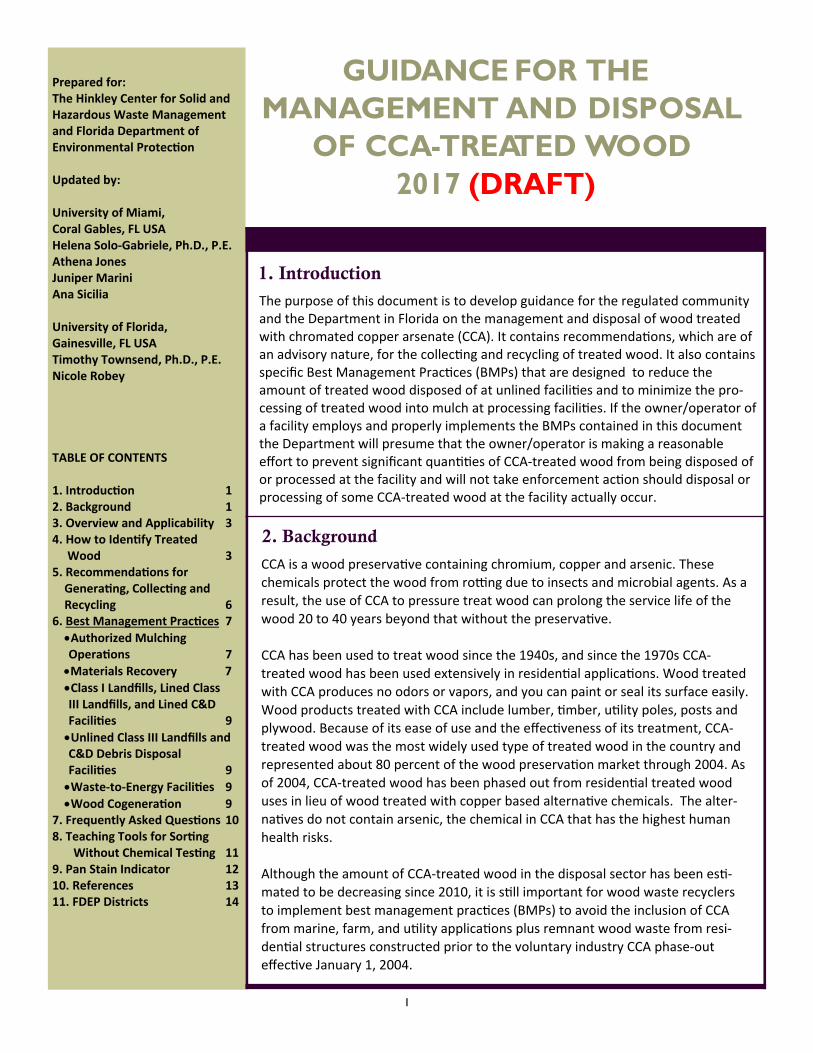
1
1. Introduction
2. Background
Prepared for: The Hinkley Center for Solid and Hazardous Waste Management and Florida Department of Environmental Protec on Updated by: University of Miami, Coral Gables, FL USA Helena Solo‐Gabriele, Ph.D., P.E. Athena Jones Juniper Marini Ana Sicilia University of Florida, Gainesville, FL USA Timothy Townsend, Ph.D., P.E. Nicole Robey TABLE OF CONTENTS 1. Introduc on 1 2. Background 1 3. Overview and Applicability 3 4. How to Iden fy Treated Wood 3 5. Recommenda ons for Genera ng, Collec ng and Recycling 6 6. Best Management Prac ces 7
Authorized Mulching Opera ons 7
Materials Recovery 7
Class I Landfills, Lined Class III Landfills, and Lined C&D Facili es 9
Unlined Class III Landfills and C&D Debris Disposal Facili es 9
Waste‐to‐Energy Facili es 9
Wood Cogenera on 9 7. Frequently Asked Ques ons 10 8. Teaching Tools for Sor ng Without Chemical Tes ng 11 9. Pan Stain Indicator 12 10. References 13 11. FDEP Districts 14
GUIDANCE FOR THE MANAGEMENT AND DISPOSAL
OF CCA-TREATED WOOD 2017 (DRAFT)
The purpose of this document is to develop guidance for the regulated community and the Department in Florida on the management and disposal of wood treated with chromated copper arsenate (CCA). It contains recommenda ons, which are of an advisory nature, for the collec ng and recycling of treated wood. It also contains specific Best Management Prac ces (BMPs) that are designed to reduce the amount of treated wood disposed of at unlined facili es and to minimize the pro-cessing of treated wood into mulch at processing facili es. If the owner/operator of a facility employs and properly implements the BMPs contained in this document the Department will presume that the owner/operator is making a reasonable effort to prevent significant quan es of CCA-treated wood from being disposed of or processed at the facility and will not take enforcement ac on should disposal or processing of some CCA-treated wood at the facility actually occur.
CCA is a wood preserva ve containing chromium, copper and arsenic. These chemicals protect the wood from ro ng due to insects and microbial agents. As a result, the use of CCA to pressure treat wood can prolong the service life of the wood 20 to 40 years beyond that without the preserva ve.
CCA has been used to treat wood since the 1940s, and since the 1970s CCA-treated wood has been used extensively in residen al applica ons. Wood treated with CCA produces no odors or vapors, and you can paint or seal its surface easily.
Wood products treated with CCA include lumber, mber, u lity poles, posts and plywood. Because of its ease of use and the effec veness of its treatment, CCA-treated wood was the most widely used type of treated wood in the country and represented about 80 percent of the wood preserva on market through 2004. As
of 2004, CCA-treated wood has been phased out from residen al treated wood uses in lieu of wood treated with copper based alterna ve chemicals. The alter-na ves do not contain arsenic, the chemical in CCA that has the highest human
health risks. Although the amount of CCA-treated wood in the disposal sector has been es -mated to be decreasing since 2010, it is s ll important for wood waste recyclers
to implement best management prac ces (BMPs) to avoid the inclusion of CCA from marine, farm, and u lity applica ons plus remnant wood waste from resi-den al structures constructed prior to the voluntary industry CCA phase-out effec ve January 1, 2004.
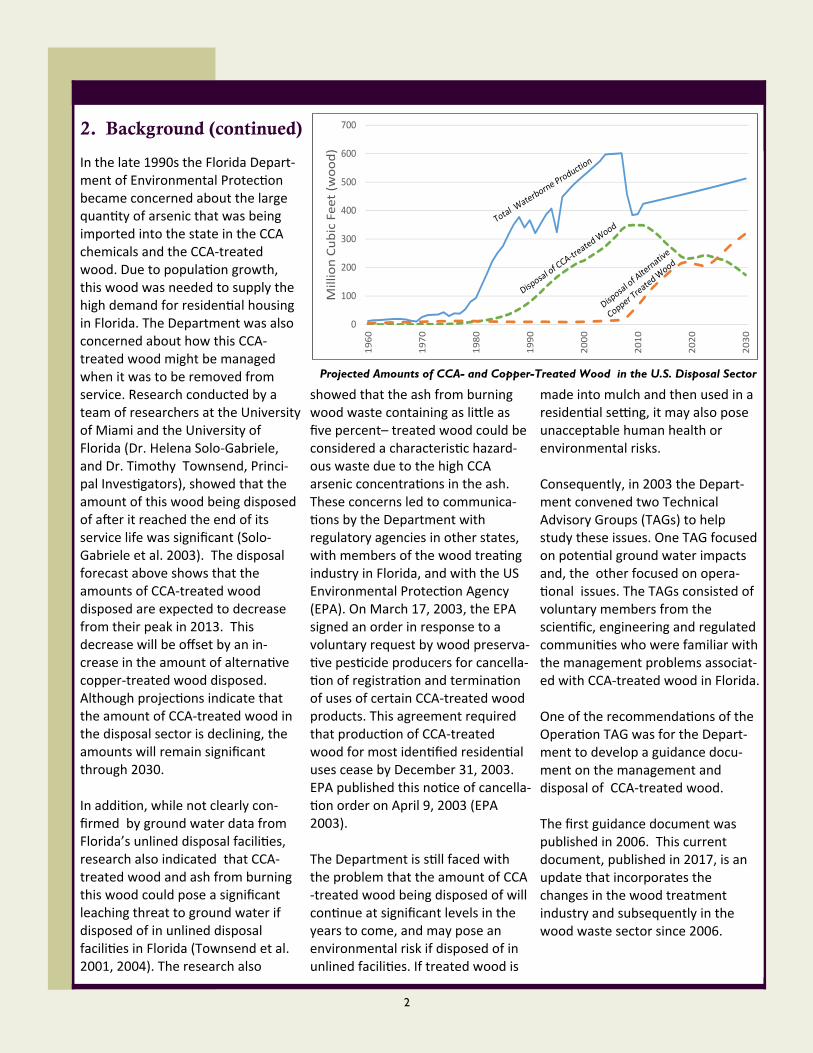
2
In the late 1990s the Florida Depart-ment of Environmental Protec on became concerned about the large quan ty of arsenic that was being imported into the state in the CCA chemicals and the CCA-treated wood. Due to popula on growth, this wood was needed to supply the high demand for residen al housing in Florida. The Department was also concerned about how this CCA-treated wood might be managed when it was to be removed from service. Research conducted by a team of researchers at the University of Miami and the University of Florida (Dr. Helena Solo-Gabriele, and Dr. Timothy Townsend, Princi-pal Inves gators), showed that the amount of this wood being disposed of a er it reached the end of its service life was significant (Solo-Gabriele et al. 2003). The disposal forecast above shows that the amounts of CCA-treated wood disposed are expected to decrease from their peak in 2013. This decrease will be offset by an in-crease in the amount of alterna ve copper-treated wood disposed. Although projec ons indicate that the amount of CCA-treated wood in the disposal sector is declining, the amounts will remain significant through 2030. In addi on, while not clearly con-firmed by ground water data from Florida’s unlined disposal facili es, research also indicated that CCA-treated wood and ash from burning this wood could pose a significant leaching threat to ground water if disposed of in unlined disposal facili es in Florida (Townsend et al. 2001, 2004). The research also
showed that the ash from burning wood waste containing as li le as five percent– treated wood could be considered a characteris c hazard-ous waste due to the high CCA arsenic concentra ons in the ash. These concerns led to communica-ons by the Department with
regulatory agencies in other states, with members of the wood trea ng industry in Florida, and with the US Environmental Protec on Agency (EPA). On March 17, 2003, the EPA signed an order in response to a voluntary request by wood preserva-ve pes cide producers for cancella-on of registra on and termina on
of uses of certain CCA-treated wood products. This agreement required that produc on of CCA-treated wood for most iden fied residen al uses cease by December 31, 2003. EPA published this no ce of cancella-on order on April 9, 2003 (EPA
2003). The Department is s ll faced with the problem that the amount of CCA-treated wood being disposed of will con nue at significant levels in the years to come, and may pose an environmental risk if disposed of in unlined facili es. If treated wood is
made into mulch and then used in a residen al se ng, it may also pose unacceptable human health or environmental risks. Consequently, in 2003 the Depart-ment convened two Technical Advisory Groups (TAGs) to help study these issues. One TAG focused on poten al ground water impacts and, the other focused on opera-onal issues. The TAGs consisted of
voluntary members from the scien fic, engineering and regulated communi es who were familiar with the management problems associat-ed with CCA-treated wood in Florida. One of the recommenda ons of the Opera on TAG was for the Depart-ment to develop a guidance docu-ment on the management and disposal of CCA-treated wood. The first guidance document was published in 2006. This current document, published in 2017, is an update that incorporates the changes in the wood treatment industry and subsequently in the wood waste sector since 2006.
2. Background (continued)
0
100
200
300
400
500
600
700
1960
1970
1980
1990
2000
2010
2020
2030
Million Cubic Feet (wood)
Projected Amounts of CCA- and Copper-Treated Wood in the U.S. Disposal Sector
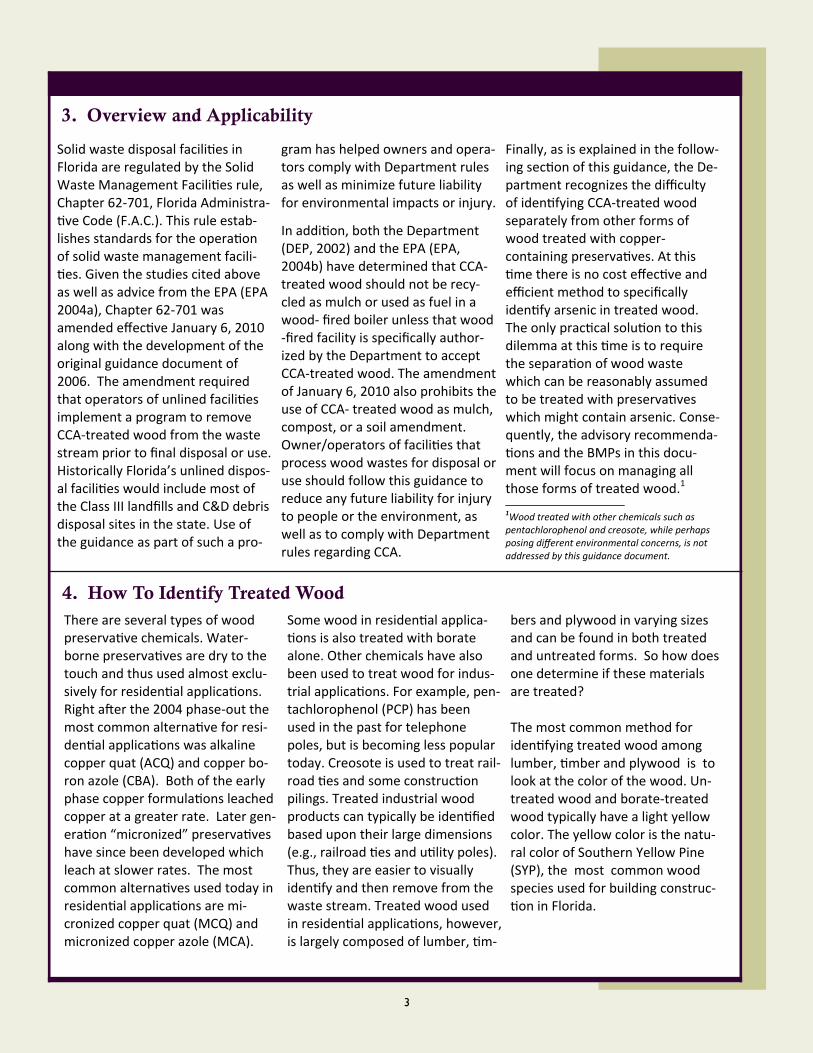
3
Solid waste disposal facili es in Florida are regulated by the Solid Waste Management Facili es rule, Chapter 62-701, Florida Administra-ve Code (F.A.C.). This rule estab-
lishes standards for the opera on of solid waste management facili-es. Given the studies cited above
as well as advice from the EPA (EPA 2004a), Chapter 62-701 was amended effec ve January 6, 2010 along with the development of the original guidance document of 2006. The amendment required that operators of unlined facili es implement a program to remove CCA-treated wood from the waste stream prior to final disposal or use. Historically Florida’s unlined dispos-al facili es would include most of the Class III landfills and C&D debris disposal sites in the state. Use of the guidance as part of such a pro-
gram has helped owners and opera-tors comply with Department rules as well as minimize future liability for environmental impacts or injury.
In addi on, both the Department (DEP, 2002) and the EPA (EPA, 2004b) have determined that CCA- treated wood should not be recy-cled as mulch or used as fuel in a wood- fired boiler unless that wood-fired facility is specifically author-ized by the Department to accept CCA-treated wood. The amendment of January 6, 2010 also prohibits the use of CCA- treated wood as mulch, compost, or a soil amendment. Owner/operators of facili es that process wood wastes for disposal or use should follow this guidance to reduce any future liability for injury to people or the environment, as well as to comply with Department rules regarding CCA.
Finally, as is explained in the follow-ing sec on of this guidance, the De-partment recognizes the difficulty of iden fying CCA-treated wood separately from other forms of wood treated with copper-containing preserva ves. At this me there is no cost effec ve and
efficient method to specifically iden fy arsenic in treated wood. The only prac cal solu on to this dilemma at this me is to require the separa on of wood waste which can be reasonably assumed to be treated with preserva ves which might contain arsenic. Conse-quently, the advisory recommenda-ons and the BMPs in this docu-
ment will focus on managing all those forms of treated wood.1
1Wood treated with other chemicals such as pentachlorophenol and creosote, while perhaps posing different environmental concerns, is not addressed by this guidance document.
3. Overview and Applicability
4. How To Identify Treated Wood
There are several types of wood preserva ve chemicals. Water-borne preserva ves are dry to the touch and thus used almost exclu-sively for residen al applica ons. Right a er the 2004 phase-out the most common alterna ve for resi-den al applica ons was alkaline copper quat (ACQ) and copper bo-ron azole (CBA). Both of the early phase copper formula ons leached copper at a greater rate. Later gen-era on “micronized” preserva ves have since been developed which leach at slower rates. The most common alterna ves used today in residen al applica ons are mi-cronized copper quat (MCQ) and micronized copper azole (MCA).
Some wood in residen al applica-ons is also treated with borate
alone. Other chemicals have also been used to treat wood for indus-trial applica ons. For example, pen-tachlorophenol (PCP) has been used in the past for telephone poles, but is becoming less popular today. Creosote is used to treat rail-road es and some construc on pilings. Treated industrial wood products can typically be iden fied based upon their large dimensions (e.g., railroad es and u lity poles). Thus, they are easier to visually iden fy and then remove from the waste stream. Treated wood used in residen al applica ons, however, is largely composed of lumber, m-
bers and plywood in varying sizes and can be found in both treated and untreated forms. So how does one determine if these materials are treated? The most common method for iden fying treated wood among lumber, mber and plywood is to look at the color of the wood. Un-treated wood and borate-treated wood typically have a light yellow color. The yellow color is the natu-ral color of Southern Yellow Pine (SYP), the most common wood species used for building construc-on in Florida.
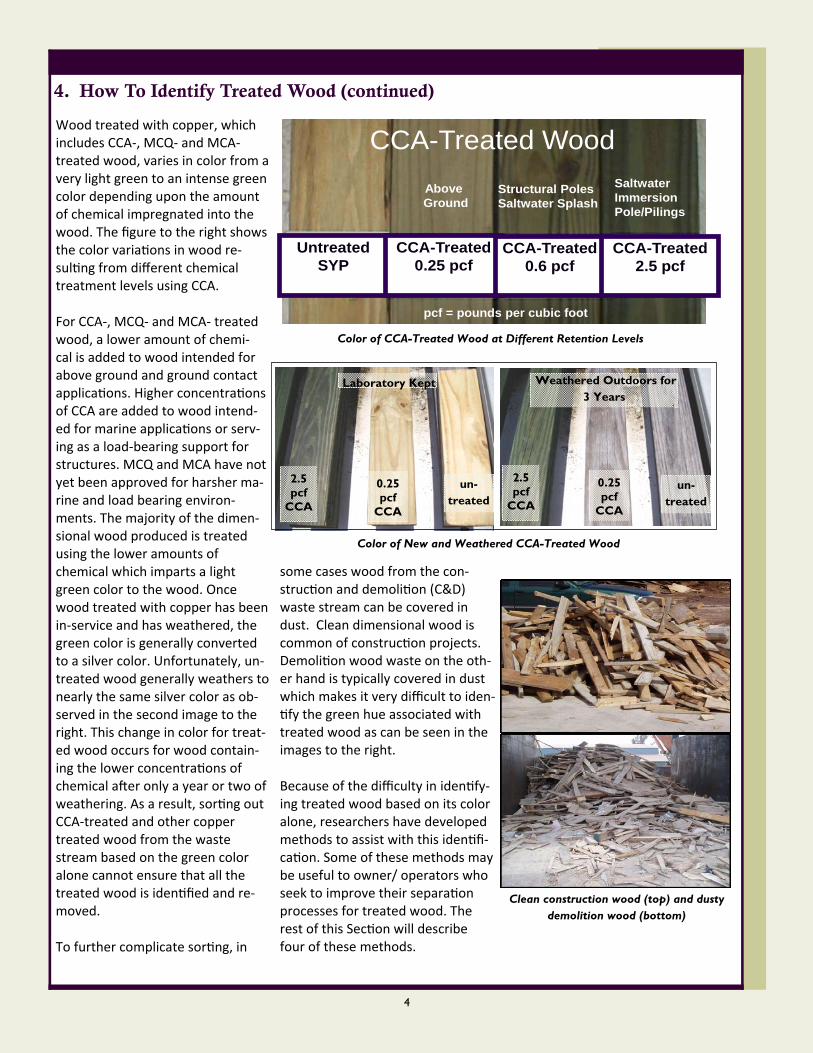
4
Wood treated with copper, which includes CCA-, MCQ- and MCA- treated wood, varies in color from a very light green to an intense green color depending upon the amount of chemical impregnated into the wood. The figure to the right shows the color varia ons in wood re-sul ng from different chemical treatment levels using CCA. For CCA-, MCQ- and MCA- treated wood, a lower amount of chemi-cal is added to wood intended for above ground and ground contact applica ons. Higher concentra ons of CCA are added to wood intend-ed for marine applica ons or serv-ing as a load-bearing support for structures. MCQ and MCA have not yet been approved for harsher ma-rine and load bearing environ-ments. The majority of the dimen-sional wood produced is treated using the lower amounts of chemical which imparts a light green color to the wood. Once wood treated with copper has been in-service and has weathered, the green color is generally converted to a silver color. Unfortunately, un-treated wood generally weathers to nearly the same silver color as ob-served in the second image to the right. This change in color for treat-ed wood occurs for wood contain-ing the lower concentra ons of chemical a er only a year or two of weathering. As a result, sor ng out CCA-treated and other copper treated wood from the waste stream based on the green color alone cannot ensure that all the treated wood is iden fied and re-moved. To further complicate sor ng, in
some cases wood from the con-struc on and demoli on (C&D) waste stream can be covered in dust. Clean dimensional wood is common of construc on projects. Demoli on wood waste on the oth-er hand is typically covered in dust which makes it very difficult to iden-fy the green hue associated with
treated wood as can be seen in the images to the right. Because of the difficulty in iden fy-ing treated wood based on its color alone, researchers have developed methods to assist with this iden fi-ca on. Some of these methods may be useful to owner/ operators who seek to improve their separa on processes for treated wood. The rest of this Sec on will describe four of these methods.
UntreatedSYP
CCA-Treated0.25 pcf
CCA-Treated0.6 pcf
Above Ground
Structural PolesSaltwater Splash
Saltwater ImmersionPole/Pilings
CCA-Treated Wood
CCA-Treated2.5 pcf
pcf = pounds per cubic foot
Color of CCA-Treated Wood at Different Retention Levels
Laboratory Kept
2.5 pcf
CCA
0.25 pcf
CCA
un-treated
Weathered Outdoors for 3 Years
2.5 pcf
CCA
0.25 pcf
CCA
un-treated
Color of New and Weathered CCA-Treated Wood
4. How To Identify Treated Wood (continued)
Clean construction wood (top) and dusty demolition wood (bottom)
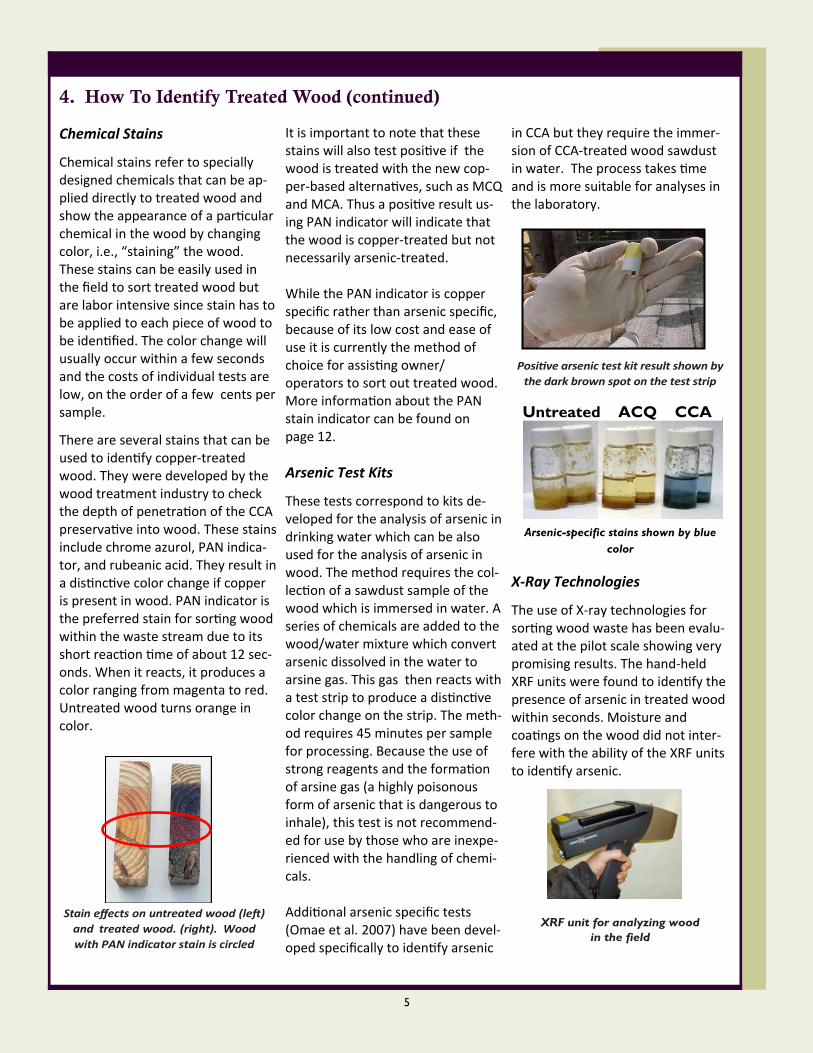
5
Chemical Stains
Chemical stains refer to specially designed chemicals that can be ap-plied directly to treated wood and show the appearance of a par cular chemical in the wood by changing color, i.e., “staining” the wood. These stains can be easily used in the field to sort treated wood but are labor intensive since stain has to be applied to each piece of wood to be iden fied. The color change will usually occur within a few seconds and the costs of individual tests are low, on the order of a few cents per sample.
There are several stains that can be used to iden fy copper-treated wood. They were developed by the wood treatment industry to check the depth of penetra on of the CCA preserva ve into wood. These stains include chrome azurol, PAN indica-tor, and rubeanic acid. They result in a dis nc ve color change if copper is present in wood. PAN indicator is the preferred stain for sor ng wood within the waste stream due to its short reac on me of about 12 sec-onds. When it reacts, it produces a color ranging from magenta to red. Untreated wood turns orange in color.
It is important to note that these stains will also test posi ve if the wood is treated with the new cop-per-based alterna ves, such as MCQ and MCA. Thus a posi ve result us-ing PAN indicator will indicate that the wood is copper-treated but not necessarily arsenic-treated. While the PAN indicator is copper specific rather than arsenic specific, because of its low cost and ease of use it is currently the method of choice for assis ng owner/operators to sort out treated wood. More informa on about the PAN stain indicator can be found on page 12.
Arsenic Test Kits
These tests correspond to kits de-veloped for the analysis of arsenic in drinking water which can be also used for the analysis of arsenic in wood. The method requires the col-lec on of a sawdust sample of the wood which is immersed in water. A series of chemicals are added to the wood/water mixture which convert arsenic dissolved in the water to arsine gas. This gas then reacts with a test strip to produce a dis nc ve color change on the strip. The meth-od requires 45 minutes per sample for processing. Because the use of strong reagents and the forma on of arsine gas (a highly poisonous form of arsenic that is dangerous to inhale), this test is not recommend-ed for use by those who are inexpe-rienced with the handling of chemi-cals. Addi onal arsenic specific tests (Omae et al. 2007) have been devel-oped specifically to iden fy arsenic
in CCA but they require the immer-sion of CCA-treated wood sawdust in water. The process takes me and is more suitable for analyses in the laboratory.
Posi ve arsenic test kit result shown by
the dark brown spot on the test strip
Arsenic-specific stains shown by blue color
X‐Ray Technologies
The use of X-ray technologies for sor ng wood waste has been evalu-ated at the pilot scale showing very promising results. The hand-held XRF units were found to iden fy the presence of arsenic in treated wood within seconds. Moisture and coa ngs on the wood did not inter-fere with the ability of the XRF units to iden fy arsenic.
XRF unit for analyzing wood
in the field
4. How To Identify Treated Wood (continued)
Stain effects on untreated wood (le )
and treated wood. (right). Wood
with PAN indicator stain is circled
Untreated ACQ CCA
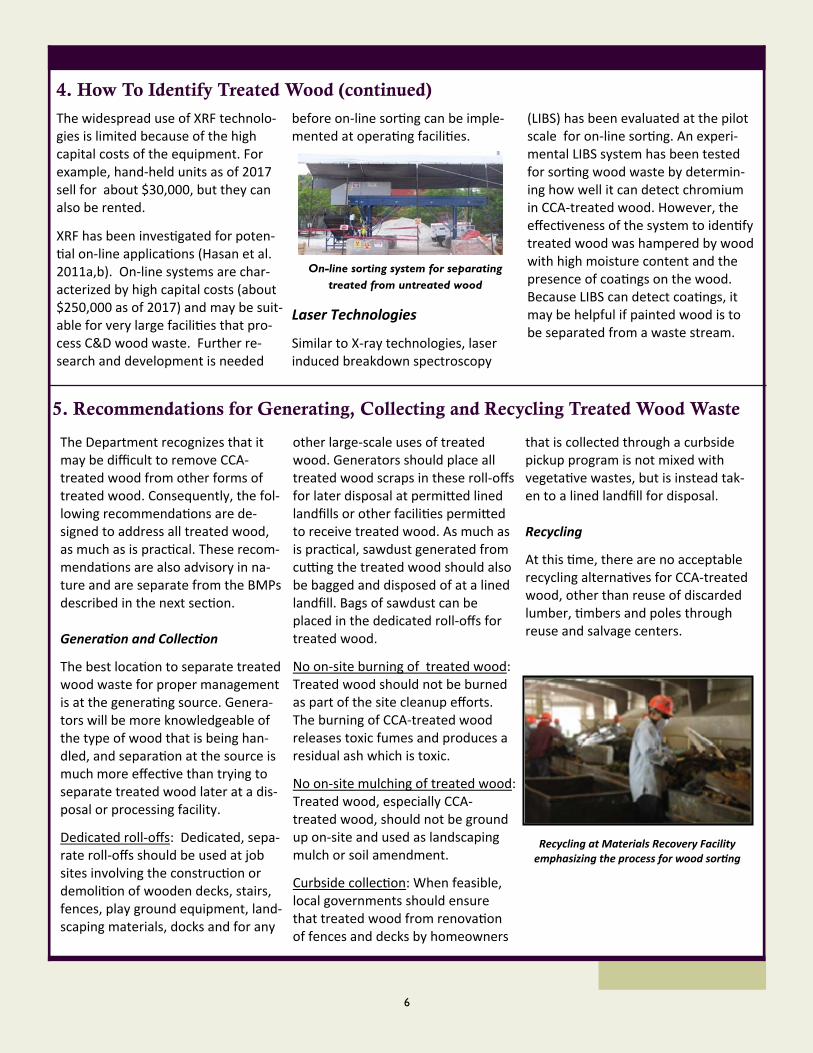
6
The widespread use of XRF technolo-gies is limited because of the high capital costs of the equipment. For example, hand-held units as of 2017 sell for about $30,000, but they can also be rented.
XRF has been inves gated for poten-al on-line applica ons (Hasan et al.
2011a,b). On-line systems are char-acterized by high capital costs (about $250,000 as of 2017) and may be suit-able for very large facili es that pro-cess C&D wood waste. Further re-search and development is needed
before on-line sor ng can be imple-mented at opera ng facili es.
On-line sorting system for separating treated from untreated wood
Laser Technologies
Similar to X-ray technologies, laser induced breakdown spectroscopy
(LIBS) has been evaluated at the pilot scale for on-line sor ng. An experi-mental LIBS system has been tested for sor ng wood waste by determin-ing how well it can detect chromium in CCA-treated wood. However, the effec veness of the system to iden fy treated wood was hampered by wood with high moisture content and the presence of coa ngs on the wood. Because LIBS can detect coa ngs, it may be helpful if painted wood is to be separated from a waste stream.
4. How To Identify Treated Wood (continued)
5. Recommendations for Generating, Collecting and Recycling Treated Wood Waste
The Department recognizes that it may be difficult to remove CCA-treated wood from other forms of treated wood. Consequently, the fol-lowing recommenda ons are de-signed to address all treated wood, as much as is prac cal. These recom-menda ons are also advisory in na-ture and are separate from the BMPs described in the next sec on. Genera on and Collec on
The best loca on to separate treated wood waste for proper management is at the genera ng source. Genera-tors will be more knowledgeable of the type of wood that is being han-dled, and separa on at the source is much more effec ve than trying to separate treated wood later at a dis-posal or processing facility.
Dedicated roll-offs: Dedicated, sepa-rate roll-offs should be used at job sites involving the construc on or demoli on of wooden decks, stairs, fences, play ground equipment, land-scaping materials, docks and for any
other large-scale uses of treated wood. Generators should place all treated wood scraps in these roll-offs for later disposal at permi ed lined landfills or other facili es permi ed to receive treated wood. As much as is prac cal, sawdust generated from cu ng the treated wood should also be bagged and disposed of at a lined landfill. Bags of sawdust can be placed in the dedicated roll-offs for treated wood.
No on-site burning of treated wood: Treated wood should not be burned as part of the site cleanup efforts. The burning of CCA-treated wood releases toxic fumes and produces a residual ash which is toxic.
No on-site mulching of treated wood: Treated wood, especially CCA-treated wood, should not be ground up on-site and used as landscaping mulch or soil amendment.
Curbside collec on: When feasible, local governments should ensure that treated wood from renova on of fences and decks by homeowners
that is collected through a curbside pickup program is not mixed with vegeta ve wastes, but is instead tak-en to a lined landfill for disposal. Recycling
At this me, there are no acceptable recycling alterna ves for CCA-treated wood, other than reuse of discarded lumber, mbers and poles through reuse and salvage centers.
Recycling at Materials Recovery Facility emphasizing the process for wood sor ng
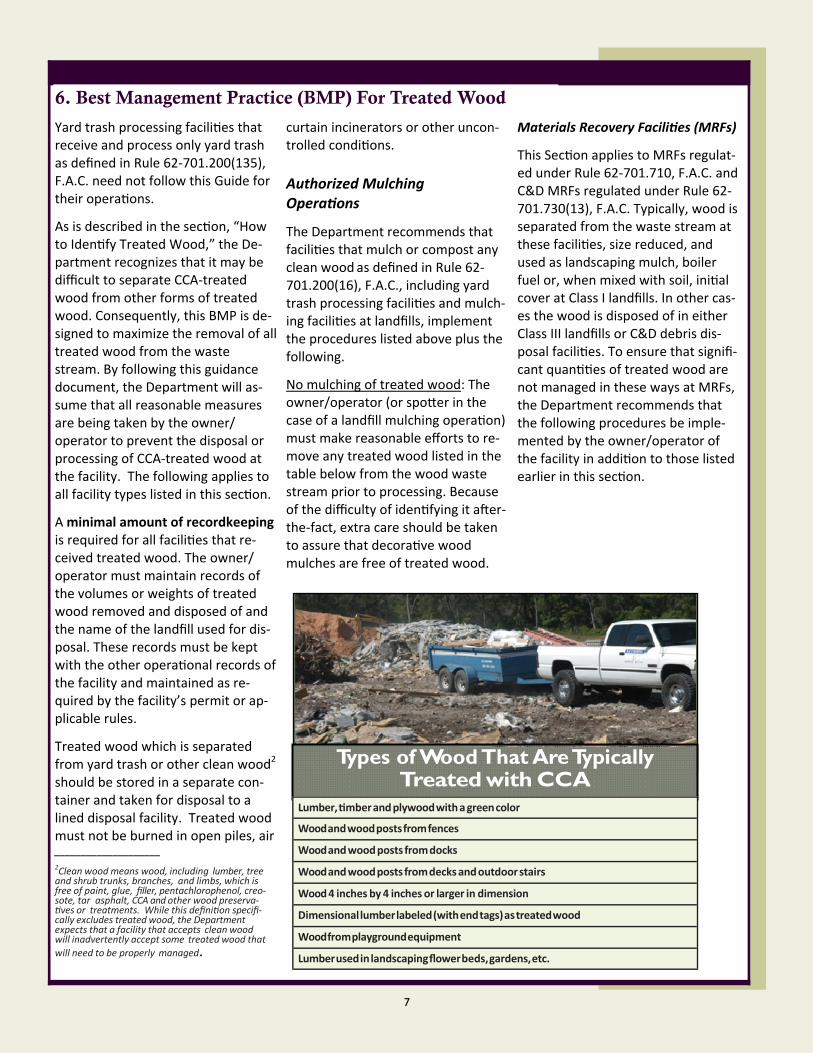
7
6. Best Management Practice (BMP) For Treated Wood
Yard trash processing facili es that receive and process only yard trash as defined in Rule 62-701.200(135), F.A.C. need not follow this Guide for their opera ons.
As is described in the sec on, “How to Iden fy Treated Wood,” the De-partment recognizes that it may be difficult to separate CCA-treated wood from other forms of treated wood. Consequently, this BMP is de-signed to maximize the removal of all treated wood from the waste stream. By following this guidance document, the Department will as-sume that all reasonable measures are being taken by the owner/operator to prevent the disposal or processing of CCA-treated wood at the facility. The following applies to all facility types listed in this sec on.
A minimal amount of recordkeeping is required for all facili es that re-ceived treated wood. The owner/operator must maintain records of the volumes or weights of treated wood removed and disposed of and the name of the landfill used for dis-posal. These records must be kept with the other opera onal records of the facility and maintained as re-quired by the facility’s permit or ap-plicable rules.
Treated wood which is separated from yard trash or other clean wood2
should be stored in a separate con-tainer and taken for disposal to a lined disposal facility. Treated wood must not be burned in open piles, air ____________________
2Clean wood means wood, including lumber, tree and shrub trunks, branches, and limbs, which is free of paint, glue, filler, pentachlorophenol, creo‐sote, tar asphalt, CCA and other wood preserva‐ves or treatments. While this defini on specifi‐
cally excludes treated wood, the Department expects that a facility that accepts clean wood will inadvertently accept some treated wood that
will need to be properly managed.
curtain incinerators or other uncon-trolled condi ons.
Authorized Mulching Opera ons
The Department recommends that facili es that mulch or compost any clean wood as defined in Rule 62-701.200(16), F.A.C., including yard trash processing facili es and mulch-ing facili es at landfills, implement the procedures listed above plus the following.
No mulching of treated wood: The owner/operator (or spo er in the case of a landfill mulching opera on) must make reasonable efforts to re-move any treated wood listed in the table below from the wood waste stream prior to processing. Because of the difficulty of iden fying it a er-the-fact, extra care should be taken to assure that decora ve wood mulches are free of treated wood.
Materials Recovery Facili es (MRFs)
This Sec on applies to MRFs regulat-ed under Rule 62-701.710, F.A.C. and C&D MRFs regulated under Rule 62- 701.730(13), F.A.C. Typically, wood is separated from the waste stream at these facili es, size reduced, and used as landscaping mulch, boiler fuel or, when mixed with soil, ini al cover at Class I landfills. In other cas-es the wood is disposed of in either Class III landfills or C&D debris dis-posal facili es. To ensure that signifi-cant quan es of treated wood are not managed in these ways at MRFs, the Department recommends that the following procedures be imple-mented by the owner/operator of the facility in addi on to those listed earlier in this sec on.
Types of Wood That Are Typically Treated with CCA
Lumber, mber and plywood with a green color
Wood and wood posts from fences
Wood and wood posts from docks
Wood and wood posts from decks and outdoor stairs
Wood 4 inches by 4 inches or larger in dimension
Dimensional lumber labeled (with end tags) as treated wood
Wood from playground equipment
Lumber used in landscaping flower beds, gardens, etc.
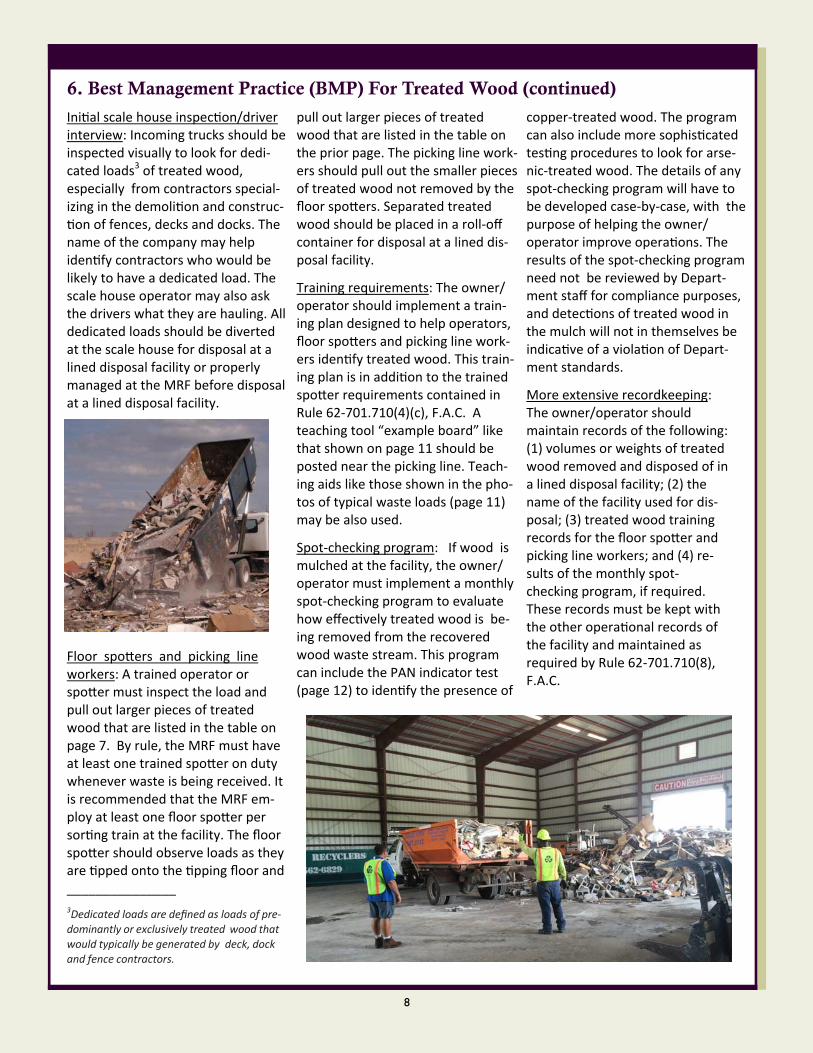
8
6. Best Management Practice (BMP) For Treated Wood (continued)
Ini al scale house inspec on/driver interview: Incoming trucks should be inspected visually to look for dedi-cated loads3 of treated wood, especially from contractors special-izing in the demoli on and construc-on of fences, decks and docks. The
name of the company may help iden fy contractors who would be likely to have a dedicated load. The scale house operator may also ask the drivers what they are hauling. All dedicated loads should be diverted at the scale house for disposal at a lined disposal facility or properly managed at the MRF before disposal at a lined disposal facility.
Floor spo ers and picking line workers: A trained operator or spo er must inspect the load and pull out larger pieces of treated wood that are listed in the table on page 7. By rule, the MRF must have at least one trained spo er on duty whenever waste is being received. It is recommended that the MRF em-ploy at least one floor spo er per sor ng train at the facility. The floor spo er should observe loads as they are pped onto the pping floor and _______________
3Dedicated loads are defined as loads of pre‐dominantly or exclusively treated wood that would typically be generated by deck, dock and fence contractors.
pull out larger pieces of treated wood that are listed in the table on the prior page. The picking line work-ers should pull out the smaller pieces of treated wood not removed by the floor spo ers. Separated treated wood should be placed in a roll-off container for disposal at a lined dis-posal facility.
Training requirements: The owner/ operator should implement a train-ing plan designed to help operators, floor spo ers and picking line work-ers iden fy treated wood. This train-ing plan is in addi on to the trained spo er requirements contained in Rule 62-701.710(4)(c), F.A.C. A teaching tool “example board” like that shown on page 11 should be posted near the picking line. Teach-ing aids like those shown in the pho-tos of typical waste loads (page 11) may be also used. Spot-checking program: If wood is mulched at the facility, the owner/ operator must implement a monthly spot-checking program to evaluate how effec vely treated wood is be-ing removed from the recovered wood waste stream. This program can include the PAN indicator test (page 12) to iden fy the presence of
copper-treated wood. The program can also include more sophis cated tes ng procedures to look for arse-nic-treated wood. The details of any spot-checking program will have to be developed case-by-case, with the purpose of helping the owner/operator improve opera ons. The results of the spot-checking program need not be reviewed by Depart-ment staff for compliance purposes, and detec ons of treated wood in the mulch will not in themselves be indica ve of a viola on of Depart-ment standards.
More extensive recordkeeping: The owner/operator should maintain records of the following: (1) volumes or weights of treated wood removed and disposed of in a lined disposal facility; (2) the name of the facility used for dis-posal; (3) treated wood training records for the floor spo er and picking line workers; and (4) re-sults of the monthly spot-checking program, if required. These records must be kept with the other opera onal records of the facility and maintained as required by Rule 62-701.710(8), F.A.C.
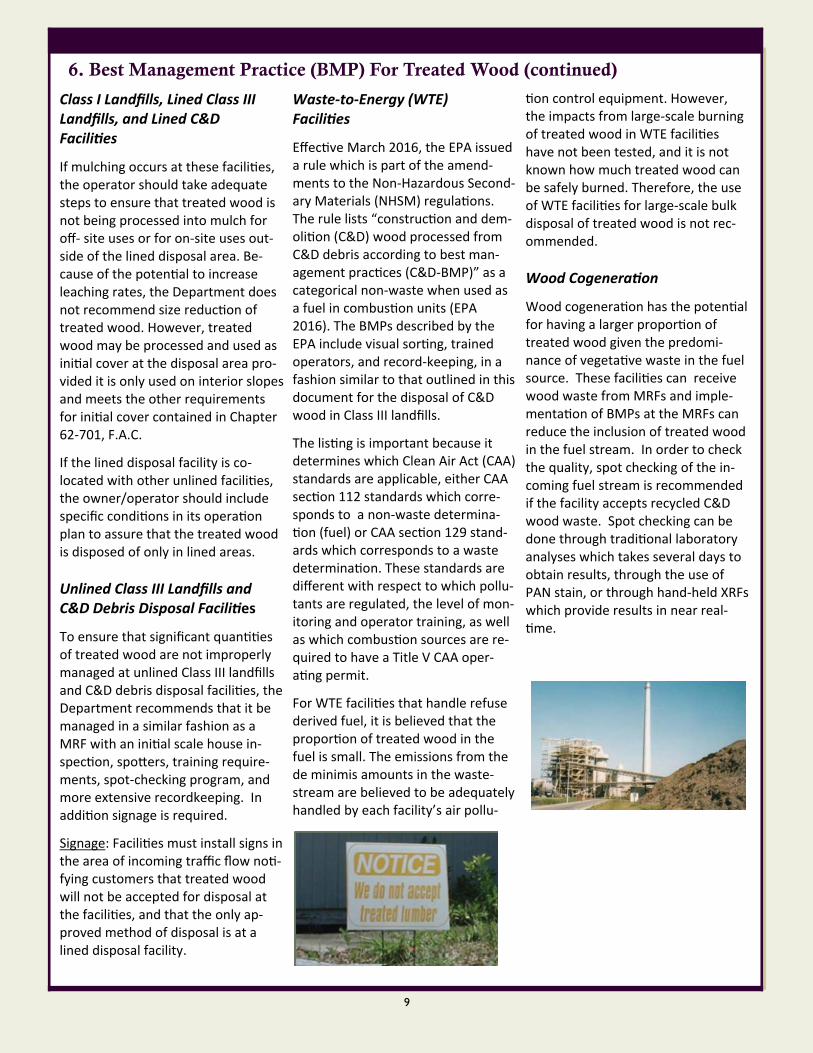
9
6. Best Management Practice (BMP) For Treated Wood (continued)
Class I Landfills, Lined Class III Landfills, and Lined C&D Facili es
If mulching occurs at these facili es, the operator should take adequate steps to ensure that treated wood is not being processed into mulch for off- site uses or for on-site uses out-side of the lined disposal area. Be-cause of the poten al to increase leaching rates, the Department does not recommend size reduc on of treated wood. However, treated wood may be processed and used as ini al cover at the disposal area pro-vided it is only used on interior slopes and meets the other requirements for ini al cover contained in Chapter 62-701, F.A.C.
If the lined disposal facility is co-located with other unlined facili es, the owner/operator should include specific condi ons in its opera on plan to assure that the treated wood is disposed of only in lined areas.
Unlined Class III Landfills and C&D Debris Disposal Facili es
To ensure that significant quan es of treated wood are not improperly managed at unlined Class III landfills and C&D debris disposal facili es, the Department recommends that it be managed in a similar fashion as a MRF with an ini al scale house in-spec on, spo ers, training require-ments, spot-checking program, and more extensive recordkeeping. In addi on signage is required.
Signage: Facili es must install signs in the area of incoming traffic flow no -fying customers that treated wood will not be accepted for disposal at the facili es, and that the only ap-proved method of disposal is at a lined disposal facility.
Waste‐to‐Energy (WTE) Facili es
Effec ve March 2016, the EPA issued a rule which is part of the amend-ments to the Non-Hazardous Second-ary Materials (NHSM) regula ons. The rule lists “construc on and dem-oli on (C&D) wood processed from C&D debris according to best man-agement prac ces (C&D-BMP)” as a categorical non-waste when used as a fuel in combus on units (EPA 2016). The BMPs described by the EPA include visual sor ng, trained operators, and record-keeping, in a fashion similar to that outlined in this document for the disposal of C&D wood in Class III landfills. The lis ng is important because it determines which Clean Air Act (CAA) standards are applicable, either CAA sec on 112 standards which corre-sponds to a non-waste determina-on (fuel) or CAA sec on 129 stand-
ards which corresponds to a waste determina on. These standards are different with respect to which pollu-tants are regulated, the level of mon-itoring and operator training, as well as which combus on sources are re-quired to have a Title V CAA oper-a ng permit.
For WTE facili es that handle refuse derived fuel, it is believed that the propor on of treated wood in the fuel is small. The emissions from the de minimis amounts in the waste-stream are believed to be adequately handled by each facility’s air pollu-
on control equipment. However, the impacts from large-scale burning of treated wood in WTE facili es have not been tested, and it is not known how much treated wood can be safely burned. Therefore, the use of WTE facili es for large-scale bulk disposal of treated wood is not rec-ommended.
Wood Cogenera on
Wood cogenera on has the poten al for having a larger propor on of treated wood given the predomi-nance of vegeta ve waste in the fuel source. These facili es can receive wood waste from MRFs and imple-menta on of BMPs at the MRFs can reduce the inclusion of treated wood in the fuel stream. In order to check the quality, spot checking of the in-coming fuel stream is recommended if the facility accepts recycled C&D wood waste. Spot checking can be done through tradi onal laboratory analyses which takes several days to obtain results, through the use of PAN stain, or through hand-held XRFs which provide results in near real-me.
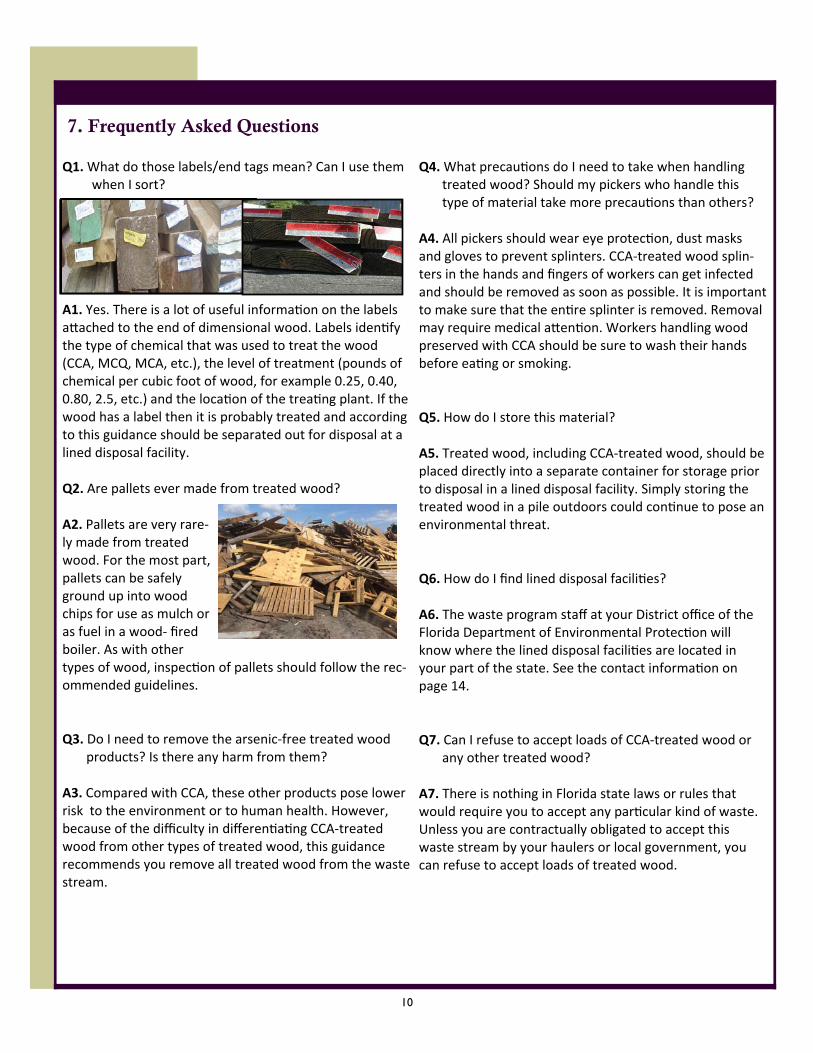
10
7. Frequently Asked Questions
Q1. What do those labels/end tags mean? Can I use them when I sort?
A1. Yes. There is a lot of useful informa on on the labels a ached to the end of dimensional wood. Labels iden fy the type of chemical that was used to treat the wood (CCA, MCQ, MCA, etc.), the level of treatment (pounds of chemical per cubic foot of wood, for example 0.25, 0.40, 0.80, 2.5, etc.) and the loca on of the trea ng plant. If the wood has a label then it is probably treated and according to this guidance should be separated out for disposal at a lined disposal facility. Q2. Are pallets ever made from treated wood? A2. Pallets are very rare-ly made from treated wood. For the most part, pallets can be safely ground up into wood chips for use as mulch or as fuel in a wood- fired boiler. As with other types of wood, inspec on of pallets should follow the rec-ommended guidelines. Q3. Do I need to remove the arsenic-free treated wood
products? Is there any harm from them? A3. Compared with CCA, these other products pose lower risk to the environment or to human health. However, because of the difficulty in differen a ng CCA-treated wood from other types of treated wood, this guidance recommends you remove all treated wood from the waste stream.
Q4. What precau ons do I need to take when handling treated wood? Should my pickers who handle this type of material take more precau ons than others?
A4. All pickers should wear eye protec on, dust masks and gloves to prevent splinters. CCA-treated wood splin-ters in the hands and fingers of workers can get infected and should be removed as soon as possible. It is important to make sure that the en re splinter is removed. Removal may require medical a en on. Workers handling wood preserved with CCA should be sure to wash their hands before ea ng or smoking. Q5. How do I store this material? A5. Treated wood, including CCA-treated wood, should be placed directly into a separate container for storage prior to disposal in a lined disposal facility. Simply storing the treated wood in a pile outdoors could con nue to pose an environmental threat. Q6. How do I find lined disposal facili es? A6. The waste program staff at your District office of the Florida Department of Environmental Protec on will know where the lined disposal facili es are located in your part of the state. See the contact informa on on page 14. Q7. Can I refuse to accept loads of CCA-treated wood or
any other treated wood? A7. There is nothing in Florida state laws or rules that would require you to accept any par cular kind of waste. Unless you are contractually obligated to accept this waste stream by your haulers or local government, you can refuse to accept loads of treated wood.
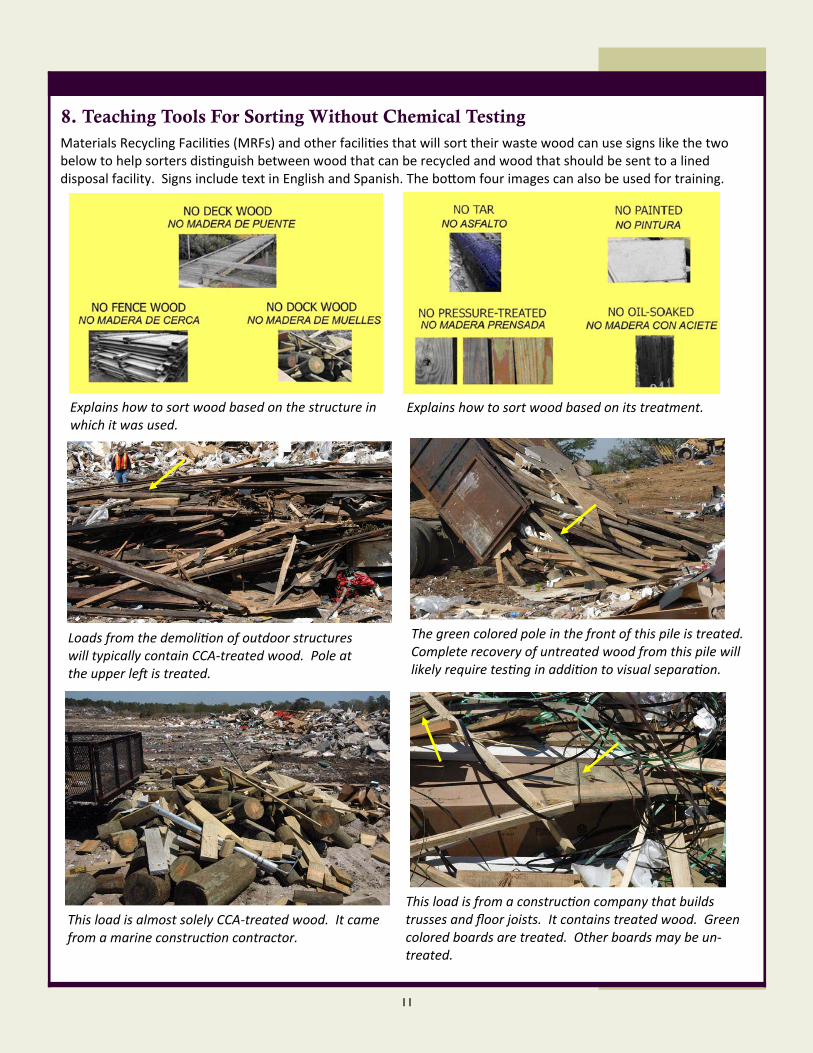
11
8. Teaching Tools For Sorting Without Chemical Testing
Materials Recycling Facili es (MRFs) and other facili es that will sort their waste wood can use signs like the two below to help sorters dis nguish between wood that can be recycled and wood that should be sent to a lined disposal facility. Signs include text in English and Spanish. The bo om four images can also be used for training.
Loads from the demoli on of outdoor structures will typically contain CCA‐treated wood. Pole at the upper le is treated.
The green colored pole in the front of this pile is treated. Complete recovery of untreated wood from this pile will likely require tes ng in addi on to visual separa on.
This load is almost solely CCA‐treated wood. It came from a marine construc on contractor.
This load is from a construc on company that builds trusses and floor joists. It contains treated wood. Green colored boards are treated. Other boards may be un‐treated.
Explains how to sort wood based on the structure in which it was used.
Explains how to sort wood based on its treatment.
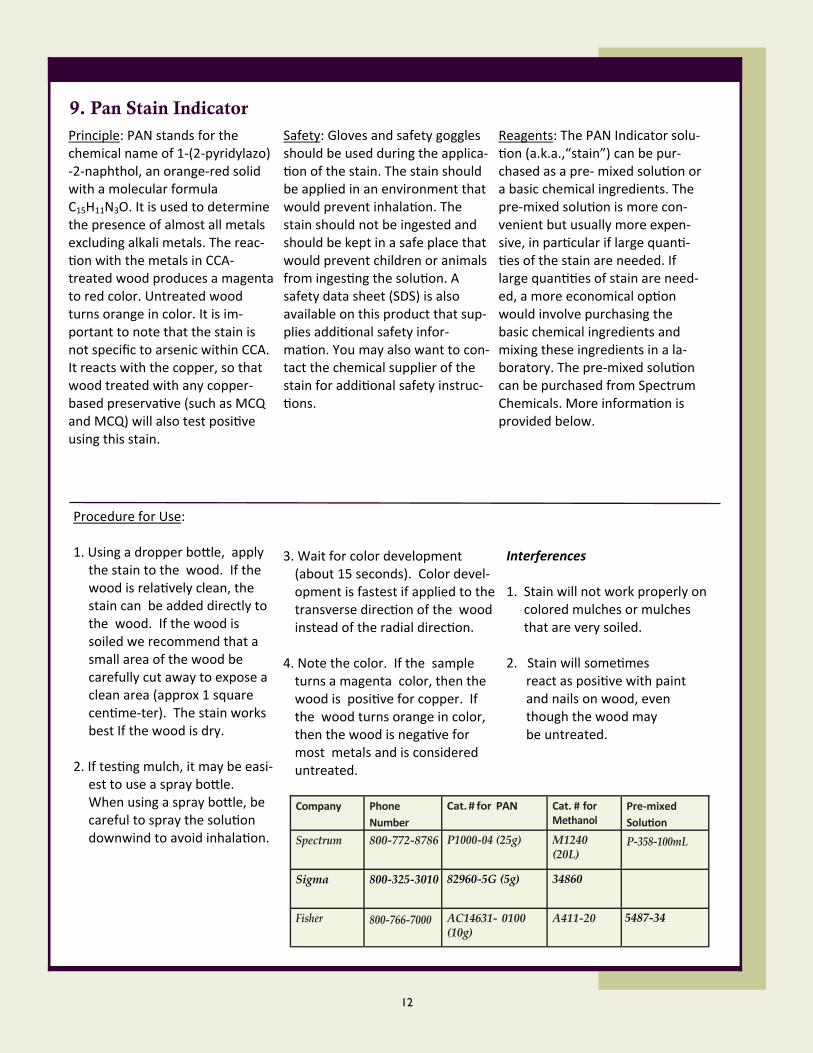
12
Principle: PAN stands for the chemical name of 1-(2-pyridylazo)-2-naphthol, an orange-red solid with a molecular formula C15H11N3O. It is used to determine the presence of almost all metals excluding alkali metals. The reac-on with the metals in CCA-
treated wood produces a magenta to red color. Untreated wood turns orange in color. It is im-portant to note that the stain is not specific to arsenic within CCA. It reacts with the copper, so that wood treated with any copper- based preserva ve (such as MCQ and MCQ) will also test posi ve using this stain.
Safety: Gloves and safety goggles should be used during the applica-on of the stain. The stain should
be applied in an environment that would prevent inhala on. The stain should not be ingested and should be kept in a safe place that would prevent children or animals from inges ng the solu on. A safety data sheet (SDS) is also available on this product that sup-plies addi onal safety infor-ma on. You may also want to con-tact the chemical supplier of the stain for addi onal safety instruc-ons.
Reagents: The PAN Indicator solu-on (a.k.a.,“stain”) can be pur-
chased as a pre- mixed solu on or a basic chemical ingredients. The pre-mixed solu on is more con-venient but usually more expen-sive, in par cular if large quan -es of the stain are needed. If
large quan es of stain are need-ed, a more economical op on would involve purchasing the basic chemical ingredients and mixing these ingredients in a la-boratory. The pre-mixed solu on can be purchased from Spectrum Chemicals. More informa on is provided below.
9. Pan Stain Indicator
Procedure for Use: 1. Using a dropper bo le, apply
the stain to the wood. If the wood is rela vely clean, the stain can be added directly to the wood. If the wood is soiled we recommend that a small area of the wood be carefully cut away to expose a clean area (approx 1 square cen me-ter). The stain works best If the wood is dry.
2. If tes ng mulch, it may be easi-
est to use a spray bo le. When using a spray bo le, be careful to spray the solu on downwind to avoid inhala on.
3. Wait for color development (about 15 seconds). Color devel-opment is fastest if applied to the transverse direc on of the wood instead of the radial direc on.
4. Note the color. If the sample turns a magenta color, then the wood is posi ve for copper. If the wood turns orange in color, then the wood is nega ve for most metals and is considered untreated.
Interferences 1. Stain will not work properly on
colored mulches or mulches that are very soiled.
2. Stain will some mes react as posi ve with paint and nails on wood, even though the wood may be untreated.
Company Phone
Number Cat. # for PAN Cat. # for
Methanol Pre‐mixed
Solu on Spectrum 800‐772‐8786 P1000‐04 (25g) M1240
(20L) P‐358‐100mL
Fisher 800‐766‐7000 AC14631‐ 0100 (10g)
A411‐20 5487‐34
Sigma 800‐325‐3010 82960‐5G (5g) 34860
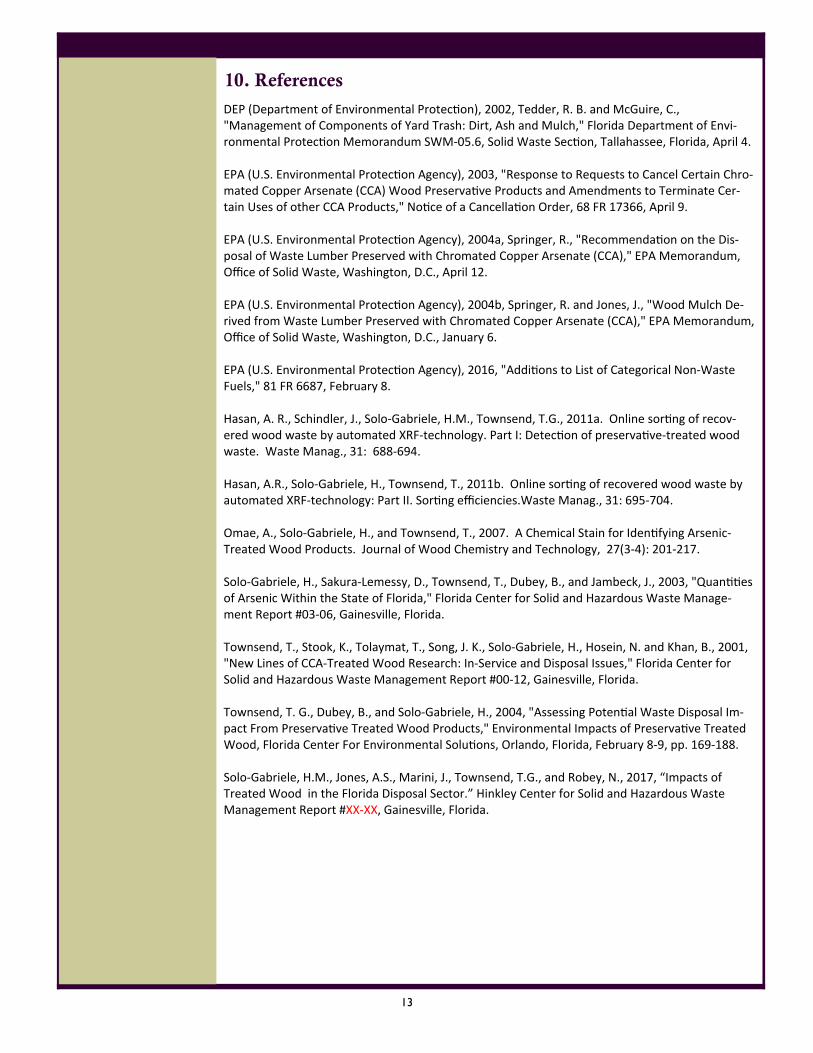
13
DEP (Department of Environmental Protec on), 2002, Tedder, R. B. and McGuire, C., "Management of Components of Yard Trash: Dirt, Ash and Mulch," Florida Department of Envi-ronmental Protec on Memorandum SWM-05.6, Solid Waste Sec on, Tallahassee, Florida, April 4. EPA (U.S. Environmental Protec on Agency), 2003, "Response to Requests to Cancel Certain Chro-mated Copper Arsenate (CCA) Wood Preserva ve Products and Amendments to Terminate Cer-tain Uses of other CCA Products," No ce of a Cancella on Order, 68 FR 17366, April 9. EPA (U.S. Environmental Protec on Agency), 2004a, Springer, R., "Recommenda on on the Dis-posal of Waste Lumber Preserved with Chromated Copper Arsenate (CCA)," EPA Memorandum, Office of Solid Waste, Washington, D.C., April 12. EPA (U.S. Environmental Protec on Agency), 2004b, Springer, R. and Jones, J., "Wood Mulch De-rived from Waste Lumber Preserved with Chromated Copper Arsenate (CCA)," EPA Memorandum, Office of Solid Waste, Washington, D.C., January 6. EPA (U.S. Environmental Protec on Agency), 2016, "Addi ons to List of Categorical Non-Waste Fuels," 81 FR 6687, February 8. Hasan, A. R., Schindler, J., Solo-Gabriele, H.M., Townsend, T.G., 2011a. Online sor ng of recov-ered wood waste by automated XRF-technology. Part I: Detec on of preserva ve-treated wood waste. Waste Manag., 31: 688-694. Hasan, A.R., Solo-Gabriele, H., Townsend, T., 2011b. Online sor ng of recovered wood waste by automated XRF-technology: Part II. Sor ng efficiencies.Waste Manag., 31: 695-704. Omae, A., Solo-Gabriele, H., and Townsend, T., 2007. A Chemical Stain for Iden fying Arsenic-Treated Wood Products. Journal of Wood Chemistry and Technology, 27(3-4): 201-217. Solo-Gabriele, H., Sakura-Lemessy, D., Townsend, T., Dubey, B., and Jambeck, J., 2003, "Quan es of Arsenic Within the State of Florida," Florida Center for Solid and Hazardous Waste Manage-ment Report #03-06, Gainesville, Florida. Townsend, T., Stook, K., Tolaymat, T., Song, J. K., Solo-Gabriele, H., Hosein, N. and Khan, B., 2001, "New Lines of CCA-Treated Wood Research: In-Service and Disposal Issues," Florida Center for Solid and Hazardous Waste Management Report #00-12, Gainesville, Florida. Townsend, T. G., Dubey, B., and Solo-Gabriele, H., 2004, "Assessing Poten al Waste Disposal Im-pact From Preserva ve Treated Wood Products," Environmental Impacts of Preserva ve Treated Wood, Florida Center For Environmental Solu ons, Orlando, Florida, February 8-9, pp. 169-188. Solo-Gabriele, H.M., Jones, A.S., Marini, J., Townsend, T.G., and Robey, N., 2017, “Impacts of Treated Wood in the Florida Disposal Sector.” Hinkley Center for Solid and Hazardous Waste Management Report #XX-XX, Gainesville, Florida.
10. References
14
FDEP District Offices Northwest District Office 160 W. Government Street Suite 308 Pensacola, FL 32502 (850) 595-8300 South District Office P.O. Box 2549 Fort Myers, FL 33902 (239) 344-5600 Northeast District Office 8800 Baymeadows Way West Suite 100 Jacksonville, FL 32256 (904) 256-1700
Central District Office 3319 Maguire Boulevard, Suite 232 Orlando, FL 32803 (407) 897-4100 Southeast District Office 3301 Gun Club Road, MSC7210-1 West Palm Beach, FL 33406 (561) 681-6600 Southwest District Office 13051 N Telecom Parkway Temple Terrace, FL 33637 (813) 470-5700
11. Florida Department of Environmental Protection Districts
This book is dedicated to the memory of
William W. (Bill) Hinkley 1945-2005
The waste program staff at your District office of the Florida Department of Environmental Protec-on can provide addi onal informa on including a
list of lined disposal facili es that are located in your area of the state. The appropriate contacts and District boundaries are shown below.
Additional information on CCA-treated wood can be found at the Hinkley Center for
Solid and Hazardous Waste Management’s website for CCA research: www.ccaresearch.org.
DISCLAIMER. The information contained in this document is intended for guidance only. It is not a rule and does not create any standards or criteria which must be followed by the regu-lated community. While the management of treated wood in accordance with this guidance is not expected to result in con-tamination of ground water or surface water or to pose a sig-nificant threat to human health, compliance with this document does not relieve the owner or operator from the responsibility for complying with the Department’s rules nor from any liabil-ity for environmental damages caused by the management of these materials.
FDEP Informa on Line, Tallahassee Phone: (800) 741-4DEP Fax: (850) 245-8810 FDEP Headquarters 2600 Blair Stone Road Tallahassee, FL 32399-2400 h p://www.dep.state.fl.us/waste/