impacts of traffic restrictions and infrastructure - CEDIK
46
Final Technical Report TNW2009-06 IMPACTS OF TRAFFIC RESTRICTIONS AND INFRASTRUCTURE IMPROVEMENTS ON DOWNTOWN PEAK HOUR CONGESTION: A SYNCHRO ANALYSIS FOR BELLEVUE, WASHINGTON Chris Masek, P.E. Nancy Nihan, Ph.D. Department of Civil and Environmental Engineering University of Washington Seattle, WA 98195 A report prepared for Transportation Northwest (TransNow) University of Washington 135 More Hall, Box 352700 Seattle, Washington 98195-2700 August 2009
Transcript of impacts of traffic restrictions and infrastructure - CEDIK

Final Technical Report
TNW2009-06
IMPACTS OF TRAFFIC RESTRICTIONS AND INFRASTRUCTURE IMPROVEMENTS ON DOWNTOWN PEAK HOUR CONGESTION: A SYNCHRO ANALYSIS FOR BELLEVUE,
WASHINGTON
Chris Masek, P.E. Nancy Nihan, Ph.D.
Department of Civil and Environmental Engineering University of Washington
Seattle, WA 98195
A report prepared for
Transportation Northwest (TransNow) University of Washington
135 More Hall, Box 352700 Seattle, Washington 98195-2700
August 2009

Masek, Nihan 2
DISCLAIMER
The contents of this report reflect the views of the authors, who are responsible for the facts and the
accuracy of the information presented herein. This document disseminated through the
Transportation Northwest (TransNow) Regional University Transportation Center under the
sponsorship of the Department of Transportation University Transportation Centers Program, in the
interest of information exchange. The U.S. Government assumes no liability for the contents or use
thereof.

Masek, Nihan 3
ABSTRACT
As urban areas continue to grow and demand on city streets increases, cities like
Bellevue, Washington are looking for new and innovative ways to reduce vehicle delays and
travel times. Downtown areas pose a particular challenge due to limited rights-of-way for
roadway expansion, increased numbers of pedestrians, and the need to balance the interests of
business owners and homeowners with trip-makers. This study evaluated the benefits and
negative impacts of small-scale control and infrastructure improvements on PM peak hour traffic
in downtown Bellevue. The performance measures used for evaluation were intersection
stopped delays. Bellevue’s downtown street network was modeled, using Synchro software
(Husch 2004) for the 2007 base network and for four alternative scenarios in the year 2017. The
future alternatives investigated included the 2017 base, which assumed no changes except for the
expected traffic growth and the re-optimization of the signal timing plan, plus three alternatives
that included peak hour traffic control restrictions and/or spot infrastructure improvements.
The results showed that locations with new turn restrictions experienced significant
reductions in intersection delay, while nearby intersections without such restrictions experienced
greater delays. For intersections on street corridors that were currently under-used, this type of
trade-off, made more effective use of the entire street network. The authors learned that the most
aggressive approach to turn restrictions combined with some infrastructure improvements
yielded the best results. A reasonable balance of feasible infrastructure improvements appeared
to be necessary for turn restrictions to work effectively in congested downtown networks.

Masek, Nihan 4
I. INTRODUCTION AND BACKGROUND
A. Background
The City of Bellevue, Washington, which is located within the Seattle Metropolitan area,
is experiencing increasing traffic congestion with few realistic alternatives for capacity
improvements to its signalized street network. During the last 5 years, the downtown Bellevue
area has experienced a significant amount of growth in office, retail and residential space ,and its
current population of over 120,000 (US Census Bureau, July 2008) is steadily increasing.
As the downtown area continues to grow and more people live downtown, additional
demand will be placed on the existing street network. Major expansion of the street network is
not an option due to limited rights-of-way and new buildings that have been constructed with
little or no setbacks from the rights-of-way. Spot intersection improvements and limited amounts
of road widening have been programmed into the City’s Capital Investment Program (CIP).
Most of the projects will be constructed in the next 10-15 years. Even with the CIP project
improvements, forecasting models have shown that many of downtown Bellevue’s intersections
will not meet concurrency requirements and will have significant increases in intersection delays
in the years 2017, 2020 and beyond. Additional non-construction options must be considered in
tandem with the CIP improvements to help alleviate the problem
In order to address future demand and delay issues in downtown Bellevue, the City has
considered a couple of alternatives in lieu of traditional infrastructure improvements. The City
previously looked at converting two streets, 106th Avenue NE and 108th Ave NE to a one-way
couplet (Figure 1). The analysis of this alternative showed no significant improvement in
intersection delays or corridor travel times for the year 2017 or 2020. However, the one-way
couplet solution may prove to be beneficial in the years beyond 2020 or 2030, depending on how
downtown Bellevue grows and traffic patterns change in future years.
Another alternative that was considered but not yet analyzed was restricting left turns at
select intersections in downtown Bellevue during the PM peak traffic hours of 4 pm to 6 pm.
This paper describes an investigation of the potential use of this traffic management option along

Masek, Nihan 5
with the planned capital spot improvements and evaluates their combined expected impacts, both
negative and positive.
Figure 1: Vicinity Map of Study Area (Downtown Bellevue)

Masek, Nihan 6
B. Goals and Objectives
This research study explored the possible benefits and negative impacts of restricting left
turns at selected signalized intersections in downtown Bellevue during the PM peak traffic
period in conjunction with planned minor capital improvements. The Synchro software package
version 6 (Husch 2004) was used to evaluate the effectiveness of this combined traffic
control/capacity enhanced option.
The study area for this research was bound by four major streets: NE 12th St, Bellevue
Way NE, Main St, and 112th Ave NE (Figure 1). The goal of this study was to determine
whether restricting turn movements and/or making spot infrastructure improvements would
significantly improve delays for individual intersections and improve the overall travel times on
heavily traveled streets within the study area. Several alternatives were considered to test the
effectiveness of this traffic management/street widening option. Significant improvement in
delays was defined as a decrease in delay per intersection of at least one LOS letter for
intersections currently experiencing a base condition of LOS E or F during the peak hour. The
objective was to reduce delays at the intersections currently experiencing the highest delays
without significantly degrading the LOS at surrounding intersections.
II. LITERATURE REVIEW
A review of the literature on signal operations in urban areas was performed to provide
the authors with a general understanding of the existing body of research on this topic and a
more specific understanding of the techniques and measures of effectiveness (MOEs) used to
calibrate Synchro Models. No publications on the topic of restricting left turns in downtown
areas were found, and only a few covered simulation model calibration techniques. Most of the
publications that discussed calibration techniques described the selected MOEs used to calibrate
their model, but neglected to give detailed descriptions and justifications of the model parameters
that were changed to obtain outputs consistent with these MOEs.
Park et al. (2006), was one of the few publications that discussed and emphasized the
importance of model calibration and provided techniques for modeling signalized systems.

Masek, Nihan 7
Although the authors’ research investigated an actuated signal system and, therefore, their
models used actuated signal timing plans, unlike the semi-actuated signals used by the City of
Bellevue, their calibration approach was still relevant. To calibrate and validate their models,
Park, et al. used travel time data collected from video cameras that tracked license plates. The
authors also used queue length data to calibrate their model.
Sadek (2004) discussed the use of macro and micro simulation models at signalized
intersections in inclement weather conditions. The parameters that were adjusted for model
calibration included driver types, driver startup lost times, queue discharge rates, average car
speeds between links, and queue lengths. The author used average delay time as a measure of
effectiveness for calibrating the traffic simulation models. Some of the other calibrating
parameters Sadek mentions are not applicable to Synchro since his study used both CORSIM and
Synchro modeling programs.
Riniker et al. (2008) discusses calibration of Synchro models in a paper on signal timing
optimization for the City of Baltimore. In order to calibrate the model, the author collected both
travel time and delay data. The validation methods used focused on adjusting the Synchro model
to match the travel times for certain corridors which proved to be effective according to the
author. The author did not provide any specific information on the parameters that were adjusted
to calibrate the Synchro model.
Washburn (2002) compared signalized delay estimation results for Transyt-7F, Synchro,
and HCS. Each program calculates signal delay differently. Travel time data was collected and
used as the baseline comparison MOE to calibrate each of the models for this study. Of the three
models analyzed, the Synchro model estimated the highest delay for 2 of the 3 intersections
studied.
Schroeder (2006) investigated the interaction of pedestrians and vehicles at unsignalized
intersections using a VISSIM microscopic model. The performance measures used as the target
MOEs for model calibration included pedestrian delay, vehicle delay, and the likelihood of
vehicle- pedestrian collisions. The interaction between pedestrians and vehicles is not always

Masek, Nihan 8
accounted for in models and could potentially have a significant impact on intersection delays.
The author did not have the opportunity to calibrate his model and planned to perform the
calibration as part of future research.
III. RESEARCH APPROACH
A. 2007 Base Model Development
Setting up the Synchro model for the downtown Bellevue study was a multi-step process.
The City’s existing Synchro model was used as the platform for creating the 2007 base model.
The City-provided Synchro model included the City of Bellevue’s entire street network with
signalized intersections, timing plans, lane widths and 2006 traffic volumes.
To develop the current study’s base 2007 model, the traffic volume data in the older
Synchro model was updated with the most recent PM peak hour traffic counts from the 2007
City of Bellevue Transportation Data Book (2008). Most of the intersection data in that most
recent traffic data book were counted in 2007. The model was also updated with the City’s most
current pedestrian count information. The City of Bellevue conducts pedestrian and bicycle
counts when vehicle volume and turning movement counts are taken for signalized intersections
every year. The pedestrian count data are typically measured for the entire 2-hour traffic study
period and are not broken down into a peak hour. Since the Synchro model developed by the
City only modeled the peak hour, all pedestrian volumes from these counts were divided in half
for input to the updated model.
Two new signalized intersections, Bellevue Way and NE 7th St and NE 8th St and 105th
Ave NE that were added to the traffic signal network within the last three years were also
included in the updated base model. Since no traffic volume data had previously been collected
for these intersections, traffic volumes for the two newly signalized intersections were
approximated based on volume balancing data outputs from the Synchro Model for key adjacent
intersections. Consequently, the new intersection volumes were properly balanced with the
traffic volumes at the intersections of Bellevue Way and NE 8th St, Bellevue Way and NE 6th St,
and NE 8th St and 106th Ave NE. After updating the Synchro model with the 2007 data, the
model was calibrated to create the final 2007 base model.

Masek, Nihan 9
B. Data Collection and 2007 Base Model Calibration/Verification
Model calibration is the process of making model adjustments that result in a reasonable
match between model outputs and observed conditions for the existing system. The model must
be able to simulate actual field-measured conditions before it can be used to predict future
conditions that may result from future changes in traffic patterns and/or system improvements.
Data Collection: Field data collection was required to compare the Synchro model outputs for
the existing 2007 system with real world conditions. Intersection delays were selected as the
MOEs for the calibration because these data are key measures for evaluating system performance
and because delay studies are quick and easy to conduct. Other traffic studies that would have
been helpful for developing additional performance measures for calibrating the model included
saturation flow studies, corridor travel time studies, and queue studies. Unfortunately, there was
not enough time or resources to conduct these additional studies.
Delay studies were conducted at intersection approaches where the delays calculated by
the Synchro model appeared to be unusually or unrealistically high. Additional locations were
selected to get an overall idea of how well the Synchro model was predicting existing system
intersection delays. Delay studies were conducted at the 11 intersections shown in Figure 2. The
delay field data were collected using the standard procedure for conducting a delay study
described in the ITE Traffic Engineering Studies Handbook (Robertson, 1994). Each data
collection was conducted using a stop watch and deviated from the Handbook somewhat, since
no traffic volumes were measured at the time of the delay study. Due to limited resources, the
traffic volumes from the traffic data book - City of Bellevue (2008) were used instead.
Model Calibration: The first step in calibrating the 2007 base model involved making network-
wide parameter adjustments suggested by the Synchro User Guide for intersections that were
already experiencing over-capacity volumes. Consequently, for all intersection approaches where
the volume to capacity ratio was greater than or equal to 1, the peak hour factor was set to 1. All
volume to capacity ratios were checked by approach at all 36 intersections within the study area.

Masek, Nihan 10
Figure 2: Delay Study Locations

Masek, Nihan 11
Another network-wide adjustment that was used for calibration was volume balancing.
Volume balances between all of the intersections within the study area were evaluated based on
the authors’ familiarity with the current mid-block flows between specific intersection pairs. The
targeted goal for the majority of links was to have 200 or fewer vehicles entering or leaving
traffic flows between intersections. This was typical for the number of driveways and the type of
traffic coming in and out of those driveways during the peak period. Some locations, where there
was a high volume of traffic entering a link between intersections during the pm peak period,
such as traffic leaving the parking lots of large office buildings, were left with imbalances higher
than 200 vehicles. The other exception to the 200-vehicle threshold for mid-block source or sink
volumes was for links where there were no driveways and no places to turn. The corresponding
approach volumes for the intersection pairs connected by these links were balanced so that all
mid-block flows were set to zero.
After overall network parameters were adjusted, further model adjustments were made
for individual intersections based on model delay outputs when such adjustments could be
reasonably justified. The stopped delays estimated by the Synchro model were compared to the
stopped delays measured in the field to identify intersections where significant discrepancies
occurred. Table 1 shows the percent difference in stopped delays between the field
measurements and the uncalibrated 2007 model outputs. There was a significant amount of
variation between the two. Table 1 also shows the percent differences in the same field
measurements and the final 2007calibrated base model. The calibration decisions and the
reasoning behind them are discussed below.
The following parameter adjustments were considered for specific locations during the
calibration process: lane utilization factors, ideal saturation flow rates, permit Right Turns on
Red, and number of vehicles making right turns on red. The lane utilization factor was the most
common parameter that was changed at most of the locations. This factor was adjusted for
several reasons including heavy pedestrian movements that were known to prevent vehicles from
turning right and situations where traffic in the left turn lane of an approach would spill over into
the through lane. Adjustments to the lane utilization factor had a significant impact on stopped
delay indicating that the model was sensitive to this type of parameter change. In a few cases, the

Masek, Nihan 12
observed amount of overflow traffic from a left turn lane on a particular approach resulted in a
lower operational saturation flow rate for that approach than would be normally be assumed for
the given number of approach lanes. The model’s ideal saturation flow rate for such approaches
was adjusted to compensate for the difference. Another factor that was adjusted was the Right
Turn on Red factor. In some cases such as most intersections with NE 8th St, Right Turn on Red
was turned off because the east-west traffic volumes were so heavy that it was nearly impossible
for vehicles to turn right on red. In other cases, right turns on red were common, but the number
of vehicles allowed to make right turns on red was adjusted in the model to account for that
observation in the field.
Table 1: Calibration Results
Model Verification and Additional Adjustments - After completing the parameter adjustments
described above, many of the intersections had acceptable agreement between their model delay
outputs and observed field delays.
To help verify the model, the intersections that still had significant delay discrepancies
were brought closer to observed delay measurements by adjusting traffic volumes where such
adjustments seemed reasonable, based on the probable error in the original volume data. One
Intersection Approach Measured
Field Measured Stopped
Delay (secs)
Synchro Stopped
Delay before
Calibration (secs)
% Difference between
Field and Uncalibrated
Model
Synchro Stopped
Delay after Calibration
(secs)
% Difference between
Field and Calibrated
Model
112 Ave NE / NE 8 St SB Left 67.12 154.5 -56.55% 67.52 0.60%
110 Ave NE / NE 8 St SB Thru 65.25 32.8 99.12% 63.30 -2.99%
108th Ave NE / NE 8th St SB Thru-Right 42.26 28.8 46.89% 42.90 1.51%
108 Ave NE / NE 8 St NB Thru-Right 87.86 39.5 122.21% 84.90 -3.37%
110 Ave NE / NE 4 St SB Thru 52.9 46.8 12.92% 60.20 13.80%
108 Ave NE / NE 4 St SB Thru 27.84 52.8 -47.32% 33.20 19.25%
106 Ave NE / NE 4 St NB Thru-Right 31.67 53.5 -40.76% 34.80 9.88%
Bellevue Way / NE 4 St EB Thru-Right 54.16 28.6 89.27% 48.40 -10.64%
112 Ave / Main St SB Thru-Right 20.09 23.8 -15.76% 20.00 -0.44%
112 Ave / Main St NB Thru-Right 20.93 38.1 -45.02% 23.30 11.31%
Bellevue Way / Main St WB Thru 40.35 37.8 6.62% 38.85 -3.73%
Bellevue Way / Main St EB Thru-Right 51.76 40.0 29.41% 54.90 6.06%
Bellevue Way / NE 12 St EB Thru-Right 33.20 31.8 4.24% 33.90 2.12%
112 Ave NE / NE 12tSt WB Thru-Right 14.91 51.5 -71.03% 16.00 7.34%

Masek, Nihan 13
could argue that there was sufficient variation associated with the City’s volume data used as
model inputs that the remaining model output discrepancies could be explained by input errors.
First, there are known day-to-day variations in actual volumes (even during peak hours) for any
given year and, second, the 2007 volume data for different intersections were collected by the
City on different days over the year. Therefore, input volume adjustments within a reasonably
expected error range could be justified to produce model delay outputs that were consistent with
field delay data collected on a particular day. Table 2 shows that, although traffic volume counts
from year to year vary, on average, by only 3% some can vary as much as 15%. Consequently,
volume adjustments were considered only after model parameter adjustments that could be
supported were made, and these were made only to test potential model validity.
In making selected volume adjustments, the factors used to multiply collected counts
ranged from 0.75 – 1.25., based on field observations made while conducting the delay studies.
In nearly all cases, volume adjustments were made with factors between .90 and 1.10. In many
cases, the volume adjustments allowed the Synchro-calculated stopped delays to match the
stopped delays measured in the field. However, there were several cases where volume
adjustments alone (within the justified error range) were not enough to produce model delays
that were sufficiently close to field-measured delays. And, unfortunately, although two
intersections on 8th Street improved their stopped-delay discrepancies using a reasonable
correction factor, the volume adjustments for those intersections had to be reversed. Their
resulting volumes turned out to be inconsistent with volumes at the other intersections along NE
8th St. Therefore, the volume-correction factors for those two intersections, in the east and west
directions only, were removed to fix this problem.
The targeted calibration and verification goal for the 2007 base model was, for each
approach to have, a difference between field-measured and Synchro-measured stopped delays of
10% or less and an average percent difference of 5% or less. The former was accomplished for
most of the locations (Table 1) and their average absolute error was 6.6%. Without additional
data collection, the model could not reasonably be adjusted any further to reconcile delays.
However, it was still considered adequate for preliminary evaluations of the relative impacts of
the future 2017 alternatives’ to be modeled.

Masek, Nihan 14
After the calibration and verification process was completed, two outliers were
investigated further and finally accepted after all of the applicable calibration and verification
techniques were used and the delays still did not match the field measured delay. The model
could not reasonably be adjusted any further to reconcile the two delays.
Table 2: Changes in Traffic Volume Counts from Year to Year
Intersection Most Recent
Traffic Count Volume
Second Most Recent
Traffic Count Volume
Most Recent Count vs. Second Most Recent Count
(%)
NE 8th St and 112th Ave NE 5321 5249 -1.37 NE 8th St and 108th Ave NE 3247 3401 4.53 NE 4th St and 108th Ave NE 2848 2677 -6.39 NE 4th St and Bellevue Way 2819 3314 14.94 Main St and 112th Ave 3437 3480 1.24 Main St and Bellevue Way 3369 3596 6.31 NE 12th St and Bellevue Way 3170 3169 -0.03 NE 12th St and 112th Ave NE 3427 3537 3.11
Average 2.79
After the calibration of the 2007 base model was completed, the calibrated model was
used as a base to develop the 2017 base model and the three 2017 traffic control alternatives.
C. 2017 Base Model
Traffic flows for the year 2017 were input to the original base model to create the 2017
base model, a model of the existing network with no improvements serving the expected
increased traffic demands of 2017. A growth factor of 3% per year was applied to the 2007
traffic volumes in the base-year calibrated Synchro model to estimate the expected 2017 traffic
volumes. After incorporating the expected 3% traffic volume increases, the signal timing plans
were optimized using the procedures in Synchro 6 User Manual (2004), to produce the 2017 base
model.
The 2017 base model outputs were used as a basis of comparison to determine the
effectiveness of the traffic control and spot infrastructure improvement alternatives that were
proposed to achieve necessary reductions in vehicle and pedestrian delays for the expected

Masek, Nihan 15
growth in travel demand in 2017. The base 2017 model allowed for a comparison of the delays
observed for the existing system in 2007 and those expected in 2017 if no improvements, except
optimization of the timing plans, were made and for modeling and comparing the expected
results in 2017 if the proposed system alternatives were incorporated.
The existing system alternative was used to examine the effects of “doing nothing” to the
existing system over the next 10-year period. This alternative was based on the assumption that
no traffic control or spot construction improvements were made to the existing system by the
year 2017 and that the only change that occurred was the expected 3% growth in traffic volumes
for all intersections and the Synchro optimization of the timing plan for these additional
volumes. The differences in outputs of the base 2017 and base 2007 Synchro Models gave the
predicted results for this Do-Nothing Alternative.
D. 2017 Alternatives
Three alternative improvement options were proposed, and models of their respective
2017 scenarios were prepared for analysis and impact evaluation.
Alternative 1 – Left Turn Restrictions Only, Selected Intersections Inside Perimeter. The
first alternative was developed to examine the effects of restricting left turns at intersections
internal to the study area. A total of 10 out of 36 intersections were selected for left turn
restrictions (Figure 3). These intersections were judged to be the best candidates for significantly
decreasing intersection delays and corridor travel times, while continuing to allow full left turn
access to the desired set of key intersections. Based on current planning policy, the authors
decided that streets along the perimeter of the study area should continue to have full access to
protected left turns including Bellevue Way NE, Main Street, 112th Avenue NE and NE 12th
Street.
Alternatively, restricting left turns at 10 signalized intersections inside the study area
perimeter would allow those intersections to operate on a 2-phased signal timing plan instead of
their current timings of 3 or more phases. This could potentially reduce overall vehicle and

Masek, Nihan 16
pedestrian delays and potentially increase vehicle thru-put without the need to build additional
capacity.
At the authors’ request, the City of Bellevue Transportation Modeling Group used the
EMME/2 model to determine the trip routing for downtown Bellevue in the year 2007 for the
scenario that assumed left turns were restricted at the 10 intersections shown in Figure 3. The
authors used these outputs of the macroscopic EMME/2 model to determine the turning
movement splits for the 2017 Synchro model for this traffic control alternative. Using the total
approach volumes obtained by applying the 3% growth factor to the base-year approach
volumes, the volume splits from the 2007 EMME/2 model were applied to these approach
volumes to determine the new turning movements for Alternative 1. After the Alternative 1
model was developed, the signal timing plans were again optimized using the procedures in
Synchro 6 User Manual (2004).

Masek, Nihan 17
Figure 3: Alternative 1 – Left Turn Restrictions Only, Selected Intersections Inside Perimeter

Masek, Nihan 18
Alternative 2 – Alternative 1 with Infrastructure Improvements plus Left Restrictions at
One Perimeter Intersection. The second alternative included the same left turn restrictions in
Alternative 1 plus additional restrictions coupled with some infrastructure improvements. The
infrastructure improvements considered for Alternative 2 were from the City of Bellevue’s
Capital Improvement Program and will likely be constructed sometime in the next 8 to 10 years.
In addition to the left turn restrictions in Alternative 1, this alternative also restricted left turn
movements at one more intersection, which was located on the perimeter. Alternative 2 (Figure
4) included the following modifications to Alternative 1:
Eastbound Left Turn from Main St to Bellevue Way Restricted (moved to 106th Ave)
Eastbound Right Turn lane added at 112th Ave and Main St (EB to SB 112th Ave)
Southbound Right Turn lane added at NE 4th St and Bellevue Way NE (SB to WB NE
4thSt)
Westbound Right Turn lane added at NE 4th St and Bellevue Way NE (WB to NB
Bellevue Way)
Second Northbound Left Turn lane added at 110th Ave NE and NE 8th St (NB to WB NE
8th St)
Second Southbound Left Turn lane added at 110th Ave NE and NE 8th St (SB to EB NE
8th St) Southbound Right Turn lane added at NE 8th St and Bellevue Way NE (SB to WB
NE 8th St)
The infrastructure improvements listed above were limited by the amount of right of way
available. The lack of right of way makes major capacity improvements cost-prohibitive. The
improvements listed are intended to improve delay at intersections and address specific issues.
After the Alternative 2 model was developed, the signal timing plans were optimized using
the procedures in the Synchro 6 User Manual (2004).

Masek, Nihan 19
Figure 4: Alternative 2 – Alternative 1 with Infrastructure Improvements plus Left Turn Restriction on
One Perimeter Intersection.

Masek, Nihan 20
Alternative 3 – Alternative 2 with Additional Left Turn Restrictions on Perimeter
Intersections. The third alternative includes everything included in Alternative 2 and takes a
more aggressive approach to turn restrictions by making some restrictions on perimeter streets in
the study area that are currently may be considered infeasible by policy-makers and planners.
Selected movements at intersections on the perimeter of the study area were restricted in order to
reduce intersection delays that produced unacceptable LOS results. Alternative 3 (Figure 5)
includes the following modifications to Alternative 2:
No Left Turns from Westbound NE 10 St and to Southbound Bellevue Way (Assume
these lefts are made at NE 10 St and 102 Ave NE)
No Left Turn from Northbound NE 8 St and Westbound Bellevue Way (Assume Left
turns are split evenly between NE 10 St and NE 4 St)
No Left at NE 8 St and 110th Ave NE – EB to NB. (Assume vehicles go right at 112th
and come back up 110th to get across NE 8th St)
No Left turns at NE 4 St and 110th Ave NE – EB to NB. Assume vehicles go left on 112th
No Right turns from NE 8 St to SB Bellevue Way NE. Split Evenly between NE 4 St and
NE 10 St

Masek, Nihan 21
Figure 5: Alternative 3 – Alternative 2 with Additional Left Turn Restrictions on Perimeter Intersections.

Masek, Nihan 22
IV. RESULTS
The models were run and the performance of the intersections and the street corridors
were compared. The metric used to measure intersection performance was stopped delay
(seconds/vehicle) and the metric used to measure corridor performance was travel time
(seconds). Figures 6-11 show intersection delays on selected intersections for the 2007 Base
Model, 2017 Base Model, and 2017 Alternatives 1-3. Delay data for each intersection and
percent changes between models can be found in the tables in Appendix A.
In all of the individual intersection results, there is clearly a significant increase in delay
between the 2007 base model and the 2017 base model. This result is not surprising and confirms
the results of other models and studies performed by the City of Bellevue and also highlights the
need for making improvements to reduce expected delays resulting from the expected increases
in future traffic demands..
In Figure 6, the delays at the intersections of Main St/Bellevue Way and Main St/112
Ave doubled from 2007 to 2017. The intersection delay got slightly worse with Alternative 1 at
Main St and Bellevue Way, but improved significantly once the left turn restrictions were added
in Alternatives 2 and 3. At Main St and 112 Ave, Alternative 1 made the delay even worse than
the 2017 base model. Alternatives 2 and 3 improved the delay because both alternatives included
a new right turn lane at that intersection. The delay changes to the other intersections on Main St
and 106th Ave, 108th Ave, and 110th Ave were minor compared to those at the intersections with
Bellevue Way and 112th Ave. There were notable delay changes at the intersection of Main St
and 106th Ave for Alternatives 2 and 3 when compared with Alternative 1. This was due to the
additional left turn movements coming from the traffic that was turn-restricted at the intersection
of Bellevue Way and Main St.
Figure 7 shows the delays for intersections located along NE 2nd St between Bellevue
Way NE and 112th Ave NE. Overall, there were no significant changes in intersection delays
between the 2007 base model and the 2017 base model. There were some additional delays at
certain intersections that were the result of additional left-turn movements arriving from
Masek, Nihan 23
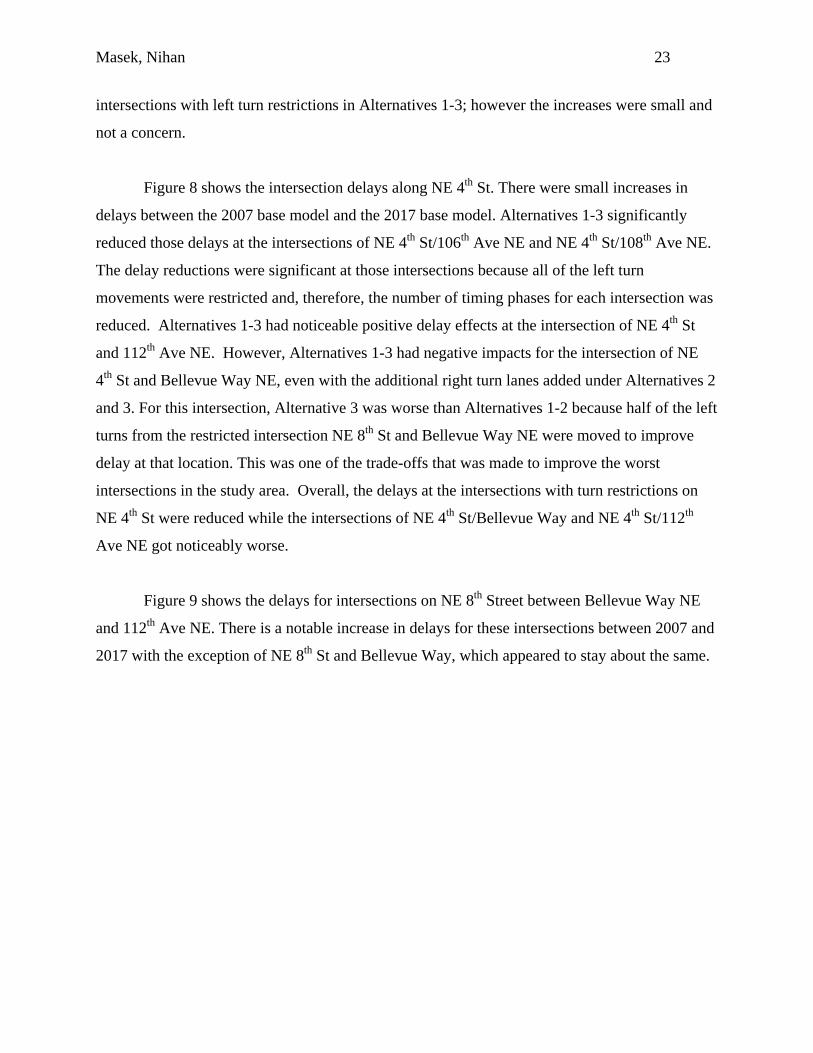
intersections with left turn restrictions in Alternatives 1-3; however the increases were small and
not a concern.
Figure 8 shows the intersection delays along NE 4th St. There were small increases in
delays between the 2007 base model and the 2017 base model. Alternatives 1-3 significantly
reduced those delays at the intersections of NE 4th St/106th Ave NE and NE 4th St/108th Ave NE.
The delay reductions were significant at those intersections because all of the left turn
movements were restricted and, therefore, the number of timing phases for each intersection was
reduced. Alternatives 1-3 had noticeable positive delay effects at the intersection of NE 4th St
and 112th Ave NE. However, Alternatives 1-3 had negative impacts for the intersection of NE
4th St and Bellevue Way NE, even with the additional right turn lanes added under Alternatives 2
and 3. For this intersection, Alternative 3 was worse than Alternatives 1-2 because half of the left
turns from the restricted intersection NE 8th St and Bellevue Way NE were moved to improve
delay at that location. This was one of the trade-offs that was made to improve the worst
intersections in the study area. Overall, the delays at the intersections with turn restrictions on
NE 4th St were reduced while the intersections of NE 4th St/Bellevue Way and NE 4th St/112th
Ave NE got noticeably worse.
Figure 9 shows the delays for intersections on NE 8th Street between Bellevue Way NE
and 112th Ave NE. There is a notable increase in delays for these intersections between 2007 and
2017 with the exception of NE 8th St and Bellevue Way, which appeared to stay about the same.

Masek, Nihan 24
Main St Intersection Delay
0
20
40
60
80
100
120
140
160
180
BellevueWay
106th Ave 108th Ave 110th Ave 112th Ave
Del
ay (
s/v)
2007 Base Model
2017 Base Model
Alternative 1
Alternative 2
Alternative 3
Figure 6: Intersection Delays on Main St – Bellevue Way to 112th Ave
NE 2 St Intersection Delay
0
20
40
60
80
100
120
140
160
180
200
BellevueWay
106th AveNE
108th AveNE
110th AveNE
112th AveNE
Del
ay (
s/v)
2007 Base Model
2017 Base Model
Alternative 1
Alternative 2
Alternative 3
Figure 7: Intersection Delays on NE 2nd St – Bellevue Way to 112th Ave NE

Masek, Nihan 25
Delays at the intersection of Bellevue Way increased significantly with Alternatives 1
and 2 because more traffic was forced to make left turns at that intersection due to the left turn
restrictions elsewhere along the corridor. The infrastructure improvements in Alternative 2 gave
it a slight advantage over Alternative 1. Alternative 3 reduced delay significantly at NE 8th St and
Bellevue Way to a level below the 2007 delay, which was due to restricting a left turn movement
and a right turn movement. At the intersections of NE 8th St / 106th Ave NE and NE 8th St / 108th
Ave NE, there were significant delay decreases resulting from all three alternatives. These
significant decreases in delay were due to restricting left turns on all approaches at these
intersections which simplified the signal timing. Alternatives 1 and 2 increased the delays at the
intersections of NE 8th St/110th Ave NE and NE 8th St/112th Ave NE. This was due to no-turn
restrictions at these intersections for these alternatives. Alternative 3 improved the delay at the
intersection of NE 8th St and 110th Ave NE to the 2017 base delay level. The configuration at the
5 leg intersection of NE 8th St and 112th Ave NE and its location at a freeway on ramp made it
impossible to restriction movements for that intersection. The delay at this intersection increased
with Alternatives 1-3 since more vehicles reached this already over-capacity intersection faster
than they did without the turn restrictions at the other intersections on NE 8th St.
Figure 10 shows the delays for intersections located along NE 10th St between Bellevue
Way NE and 112th Ave NE. Overall, there were no significant delay changes between the 2007
base model and the 2017 base model at the intersections of NE 10th St/106th Ave NE, NE 10th
St/108th. Ave NE and NE 10th St/110th Ave NE. There were some additional delays resulting
from additional traffic at these intersections due to turn restrictions at other locations in
Alternatives 1-3. However, these increases were not substantial and therefore not a concern.
Alternative 3 increased the delay at the intersection of Bellevue Way and NE 10th St since some
the left turning traffic from the intersection of Bellevue Way NE and NE 8th St was moved to this
intersection. This was a trade-off to improve the delay at the intersection of NE 8th St and
Bellevue Way NE. Alternatives 1-3 slightly improved the delay at the intersection of NE 10th St
and 112th Ave NE over the 2017 Base Model, which is unusual since intersections on the
perimeter street typically had worse delays as a result of turn restrictions on internal nodes.

Masek, Nihan 26
NE 4 St Intersection Delay
0
20
40
60
80
100
120
140
160
180
200
BellevueWay
106th AveNE
108th AveNE
110th AveNE
112th AveNE
Del
ay (
s/v)
2007 Base Model
2017 Base Model
Alternative 1
Alternative 2
Alternative 3
Figure 8: Intersections Delay on NE 4th St – Bellevue Way to 112th Ave NE
NE 8 St Intersection Delay
0
20
40
60
80
100
120
140
160
180
200
BellevueWay
105th AveNE
106th AveNE
108th AveNE
110th AveNE
112th AveNE
Del
ay (
s/v)
2007 Base Model
2017 Base Model
Alternative 1
Alternative 2
Alternative 3
Figure 9: Intersections Delay on NE 8th St – Bellevue Way to 112th Ave NE

Masek, Nihan 27
NE 10 St Intersection Delay
0
20
40
60
80
100
120
140
160
180
200
BellevueWay
106th AveNE
108th AveNE
110th AveNE
112th AveNE
Del
ay (
s/v)
2007 Base Model
2017 Base Model
Alternative 1
Alternative 2
Alternative 3
Figure 10: Intersection Delays on NE 10th St – Bellevue Way to 112th Ave NE
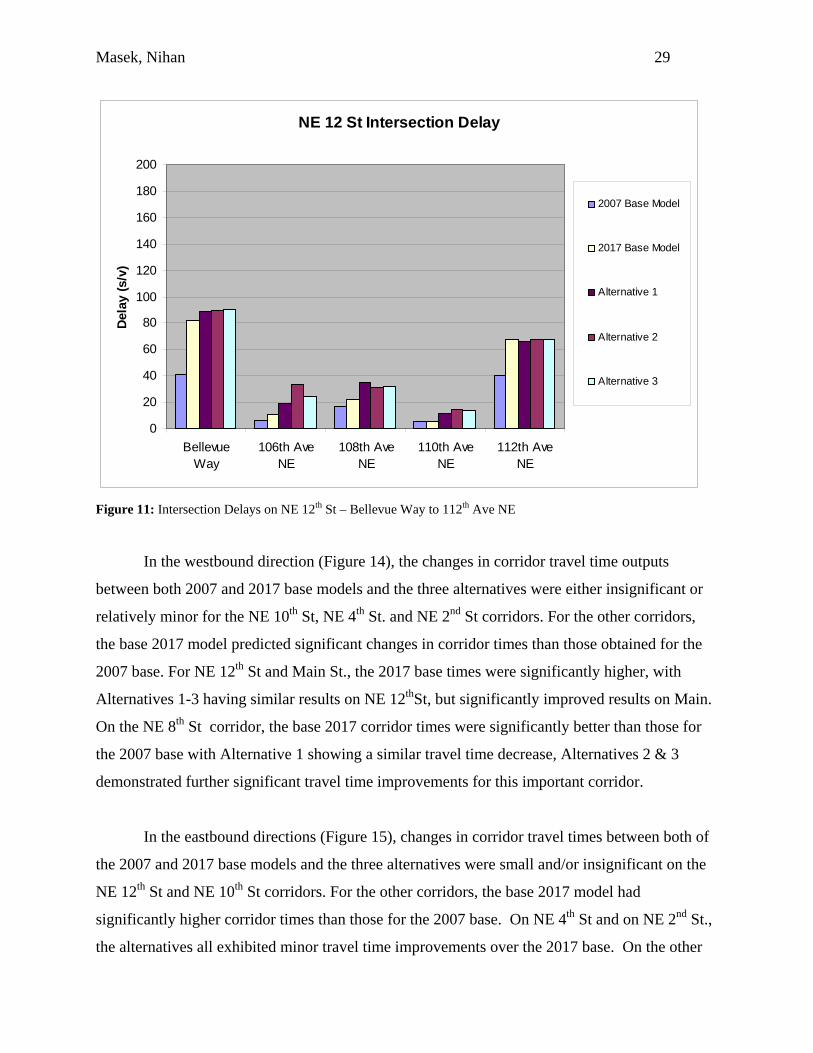
Figure 11 shows the delays for intersections along the NE 12th Street corridor from
Bellevue Way NE to 112th Ave NE. All the intersections along NE 12th St had increased delays
from the 2007 base model to the 2017 base model except for the intersection of NE 12th St and
110th Ave NE, which stayed close to the same. Delays at all of the intersections increased with
all of the alternatives over the 2017 base model. The delay increases for Alternatives 1-3 were
most notable at the intersections of NE 12th St/Bellevue Way and NE 12th St / 112th Ave NE.
There were delay increases at the other intersections as well, but the increases were not as
significant.
Figures 12-15 show the corridor travel time outputs for all of the major streets in the
study area for the respective model runs. Travel time data for each intersection and percent
changes between models can be found in the tables in Appendix A.

Masek, Nihan 28
The changes in travel times in the northbound directions (Figure 12) were insignificant
for all the alternatives, and there minor increases and decreases in corridor travel times between
the 2017 base model and the three alternatives, which were also insignificant.
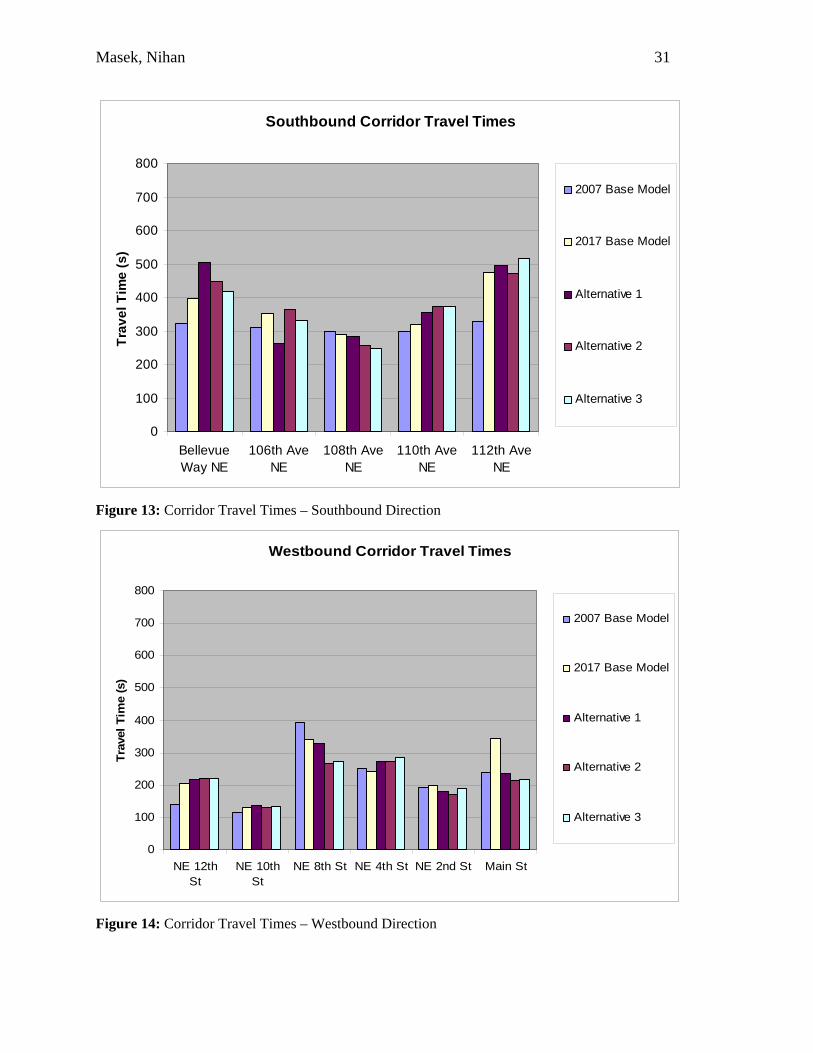
In the southbound directions (Figure 13), some corridors had increased travel times and
others corridors improved when compared with the base 2007 network. Bellevue Way NE
experienced increased corridor travel times in 2017 for all cases when compared to the 2007
base. Also, for this corridor, the 2017 base model had a lower travel time than all three
improvement alternatives. The same overall result occurred for the southbound 110th Ave NE
and 112th Ave NE corridors, but to a lesser extent. For Southbound 110th, the base 2007 corridor
time was only slightly better than the base 2017 travel time, which was, in turn, better than the
corridor times for Alternatives 1-3. The increase in corridor times from 2007 to 2017 for
Southbound 112thAve NE, however, was significantly higher with the base 2017 system, which,
in turn, did as well or better than the three improvement alternatives. The corridor travel times in
the southbound direction for 108th Ave NE improved slightly for Alternatives 2 and 3 and
showed insignificant decreases for Alternative 1 and the base 2017 system. There were also
decreases in corridor travel times on Southbound 106th Ave NE for Alternative 2. The
improvements in the 106th Ave and 108th Ave southbound corridors are not surprising, since all
of the traffic signals on these corridors had turn restrictions for the three alternatives.
Masek, Nihan 29
NE 12 St Intersection Delay
0
20
40
60
80
100
120
140
160
180
200
BellevueWay
106th AveNE
108th AveNE
110th AveNE
112th AveNE
Del
ay (
s/v)
2007 Base Model
2017 Base Model
Alternative 1
Alternative 2
Alternative 3
Figure 11: Intersection Delays on NE 12th St – Bellevue Way to 112th Ave NE
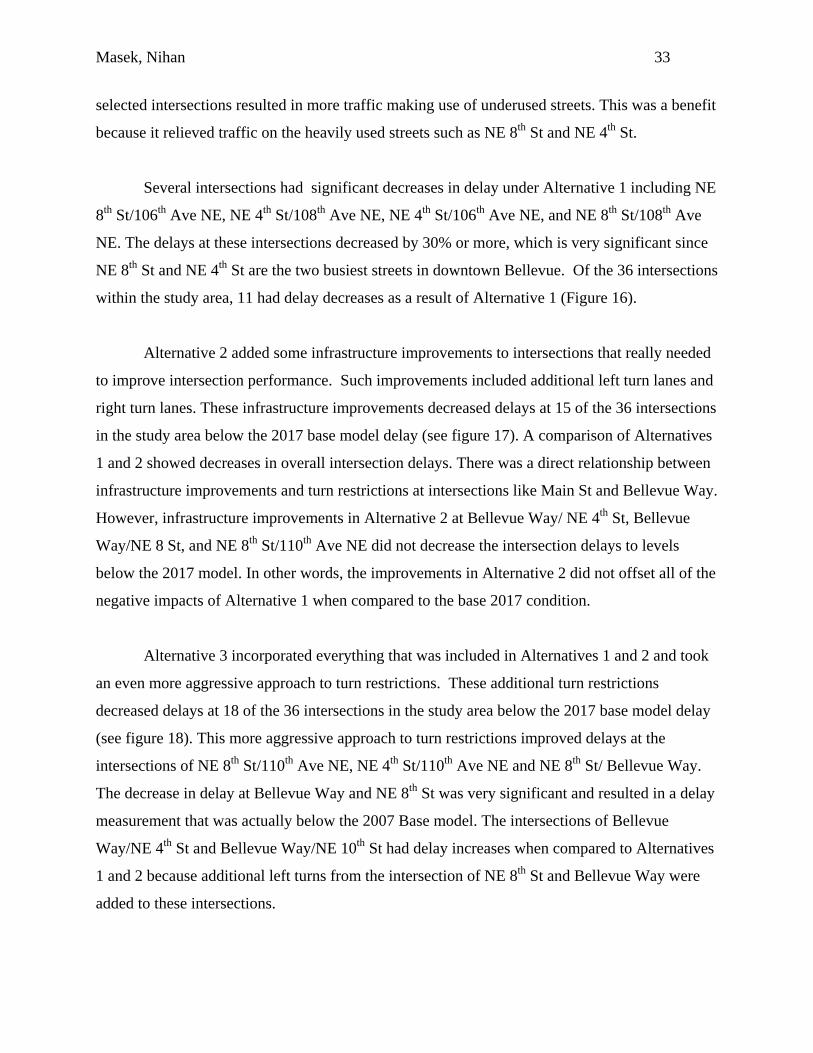
In the westbound direction (Figure 14), the changes in corridor travel time outputs
between both 2007 and 2017 base models and the three alternatives were either insignificant or
relatively minor for the NE 10th St, NE 4th St. and NE 2nd St corridors. For the other corridors,
the base 2017 model predicted significant changes in corridor times than those obtained for the
2007 base. For NE 12th St and Main St., the 2017 base times were significantly higher, with
Alternatives 1-3 having similar results on NE 12thSt, but significantly improved results on Main.
On the NE 8th St corridor, the base 2017 corridor times were significantly better than those for
the 2007 base with Alternative 1 showing a similar travel time decrease, Alternatives 2 & 3
demonstrated further significant travel time improvements for this important corridor.
In the eastbound directions (Figure 15), changes in corridor travel times between both of
the 2007 and 2017 base models and the three alternatives were small and/or insignificant on the
NE 12th St and NE 10th St corridors. For the other corridors, the base 2017 model had
significantly higher corridor times than those for the 2007 base. On NE 4th St and on NE 2nd St.,
the alternatives all exhibited minor travel time improvements over the 2017 base. On the other

Masek, Nihan 30
hand, the alternative systems produced increases in corridor travel times in the eastbound
directions on NE 8th St and Main St when compared to the 2017 base outputs for those two
corridors. On Main St, the increase was very significant for Alternative 1, but minor for
Alternatives 2 and 3. The increase in corridor travel times on NE 8th St in the eastbound direction
comes as no surprise because of the turn restrictions included in the alternatives and because this
is a very heavy PM peak travel direction.
Northbound Corridor Travel Times
0
100
200
300
400
500
600
700
800
BellevueWay NE
106th AveNE
108th AveNE
110th AveNE
112th AveNE
Tra
vel
Tim
e (s
)
2007 Base Model
2017 Base Model
Alternative 1
Alternative 2
Alternative 3
Figure 12: Corridor Travel Times – Northbound Direction
Masek, Nihan 31
Southbound Corridor Travel Times
0
100
200
300
400
500
600
700
800
BellevueWay NE
106th AveNE
108th AveNE
110th AveNE
112th AveNE
Tra
ve
l T
ime
(s
)
2007 Base Model
2017 Base Model
Alternative 1
Alternative 2
Alternative 3
Figure 13: Corridor Travel Times – Southbound Direction
Westbound Corridor Travel Times
0
100
200
300
400
500
600
700
800
NE 12thSt
NE 10thSt
NE 8th St NE 4th St NE 2nd St Main St
Tra
vel
Tim
e (s
)
2007 Base Model
2017 Base Model
Alternative 1
Alternative 2
Alternative 3
Figure 14: Corridor Travel Times – Westbound Direction

Masek, Nihan 32
Eastbound Corridor Travel Times
0
100
200
300
400
500
600
700
800
NE 12thSt
NE 10thSt
NE 8th St NE 4th St NE 2nd St Main St
Tra
vel
Tim
e (s
)
2007 Base Model
2017 Base Model
Alternative 1
Alternative 2
Alternative 3
Figure 15: Corridor Travel Times – Eastbound Direction
V. CONCLUSIONS
A. Effectiveness of Alternatives
A comparison of the outputs of the 2007 and 2017 base models showed significant
increases in intersection delays and the majority of directional corridor travel times over the 10
year period. This result was expected because of the assumed growth rate for traffic volumes of
3% per year. Comparisons of the 2017 base model with Alternatives 1, 2 and 3 are shown in
figures 16-18. The letters shown on the nodes in the figures are LOS measurements.
Alternative 1 produced changes to traffic patterns and trip routing due to the restriction of
left turns shown in Figure 1. The change in traffic volumes and routing resulted in traffic
increases and corresponding delay increases, on streets such as Main St, Bellevue Way, NE 12th
St, and 112th Ave NE where there were no left turn restrictions. Other locations with increased
delays were intersections where left turns were allowed such as NE 8th St / 110th Ave NE, and
NE 4th St / 110th Ave NE. Since the NE 2nd St and NE 10th St corridors have unused capacity, an
increase in delay and usage of these streets is a desirable trade-off. Restricting left turns at
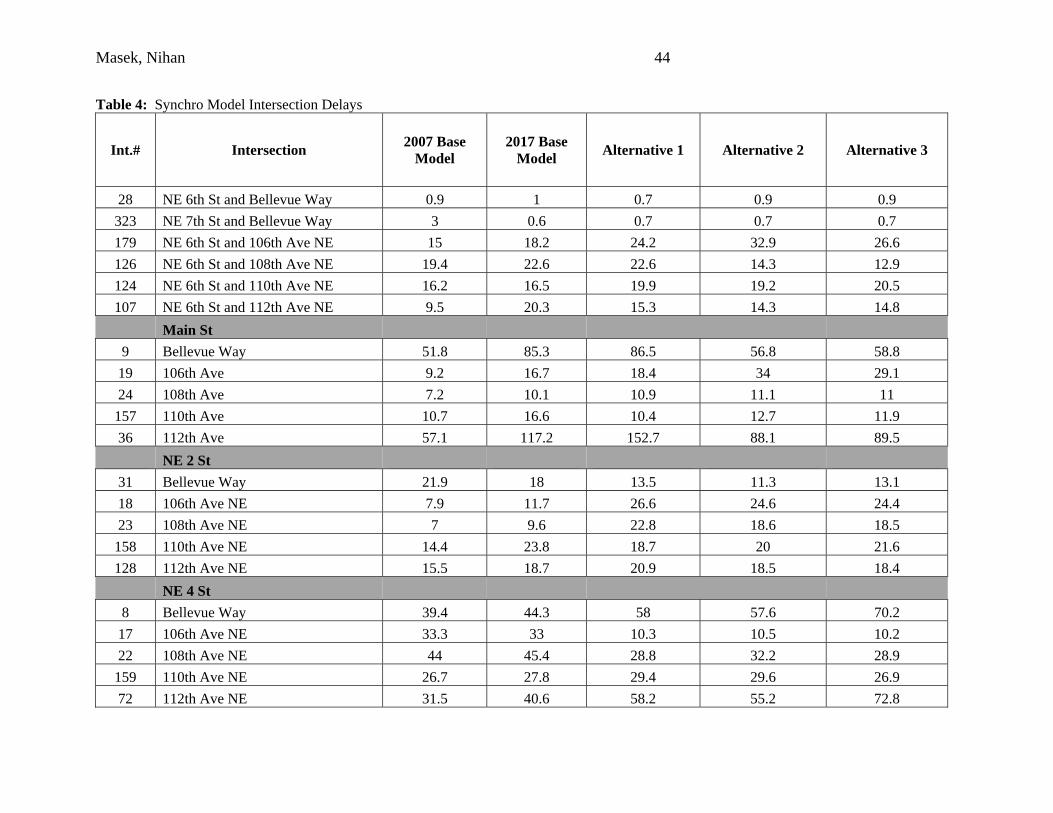
Masek, Nihan 33
selected intersections resulted in more traffic making use of underused streets. This was a benefit
because it relieved traffic on the heavily used streets such as NE 8th St and NE 4th St.
Several intersections had significant decreases in delay under Alternative 1 including NE
8th St/106th Ave NE, NE 4th St/108th Ave NE, NE 4th St/106th Ave NE, and NE 8th St/108th Ave
NE. The delays at these intersections decreased by 30% or more, which is very significant since
NE 8th St and NE 4th St are the two busiest streets in downtown Bellevue. Of the 36 intersections
within the study area, 11 had delay decreases as a result of Alternative 1 (Figure 16).
Alternative 2 added some infrastructure improvements to intersections that really needed
to improve intersection performance. Such improvements included additional left turn lanes and
right turn lanes. These infrastructure improvements decreased delays at 15 of the 36 intersections
in the study area below the 2017 base model delay (see figure 17). A comparison of Alternatives
1 and 2 showed decreases in overall intersection delays. There was a direct relationship between
infrastructure improvements and turn restrictions at intersections like Main St and Bellevue Way.
However, infrastructure improvements in Alternative 2 at Bellevue Way/ NE 4th St, Bellevue
Way/NE 8 St, and NE 8th St/110th Ave NE did not decrease the intersection delays to levels
below the 2017 model. In other words, the improvements in Alternative 2 did not offset all of the
negative impacts of Alternative 1 when compared to the base 2017 condition.
Alternative 3 incorporated everything that was included in Alternatives 1 and 2 and took
an even more aggressive approach to turn restrictions. These additional turn restrictions
decreased delays at 18 of the 36 intersections in the study area below the 2017 base model delay
(see figure 18). This more aggressive approach to turn restrictions improved delays at the
intersections of NE 8th St/110th Ave NE, NE 4th St/110th Ave NE and NE 8th St/ Bellevue Way.
The decrease in delay at Bellevue Way and NE 8th St was very significant and resulted in a delay
measurement that was actually below the 2007 Base model. The intersections of Bellevue
Way/NE 4th St and Bellevue Way/NE 10th St had delay increases when compared to Alternatives
1 and 2 because additional left turns from the intersection of NE 8th St and Bellevue Way were
added to these intersections.

Masek, Nihan 34
Figure 16: Intersection LOS – 2017 Base Model vs. Alternative 1

Masek, Nihan 35
Figure 17: Intersection LOS – 2017 Base Model vs. Alternative 2

Masek, Nihan 36
Figure 18: Intersection LOS – 2017 Base Model vs. Alternative 3

Masek, Nihan 37
B. Lessons Learned
For turning movement restrictions to work effectively on a congested signalized network,
the authors concluded that analysis must be done on an intersection by intersection basis. There
will be trade-offs needed in order to reduce delay at heavily congested intersections. Decisions
must be made as to which intersections can best handle delay increases while balancing those
increases with reductions in delay at intersections with very high delays (LOS E or F). They
learned that the Synchro model can be very sensitive to some changes and adjustments, while
other adjustments have little or no effect on the model. The authors concluded that turn
restrictions when coupled with targeted infrastructure improvements can prove to be very
effective at reducing delay and improving LOS.
This type of simulation work can demonstrate to planners and engineers the value in
testing small improvement proposals like these before implementing them. Modeling such
concepts first gives one a good idea of how effective or not they may be for congested, sensitive
networks. Through modeling, the authors learned that the most aggressive approach to turn
restrictions combined with some infrastructure improvements yielded the best results as
demonstrated by Alternative 3. A reasonable balance of feasible infrastructure improvements
appears necessary for turn restrictions to work effectively. Selected left turn restrictions such as
those in Alternative 1 are not effective by themselves, particularly if they are limited to internal,
and possibly, less critical intersections. Alternative 1 does improve the delays at intersections
internal to the study area, but it can make the delays worse at intersections on the perimeter
streets. In the case of downtown Bellevue, the intersections on the perimeter streets already have
some of the worst delays and need relief.
One of questions that came up during the analysis of the Bellevue network was how well
the Synchro model accounts for the interaction between vehicles and pedestrians. Table 3 was
developed to show the effect that pedestrians would have on the model outputs. The NE 8th
Street corridor was selected because it has some of the highest vehicle and pedestrian volume
numbers within the study area. Table 3 shows that the effect of pedestrians on the Synchro model
delay results was minimal. Synchro uses the Highway Capacity Manual formula to calculate
intersection delays. The impact of removing pedestrian volumes from the Synchro 2017 base

Masek, Nihan 38
model only decreased intersection delays within a range of -0.31% to -7.43%. It is very possible
that these results understate the real effect of pedestrians on delay, especially at high-volume
intersections.
Table 3: 2017 Delay with Pedestrians vs. Delay without Pedestrians
Intersection 2017 Delay (s/v) 2017 Delay w/o
Peds(s/v)
% Change in Delay 2017 with ped vs. 2017 without peds
NE 8th St and Bellevue Way 81.2 78.8 -3.05
NE 8th St and 106th Ave NE 47.7 47.1 -1.27
NE 8th St and 108th Ave NE 133 123.8 -7.43
NE 8th St and 110th Ave NE 62.5 62.1 -0.64
NE 8th St and 112th Ave NE 161.4 160.9 -0.31
Another issue that was considered while setting up the Synchro model was the fact that
the City’s intersection and corridor data were collected over the year on different days with each
set of data collected during the PM peak for particular intersections or corridors on a given day
providing a snapshot in time of the actual condition that day. Although traffic conditions during
the peak hour on “typical” days are not expected to vary widely, field measurements of traffic
conditions conducted on portions of the network on different days of the year may or may not be
sufficiently consistent for acceptable model accuracy.
C. Recommendations
Small CIP Investments Coupled With Traffic Control Alternatives Can Significantly Improve
Peak Hour Downtown Traffic Flows. The practice of restricting turns at signalized intersections
when combined with some infrastructure improvements appears to be beneficial for cities like
Bellevue with central business districts that have significant intersection delays but do not have
high enough traffic volumes to realize the benefits of a one-way street network. In this study, the
authors demonstrated that, for cities like Bellevue, Washington with a semi-actuated signalized
network and protected left-turn phases in their downtown grid, the more locations that had turn
restrictions, the greater the reduction in intersection delay at those intersections. Concurrently,
intersection delays increased slightly at nearby intersections that were currently under-used. This
type of trade-off, when applied judiciously, makes more effective use of the entire street

Masek, Nihan 39
network. There were significant decreases in delays at several intersections with originally high
delays on heavily traveled streets like NE 8th St and NE 4th St. Overall; Alternative 3 performed
the best of three alternatives. The resulting LOS measures are shown in figure 18. The results
indicate some intersections benefited from a combination of turn restrictions during the PM peak
and small infrastructure improvements, while some others had increased delays as a result. Many
of the intersections that had increased delays still had a LOS of C or better, so these were
examples of satisfactory trade-off results. Overall, corridor travel times decreased as a result of
restricting left turns in at least one direction on all streets except 112th Ave NE and NE 10th St.
The combination of turn restrictions during the PM Peak and infrastructure improvements
in Alternative 3 will improve traffic flow and intersection delays on key streets like NE 8th St and
NE 4th St during the PM Peak and will transfer traffic to other streets that are underused. This
allows for better use of the street grid and a more uniform distribution of the traffic. The turn
restriction alternatives would only be active during the PM peak, which allows for the flexibility
making left turns at all intersections during the rest of the day. The benefits realized at many
intersections on NE 8th St and NE 4th St will outweigh the increases in delays at other
intersections within the study area. Many of the intersections that had delay increases as a result
of restricting left turns were locations with initially small delays. The practice of restricting turns
at intersections coupled with some infrastructure improvements helps redistribute traffic from
heavily traveled streets like NE 8th St and NE 4th St to less frequently used streets like NE 10th St
or NE 2nd St.
Implementation of turn restrictions solely during the PM peak limits potentially negative
impacts of this traffic control option on surrounding businesses and homeowners and potentially
benefits commuters at the same time. Some business owners will likely be opposed to the idea of
restricting turns at intersections because it may make it more difficult and inconvenient for their
customers to reach their business. However, restricting turns at intersections does have less
negative impact on businesses than converting the streets to a one-way grid.
Reducing overall intersection delays and corridor travel times is also beneficial to the
environment. The faster vehicles can be moved through an intersection, the less time they will

Masek, Nihan 40
idle. Intersection delays and corridor travel times were improved on some of the streets in
downtown Bellevue including NE 8th St, which has the worst intersection delays and travel
times. Not every street or intersection benefited from restricting turns and some intersections had
increases in delay. The goal of reducing delays and improving as many intersections with LOS E
or F as possible can be achieved by taking an aggressive approach to turn restricting combined
with making some infrastructure improvements. However, there are some locations where
actions like these, aimed at improving LOS, are not feasible such as intersections near freeway
on ramps.
New Technologies for Real-Time Data Collection Will Significantly Improve Model
Calibrations and, Therefore, Prediction Accuracy. At the beginning of this research study,
traffic volume data were collected using counts from induction loops approaching intersections
on NE 8th St and NE 4th St within the study area. The volumes were counted using the 3M
Canoga 800 Loop Amplifier Card. Data were collected during the Christmas holiday season in
2007 and in January 2008 in an effort to measure traffic at its worst levels. The analysis and
processing of the loop data proved to be more time consuming than expected and could not be
completed within the scope of this research project. The original intent was to use that volume
data and run scenarios under the worst traffic volumes.
The City of Bellevue currently has the technology to collect and transmit real-time data
from the induction loops at signalized intersections to the City’s traffic control center. Future
research using these data will lead to improved traffic forecasts. To better understand how
accurately Synchro estimates delays and travel times, future research could include real-time
data from the signalized intersections that could be fed directly into the models. This would
allow for concurrent field delay data to be collected and compared directly to the Synchro model
outputs.
The City of Bellevue is already working on several innovative tools to help ease
congestion in the downtown area including a traffic flow map that helps drivers identify the
problem locations. The City of Bellevue will also be upgrading its traffic signal computer in the

Masek, Nihan 41
next few years, which will allow for more opportunities for data collection and more efficient
operation and coordination of downtown traffic signals.
Other Potential Model Improvements. Another issue of ongoing discussion in traffic
engineering practice relates to analysts’ assumptions about pedestrian walking speeds. Since
meeting the walking speed needs of the elderly will continue to be an important issue in the
future, research on the network impacts of lower walking speeds would be useful to determine
whether significant increases in intersection delays would result from right-turning vehicles
waiting for pedestrians to cross the street.
Some other items to consider for future research would be to refine the Synchro model to
include the new bridge across I-405 at NE 10th St to see how it impacts the 2017 models results
and Alternatives 1-3. Another way to test the effectiveness of turn restrictions would be to model
the entire downtown street network in VISSIM and then compare that to the overall network
performance in Synchro.

Masek, Nihan 42
REFERENCES
Bellevue, City of, 2007 Transportation Department Traffic Data Book, January 2008 EMME/2 User's Manual Software Release 8.0. INRO Consultants Inc., Montreal, Canada, 1996. Husch, David, Albeck, John, Synchro 6 User Guide, Trafficware, Albany California, 2004. Park, Byungkyu; Won, Jongsun; Yun, Ilsoo, Application of microscopic simulation model Calibration and validation procedure: Case study of coordinated actuated signal system, National Research Council, Washington, DC 2007,United States, 2006, p 113-122 Riniker, Keith, Silberman, Paul, Sabra, Ziad A., Signal Timing Optimization Methodologies and Challenges for the City of Baltimore, MD, USA, Central Business District and Gateways, ITE Journal, Washington DC, June 2008 Robertson, H. Douglas, Manual of Transportation Engineering Studies, Institute of Transportation Engineers (ITE), 1994. Sadek, Dr. Adel W., Aminson-Agbolosu, Seli J., Validating Traffic Simulation Models to Inclement Weather Travel Conditions with Applications to Arterial Coordinated Signal Systems, University of Vermont, Burlington Vt, November 2004. Schroeder-EI-Bastian-J; Rouphail-Nagui-M, A Framework for Evaluating Pedestrian-Vehicle Interactions at Unsignalized Crossing Facilities in a Microscopic Modeling Environment, Transportation Research Board. Held: 20070121- 20070125. 2007. 22p (3 Fig., 3 Tab., Refs.) RN: Report Number: 07-2263
TRB 2000, Transportation Research Board, Highway Capacity Manual. Washington, DC, 2000 US Census Bureau, http://www.census.gov/popest/cities/SUB-EST2007.html, Site last updated July 9, 2009, Site last accessed on July 27, 2008. Washburn, Scott, Larson, Nate, Signalized Intersection Delay Estimation: Case Study Comparison of TRANSYT-7F, Synchro and HCS, ITE Journal, Washington DC, March 2002.

Masek, Nihan 43
APPENDIX A – MODEL DELAY OUTPUTS
Masek, Nihan 44
Table 4: Synchro Model Intersection Delays
Int.# Intersection 2007 Base
Model 2017 Base
Model Alternative 1 Alternative 2 Alternative 3
28 NE 6th St and Bellevue Way 0.9 1 0.7 0.9 0.9
323 NE 7th St and Bellevue Way 3 0.6 0.7 0.7 0.7
179 NE 6th St and 106th Ave NE 15 18.2 24.2 32.9 26.6
126 NE 6th St and 108th Ave NE 19.4 22.6 22.6 14.3 12.9
124 NE 6th St and 110th Ave NE 16.2 16.5 19.9 19.2 20.5
107 NE 6th St and 112th Ave NE 9.5 20.3 15.3 14.3 14.8
Main St
9 Bellevue Way 51.8 85.3 86.5 56.8 58.8
19 106th Ave 9.2 16.7 18.4 34 29.1
24 108th Ave 7.2 10.1 10.9 11.1 11
157 110th Ave 10.7 16.6 10.4 12.7 11.9
36 112th Ave 57.1 117.2 152.7 88.1 89.5
NE 2 St
31 Bellevue Way 21.9 18 13.5 11.3 13.1
18 106th Ave NE 7.9 11.7 26.6 24.6 24.4
23 108th Ave NE 7 9.6 22.8 18.6 18.5
158 110th Ave NE 14.4 23.8 18.7 20 21.6
128 112th Ave NE 15.5 18.7 20.9 18.5 18.4
NE 4 St
8 Bellevue Way 39.4 44.3 58 57.6 70.2
17 106th Ave NE 33.3 33 10.3 10.5 10.2
22 108th Ave NE 44 45.4 28.8 32.2 28.9
159 110th Ave NE 26.7 27.8 29.4 29.6 26.9
72 112th Ave NE 31.5 40.6 58.2 55.2 72.8

Masek, Nihan 45
NE 8 St
7 Bellevue Way 70.1 70 87.5 79.6 53.5
322 105th Ave NE 3 1.7 1.7 1.7 1.7
16 106th Ave NE 21.5 36.7 21.1 18.4 20.3
21 108th Ave NE 58.6 99.7 33.3 34.7 42
27 110th Ave NE 27.5 76.8 104.5 88.9 76.2
26 112th Ave NE 113.4 144.4 167.1 162.5 163.3
NE 10 St
6 Bellevue Way 18.5 28.8 31.9 32.6 43.7
154 106th Ave NE 5.8 7.5 10.6 9.1 11.7
190 108th Ave NE 6 7.1 12.4 13.1 12.5
235 110th Ave NE 5.4 7.3 9.4 8.2 8
234 112th Ave NE 8.5 23.5 17.4 17.9 18.5
NE 12 St
5 Bellevue Way 41.1 82.5 88.9 90.3 90.8
15 106th Ave NE 6.6 11.2 19.5 33.8 24.5
20 108th Ave NE 16.8 22 34.6 31.3 31.6
162 110th Ave NE 6.2 6.2 11.8 14.7 13.8
25 112th Ave NE 40.4 67.8 66.2 67.5 67.7

Masek, Nihan 46
Table 5: Synchro Model Corridor Travel Times
2007 Base Model
2017 Base Model
Alternative 1
Alternative 2
Alternative 3
Corridor NB NB NB NB NB
Bellevue Way NE 285.4 374 363.7 367.3 359.6
106th Ave NE 304.8 339 326.1 340.1 343.1
108th Ave NE 378.4 394.1 377.6 380.8 388.2
110th Ave NE 369.8 316.6 301.4 299.1 302.7
112th Ave NE 302.5 357.2 358.3 355 358.4
Corridor EB EB EB EB EB
NE 12th St 167.2 199.1 178.8 176.6 177.5
NE 10th St 163.5 179.9 189.5 173.1 177
NE 8th St 358.4 564.2 681.5 623.5 625.5
NE 4th St 222.5 309.9 275.5 262.4 285.6
NE 2nd St 225 258.3 216.3 230.3 224.4
Main St 211 318.7 457.4 332.7 338
Corridor SB SB SB SB SB
Bellevue Way NE 322.2 398.2 503.2 448.7 416.4
106th Ave NE 311.2 350.8 262.9 362.9 330.9
108th Ave NE 299.6 290.8 282 255.7 247
110th Ave NE 297.7 318.6 356.2 371 371.1
112th Ave NE 325.8 472 495.6 469.9 514.1
Corridor WB WB WB WB WB
NE 12th St 139.4 204.2 219.1 220.8 220.2
NE 10th St 115.1 129.1 135.1 131 133.8
NE 8th St 392.6 339.7 329.7 265.6 271.1
NE 4th St 252.3 240.3 271.9 274.4 285.9
NE 2nd St 194.4 198.2 179.2 171.1 189.5
Main St 238.3 342.1 234.7 213.7 215.5