Impacts of the Relocation Program on Native American ...
34
Impacts of the Relocation Program on Native American Migration and Fertility Mary Kopriva November 15, 2021 Latest Version Abstract In this paper, I estimate the historical migratory and fertility effects of the US Relocation Program. Between 1952 and 1973, the US federal government attempted to move Native Americans off reservations and into urban areas under the promises of financial assistance and job training. Using the variation in which cities were targeted by the program, I employ a difference-in-differences strategy and estimate that the Relocation Program significantly increased the Native American population in target cities. I also find evidence that second-generation Native American women living in cities have a substantially lower fertility rate than Native American women living on tribal land. Jointly, these findings indicate that this federal program substantially shifted the spatial distribution of the Native American population in the US throughout the 20 th century. Acknowledgments: I offer a special thanks to Dr. Donald Fixico for his detailed historical research on the Relocation Program and instructive conversation. I am also extremely grateful to Benjamin Hansen and Edward Rubin for their invaluable advising and to the rest of my dissertation committee, Alfredo Burlando, Jonathan Davis, and Clare Evans, for their helpful feedback. 1
Transcript of Impacts of the Relocation Program on Native American ...

Impacts of the Relocation Program on Native AmericanMigration and Fertility
Mary Kopriva
November 15, 2021
Latest Version
Abstract
In this paper, I estimate the historical migratory and fertility effects of the USRelocation Program. Between 1952 and 1973, the US federal government attemptedto move Native Americans off reservations and into urban areas under the promises offinancial assistance and job training. Using the variation in which cities were targetedby the program, I employ a difference-in-differences strategy and estimate that theRelocation Program significantly increased the Native American population in targetcities. I also find evidence that second-generation Native American women living incities have a substantially lower fertility rate than Native American women living ontribal land. Jointly, these findings indicate that this federal program substantiallyshifted the spatial distribution of the Native American population in the US throughoutthe 20th century.
Acknowledgments: I offer a special thanks to Dr. Donald Fixico for his detailed historical
research on the Relocation Program and instructive conversation. I am also extremely grateful to
Benjamin Hansen and Edward Rubin for their invaluable advising and to the rest of my dissertation
committee, Alfredo Burlando, Jonathan Davis, and Clare Evans, for their helpful feedback.
1

1 Introduction
Throughout US history, the United States government has regularly sought to relocate
Native Americans1 both through force and through policy. While some of these policies are
infamous–the Indian Removal Act of 1830 led to between 4,000 and 8,000 Cherokee deaths2–
there is relatively little known about the long-term economic and demographic consequences
of more recent relocation policies. In addition, the economic literature has largely ignored
these programs and their effects.
My paper examines the migratory impacts of one such program known simply as the Re-
location Program.3 The Relocation Program, which ran from 1952 to 1973, offered financial
assistance and job counseling to Native Americans who left tribal land and moved to one of
the program’s target cities.4 As a crucial first step in understanding the lasting impacts of
these types of programs, this paper analyzes the implications of the Relocation Program on
the migratory outcomes of the Native American population in the second half of the 20th
century.
As far as I am aware, this is the first paper to estimate the causal effect of the Relocation
Program on Native American migration. Previous work in anthropology and sociology has
examined factors associated with migration through the program (Ablon, 1965; Chadwick
& White, 1973) and the demographic characteristics of participants as well as economic and
assimilation outcomes for those who were part of the program (Ablon, 1964; Gundlach et al.,
1977; Gundlach & Roberts, 1978; Price, 1968; Sorkin, 1969, 1971, 1978). This paper extends
the literature by establishing a causal link between the program and Native American mi-
1Because of the broad scope of the Relocation Program, I use the term Native America throughout thispaper to refer to the original inhabitants of North America generally, but I acknowledge that the term isimprecise and disputed. In cases where the data or policy use different terminology, I use the term that isconsistent with the data and policy language.
2The 4,000 to 8,000 death estimate refers solely to deaths on the Trail of Tears. Historical estimates placetotal population losses at greater than 10,000 (Thornton, 1984).
3The program was renamed the Employment Assistance Program when Congress expanded the programthrough the Indian Relocation Act of 1956, but for consistency will be referred to as the the RelocationProgram or Relocation throughout this paper.
4More information about the history and details of the Relocation Program are provided in the Backgroundsection.
2

gratory outcomes, providing valuable insights into the effects of such relocation programs on
migration and setting the stage for examining the causal impacts of the Relocation Program
on other outcomes.
Additionally, this paper establishes a basis for analyzing the long-run effects of migration
programs with the stated aim of expanding economic opportunities for migrants, similar
to programs such as the Moving to Opportunity program in the US or the Transmigration
Program in Indonesia. Thus, this paper adds to the growing literature on the impacts of these
employment targeting migration programs (Chetty and Hendren 2018a, 2018b; Chetty et al.
2016; Elmhirst 2002; Katz et al. 2001; Kling et al. 2007; Pollack et al. 2019, and more). Of
particular importance is the added value of the Relocation Program’s timing. The Moving
to Opportunity literature has specifically found that the main impacts of these types of
programs are realized among the young children of movers. The Moving to Opportunity
program, however, is still relatively recent and some of the longer term or second-generation
outcomes are yet to be determined. Because the Relocation Program began almost 70
years ago, the long-term outcomes for movers, as well as the movers’ children, have been
realized and are able to be studied. Therefore, establishing the effects of the program on
migration provides a first step for further research on long-term outcomes that are unable
to be examined in more recent programs. My analysis of the fertility rates for the second-
generation of program participants provides some preliminary evidence of long-run outcomes
of the program.
Finally, this paper also adds to the discussion of Indigenous population migration, par-
ticularly regarding migration off reservations. There have been a number of papers that
have examined the unique factors that contribute specifically to the migration outcomes of
Indigenous populations (Cebula & Belton, 1994; Davis et al., 2017; Gardner, 1994; Geib,
2001; Huskey et al., 2004). My research contributes to this literature by analyzing how this
type of jobs-related relocation program affects the migration patterns of Native Americans.
I employ a generalized difference-in-differences approach to answer the question of how
3

the Relocation Program affected Native American migration patterns. For my main spec-
ification, I use decennial census data to compare the American Indian and Alaska Native
population in the relocation target cities to populations in all other metropolitan statistical
areas (MSAs). I find that there was a large and statistically significant increase in the Native
American population in the program’s target cities relative to the other MSAs. The baseline
estimates suggest that there was an increase in the Native American population of almost
12,000 individuals on average in the target MSAs relative to the non-target MSAs between
1960 and 1990. The magnitude of this estimate is particularly stark given that the median
MSA had a Native American population of less than 100 (with a mean population of about
1,000) in 1950, just prior to the start of the program. The effect of the program is consistent
in magnitude and significance across various subsets of the main control group. Further,
the results remain significant when I apply a doubly robust difference-in-differences specifi-
cation using propensity-score methods though the magnitude is somewhat attenuated. To
provide some insight into the magnitude of this impact on tribal land areas, I also calculate
counterfactual population estimates for tribal land areas absent the program.
In addition to the main migration results, I also examine the impacts of the Relocation
Program on second-generation fertility. I analyze fertility for a number of reasons. Firstly,
fertility is a fundamentally important question in this setting where the government has
historically played a role in reducing the Native American population and where there is
a concurrent program of forcible sterilization at government run clinics on reservations.5
Further, second-generation fertility provides key insights into the long-run impacts of the
program on the primary goal of relocating the Native American population. Differential
fertility rates across different locations can alter the spatial distribution of populations over
time and is therefore vital to understanding the lasting impacts of relocation. Lastly, fer-
tility can also provide some noisy indication about the long-run impacts of relocation on
other outcomes, such as economic well-being and assimilation, both of which have known
5The forced sterilization of Native American women in the 1970s is discussed further in the fertility resultssection as it provides important context for the study of fertility in this time period.
4

associations with changes in fertility in certain cases.
I find that there is a gap in the general fertility rate among Native American women living
in urban areas in the 1990s relative to Native American women who live in tribal land areas
during this period. Specifically, the data show that the fertility rate for Native American
women living in cities was almost half that of those living in the rural parts of states with large
tribal land areas. While this finding does not imply causality, it suggests changes in fertility
outcomes among the children of those who were affected by the Relocation Program. This
result could have important implications for the future of the Native American population
distribution across the US and for other programs that target or induce migration.
The remainder of the paper is organized as follows. Section 2 provides background
on the Relocation Program and some related tribal policy at the time of the program.
Section 3 describes the data, and section 4 lays out the main methodological approaches.
Section 5 presents the results for the primary outcome, migration. It includes both the
baseline estimates as well as several robustness checks and alternative specifications. Section
6 outlines the fertility differences for second generation Native American, and section 7 gives
counterfactual population estimates for tribal land areas. Section 8 concludes.
2 Background
The Relocation Program began in 1952 during what is known as the termination era
of US tribal policy. The joint policies of termination and relocation aimed to assimilate
the Native American population and move them off tribal lands by terminating tribal trust
relationships with the US federal government and urging Native Americans to relocate to
urban centers, away from reservations. While this paper focuses on the effects of the latter
policy, I also include a brief outline of the termination policy as the two were inextricably
linked.
5

2.1 Relocation
The Relocation Program originally began as part of an $88 million, ten-year rehabilitation
act passed by Congress in April of 1950 which aimed to aid the Navajo and Hopi Reservations
after an extreme summer drought and severe winter at the end of the 1940s devastated the
area. In addition to providing for a number of reservation development programs, the bill also
allocated funds to provide financial aid to individuals for finding off-reservation employment.
Specifically, the bill provided payment of relocation expenses and direct employment services
for individuals from the Navajo and Hopi Reservations who moved to Denver, Salt Lake City,
or Los Angeles. The program was almost immediately expanded by the Bureau of Indian
Affairs6 (BIA) to allow for individuals from any US tribe to participate. During this period,
the BIA was run by Dillon S. Myer. It is important to note, that prior to being named
Commissioner of Indian Affairs in 1950, Myer served as the director of the War Relocation
Authority, the agency charged with the internment of Japanese Americans during WWII.
He brought many of his colleagues from the War Relocation Services with him to work at
the BIA in implementing the Relocation Program on a national scale. The first relocatees
of what became the Relocation Program arrived at the newly opened relocation office of
Chicago in February of 1952 (Fixico, 1980).
The Relocation Program grew throughout the early 1950s. In addition to the relocation
offices in Denver, Salt Lake City, Los Angeles, and Chicago, offices were added in Cleveland,
Cincinnati, Dallas, St. Louis, and San Francisco. The BIA chose these cities for reloca-
tion offices because of their “diversified, abundant industrial employment” (Madigan, 1956).
While there is little in the historical record directly addressing the choice of relocation cities
beyond this quote from Madigan (1956), most sources do note that the aim of the program
was to provide resettlement to areas with more job opportunities than were available on the
6The Bureau of Indian Affairs was established in 1824 under the Department of War but became part of theDepartment of the Interior after its establishment in 1849. The BIA acts as a liaison between the federalgovernment and sovereign tribes. The president and Congress are responsible for creating federal tribalpolicy, and the BIA is responsible for administering the policies.
6

reservations.
The first step in the relocation process was to apply at a local BIA area office. There
were no demographic restrictions, such as age or gender, on who could apply, although
Madigan (1956) suggests that acceptance was based on the relocation officer’s expectations
of an applicant’s success in the program. Records show that drunkenness, physical or mental
health issues, marital problems, or arrests were all grounds for disqualification of applicants.
There were also complaints of prejudice among the relocation officers who were mostly non-
Native American (Fixico, 1980).
Upon acceptance to the program, a relocatee and her family received one-way tickets to
one of the relocation cities in the relocatee’s top choices as well as money for the journey.
In their relocation city, the relocatee met the relocation officer who would assist relocatees
in finding temporary housing and provide financial assistance for the first month, including
money for rent and some money for clothes and food. Additionally, the relocation officer
would provide the relocatee with “intensive employment counseling” (Madigan, 1956).
Criticisms of the program, including complaints of slum housing, temporary and unstable
job placements, and inadequate preparation for cultural differences, pushed Congress to
reassess the program in 1955 and 1956. Congress responded with the passage of Public
Law 959–also known as the Indian Relocation Act of 1956–which consisted of two additional
components: adult vocational training and on-the-job training. The adult vocational training
program trained participants in industrial skills such as plumbing or steel work and targeted
individuals between the ages of 18 and 35. The on-the-job training program focused on
finding employment opportunities near reservations where individuals could be trained in
a specific industry while working. The BIA would subsidize wages of trainees during their
training period with the possibility of the trainees gaining full employment upon completion
of the training. These training programs were meant to serve as a precursor to relocation in
an attempt to better prepare relocatees for life in the relocation cities (Fixico, 1980).
7

2.2 Termination
During the same time as the Relocation Program was being adopted, the federal gov-
ernment was also advancing assimilationist goals through termination policy. Termination
policy consisted of ending the trust relationship between tribes and the US federal govern-
ment. This meant that if a tribe was officially terminated, then any land that belonged to
the tribe would be released from its trust status, which generally resulted in the land being
appraised and sold to the highest bidder with the proceeds from the sale distributed to the
members of the terminated tribe. Additionally, Native Americans who were part of the ter-
minated tribe would be subject to state and federal laws and taxation from which they were
previously exempt, and all special federal programs at the tribal and individual level were
discontinued. Essentially, termination meant the end of tribal sovereignty as without land,
tribal governments had nowhere to exert their jurisdiction (Wilkinson & Biggs, 1977). The
stated aim of termination was to “make Indians within the territorial limits of the United
States subject to the same laws and entitled to the same privileges and responsibilities as
are applicable to other citizens of the United States, to end their status as wards of the
United States and the grant them all of the rights and prerogatives pertaining to American
citizenship.7” Advocates of termination had two main motivators. First, they wanted to
“free” Native Americans from the federal trusteeship which proponents of termination be-
lieved was paternalistic and kept Native Americans dependent on government aid. Secondly,
terminationists wanted to reduce the amount of federal funds allocated to tribal programs.
Those opposed to termination cited the desire of many Native Americans to keep reserva-
tions intact to preserve tribal homelands and to avoid the loss of sovereignty that comes with
loss of communal property. Additionally, termination opponents also condemned the meager
payment on assets in the forced sale of tribal land and suggested that high poverty rates
on reservations were evidence of continued need for federal education, health, and welfare
services (Sorkin, 1971). One of the most critical opponents of termination, former Com-
7House Concurrent Resolution no. 108
8

missioner of Indian Affairs, John Collier, asserted that termination was truly motivated by
greed for land and natural resources owned by the tribes (Fixico, 1980).
In 1953, House Concurrent Resolution no. 108 was passed. It called for the termination
of roughly 100 tribes throughout California, Florida, New York, Texas, Wisconsin, Oregon,
Utah, Oklahoma, South Carolina, and Nebraska, affecting over 10,000 Native Americans and
over 1 million acres of tribal land. Tribal consent was not deemed necessary, but tribes were
nonetheless often coerced into providing consent. At the same time, Congress passed another
law aimed at termination which granted states jurisdiction over civil and criminal offenses
on tribal land in five states, while allowing for all other states to adopt similar practices if
they chose. Strong opposition to these termination policies and poor outcomes among early
terminated tribes led to a reversal of policy in the 1960s, though many of the terminated
tribes did not regain tribal status until much later (Wilkinson & Biggs, 1977).
Given that I estimate migration impacts of the Relocation Program that are substantially
larger than the total number of Native Americans directly affected by the termination of their
tribes, I do not believe that termination itself is the main driver of my results. However, the
threat of termination and the environment that the termination policy demonstrates serve
as important context for understanding the main results.
3 Data
3.1 Migration
The main data I use to measure migration comes from the U.S. Decennial Census. Specif-
ically, I use population estimates for the American Indian and Alaska Native (AIAN) pop-
ulation by county and by metropolitan statistical area (MSA). For the years 1910-1940, I
calculate county-level population by race, by aggregating the Integrated Public Use Micro-
data Series (IPUMS) complete count U.S. census microdata. For the years 1950 onward,
county-level population estimates for the American Indian and Alaska Native population
9

and the total population come from U.S. Decennial Census Publications which have, in
part, been digitized by Gardner and Cohen (1992) and Haines (2010). All of the county-
level population estimates are corrected for changing county borders following Eckert et al.
(2020). The final county population estimates follow 1990 county borders. I then match
these counties to the 1990 U.S. Census MSAs to create MSA-level population counts. The
final dataset contains population estimates for the American Indian and Alaska Native and
total population for each MSA in the United States for every decennial year from 1910-1990.
In addition to the county-level population data, I also use the IPUMS full count data from
1930-1940 and the 1-5% samples from 1950-1980 to determine migration patterns for a small
number of Native American individuals. Specifically, I use the place of birth and current
place of residence variables to document where individuals who identified as American Indian
or Alaska Native migrated during this period.
3.2 Fertility
To examine fertility outcomes, I use the National Center for Health Statistic’s (NCHS)
Vital Statistics Natality Birth Data along with the Survey of Epidemiology and End Results
(SEER) U.S. state and county population data. The natality data contains all births in
the United States from 1985-2002 with information on the year of the birth as well as
the mother’s race, current place of residence, and age. The SEER population data gives
population estimates at the county level by race, sex, and single year of age from 1990-2018.
I combine these data from 1990-2002 to create general fertility rates by place of residence,
year, and race.
I break up the fertility data into three types of locations: target MSAs, other MSAs,
and the non-MSA parts of tribal states. I designate a state as “tribal” if in all years prior
to 1952, at least 1% of the population identified as American Indian or Alaska Native in
the decennial census.8 Because the place of residence variable is censored in the publicly
8These states are Arizona, Montana, Nevada, New Mexico, Oklahoma, and South Dakota
10
available natality data for counties with less than 100,000 people, I am unable to examine
the fertility rates specifically for tribal lands. Instead, I use the tribal states as a proxy for
people living on tribal lands as most of the Native American population lived on tribal land
prior to the relocation program.
The general fertility rate equals the total number of births for a given location category
in a given year divided by the total female population aged 15-45 for that location category
and year multiplied by 1000. Therefore, the general fertility rate represents the total births
per 1000 women aged 15-45 for the given location type in a given year.
4 Methodology
4.1 Migration
My main approach for answering the question of how the Relocation Program affected mi-
gration patterns to urban areas is a generalized difference-in-differences specification. Here,
the two dimensions of the difference-in-differences approach are (1) geography: whether or
not the MSA was targeted by the program and (2) time: when the MSA was targeted (if it
was ever targeted). The main estimating equation takes the following form.
For MSA, m, in decennial year, y:
AIANPopulationmy = β(TargetMSAm × Posty) + γm + δy + εmy
The dependent variable is the total Native American population in MSA, m, in a decen-
nial year, y. For the main analysis, I include all MSAs. Thus, MSAs not targeted by the
Relocation Program act as the control group. Note that non-MSA areas are dropped. In the
map in Figure 1, the target cities appear in orange, while the main control group includes
both the green areas (MSAs near reservations) and purple areas (MSAs that are not near
11

reservations). The tribal lands and Oklahoma tribal statistical areas9 are shown in dark blue
and light blue, respectively, for reference.
Figure 1: Map of Relocation Program Target MSAs
Target MSA Near MSA Far MSA Tribal Land Oklahoma Tribal Statistical Area
Notes: MSA borders are based on the 1990 census and tribal land borders are based on 2018 borders.Sources: MSA: NHGIS; Tribal Lands: Bureau of Indian Affairs (BIA) Branch of Geospatial Support (BOGS)New Land Area Representation GIS dataset 2018
The independent variable of interest is the interaction between TargetMSAm and Posty.
TargetMSAm is a dummy variable indicating that the MSA, m, is one of the cities targeted
by the Relocation Program.10 Posty is a dummy variable indicating that the decennial year,
y, is after the start of the program in 1952. This means that for each of the decennial years
from 1960 onwards, Posty takes on a value of 1, while for each of the decennial years from
9Oklahoma Tribal Statistical Areas represent former reservation lands that existed prior to Oklahoma’sstatehood in 1907. The borders were determined by the U.S. Census Bureau in consultation with theAmerican Indian tribes residing in Oklahoma.
10The target cities used for this analysis are Chicago, Cincinnati, Cleveland, Dallas, Denver, Los Angeles,San Francisco, San Jose, Salt Lake City, and St. Louis. An official list of target cities for the RelocationProgram is not fully identified among historians. For this paper, I utilize the most consistent list of citiesI was able to find in the available historical literature and administrative records.
12
1910-1950, Posty is 0. The interaction of these dummies gives us the program effect. γm
and δy represent fixed effects for the MSA and decennial year, respectively. εmy is the error
term. The errors throughout the primary analysis are clustered at the MSA.
Identification for determining a causal effect of the program on migration relies on the
assumption that absent the treatment, the control and treatment MSAs would have similar
trends in Native American population counts. One way that this assumption is often sup-
ported is by showing parallel trends of the treatment and control units in the pre-treatment
period. Figure 2 shows the trends in the Native American population for the three types
of MSAs: the target MSAs, near tribal land MSAs, and all other MSAs. The colors in
Figure 2 correspond to the map above as a reference for which MSAs fall into which of the
three MSA types. Figure 2 suggests that prior to the introduction of the program, all three
types of MSAs had similar average levels (near zero) and trends (no growth) in the Native
American population. After the introduction of the program in 1952, we see that the average
Native American population in target MSAs quickly grows substantially larger than in the
other two types of MSAs, providing a first indication that the program did have an effect on
Native American migration patterns. To more carefully examine whether the parallel trends
assumption likely holds, I also conduct an event study which supports the assumption that
prior to the implementation of the Relocation Program, target MSAs and all other MSAs
had similar trends in Native American population counts.
13

Figure 2: Native American Population Trends by MSA Type
0
5,000
10,000
15,000
20,000
25,000
1920 1940 1960 1980
Ave
rage
Nat
ive
Am
eric
an P
opul
atio
n
MSA Type
Target MSAs
Near MSAs
Far MSAs
Notes: Trends for the target and non-target MSAs from 1910-1990. Non-target MSAs are broken into twogroups based on proximity to tribal land. The points represent average MSA Native American population.Best fit lines are estimated by MSA type for the pre and post periods. The dotted lines correspond to thestart and end of the Relocation Program in 1952 and 1973, respectively. The standard errors are clusteredat the MSA.Sources: Author’s calculations from Decennial Census Data
Using all other MSAs as the control group, however, has its drawbacks as the cities
targeted by the program were mainly located in the West and Midwest, where there is more
tribal land, while the majority the MSAs in the US are located in the South and on the
East Coast. The geographic concentration of the target MSAs relative to the set of control
MSAs could be a problem given that the start of the program coincided with the end of
WWII which also may have been related to Native American migration to urban centers.
If there was greater migration after the end of the war to cities near tribal lands, then
this migration to target cities could in part be driven by post-WWII migration patterns
rather than program effects. Therefore, I employ several more restrictive control groups in
additional specifications. The first alternative control group includes only MSAs located
14

near tribal land (MSAs colored green in Figure 1).11 Near tribal land MSAs are chosen as
they offer a plausible lowest cost alternative to migration through the Relocation Program
as they were likely easier and cheaper to get to than other MSAs. One drawback of using
this alternative control group is that with the expansion of the program in 1956 to include
vocational and on-the-job training in areas closer to tribal land, it’s possible that people
chose to stay in these near tribal land cities where the job trainings took place rather than
participating in the direct employment program after their training period ended. Thus,
these MSAs may not be unaffected by the program. Therefore, the second alternative control
group I consider is far from tribal land MSAs. This control groups includes only the MSAs
that are not included in the near tribal land MSA group (shown in purple in Figure 1). This
control group is considered because it is the least likely control group to be at all affected by
the actual treatment from the program. The third alternative control group includes only
the MSAs that are in the same state as a target MSA. This sample includes all MSAs in
California, Colorado, Illinois, Indiana, Missouri, Ohio, Texas, Utah, and Wisconsin. Finally,
all but one of the target MSAs were among the top fifty most populous cities in the US at the
time of the program’s development. The fact that the target cities were more populous on
average than the group of all other MSAs could have important consequences for my analysis
since I am specifically looking at population changes. Therefore, the final alternative control
group includes only the top fifty most populous MSAs in 1950.
4.2 Fertility
To study the impacts of the Relocation Program on fertility, I compare second-generation
fertility rates for women living in target cities to those of women living in other urban areas
and the rural parts of tribal states. I focus specifically on second-generation outcomes for two
reason. First, the previous migration program literature has suggested that the economic
and health outcomes of such programs are greatest for those of the second-generation or
11An MSA is considered a near tribal land MSA if it is the closest MSA to at least one tribal land areameasuring from centroid to centroid.
15

the children of movers. Secondly, the publicly available data on births in the US that is
disaggregated by geographic region and race is only available starting in 1990. Given the
time of the program, the sample of women who are of childbearing age from 1990 onward is
mainly second-generation women.
The main measure of fertility that I use is the generalized fertility rate which gives the
number of births per 1000 women of childbearing age (15-45). Specifically, I calculate the
generalized fertility rate for each year from 1990 to 2002 for three racial groups, namely,
white, black, and Native American, and by three types of residence: target MSA, non-target
MSA, and rural parts of tribal states. The rural parts of tribal states area of residence
includes all areas of tribal states that are not included in an MSA in 1990. I compare
the general fertility rate across these three racial groups and the three types of residence
to determine the unique fertility patterns among Native American women in target MSAs.
While the fertility analysis does not provide causal estimates for the affect of the program on
fertility outcomes, it does provide descriptive evidence into how fertility rates differ between
these groups, providing valuable insight into how the program may impact long-term health
and demographic outcomes.
5 Results
5.1 Main Approach
The results of the main analysis are presented in Table 1. Column 1 shows the results of
the simple OLS specification without fixed effects, and column 2 adds year and MSA fixed
effects. Both columns show a positive and statistically significant increase in the Native
American population associated with the implementation of the Relocation Program. The
estimates suggest that, on average, between 1960 and 1990, the Relocation Program increased
the Native American population in target cities by almost 12,000 individuals relative to all
other MSAs. This constitutes a major shift in the Native American population of these
16

target cities considering that prior to the program the average MSA had a Native American
population of about 1,000 people and the median MSA, less than 100 people.
Table 1: Baseline Native American Population Response to the Relocation Program
Dependent variable: Native American Population
(1) (2)
Post 1,446∗∗∗
(186)
Target MSA 432(362)
Target MSA × 11,856∗∗ 11,866∗∗
Post (5,394) (5,392)
Constant 197∗∗∗
(40)
MSA FE No YesYear FE No YesObservations 2,526 2,526R2 0.167 0.524
Notes: ∗p<0.1; ∗∗p<0.05; ∗∗∗p<0.01. The Native American population data is the total number of individu-als registered by the U.S. Census Bureau as American Indian or Alaska Native for each decennial census year1910-1990 by MSA. Here, the control group consists of all MSAs that were not targeted by the RelocationProgram. Standard errors are clustered at the MSA.
As a supplement to the main approach, I also run an event study analysis to examine
how this average effect was distributed throughout the course of the program and to further
establish the parallel trends assumption. The results of the event study are shown in Figure
3, which plots the interaction of the TargetCitym variable with each decennial year from
1910-1990. 1950 is the reference year. As noted in the methodology section, it is clear that
prior to the implementation of the program, trends in Native American population for target
and non-target MSAs are very similar. After the program was implemented in 1952, we can
see that there is a sharp increase in the number of Native American individuals living in the
target cities relative to all other MSAs. This increase in the target MSA Native American
17

population relative to the other MSAs continues through 1970 and 1980. After 1980, the
effects of the program level off. This is not surprising as the program ended in 1973 (17
years prior to the 1990 census).
Figure 3: Estimates of the Relocation Program’s Migration Effects over Time
0
10,000
20,000
30,000
1920 1940 1960 1980
Coe
ffici
ent E
stim
ate
Notes: The figure shows the coefficent estimates for the interaction of the target city dummy and each of thedecennial years. The estimating equation includes MSA fixed effects, and the standard errors are clustered atthe MSA. The gray ribbon represents the 95% confidence interval. The dotted lines represent the beginningand end of the program in 1952 and 1973, respectively
Finally, I also estimate the main regression with a number of different control groups as
described in the methodology section. Table 2 shows the results of these regressions. For
column 1, the control group is just the MSAs that are near tribal lands. These are the
MSAs shown in green in Figure 1. For column 2, the control group is just the MSAs that
are far away from tribal lands, as shown in purple in Figure 1. The control group in column
3 includes only the MSAs that are located in states with target MSAs. Column 4 uses a
control group that consists of only the 50 most populous MSAs around the time the target
locations were being chosen in 1950. All four columns produce estimates that are similar in
significance and magnitude to the baseline specification, further solidifying the main results
18
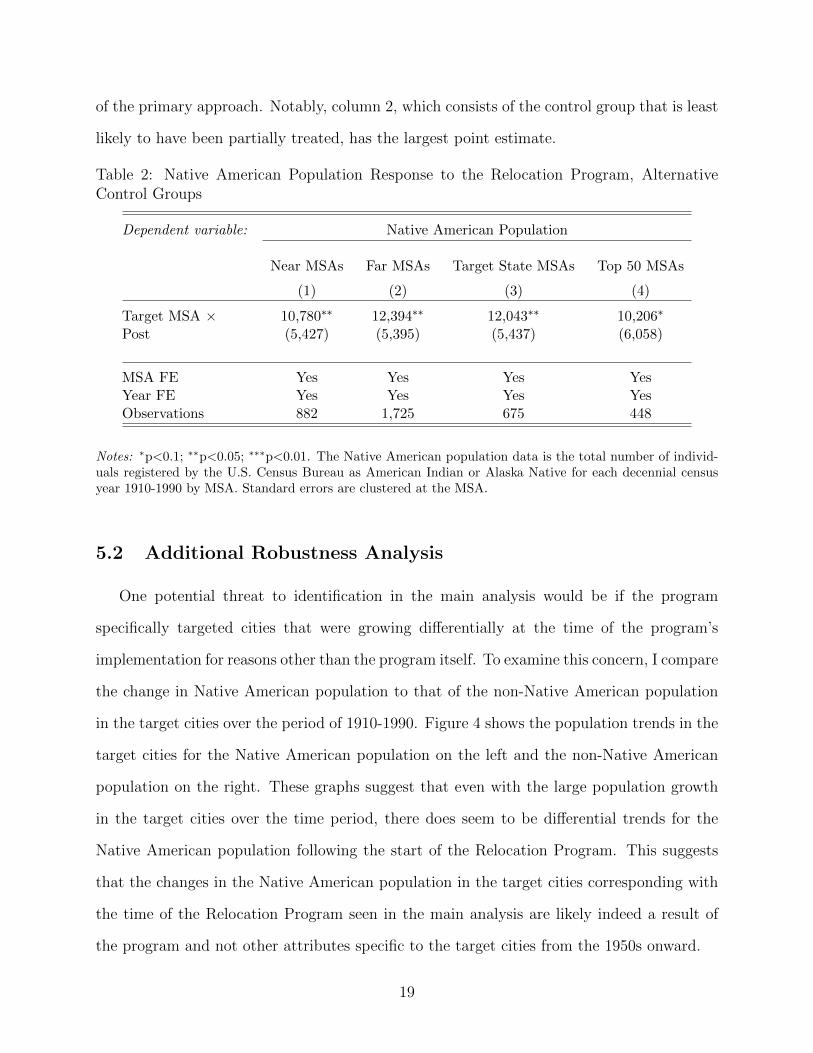
of the primary approach. Notably, column 2, which consists of the control group that is least
likely to have been partially treated, has the largest point estimate.
Table 2: Native American Population Response to the Relocation Program, AlternativeControl Groups
Dependent variable: Native American Population
Near MSAs Far MSAs Target State MSAs Top 50 MSAs
(1) (2) (3) (4)
Target MSA × 10,780∗∗ 12,394∗∗ 12,043∗∗ 10,206∗
Post (5,427) (5,395) (5,437) (6,058)
MSA FE Yes Yes Yes YesYear FE Yes Yes Yes YesObservations 882 1,725 675 448
Notes: ∗p<0.1; ∗∗p<0.05; ∗∗∗p<0.01. The Native American population data is the total number of individ-uals registered by the U.S. Census Bureau as American Indian or Alaska Native for each decennial censusyear 1910-1990 by MSA. Standard errors are clustered at the MSA.
5.2 Additional Robustness Analysis
One potential threat to identification in the main analysis would be if the program
specifically targeted cities that were growing differentially at the time of the program’s
implementation for reasons other than the program itself. To examine this concern, I compare
the change in Native American population to that of the non-Native American population
in the target cities over the period of 1910-1990. Figure 4 shows the population trends in the
target cities for the Native American population on the left and the non-Native American
population on the right. These graphs suggest that even with the large population growth
in the target cities over the time period, there does seem to be differential trends for the
Native American population following the start of the Relocation Program. This suggests
that the changes in the Native American population in the target cities corresponding with
the time of the Relocation Program seen in the main analysis are likely indeed a result of
the program and not other attributes specific to the target cities from the 1950s onward.
19

Figure 4: Target City Population Trends by Race
Native American Non−Native American
1920 1940 1960 1980 1920 1940 1960 19800
5,000,000
10,000,000
0
25,000
50,000
75,000
Ave
rage
Pop
ulat
ion
Notes: The bold lines estimate linear trends in MSA population by race for the pre and post periods.Background lines show individual MSA population totals by race for each of the target cities. The dottedlines depict the start and end of the Relocation Program in 1952 and 1973, respectively.Sources: Author’s calculations from Decennial Census Data
Given that one of the program’s main aims was to move Native Americans off of tribal
lands to urban centers, I also compare the average Native American population in target
MSAs to the Native American population on tribal lands. Because there is no data available
on Native American population counts by reservation throughout this time period, I examine
Native American population counts at the county level. Specifically, I compare average
Native American population counts in counties that are in target MSAs to those counties
that contain tribal land as shown in Figure 5. Figure 5 suggests that the increase in the
Native American population in the target MSAs is so large that the average county-level
target MSA Native American population may even exceed that of tribal land counties by
the end of the relocation program.
I also verify my main results by using a doubly robust difference-in-differences specifi-
cation. The second level of robustness relies upon the propensity-score methods literature
(Rosenbaum & Rubin, 1983)—i.e., inverse probability weighting. Using logistic regression,
I model the probability of an MSA being targeted by the program as a function of total
20

Figure 5: Native American Population Trends for Target MSAs versus Tribal Land
0
1000
2000
3000
1920 1940 1960 1980
Ave
rage
Nat
ive
Am
eric
an P
opul
atio
n
Target MSA Counties
Tribal Land Counties
Notes: Trends in average county-level Native American population for the target MSA and tribal landcounties from 1910-1990. Best fit lines are estimated by county type for the pre and post periods. Thedotted lines correspond to the start and end of the Relocation Program in 1952 and 1973, respectively.
population, percent of the population that is non-white, percent change in the total pop-
ulation since 1940, percent change in the non-white population since 1940, the male and
female employment rate, and the minimum distance to a tribal land area. Using the logit
regression estimates, I calculate inverse probability of treatment weights using the formula:
wi = TargetMSAm
pm+ 1−TargetMSAm
1−pm, and apply these weights to my baseline difference-in-
differences estimating equation to form a doubly robust estimator (Hirano et al., 2003). The
results of the doubly robust inverse probability weighted regression are found in Table 3.
While the estimate of the coefficient of interest on the interaction of TargetMSA × Post
is smaller than the baseline estimate, it is well within the traditional confidence intervals
and still suggests substantial movement of the Native American population as a result of the
Relocation Program.
Finally, up to this point, my analysis has focused on total population counts rather
than specific migration variables. This is mainly due to a lack of available data on Native
American migration over the period during which the program ran. There is, however, a
21

Table 3: Doubly Robust DiD using Inverse Probability of Treatment Weighting
Dependent variable: Native American Population
Target MSA × 6,714∗∗∗
Post (2,273)
MSA FE YesYear FE YesObservations 954
Notes: ∗p<0.1; ∗∗p<0.05; ∗∗∗p<0.01. The Native American population data is the total number of individ-uals registered by the U.S. Census Bureau as American Indian or Alaska Native for each decennial censusyear 1910-1990 by MSA. Standard errors are clustered at the MSA.
limited amount of data available in the IPUMS samples which I use to examine migration
in Figure 6. Here I explore the place of residence by year for Native Americans born in
one of the six states with the highest Native American population prior to the start of the
program in 1952.12 Figure 6 shows the average percent of individuals who were born in a
tribal state that are living in a target MSA versus the average percent living in a non-target
MSA at the time of the census. While migration out of tribal states seems to be increasing
for both groups in 1960 and 1970, there is a much higher average percent of people moving
to the target MSAs than non-target MSAs. Overall, this supports the main findings that
Native Americans were migrating to target cities more than other MSAs during the time of
the Relocation Program.
12The tribal states here are the same those chosen for the fertility analysis. As a reminder these states arethose with at least 1% of the population identifying as American Indian or Alaska Native in the decennialcensus for all years 1910-1950.
22

Figure 6: Migration Trends for Native Americans Born in Tribal States
0.00%
0.10%
0.20%
0.30%
0.40%
0.50%
0.60%
1940 1960 1980
Ave
rage
per
cent
of N
ativ
e A
mer
ican
pop
ulat
ion
bor
n in
a tr
ibal
sta
te th
at m
oved
to a
n M
SA
Target MSAs
Other MSAs
Notes: Lines show the average percent of the Native American population that was born in one of the sixtribal states that now live in an MSA. The MSAs are broken into two types based on whether or not theMSA was a target MSA.Sources: Author’s calculations from IPUMS Data
6 Fertility Differences
The fundamental aim of the Relocation Program was to alter the distribution of Native
Americans in the US and to promote assimilation. In the preceding sections, I have docu-
mented the cross-sectional effects of the program, which show a shift in the Native American
population from rural reservations to urban centers targeted by the Relocation Program.
In this section, I examine the long-run fertility differences among Native American women
living in target MSAs versus tribal states.
Before I present my fertility results, it is important to note that in the 1970s there was
widespread forced sterilization of Native American women living on reservations. Because
the Indian Health Services had such singular control over healthcare on tribal lands, Native
American women were particularly vulnerable to this practice during this period. Estimates
suggest that one in four Native American women of childbearing age were forcibly sterilized
23

at this time (Lawrence, 2000). Given that I see even lower rates of fertility for Native
American women living in urban areas compared to tribal land ares, this period of forced
sterilization does not change how I understand these fertility data as they relate to the
Relocation Program. It does, however, provide important context for this discussion.
Figure 7: General Fertility Rate by Race and Current Residence
40
60
80
100
1990 1993 1996 1999 2002
Gen
eral
Fer
tility
Rat
e
Line Color
White
Black
Native American
Line Type
Other MSA
Rural Tribal State
Target MSA
Notes: The general fertility rate represents the number of births per 1,000 women age 15-45. The lines aboveshow the general fertility rate by race for each of three types of current residence: target MSA, other MSA,and rural tribal state.Sources: Author’s calculations from NVSS Natality and SEER population data
Figure 7 shows the general fertility rate for Native American women living in target
MSAs, non-target MSAs, and the rural parts of tribal states from 1990 to 2002. Figure 7
suggests that there is a large gap in the fertility rate between those individuals living in an
MSA versus those living in non-MSA areas of tribal states. This provides some preliminary
evidence of how the Relocation Program may have contributed to shifting fertility outcomes
for Native American women.
24

Figure 8: General Fertility Rate by Age
31−35 36−40 41−45
15−20 21−25 26−30
1991 1996 2001 1991 1996 2001 1991 1996 2001
0
50
100
150
200
0
50
100
150
200
Gen
eral
Fer
tility
Rat
e
Line Color
White
Black
Native American
Line Type
Other MSA
Rural Tribal State
Target MSA
Notes: The general fertility rate by age represents the number of births to women within the specified agerange per 1,000 women in the age group.Sources: Author’s calculations from NVSS Natality and SEER population data
Figure 8 disaggregates the fertility rate by age and shows that the gap is largest for
women ages 21-25, with the gap shrinking steadily in the older age groups. This suggests
that Native American women living in cities are likely both delaying fertility as well as
having less children overall. Given the timing of the program, these women whose fertility
I am examining here can most likely be considered part of the second generation of movers
(i.e., the children of the original movers who were part of the program). Further research
into the first generation’s fertility outcomes and additional heterogeneity analysis may help
explain the mechanisms driving the disparity in fertility rates seen here.13 The fact that
these differences in fertility exist in the generation after the Relocation Program, however,
suggests long-term, persistent demographic effects from the two-decade long program.
13A lack of available Native American population data disaggregated by sex and age precludes me fromanalyzing these questions here.
25

7 Tribal Land Population Counterfactuals
To better understand the magnitude of these migration and fertility effects on the tribal
land population, I calculate a set of back-of-the-envelope counterfactual population estimates
for the tribal land areas. I consider four possible counterfactual populations:
(1) Adjusted Migration, Unadjusted Birth Rate: the tribal land population had those
induced to migrate by the program remained on tribal land with no adjustment to the
birth rate for the period of forced sterilization
(2) Adjusted Migration, Adjusted Birth Rate: the tribal land population had those
induced to migrate by the program remained on tribal land and had there been a 33%
increase in the birth rate on tribal lands after 1970 to correct for the estimated one
quarter of women forcibly sterilized
(3) Unadjusted Migration, Adjusted Birth Rate: the tribal land population with no
migration adjustment but with a 33% increase in the birth rate on tribal lands after
1970 to correct for the estimated one quarter of women forcibly sterilized
(4) Unadjusted Migration, Unadjusted Birth Rate: the tribal land population with no
migration adjustment and with no adjustment made to the birth rate
I create this fourth counterfactual population estimate with no adjustments for migration
or forced sterilization as a comparison group for the other three population estimates rather
than using the census population estimates because there is a substantial increase in indi-
viduals identifying as “American Indian/Alaksa Native” in the census during this period.
There is no evidence of a differential increase in identifying as Native American across my
treatment and control MSAs, so this should not cause any problems for the identification of
my main findings. It does, however, make it hard to compare my counterfactual population
estimates. Thus, I will instead be using the population described in (4) above as a estimate
of what the population growth on the tribal lands would have looked like under the actual
historic conditions.
To estimate the counterfactual Native American population living on tribal land, I use
26

the following population growth model:
For decennial year, y:
AIANPopulationy+10 = AIANPopulationy × (1 + r)10 +Migrationy+10
Here, AIANPopulationy is the Native American population living on tribal land in decennial
year y and AIANPopulationy+10 is the Native American population living on tribal land in
the following decennial year, 10 years after y. The variable r is the population growth rate.
r is equal to the per capita birth rate minus the per capita death rate for Native Americans
living in the tribal states–those states with the largest share of Native Americans prior to the
start of the Relocation Program–as described in the data section. Finally, Migrationy+10 is
the estimated total migration in decennial year y+ 10 based on the event study estimates in
Figure 3. I calculate total migration for each decennial year by multiplying the coefficient
by the number of treated units and subtracting the previous decennial year coefficient as the
event study coefficients are cumulative.
27

Figure 9: Counterfactual Native American Population on Tribal Land
250,000
500,000
750,000
1,000,000
1,250,000
1950 1960 1970 1980 1990
Nat
ive
Am
eric
an P
opul
atio
n
Adjusted Migration and Unadjusted Birth RateAdjusted Migration and Adjusted Birth RateUnadjusted Migration and Adjusted Birth RateUnadjusted Migration and Unadjusted Birth Rate
Notes: The four models in the figure match the descriptions at the beginning of this section. Birth anddeath rates are based on number of births and deaths in the tribal states, states with the highest rates ofNative American population prior to relocation, as described in the data section. Population estimates arebased on the Native American population living on tribal land.Sources: Author’s calculations from NVSS Natality data and author estimates of decennial migration inducedby the Relocation Program.
As you can see in Figure 9, there would have been a substantially larger Native American
population living on tribal land in 1990 if individuals had remained on tribal lands rather than
migrating as a result of the Relocation Program. My population growth model suggests that
absent the Relocation Program, there would be over 250,000 additional Native Americans
living on tribal lands in 1990. Thus, in addition to the increased population from returning
the roughly 100,000 estimated migrants back to the tribal land area, there is a further
increase of 150,000 Native Americans living on tribal lands associated with the tribal land
population’s natural growth rate. Moreover, this additional population would have been even
more substantial if the forced sterilization in the 1970s had not decreased the birth rate. In
fact, model 2 suggests that absent these factors, the Native American population living on
tribal lands in 1990 would have been more than 50% larger than that of the unadjusted
population estimated in model 4.
28

8 Conclusion
This paper shows how government-sponsored migration programs can affect the migration
patterns of targeted populations and potentially impact long-run fertility. The Relocation
Program had large and significant impacts on the migration outcomes for Native Americans
in the second half of the 20th century. This policy led to a sorting of the Native American
population into the program’s target MSAs relative to all other MSAs, shaping the distribu-
tion of the Native American population across the United States today. The magnitude of
these impacts for the tribal land area Native American population is made clear in the coun-
terfactual population estimates, which suggest that absent the Relocation Program, there
would have been an addition 250,000 Native American individuals living on tribal lands in
1990. The gap in the fertility rate between Native Americans living in MSAs versus tra-
ditionally high Native American population states suggests that there are likely important
long-run consequences for those affected by the program.
The findings of this paper suggest some fulfillment of the program’s stated aim–to relocate
Native Americans away from tribal lands and into urban centers with the overarching goal
of assimilation. There is strong evidence of relocation of the Native American population to
the cities targeted by the program. Further, the fertility findings provide some suggestive
evidence of assimilation among those living in the target cities.
While I am able to document one important dimension of the Relocation Program by
determining the effects on migratory outcomes, the full impacts of this movement from
reservations to major urban centers have yet to be examined. By establishing the effect of
the Relocation Program on migration, this paper sets up a first stage for further research
into the long-term economic and health outcomes for those induced to move by the program.
29
References
Ablon, J. (1964). Relocated American Indians in the San Francisco Bay Area: Social
interaction and Indian identity. Human Organization, 23 (4), 296-304.
Ablon, J. (1965). American Indian relocation: Problems of dependency and management in
the city. Phylon, 26 (4), 362-371.
Cebula, R. J., & Belton, W. J. (1994). Voting with ones feet: An empirical analysis of
public welfare and migration of the American Indian, 1985-1990. American Journal of
Economics and Sociology , 53 (3), 273-280.
Chadwick, B. A., & White, L. C. (1973). Correlates of length of urban residence among
Spokane Indians. Human Organization, 35 (1), 9-16.
Chetty, R., & Hendren, N. (2018a). The impacts of neighborhoods on intergenerational
mobility I: Childhood exposure effects. Quarterly Journal of Economics , 133 (3), 1107-
1162.
Chetty, R., & Hendren, N. (2018b). The impacts of neighborhoods on intergenerational
mobility II: County-level estimates. Quarterly Journal of Economics , 133 (3), 1163-
1228.
Chetty, R., Hendren, N., & Katz, L. F. (2016). The effects of exposure to better neigh-
borhoods on children: New evidence from the moving to opportunity experiment.
American Economic Review , 106 (4), 855-902.
Davis, J., Sellers, S., Gray, C., & Bilsborrow, R. (2017). Indigenous migration dynam-
ics in the Ecuadorian Amazon: A longitudinal and hierarchical analysis. Journal of
Development Studies , 53 (11), 1849-1864.
Eckert, F., Gvirtz, A., Liang, J., & Peters, M. (2020). A method to construct geographical
crosswalks with an application to US counties since 1790. National Bureau of Economic
Research Working Paper Series , No. 26770 .
Elmhirst, R. (2002). Daughters and displacement: Migration dynamics in an Indonesian
transmigration area. Journal of Development Studies , 38 (5), 143-+.
30

Fixico, D. (1980). Termination and relocation: Federal indian policy in the 1950’s (Unpub-
lished doctoral dissertation). University of Oklahoma, Norman, OK.
Gardner, P. (1994). Aboriginal community incomes and migration in the NWT: Policy issues
and alternatives. Canadian Public Policy-Analyse De Politiques , 20 (3), 297-317.
Geib, E. Z. (2001). Do reservation Native Americans vote with their feet? A re-examination
of Native American migration, 1985-1990. American Journal of Economics and Soci-
ology , 60 (4), 815-827.
Gundlach, J. H., Reid, P. N., & Roberts, A. E. (1977). Migration, labor mobility, and
relocation assistance: The case of the American Indian. Social Service Review , 51 (3),
464-473.
Gundlach, J. H., & Roberts, A. E. (1978). Native American Indian migration and relocation:
Success or failure. Pacific Sociological Review , 21 (1), 117-128.
Hirano, K., Imbens, G. W., & Ridder, G. (2003). Efficient estimation of average treatment
effects using the estimated propensity score. Econometrica, 71 (4), 1161-1189.
Huskey, L., Berman, M., & Hill, A. (2004). Leaving home, returning home: Migration as a
labor market choice for Alaska Natives. Annals of Regional Science, 38 (1), 75-92.
Katz, L. F., Kling, J. R., & Liebman, J. B. (2001). Moving to opportunity in Boston: Early
results of a randomized mobility experiment. Quarterly Journal of Economics , 116 (2),
607-654.
Kling, J. R., Liebman, J. B., & Katz, L. F. (2007). Experimental analysis of neighborhood
effects. Econometrica, 75 (1), 83-119.
Lawrence, J. (2000). The Indian Health Service and the sterilization of Native American
women. American Indian Quarterly , 24 (3), 400-419.
Madigan, L. V. (1956). The American Indian relocation program. New York, NY: The
Association of American Indian Affairs, Inc.
Pollack, C. E., Blackford, A. L., Du, S., Deluca, S., Thornton, R. L. J., & Herring, B. (2019).
Association of receipt of a housing voucher with subsequent hospital utilization and
31

spending. Jama-Journal of the American Medical Association, 322 (21), 2115-2124.
Price, J. A. (1968). Migration and adaptation of American Indians to Los Angeles. Human
Organization, 27 (2), 168-175.
Rosenbaum, P., & Rubin, D. (1983). The central role of the propensity score in observational
studies for causal effects. Biometrika, 70 (1), 41-55.
Sorkin, A. L. (1969). Some aspects of American Indian migration. Social Forces , 48 (2),
243-250.
Sorkin, A. L. (1971). American Indian and federal aid. Washington, D.C.: Brookings
Institute.
Sorkin, A. L. (1978). The urban American Indian. Lexington, MA: Lexington Books.
Thornton, R. (1984). Cherokee population losses during the trail of tears: A new perspective
and a new estimate. Ethnohistory , 31 (4), 289-300.
Wilkinson, C. F., & Biggs, E. R. (1977). The evolution of the termination policy. American
Indian Law Review , 5 (1), 139-184.
32

Appendix
Figure A1: Target City Native American Population Trends
Salt Lake City San Francisco St. Louis
Dallas Denver Los Angeles
Chicago Cincinnati Cleveland
1920 1940 1960 1980 1920 1940 1960 1980 1920 1940 1960 1980
0
25,000
50,000
75,000
100,000
0
25,000
50,000
75,000
100,000
0
25,000
50,000
75,000
100,000
Nat
ive
Am
eric
an P
opul
atio
n
Notes: Total Native American population for each of the target MSAs individually from 1910-1990. Dottedlines represent the start and end of the Relocation Program in 1952 and 1973, respectively.
33

Figure A2: Native American Population Trends by MSA Type, Log Scale
10
100
1000
10000
1920 1940 1960 1980
Ave
rage
Nat
ive
Am
eric
an P
opul
atio
n
MSA Type
Target MSAs
Near MSAs
Far MSAs
Notes: Population Growth for the target and non-target MSAs from 1910-1990. Non-target MSAs arebroken into two groups based on proximity to tribal land. The points represent log average MSA NativeAmerican population. Best fit lines are estimated by MSA type for the pre and post periods. The dottedlines correspond to the start and end of the Relocation Program in 1952 and 1973, respectively.
34