Impacts of the Minimum Wage on Skill Requirements - IFS CEP IFS.pdf · Impacts of the Minimum Wage...
46
Transcript of Impacts of the Minimum Wage on Skill Requirements - IFS CEP IFS.pdf · Impacts of the Minimum Wage...

Intro Data Skill Requirements and MW Hikes Conclusion
Impacts of the Minimum Wage on SkillRequirements
Evidence from job postings
Je�rey Clemens, UCSD & NBERLisa B. Kahn, Yale & NBER
Jonathan Meer, Texas A&M & NBER
October, 2017

Intro Data Skill Requirements and MW Hikes Conclusion
Distributional consequences of the minimum wage?
• Recent wave of local and statutory min wage hikes• ��ght for $15�• federal at $7.25 since 2009
• Generally modest overall employment e�ects of min wage hikes(a la Card and Krueger)
• tho less clear for recent out-of-sample changes
• Should be other margins of adjustment before extensiveemployment e�ects
• Labor-labor substitution may generate distributional impacts• High and low-skilled labor may be production substitutes• Movement along labor supply curve of skilled workers

Intro Data Skill Requirements and MW Hikes Conclusion
This Paper
• Do skill requirements increase following a minimum wage law?
• Data on nearly all jobs posted to an online source from2010-2016
• Gives a ��rst response�• Accurately de�ne �prone� jobs• Explore dynamics within and across employers• Validate with ACS employment data
• Exploit recent wave of statutory minimum wage increases
• Gets at a margin of adjustment that might occur beforeemployment cuts
• non-pecuniary bene�ts (Clemens, Kahn, Meer 2017b)

Intro Data Skill Requirements and MW Hikes Conclusion
The Minimum Wage
010
2030
Num
ber
of s
tate
s$3.0
0$6
.00
$9.0
0
Nom
inal
Min
imum
Wag
e
1980 1990 2000 2010
Ave super-federal state min wageFederal min wageNumber of states mandating super-federal

Intro Data Skill Requirements and MW Hikes Conclusion
Previous Literature
• Large older literature on employment e�ects (a la Card andKrueger, Neumark and Wascher)
• Large e�ects from recent federal minimum wage hikes amonglow-skilled workers (Clemens and Wither 2016, Clemens 2016)
• Employment dynamics: hiring margin more likely a�ected(Meer and West 2016)
• Firm dynamics: putty-clay/capital-labor substitution (Sorkin2015, Aaronson, French, Sorkin, To 2016)

Intro Data Skill Requirements and MW Hikes Conclusion
Previous Literature
• Long conceptual history of labor-labor substitution
• Little recent empirical work• Hamermesh & Grant (1979, 1980), Borjas (1983), etc.• Demographics of employed workers (Neurmark & Wascher1996, Dube, Lester, and Reich 2010, Fairris and Bujunda 2008)
• Giuliano (2013):increased labor supply for more productiveteens at a large retailer
• Horton (2017): employers switch to more productive workersin online platform
• Aaronson and Phelan (2017): shift from cog routine tonon-cognitive employment
• These papers are limited by �ow/stock issues and generalmeasurement problems, and typically in specialized settings
• we can more accurately de�ne bite• provide ��rst response� on the part of �rms• lots of potential to study �rm dynamics (e.g., spillovers andother substitution)

Intro Data Skill Requirements and MW Hikes Conclusion
This Paper
• De�ne �prone� occupations based on OES wage data
• Rich dataset allows us to exploit double and triple di�erencesspeci�cations
• We �nd very robust increases in propensity to ask for a highschool diploma
• 2 percentage points (10%) per $0.70-$3.25 min wage increase• holds up to detailed controls, including at the �rm-level• no impacts on other skills
• Accompanied by increases in skill of employed workers

Intro Data Skill Requirements and MW Hikes Conclusion
Data and Methods

Intro Data Skill Requirements and MW Hikes Conclusion
Job Vacancy Data from Burning Glass
• Scrapes vacancy postings from 40k sites - near universalcoverage of electronic vacancies
• de-duplication algorithm• Captures over 70 �elds• Microdata �rst used by Hershbein and Kahn (2016) to studywhether �rms concentrated technological adoption in theGreat Recession
• Representativeness
• Online vacancies cover ~60-80 percent of all vacancies, higherin high-skilled jobs
• Relative to JOLTS
• Representativeness changes little over our sample period

Intro Data Skill Requirements and MW Hikes Conclusion
Skill Requirements in Burning Glass
• education (HS, AA, BA, MA, Prof)• Education requirements align well with employed workersacross Occupations and MSAs
• experience (yrs in the �eld)
• Deming and Kahn (2017): categorize regularized key wordsinto job skills
• noncognitive: �organized�, �detail-oriented�, �multi-tasking�,�time management�, �meeting deadlines�, �energetic�
• social: �communication�, �teamwork�, �collaboration�,�negotiation�, �presentation�
• (plus 8 others that seem less relevant)

Intro Data Skill Requirements and MW Hikes Conclusion
�Prone� Occupations
• Prone if 10th %ile wage in the 4-digit SOC occupation is inthe bottom decile across all occupations
• based on Occupational Employment Statistics (OES) data2006
• lines up along sensible occupation lines
• Group remaining occupations into deciles 2-5 and 6-10

Intro Data Skill Requirements and MW Hikes Conclusion
�Prone� Occupations
prone: cooks, food prep, bartenders, baristas, waiters, hostesses, dishwashersnot prone: chefs, head cooks, first‐line supervisors
prone: janitors, cleaners, maids, building cleaning, pest controlnot prone: first‐line supervisors, landscapers, pesticide handlers, tree trimmers
prone: animal caretakers/trainers, entertainment attendants, hairdresses/barbers/manicurists, baggage porters/concierges, childcare fitness
not prone: gaming supervisors, first‐line, spa managers, funeral related, tour/travel guidsprone: cashiers, clerks, parts, retail
not prone: first‐line, agents (advertising, insurance, travel), traders, sales reps, real estate brokers, telemarketers, door‐to‐door
prone: Agricultural workersnot prone: first‐line, fishers, hunters, forest and conservation, logging,
Sales
Farming, Fishing, Forestry
Prone occupations = 10th %ile of wage distribution is among the bottom decile of occupations (OES data)Food Prep and
ServingCleaning and Maintenance
Personal Care Services

Intro Data Skill Requirements and MW Hikes Conclusion
Share of ads that are �Prone�, by Industry11 Agriculture 6%
21 Mining 8%
22 Utilities 2%
23 Construction 3%
30 Manufacturing 2%
42 Wholesale Trade 8%
44 Retail Trade 34%
48 Trans, Ware & Util 1%
51 Information 13%
52 Finance & Insurance 2%
53 Real Estate 6%
54 Prof & Sci 3%
55 Managing Co's 6%
56 Admin and Waste 7%
61 Education 4%
62 Health & Soc Assist 5%
71 Arts, Ent, & Rec 33%
72 Accommod & Food 41%
81 Other Services 13%
92 Public Admin 5%
Total 12%

Intro Data Skill Requirements and MW Hikes Conclusion
Summary Statistics
All Prone Deciles 2-5 Deciles 6-10
Occupation Categories:Most Prone Group 0.21 1 0 0
Deciles 2-5 0.41 0 1 0Deciles 6-10 0.38 0 0 1
Education Requirements:Any 0.50 0.32 0.49 0.61HS 0.28 0.28 0.38 0.17BA 0.15 0.03 0.07 0.30
(unweighted)# Ads 70 million 8 million 21 million 41 million# Occupation-State-Date Cells 318,011 35,301 114,308 114,308# Ads Per Cell 219 232 184 241
Occupation Categories:Most Prone Group 0.20 1 0 0
Deciles 2-5 0.41 0 1 0Deciles 6-10 0.39 0 0 1
Characteristics:Less HS 0.09 0.18 0.10 0.03
HS 0.35 0.43 0.45 0.20Age 39.82 34.12 40.33 42.22
Young Adult 0.09 0.25 0.08 0.02
Occupation Categories
Burning Glass Ads
Employed (ACS)

Intro Data Skill Requirements and MW Hikes Conclusion
State Minimum Wage Changes 2010-2016Large Statutory Change:
Alaska
California
DC
Massachusetts
Minnesota
Nebraska
New York
Rhode Island
West Virginia
Small Statutory Change:
Arkansas
Connecticut
Delaware
Hawaii
Maryland
Michigan
New Jersey
Nevada
South Dakota
Vermont
Indexers:
Arizona
Colorado
Florida
Illinois
Missouri
Montana
Ohio
Oregon
Washington
No Change:
Alabama, Georgia, Iowa
Idaho, Indiana, Kansas
Kentucky, Louisiana, Maine
Mississippi, North Carolina
North Dakota, New Hampshire
New Mexico, Oklahoma
Pennsylvania, South Carolina
Tennessee, Texas, Utah
Virginia, Wisconsin, Wyoming
Clemens and Strain
• Indexers have small increases nearly every year (avg $0.20, avg$0.75 over whole time period)
• 1/3 of states with statutory increases have another similarlysized increase roughly a year later
• Most in 2014-2016 (more to come)
Intro Data Skill Requirements and MW Hikes Conclusion
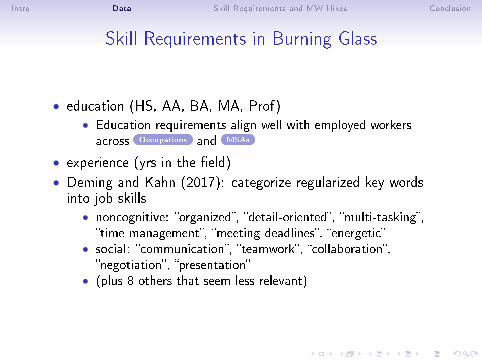
State Minimum Wage Changes 2010-2016
State Total Change over time period # increases Date of First Change
DC $3.25 3 2015
MN $2.25 3 2014
AK $2.00 2 2015
CA $2.00 2 2015
MA $2.00 2 2015
NE $1.75 2 2015
NY $1.75 3 2014
RI $1.60 2 2015
WB $1.50 2 2015
CT $1.35 3 2014
SD $1.30 2 2015
HI $1.25 2 2015
NJ $1.13 2 2014
MI $1.10 2 2014
DE $1.00 2 2014
MD $1.00 2 2015
VT $0.87 2 2015
AR $0.75 2 2015
NV $0.70 1 2011
Satutory Minimum Wage Increases 2010‐2016

Intro Data Skill Requirements and MW Hikes Conclusion
Summary Statistics � non-missing �rm
Statutory Increaser Indexer No ChangeAd Share 0.37 0.24 0.39
Prone Group:Most Prone 0.21 0.21 0.21
Dec 2-5 0.40 0.40 0.42Dec 6-9 0.39 0.38 0.38
HS Diploma Requirement 0.26 0.29 0.29Starting Minimum Wage 7.61 7.57 7.26Ending Minimum Wage 9.28 8.27 7.26
(unweighted)# Ads 26 million 17 million 27 million# Occupation-State-Date Cells 111,521 62,704 143,786# Ads Per Cell 234 268 187
State Group

Intro Data Skill Requirements and MW Hikes Conclusion
Skill Requirements and Min Wage Changes

Intro Data Skill Requirements and MW Hikes Conclusion
High School Diploma (BG)
ALGAIAIDIN
KSKYLAME
MS
NC
NDNHNM
OKPASCTNTXUTVA
WI
WY AZCO
FLILMO
MT
OHOR
WA
AR CTDE
HI
MDMINJNV SDVT
AK
CA DCMA
MN
NE
NY
RI
WV
-.1-.0
50
.05
.1.1
5
0 1 2 3
High Bite Occupations -- HS
ALGAIA
ID
INKS
KY
LA
ME
MSNC
NDNHNM
OKPASCTNTX
UT
VA
WI
WY
AZ
COFLIL MO
MTOHORWA
AR
CTDE
HIMD
MINJ
NV
SD
VT AKCA DCMA
MNNENY
RIWV
-.1-.0
50
.05
.1.1
5
0 1 2 3
Modest Bite Occupations -- HS
ALGAIA
ID
INKSKYLAMEMSNCNDNHNMOKPASCTNTXUTVAWIWY
AZ COFLIL
MOMTOHORWAAR CTDE HI
MDMINJNV SD
VTAKCA DCMA MNNE
NYRIWV
-.1-.0
50
.05
.1.1
5
0 1 2 3
Low Bite Occupations -- HS
Skill
Req
uire
men
t Cha
nge
Minimum Wage Change

Intro Data Skill Requirements and MW Hikes Conclusion
High School Diploma (BG)
ALGAIAIDIN
KSKYLAME
MS
NC
NDNHNM
OKPASCTNTXUTVA
WI
WY AZCO
FLILMO
MT
OHOR
WA
AR CTDE
HI
MDMINJNV SDVT
AK
CA DCMA
MN
NE
NY
RI
WV
-.1-.0
50
.05
.1.1
5
0 1 2 3
High Bite Occupations -- HS
ALGAIA
ID
INKS
KY
LA
ME
MSNC
NDNHNM
OKPASCTNTX
UT
VA
WI
WY
AZ
COFLIL MO
MTOHORWA
AR
CTDE
HIMD
MINJ
NV
SD
VT AKCA DCMA
MNNENY
RIWV
-.1-.0
50
.05
.1.1
5
0 1 2 3
Modest Bite Occupations -- HS
ALGAIA
ID
INKSKYLAMEMSNCNDNHNMOKPASCTNTXUTVAWIWY
AZ COFLIL
MOMTOHORWAAR CTDE HI
MDMINJNV SD
VTAKCA DCMA MNNE
NYRIWV
-.1-.0
50
.05
.1.1
5
0 1 2 3
Low Bite Occupations -- HS
ALGAIAIDINKSKYLA
ME
MSNCNDNHNMOKPASCTNTXUTVAWIWY
AZCOFLIL
MOMTOHORWAAR CT
DE HIMD
MINJ
NV SDVT
AKCA
DCMA MNNE
NY
RIWV-.1
-.05
0.0
5.1
.15
0 1 2 3
Low Bite Occupations -- BA
Skill
Req
uire
men
t Cha
nge
Minimum Wage Change

Intro Data Skill Requirements and MW Hikes Conclusion
Methodology � Di�-n-Di�
skillost = α0+[afterst ∗mw_groups ]α1+I o+I s+I t+controls+εost
• o = 4digit SOC, t = monthly , s = state
• Estimate separate regressions by Bite group
• mw_groups= indicators for: statutory change, indexer,(omitted) no change
• Experiment with di�erent �xed e�ects/controls
• Weight by employment in state-occupation• restrict to cells with at least 10 ads
• Cluster standard errors by state

Intro Data Skill Requirements and MW Hikes Conclusion
DD High School Requirement
(1) (2) (3) (4)
After*Statutory 0.00764 0.0210*** 0.0206*** 0.0151**(0.00739) (0.00701) (0.00688) (0.00616)
After*Indexer -0.00735 -0.00848 -0.00805 -0.00420(0.00895) (0.0106) (0.0109) (0.0125)
Occ-state-date cells 35,295 35,295 35,276 35,276
State, Occ, Date FEs X X X X
Macro/ACA Controls X X X
Occ-by-Date, Occ-by-State X X
Region-by-Date X
Dependent Variable: HS Requirement
High Bite Occupations
*** p<0.01, ** p<0.05, * p<0.1

Intro Data Skill Requirements and MW Hikes Conclusion
DD High School Requirement
(1) (2) (3) (4) (1) (2) (3) (4)
After*Statutory 0.00964 0.00799 0.00602 0.00154 -0.00223 -0.000150 -0.000444 0.000939(0.00651) (0.00636) (0.00634) (0.00746) (0.00357) (0.00266) (0.00290) (0.00283)
After*Indexer -0.0122* -0.0142* -0.0124* -0.00744 -0.0106*** -0.0104** -0.0110*** -0.0118***(0.00681) (0.00709) (0.00732) (0.0106) (0.00361) (0.00400) (0.00403) (0.00429)
Occ-state-date cells 114,305 114,305 114,173 114,173 168,386 168,386 168,317 168,317
State, Occ, Date FEs X X X X X X X X
Macro/ACA Controls X X X X X X
Occ-by-Date, Occ-by-State X X X X
Region-by-Date X X*** p<0.01, ** p<0.05, * p<0.1
Dependent Variable: HS Requirement
Modest Bite Occupations Low Bite Occupations

Intro Data Skill Requirements and MW Hikes Conclusion
DD High School Requirement
(1) (2) (3) (4) (1) (2) (3) (4)
After*Statutory 0.00964 0.00799 0.00602 0.00154 -0.00223 -0.000150 -0.000444 0.000939(0.00651) (0.00636) (0.00634) (0.00746) (0.00357) (0.00266) (0.00290) (0.00283)
After*Indexer -0.0122* -0.0142* -0.0124* -0.00744 -0.0106*** -0.0104** -0.0110*** -0.0118***(0.00681) (0.00709) (0.00732) (0.0106) (0.00361) (0.00400) (0.00403) (0.00429)
Occ-state-date cells 114,305 114,305 114,173 114,173 168,386 168,386 168,317 168,317
0.00442 0.00661 0.00596 0.00116(0.00473) (0.00487) (0.00519) (0.00387)
-0.0136*** -0.0137*** -0.0129*** -0.00864**(0.00329) (0.00349) (0.00330) (0.00364)
168,386 168,386 168,317 168,317
State, Occ, Date FEs X X X X X X X X
Macro/ACA Controls X X X X X X
Occ-by-Date, Occ-by-State X X X X
Region-by-Date X X*** p<0.01, ** p<0.05, * p<0.1
Low Bite Occupations -- BA Requirement
Dependent Variable: Skill Requirement
Modest Bite Occupations Low Bite Occupations -- HS Requirement

Intro Data Skill Requirements and MW Hikes Conclusion
Methodology � Triple Di�
skillost = α0+[afterst∗proneo∗mw_groups ]α1+I ot+I os+I st+controls+εost
• proneo = indicators for Bite group: high, modest, (omitted)low
• mw_groups= indicators for: statutory change, indexer,(omitted) no change
• include standard two-way interactions
• Experiment with di�erent �xed e�ects/controls
• Weight by employment in state-occupation• restrict to cells with at least 10 ads
• Cluster standard errors by state

Intro Data Skill Requirements and MW Hikes Conclusion
DDD High School Requirement
(1) (2) (4) (5)
High Bite*After*Statutory 0.0163** 0.0167* 0.0210*** 0.0142**(0.00698) (0.00842) (0.00762) (0.00606)
High Bite*After*Indexer 0.0111 0.0102 0.00340 0.00819(0.00758) (0.00700) (0.00857) (0.00903)
Modest Bite*After*Statutory 0.0119*** 0.0151*** 0.00644 0.000733(0.00372) (0.00404) (0.00505) (0.00517)
Modest Bite*After*Indexer -0.00508 -0.00244 -0.00176 0.00376(0.00434) (0.00527) (0.00412) (0.00623)
Occ-state-date cells 317,986 317,986 317,766 317,766
Group two-ways X X X X
Macro/ACA Controls X X X
Full two-ways X X
Region-by-Bite Group-by-Date X
Dependent Variable: HS Requirement
High School Requirement
*** p<0.01, ** p<0.05, * p<0.1

Intro Data Skill Requirements and MW Hikes Conclusion
By Minimum Wage Change
-.02
0.0
2.0
4C
oeffi
cien
t
0 .5 1 1.5 2Average Min Wage Change
Diff-in-Diff Triple Diff
High Bite Occupations
Intro Data Skill Requirements and MW Hikes Conclusion
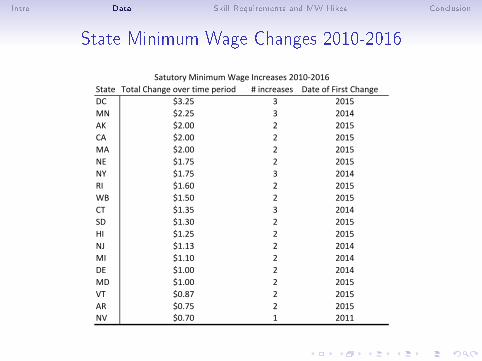
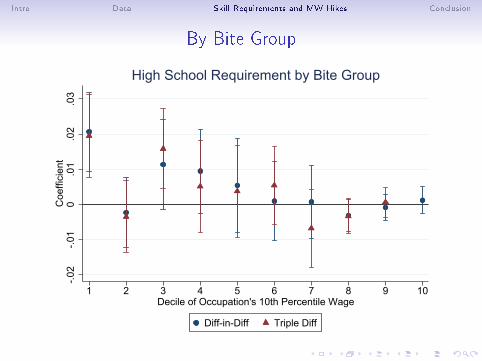
By Bite Group
-.02
-.01
0.0
1.0
2.0
3C
oeffi
cien
t
1 2 3 4 5 6 7 8 9 10Decile of Occupation's 10th Percentile Wage
Diff-in-Diff Triple Diff
High School Requirement by Bite Group

Intro Data Skill Requirements and MW Hikes Conclusion
By Bite Group
-.02
0.0
2.0
4.0
6C
oeffi
cien
t
1 3 5 7 9 11 13 15 17 19Decile of Occupation's 10th Percentile Wage
Diff-in-Diff Triple Diff
High School Requirement by Bite Group

Intro Data Skill Requirements and MW Hikes Conclusion
Event
-.04
-.02
0.0
2.0
4.0
6C
oeffi
cien
t
-10 -5 0 5 10Months since first increase
Diff-in-Diff Triple Diff
High School Requirement Event Study

Intro Data Skill Requirements and MW Hikes Conclusion
Other BG Outcomes
Dependent variable: BA Exp 0-2 Yrs Exp 3+ Yrs Character SocialMean: (0.15) (0.25) (0.19) (0.26) (0.34)
(1) (2) (3) (4) (5)
After*Statutory 0.000390 0.00203 -0.000542 -0.00191 -0.00652(0.00158) (0.00764) (0.00168) (0.00465) (0.00493)
High Bite*After*Statutory -0.00516 0.00552 -0.00309 -0.00496 -0.0102***(0.00492) (0.00695) (0.00323) (0.00507) (0.00356)
*** p<0.01, ** p<0.05, * p<0.1
Diff-in-Diff High Bite
Triple Diff

Intro Data Skill Requirements and MW Hikes Conclusion
DD Firm Controls
(1) (2) (3) (4) (5)
After*Statutory 0.0200** 0.0280*** 0.0125*** 0.0141*** 0.0100**(0.00776) (0.00880) (0.00462) (0.00503) (0.00397)
After*Indexer -0.0124 -0.0151 -0.00864* -0.00697 -0.00692(0.0104) (0.00910) (0.00457) (0.00519) (0.00414)
# Cells 44,460 41,722 804,737 803,995 803,950
Full Controls X X X X X
500 Largest Firms X X X X
Firm Fixed Effects X X X
Firm-by-State X X
Firm-by-Year X
Diff n Diff
High Bite Occupations
*** p<0.01, ** p<0.05, * p<0.1
Intro Data Skill Requirements and MW Hikes Conclusion
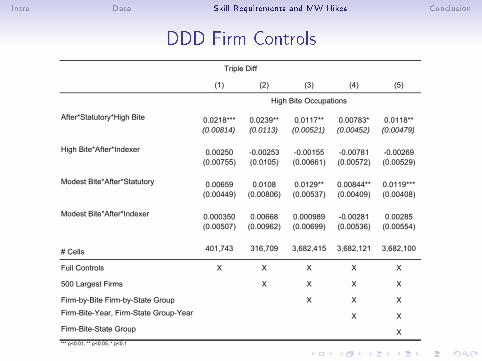
DDD Firm Controls
(1) (2) (3) (4) (5)
After*Statutory*High Bite 0.0218*** 0.0239** 0.0117** 0.00783* 0.0118**(0.00814) (0.0113) (0.00521) (0.00452) (0.00479)
High Bite*After*Indexer 0.00250 -0.00253 -0.00155 -0.00781 -0.00269(0.00755) (0.0105) (0.00661) (0.00572) (0.00529)
Modest Bite*After*Statutory 0.00659 0.0108 0.0129** 0.00844** 0.0119***(0.00449) (0.00806) (0.00537) (0.00409) (0.00408)
Modest Bite*After*Indexer 0.000350 0.00668 0.000989 -0.00281 0.00285(0.00507) (0.00962) (0.00699) (0.00536) (0.00554)
# Cells 401,743 316,709 3,682,415 3,682,121 3,682,100
Full Controls X X X X X
500 Largest Firms X X X X
Firm-by-Bite Firm-by-State Group X X XFirm-Bite-Year, Firm-State Group-Year X XFirm-Bite-State Group X*** p<0.01, ** p<0.05, * p<0.1
Triple Diff
High Bite Occupations

Intro Data Skill Requirements and MW Hikes Conclusion
Worker Characteristics (ACS) and Min Wage Changes
Intro Data Skill Requirements and MW Hikes Conclusion
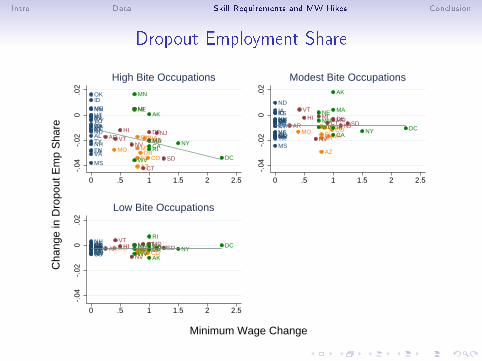
Dropout Employment Share
AL
GA
IA
ID
IN
KS
KY
LA
ME
MS
NCND
NH
NM
OK
PASC
TN
TX
UT
VA
WIWY
AZCOFL
MO MT
OH
OR
WAAR
CT
DEHI
MD
MI
NJ
NV
SD
VT
AK
CA
DC
MA
MN
NE
NYRI
WV
-.04
-.02
0.0
2
0 .5 1 1.5 2 2.5
High Bite Occupations
AL
GA
IAID
IN
KS
KY
LA
ME
MS
NC
ND
NH
NM
OKPA
SC
TN
TX
UT
VA
WI
WY
AZ
COFLMOMT
OHOR
WA
AR CTDEHI MD
MI
NJ
NV
SD
VT
AK
CADC
MA
MNNE
NYRIWV
-.04
-.02
0.0
2
0 .5 1 1.5 2 2.5
Modest Bite Occupations
ALGAIAIDINKSKYLAMEMSNCNDNH
NMOKPASCTNTXUTVAWI
WY AZ COFLMO MTOHORWAAR
CTDEHI MDMI NJ
NV
SDVT
AKCA
DCMAMNNE NY
RI
WV
-.04
-.02
0.0
2
0 .5 1 1.5 2 2.5
Low Bite Occupations
Cha
nge
in D
ropo
ut E
mp
Sha
re
Minimum Wage Change

Intro Data Skill Requirements and MW Hikes Conclusion
ACS Results
(1) (2) (3) (1) (2) (3)
After*Statutory -0.00707** -0.00570 -0.00596 After*Statutory*High Bite -0.00337 -0.00309 -0.00579*(0.00311) (0.00371) (0.00365) (0.00314) (0.00356) (0.00341)
After*Statutory 0.00676* 0.00767* 0.00752* After*Statutory*High Bite 0.00773** 0.00792** 0.00346(0.00365) (0.00422) (0.00427) (0.00357) (0.00352) (0.00499)
Young Adult
After*Statutory -0.0101*** -0.0107*** -0.0101*** After*Statutory*High Bite -0.0335*** -0.0322*** -0.0102***(0.00250) (0.00334) (0.00327) (0.00931) (0.0119) (0.00333)
After*Statutory 0.299*** 0.349*** 0.326*** After*Statutory*High Bite 0.965*** 0.952** 0.313***(0.0825) (0.105) (0.102) (0.315) (0.371) (0.115)
State, Occ, Date FEs X X X Group two-ways X X X
Macro/ACA Controls X X Macro/ACA X X
Occ-by-Date, Occ-by-State X Full two-ways X
Triple Diff
Less HS
Some College or More
AgeAge
Young Adult
Some College or More
Less HS
*** p<0.01, ** p<0.05, * p<0.1
Diff‐n‐Diff

Intro Data Skill Requirements and MW Hikes Conclusion
Employment
(1) (2) (1) (2)
After*Statutory 0.0114 0.00770 After*Statutory*High Bite 0.0140* 0.0137(0.0119) (0.00783) (0.00774) (0.00841)
After*Statutory 0.00220* 0.00170(0.00113) (0.00124)
State, Occ, Date FEs X X Full two-ways X X
Macro/ACA Controls X Macro/ACA X
Diff‐n‐Diff Triple Diff
Log (Employment) Log (Employment)
High Bite Employment Share

Intro Data Skill Requirements and MW Hikes Conclusion
Conclusion• Increases in the minimum wage cause employers to demandmore credentials/skills
• Concentrated in the bottom decile of the job distribution• Increase in HS Diploma requirement of ~ 2 percentage points(7%) for $0.70 to $3.25 increase in min wage
• Decrease in HS dropout employment share of ~0.5 ppt (3%)• Decrease in young adult employment share of ~1 ppt (4%)• Initial e�ects from very new policy changes that are stillaccumulating
• E�ects remain holding constant composition of �rms at a verydetailed level
• we also see some substitution from low- to higher-skilled �rms(a la Aaronson et al.)
• Skill requirements may adjust before, or instead of, anyemployment e�ects
• research tends to focus less on these other margins ofadjustment (e.g., bene�ts Clemens, Kahn and Meer 2017b)
• consequences can still be important for workers

Intro Data Skill Requirements and MW Hikes Conclusion
Industry Distributions: BG and JOLTS
0
0.02
0.04
0.06
0.08
0.1
0.12
0.14
0.16
0.18
0.2
BG JOLTS Vacancies
Back

Intro Data Skill Requirements and MW Hikes Conclusion
Occupations Distributions: BG, New Hires, Employment
0
0.02
0.04
0.06
0.08
0.1
0.12
0.14
0.16
0.18
BG Ads CPS New Jobs OES Employment
Back
Intro Data Skill Requirements and MW Hikes Conclusion
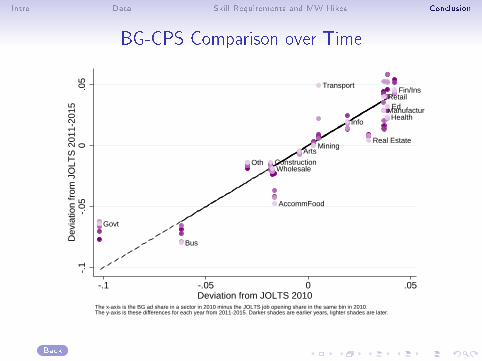
BG-CPS Comparison over Time
Mining
Construction
Manufacturing
Wholesale
Retail
Transport
Info
Fin/Ins
Real Estate
Bus
Ed
Health
Arts
AccommFood
Oth
Govt
-.1
-.05
0.0
5D
evia
tion
from
JO
LTS
201
1-20
15
-.1 -.05 0 .05Deviation from JOLTS 2010
The x-axis is the BG ad share in a sector in 2010 minus the JOLTS job opening share in the same bin in 2010.The y-axis is these differences for each year from 2011-2015. Darker shades are earlier years, lighter shades are later.
Back

Intro Data Skill Requirements and MW Hikes Conclusion
Education by MSA
.5.5
2.5
4.5
6
12.5 13 13.5 14 14.5
Any Education Requirement
14.3
14.5
14.7
14.9
12.5 13 13.5 14 14.5
Years Required, Conditional.1
7.1
8.1
9.2
.21
.15 .2 .25 .3 .35
High School
.15
.2.2
5.3
.35
.1 .15 .2 .25 .3
College
Ave
rage
(B
G)
Average Education of Employed in Occupation (ACS)Smoothed local linear regression of occupation-level education requirement on ACS education percentile. Top panel uses average years ofschooling for employed workers in the MSA as the ACS variable; BG variable is the share of ads with any education requirement (left) oraverage years required conditional on any (right). Bottom panel uses the share of employed workers with exactly a high school diploma(left) or college degree (right) as the ACS variable; BG variables are the share of ads requiring the specified degree.
Back

Intro Data Skill Requirements and MW Hikes Conclusion
Education by Occupation
.3.4
.5.6
.7
10 12 14 16 18
Any Education Requirement
1213
1415
1617
10 12 14 16 18
Years Required, Conditional.0
5.1
.15
.2.2
5.3
0 .1 .2 .3 .4 .5
High School
0.1
.2.3
.4
0 .1 .2 .3 .4 .5
College
Ave
rage
(B
G)
See notes to sub-figure (a). Here ACS variables are average education requirements in the occupation (instead of MSA).
Back

Intro Data Skill Requirements and MW Hikes Conclusion
Occupation Shares in BG and OES
cook
server
cleanerpersonal care
cashier
super-cook
fin clerk
record clerk
admin
construction trades
oth repair
driver
material movers
mgr
consultant
teacher
nurses
super-sales
sales rep
0.0
2.0
4.0
6.0
8B
G O
ccup
atio
n S
hare
0 .02 .04 .06 .08OES Occupation Share
High Bite Modest Bite Low Bite
Back