Impacts of Ship Emissions on Air Quality in Southern ... · PDF fileImpacts of Ship Emissions...
10
1 Impacts of Ship Emissions on Air Quality in Southern California Satish Vutukuru , Joseph Ensberg, Donald Dabdub University of California Irvine SECA Meeting December 11, 2007 Computational Environmental Sciences Laboratory, UC Irvine 2/28 Outline Modeling Domain CIT Air Quality Model Ship Emissions Model Configuration Air Quality Impacts Conclusions, Next Steps Computational Environmental Sciences Laboratory, UC Irvine 3/28 400 km 150 km Computational Grid: 80 x 30 horizontal cells, 5x5 km resolution, 5 vertical layers up to 1100 m Modeling Domain
Transcript of Impacts of Ship Emissions on Air Quality in Southern ... · PDF fileImpacts of Ship Emissions...
1
Impacts of Ship Emissions on Air Quality in Southern California
Satish Vutukuru, Joseph Ensberg, Donald DabdubUniversity of California Irvine
SECA MeetingDecember 11, 2007
Computational Environmental Sciences Laboratory, UC Irvine 2/28
Outline
� Modeling Domain
� CIT Air Quality Model
� Ship Emissions
� Model Configuration
� Air Quality Impacts
� Conclusions, Next Steps
Computational Environmental Sciences Laboratory, UC Irvine 3/28
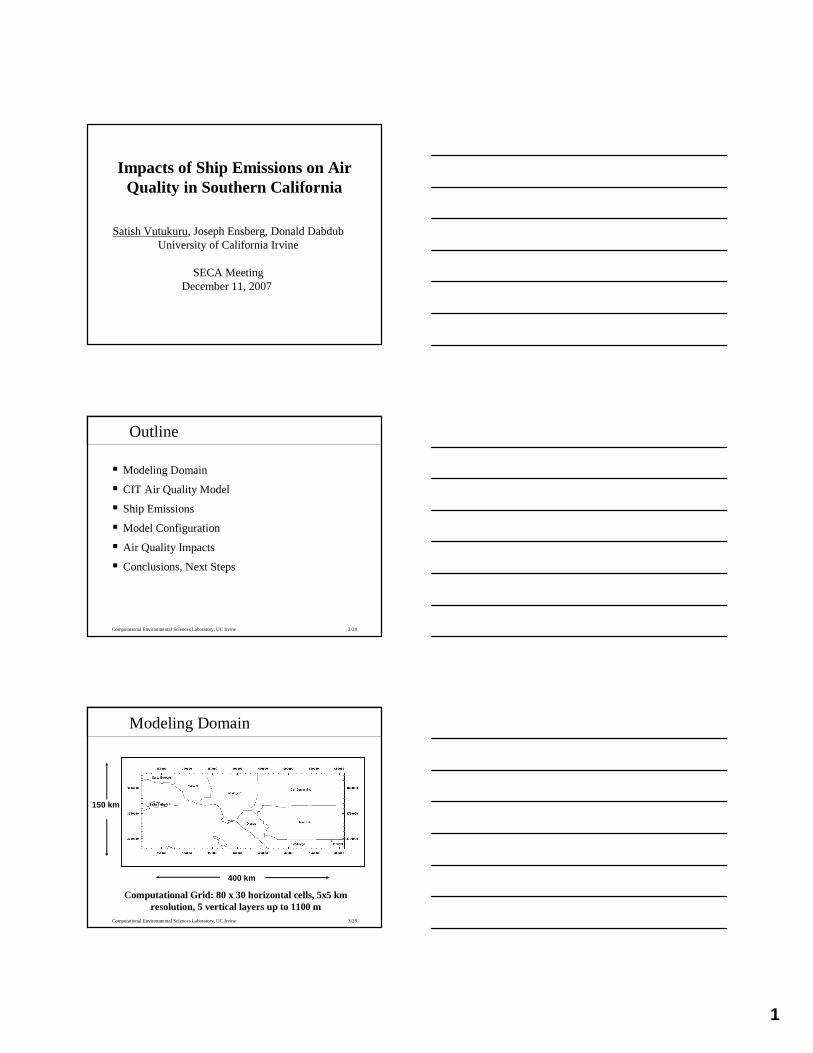
400 km
150 km
Computational Grid: 80 x 30 horizontal cells, 5x5 km resolution, 5 vertical layers up to 1100 m
Modeling Domain

2
Computational Environmental Sciences Laboratory, UC Irvine 4/28
CIT Model
� Initially developed at Cal Tech and is currently under continuous development at UCI
� Eularian photochemical grid model
� Incorporates state-of-science modules to model atmospheric processes
� The model is evaluated using data from several field campaigns
� The model is used for many applications to study air quality for the south coast and other regions
Computational Environmental Sciences Laboratory, UC Irvine 5/28
CACM Mechanism191 species:120 fully integrated,67 pseudo-steady-state, and4 fixed concentration species
Numerical AlgorithmsQSTSE for advectionPFISLM for aerosol dynamics
Dynamic inorganic aerosol calculations
SCAPE2
MPMPO
CACM,z-transport
Transport in y-direction
Transport in x-direction
Transport in y-direction
Transport in x-direction
Input data(Meteorological fields,
Emissions, BCs)
Gas-phase chemistry
Equilibrium organic aerosol calculations
Initial conditions
Model Components
Computational Environmental Sciences Laboratory, UC Irvine 6/28
CIT Model Evaluation
� CIT Model was validated using data from major field experiments.
– Harley 1993 evaluated the performance for gas-phase species using data from 1987 SCAQS episode.
– Meng 1998 compared aerosol predictions with observations from 1987 SCAQS episode.
– Griffin 2002 compared organic aerosol predictions with 1993 field campaign observations.
– Griffin 2006 applied model components (CACM, MPMPO) toNorth East region and compared with observations

3
Computational Environmental Sciences Laboratory, UC Irvine 7/28
CIT Model Applications
� CIT Model is extensively applied to South Coast region for air quality studies.
– Effects of NOx and VOC controls on ambient particulate matter (Nguyen, 2002)
– Modeling of sea-salt chemistry (Knipping, 2002)
– Modeling of renoxification chemistry (Knipping, 2002)
– Modeling the oxidative capacity (Griffin, 2004)
– Calculation of incremental secondary organic aerosol reactivity(Carreras-Sospedra, 2005)
– Distributed power generation studies (Rodriguez, 2006)
– Secondary organic aerosol analysis (Vutukuru, 2006)
Computational Environmental Sciences Laboratory, UC Irvine 8/28
Ship Emissions
� Spatially-resolved ship emissions for North America are obtained from Prof. Jim Corbett (U Delaware)
� Emissions are formatted to model resolution and size
Daily SOx emissions from ships
Computational Environmental Sciences Laboratory, UC Irvine 9/28
0
5
10
15
20
25
30
35
40
45
NOX SOX PM TOG
Tons/Day
Daily ship emissions in the modeling domain
Ship Emissions� Similarly, emissions of NOx, PM and TOG from ships for
the base year 2002 are processed for a summer month
� Hourly emissions are calculated using uniform distribution of emissions throughout the day.
4
Computational Environmental Sciences Laboratory, UC Irvine 10/28
0
200
400
600
800
1000
1200
1400
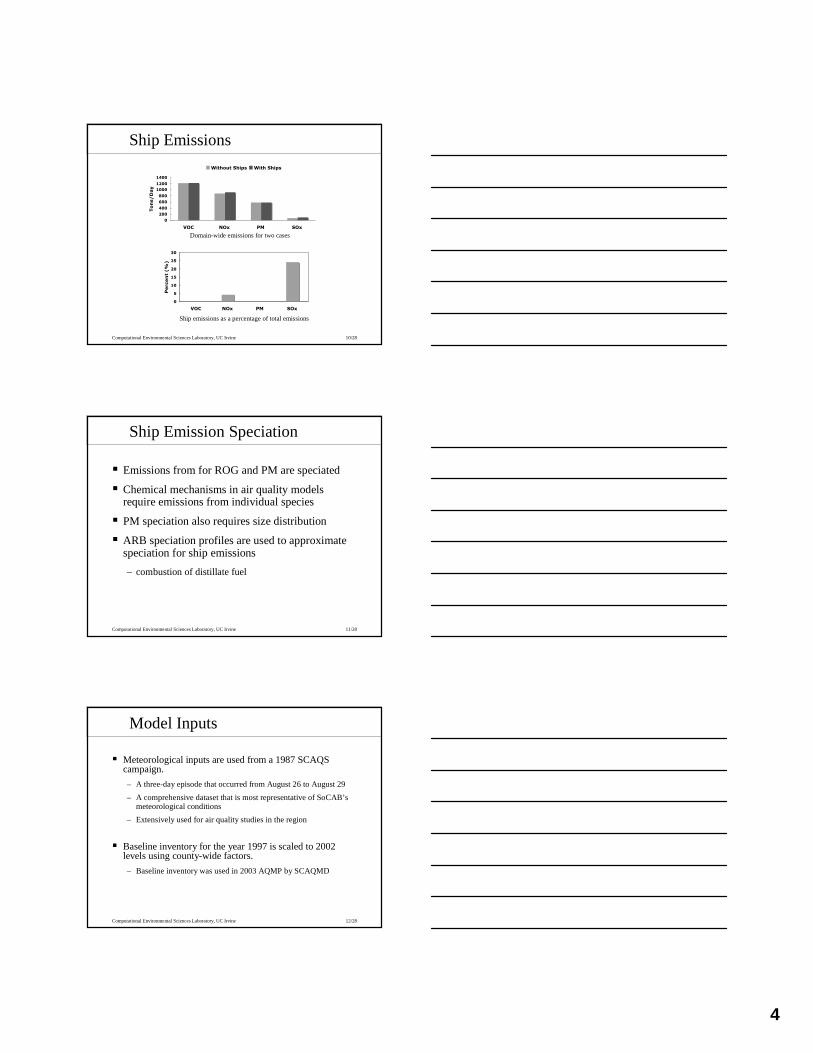
VOC NOx PM SOx
Tons/Day
Without Ships With Ships
0
5
10
15
20
25
30
VOC NOx PM SOx
Percent (%)
Domain-wide emissions for two cases
Ship emissions as a percentage of total emissions
Ship Emissions
Computational Environmental Sciences Laboratory, UC Irvine 11/28
Ship Emission Speciation
� Emissions from for ROG and PM are speciated
� Chemical mechanisms in air quality models require emissions from individual species
� PM speciation also requires size distribution
� ARB speciation profiles are used to approximate speciation for ship emissions
– combustion of distillate fuel
Computational Environmental Sciences Laboratory, UC Irvine 12/28
Model Inputs
� Meteorological inputs are used from a 1987 SCAQS campaign.
– A three-day episode that occurred from August 26 to August 29
– A comprehensive dataset that is most representative of SoCAB’s meteorological conditions
– Extensively used for air quality studies in the region
� Baseline inventory for the year 1997 is scaled to 2002 levels using county-wide factors.
– Baseline inventory was used in 2003 AQMP by SCAQMD

5
Computational Environmental Sciences Laboratory, UC Irvine 13/28
O3: 40 ppb, Sf: ~ 0, Nt: ~ 0
O3: 40 ppb,
Sf: ~ 0,Nt: ~ 0
O3: aq, Sf: ~ 0, Nt: ~ 0
O3: aq,
Sf: ~ 0,Nt: ~ 0
Model Configuration
Computational Environmental Sciences Laboratory, UC Irvine 14/28
24-hour average concentration of ambient sulfateswithout ship emissions
Ambient Sulfates
Computational Environmental Sciences Laboratory, UC Irvine 15/28
Difference between 24-hour average concentration ofambient sulfates with and without ship emissions
Contribution from Ships

6
Computational Environmental Sciences Laboratory, UC Irvine 16/28
Impact on Ambient Sulfates
24-hour average concentration of ambient sulfates
withoutships
withships
Computational Environmental Sciences Laboratory, UC Irvine 17/28
0
2
4
6
8
10
12
Simi Valley
Central LA
West LA
Long Beach
Riverside
Location
Without Ships With Ships
0
5
10
15
20
25
30
35
40
45
Simi Valley
Central LA
West LA
Long Beach
Riverside
Location
Contribution from Ships
Computational Environmental Sciences Laboratory, UC Irvine 18/28
Impact on Ambient Nitrates
24-hour average concentration of ambient nitrates
withoutships
withships

7
Computational Environmental Sciences Laboratory, UC Irvine 19/28
Difference between 24-hour average concentration of ambient nitrates with and without ship emissions
Contribution from Ships
Computational Environmental Sciences Laboratory, UC Irvine 20/28
Role of NOx
� NOx produces ozone which in turn produces OH radicals
� OH radicals and ozone play a key role insecondary particulate formation
� Relationship between NOx emissions and secondary particulate formation is highly
non-linear
Computational Environmental Sciences Laboratory, UC Irvine 21/28
Difference between peak ozone concentrations
Impact on Peak Ozone
8
Computational Environmental Sciences Laboratory, UC Irvine 22/28
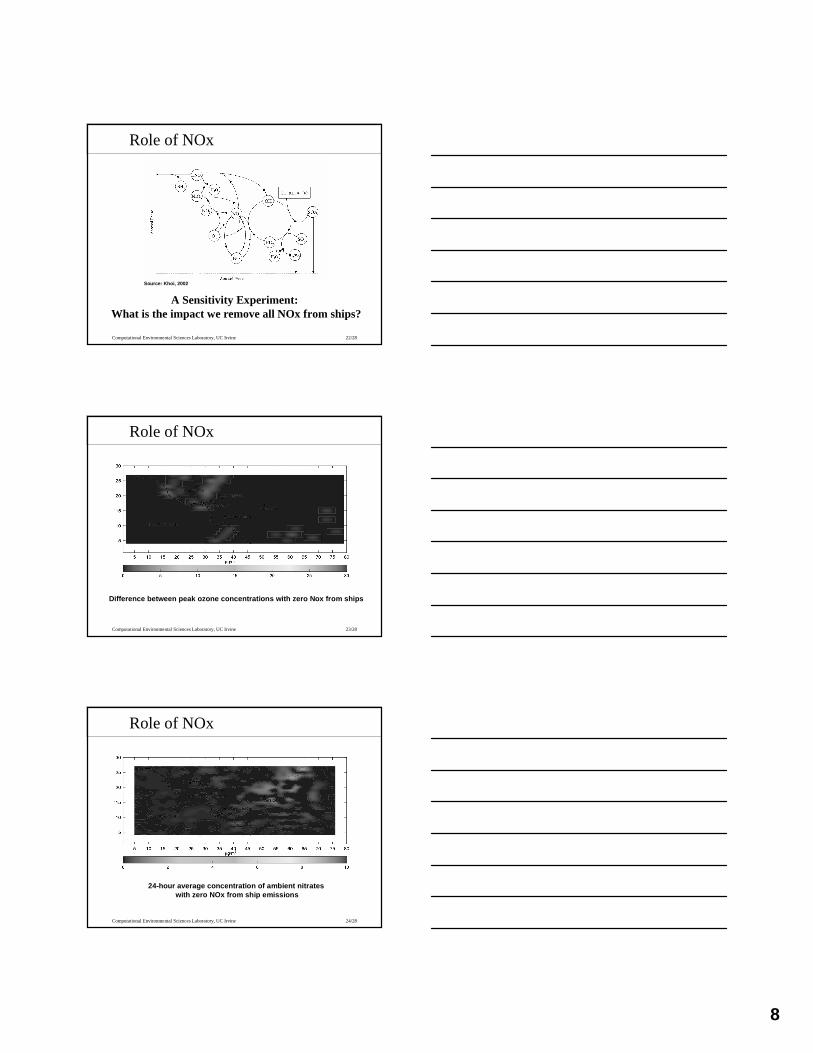
Role of NOx
Source: Khoi, 2002
A Sensitivity Experiment:What is the impact we remove all NOx from ships?
Computational Environmental Sciences Laboratory, UC Irvine 23/28
Difference between peak ozone concentrations with zero Nox from ships
Role of NOx
Computational Environmental Sciences Laboratory, UC Irvine 24/28
24-hour average concentration of ambient nitrateswith zero NOx from ship emissions
Role of NOx
9
Computational Environmental Sciences Laboratory, UC Irvine 25/28
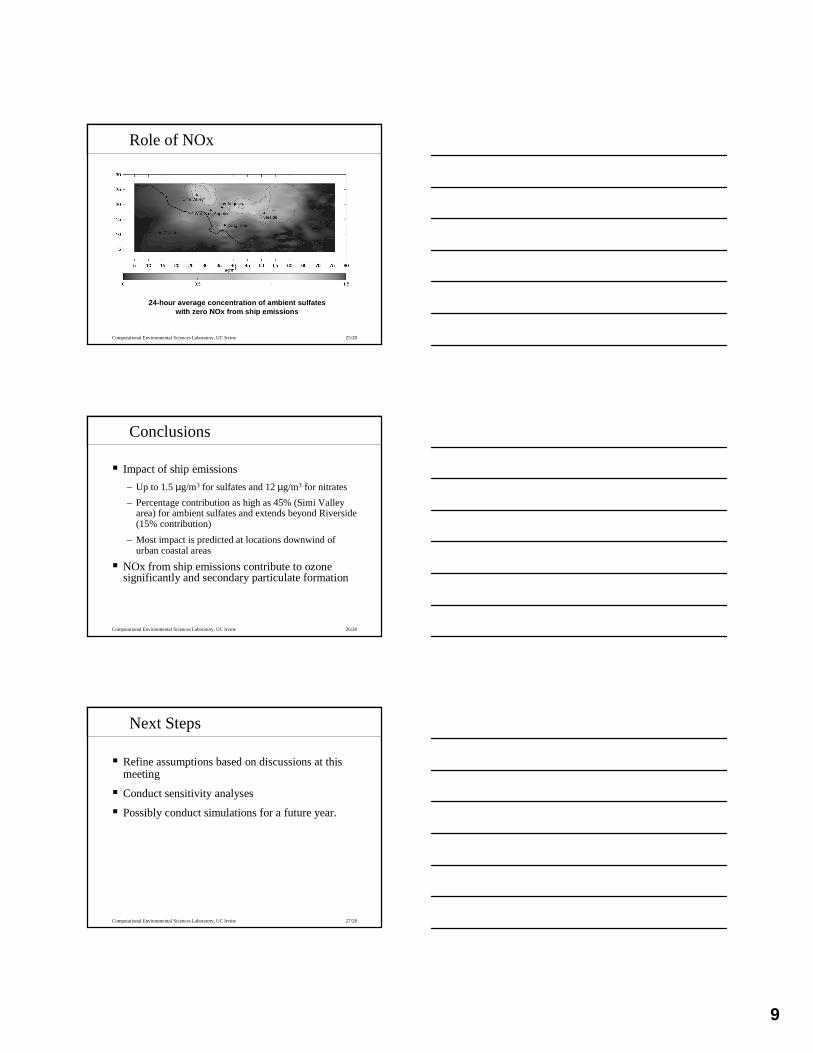
24-hour average concentration of ambient sulfateswith zero NOx from ship emissions
Role of NOx
Computational Environmental Sciences Laboratory, UC Irvine 26/28
Conclusions
� Impact of ship emissions
– Up to 1.5µg/m3 for sulfates and 12 µg/m3 for nitrates
– Percentage contribution as high as 45% (Simi Valley area) for ambient sulfates and extends beyond Riverside (15% contribution)
– Most impact is predicted at locations downwind of urban coastal areas
� NOx from ship emissions contribute to ozone significantly and secondary particulate formation
Computational Environmental Sciences Laboratory, UC Irvine 27/28
Next Steps
� Refine assumptions based on discussions at this meeting
� Conduct sensitivity analyses
� Possibly conduct simulations for a future year.
10
Computational Environmental Sciences Laboratory, UC Irvine 28/28
Acknowledgements
� Dongmin Luo and Ajith Kaduwela (California Air Resources Board)
� Prof. Jim Corbett (U Delaware)
� Tony Soeller, Joseph Farran (UCI Academic Computing Services)