Impacts Of Dilemma Zone Situations And Red Light … thus pr s, Red light r e used very y installed...
21
Eur Im Fais Tar 1 Depa Abstr When to dec analyz safety stop o safety signal vehicl leader option decisi facing line, e violat modif driver Keyw 1. I Traff contr balan amon traffi are s The inter inclu Corr ropean Tran mpacts Runni sal Musht iq 1 artment of Civ ract n drivers are a cide whether zing the impa y of a signaliz or go. As the d y level. This lized intersec les’ speeds an rs. Behaviors n zone and th ion of stoppin g the amber si exercise an ag te red light o fying survey m rs and to contr ords:Signalize ntroductio fic lights or rol. Signals nce the flow ng the vehic ic signals a till happeni most com sections. A uding left tu responding au nsport \ Tras Of Dile ing On T taq Awan vil Engineerin approaching to to stop or c acts of approa zed intersectio drivers behavi behavior, wi ction in Salfo nd distance fro have been gro heir initial ap ng or violating ignal are in a d ggressive beha or apply sudd methodology rol red light ru ed intersection on r signals ar s are usuall ws on differe cles and to are becomin ing on junct mplex form At a typical urn, straight uthor: Malik M sporti Europ emma Z The Saf n 1 , Malik g, Mirpur Un o a signalized ross the inter aching speeds ons, particula ior at signalize ith respect to ord, Manches om stop line w ouped into fiv proaching spe g. The finding dilemma zone avior. The res den braking for high spee unning thus pr ns, Red light r re used very ly installed ent arms. O provide saf ng most imp tions”. of junctio of two way t ahead, and Muneeb Abid ( pei (2017) I 1 Zone Sit fety At Muneeb iversity of Sci intersection a rsection due s and distance arly the driver ed intersection o amber sign ster. The data when exposed ve criteria’s, b eed. All five gs of this resea e due to high a search conclud causing dang ed junctions i roviding bette running, viola y effectivel to improv Other suppor fer crossing portant tool ns within y streets the d right turn (muneeb.ce@ Issue 63, Pa tuations Signali Abid 1 , A ience and Tech at the onset of to the dilemm e from stop li rs behavior af ns is one of th nal obedience a, collected f d to amber lig based upon dif criteria are c arch indicate approaching sp des that a hig ger for them it can be help er safety at sig ating red light ly worldwid ve the capac rting reason gs for pedes l in traffic m any highw ere are 12 l n from four @must.edu.pk) aper n° 8, IS s And R ised Jun Anwar Kh hnology, Mirp f yellow signa ma zone. Thi ine at the ons fter amber an he main factor or violation for the study ght, as well as fferent scenar categorized ac that a large p peeds and les gh percentage selves and ot pful to improv gnalized inters t, Dilemma-zo de as a me city of the ns are to red trians and c managemen way network legal vehicu approaches SSN 1825-3 Red Lig nctions hitab 1 , Ju pur, AJK, Pak al, they may h is paper focu set of amber nd their decisi s contributing , is examined y purposes, in s reaction of p rios of a dilem ccording to d ercentage of d s distance from of all drivers thers. Howev ve option zon ections. ne. thod of jun junction a duce the con cyclists. In nt.But “acci k are at g ular movem s, and four 3997 ght naid kistan. hesitate ses on on the ions of g to the d at a nclude platoon mma or driver’s drivers m stop s either ver, by nes for nction nd to nflicts short, idents grades ments, legal
Transcript of Impacts Of Dilemma Zone Situations And Red Light … thus pr s, Red light r e used very y installed...

Eur
Im
FaisTar 1Depa AbstrWhento decanalyzsafetystop osafetysignalvehiclleaderoptiondecisifacingline, eviolatmodifdriver
Keyw
1. I
Traffcontrbalanamontraffiare sThe interinclu
Corr
ropean Tran
mpacts Runni
sal Mushtiq1
artment of Civ
ract n drivers are acide whether zing the impa
y of a signalizor go. As the dy level. This lized intersecles’ speeds anrs. Behaviors n zone and thion of stopping the amber siexercise an agte red light ofying survey mrs and to contr
ords:Signalize
ntroductio
fic lights orrol. Signalsnce the flowng the vehicic signals atill happenimost comp
sections. Auding left tu
responding au
nsport \ Tras
Of Dileing On T
taq Awan
vil Engineering
approaching toto stop or c
acts of approazed intersectiodrivers behavi
behavior, wiction in Salfond distance frohave been gro
heir initial apng or violatingignal are in a dggressive behaor apply suddmethodology rol red light ru
ed intersection
on
r signals ars are usuallws on differecles and to
are becomining on junct
mplex form At a typical urn, straight
uthor: Malik M
sporti Europ
emma ZThe Saf
n1, Malik
g, Mirpur Un
o a signalized ross the interaching speedsons, particulaior at signalizeith respect toord, Manchesom stop line wouped into fivproaching spe
g. The findingdilemma zoneavior. The resden braking
for high speeunning thus pr
ns, Red light r
re used veryly installed ent arms. Oprovide saf
ng most imptions”.
of junctioof two wayt ahead, and
Muneeb Abid (
pei (2017) I
1
Zone Sitfety At
Muneeb
iversity of Sci
intersection arsection due s and distancearly the drivered intersectiono amber signster. The datawhen exposedve criteria’s, beed. All five
gs of this reseae due to high asearch conclud
causing danged junctions iroviding bette
running, viola
y effectivelto improv
Other supporfer crossingportant tool
ns within y streets thed right turn
(muneeb.ce@
Issue 63, Pa
tuationsSignali
Abid1, A
ience and Tech
at the onset ofto the dilemme from stop lirs behavior afns is one of th
nal obedience a, collected fd to amber ligbased upon dif
criteria are carch indicate approaching spdes that a higger for themit can be help
er safety at sig
ating red light
ly worldwidve the capacrting reason
gs for pedesl in traffic m
any highwere are 12 ln from four
@must.edu.pk)
aper n° 8, IS
s And Rised Jun
Anwar Kh
hnology, Mirp
f yellow signama zone. Thiine at the onsfter amber anhe main factor
or violationfor the study
ght, as well asfferent scenarcategorized acthat a large ppeeds and les
gh percentage selves and otpful to improv
gnalized inters
t, Dilemma-zo
de as a mecity of the
ns are to redtrians and cmanagemen
way networklegal vehicuapproaches
SSN 1825-3
Red Lignctions
hitab1, Ju
pur, AJK, Pak
al, they may his paper focuset of amber
nd their decisirs contributing, is examined
y purposes, ins reaction of prios of a dilemccording to dercentage of ds distance fromof all driversthers. Howevve option zonections.
ne.
thod of junjunction a
duce the concyclists. In nt.But “acci
k are at gular movems, and four
3997
ght
naid
kistan.
hesitate ses on on the
ions of g to the d at a nclude
platoon mma or driver’s drivers m stop
s either ver, by nes for
nction nd to
nflicts short, idents
grades ments,
legal

Eur
pedeconflAs Fcausebetwturnithreeconcinter
Thersigna
This try toface junctmostreasozoneDilempart reseacond
ropean Tran
strian crosflicts where Figure 1 shed by vehi
ween turningng moveme
e potential ludes that section.
re are somealized juncti
Hs
S M W H
study will o cover the in dilemmations are mot common ons behind situations. mma zone pof this stu
arches. Theducting sigh
D
nsport \ Tras
ssing movevehicles an
hows, at a licular moveg movemenents and str
conflicts number o
Figu
e importantion.
How to mospeed selectSelection of ManeuverinWhen to decHow to man
consider thdifferent sa
a zone. As postly due toreason of noncomplia
problem is audy, an ovee study al
ht surveys. InDeterminatio
sporti Europ
ements. Thnd/or pedestrlevel crossiements, founts. In addiraight-aheadcaused by
of conflicts
ure 1: Potent
t decisions
odify the spion will affe
f proper laneng to get intocelerate, stonage a safe g
he effect of afety issuesproved by reo noncomplifatal accideance and ho
a major safeerview of tlso looks in short, follon of possib
pei (2017) I
2
hese movemrians try to ing intersecur betweenition there d movemen
y vehicular s depends
tial conflict
to be taken
peed while fect their drie o proper lan
op, and accegap?
red light rus arising dueecent researiance of sigents worldwow red ligh
ety problemhis probleminto differelowing objeble dilemma
Issue 63, Pa
ments indeoccupy the
ction, there n straight-ah
are eight vnts. Similarl
movemenupon num
s at intersec
n by the dr
approachiniving decisio
ne and propeelerate?
unning on sie to differenrches, accidnals. Red liwide. This ht running c
m especiallym is conduent scenariectives havea zone scen
aper n° 8, IS
eed cause same physiare a total
head movemvehicular coly for T jun
nts from apmber of app
ctions
rivers whil
ng a junctioons?
er position
ignalized junt situations
dents happenight runningstudy will
can be effec
y at high speucted in theios of dilee been consinarios.
SSN 1825-3
many potical space. l of 16 conments, andonflicts betnctions therpproaches. proaches to
e approach
on and how
unctions ands drivers haned at signag has becom
try to findcted by dile
eed junctione light of remma zoneidered:
3997
ential
nflicts d four tween re are
This o the
hing a
w this
d will ave to alized
me the d out emma
ns. As recent e, by
European Transport \ Trasporti Europei (2017) Issue 63, Paper n° 8, ISSN 1825-3997
3
Driver behavior in terms of compliance.
Observation of general trends.
The paper is organized as follows. Next section presesnts the literature review of the proposed topic. Section 3 describes the methodology adopted to achieve the desired objectives. Results are presented in Section 4 and last section concludes the paper. 2. Literature Review
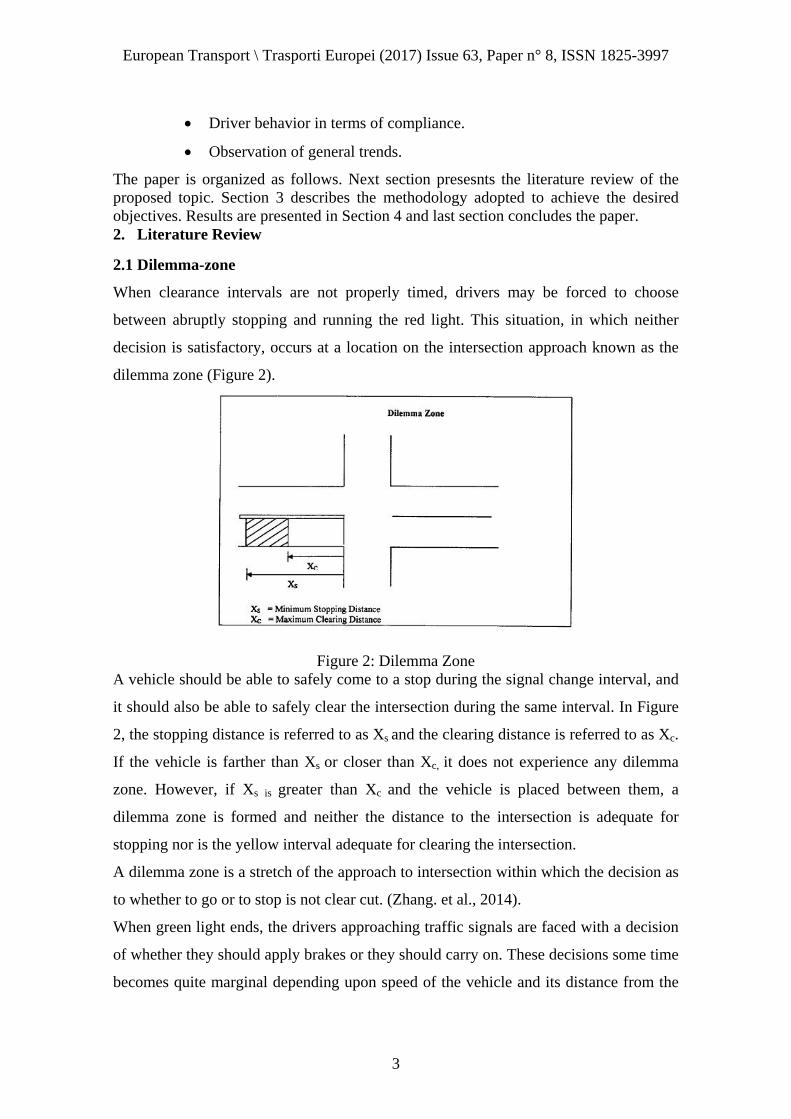
2.1 Dilemma-zone
When clearance intervals are not properly timed, drivers may be forced to choose
between abruptly stopping and running the red light. This situation, in which neither
decision is satisfactory, occurs at a location on the intersection approach known as the
dilemma zone (Figure 2).
Figure 2: Dilemma Zone A vehicle should be able to safely come to a stop during the signal change interval, and
it should also be able to safely clear the intersection during the same interval. In Figure
2, the stopping distance is referred to as Xs and the clearing distance is referred to as Xc.
If the vehicle is farther than Xs or closer than Xc, it does not experience any dilemma
zone. However, if Xs is greater than Xc and the vehicle is placed between them, a
dilemma zone is formed and neither the distance to the intersection is adequate for
stopping nor is the yellow interval adequate for clearing the intersection.
A dilemma zone is a stretch of the approach to intersection within which the decision as
to whether to go or to stop is not clear cut. (Zhang. et al., 2014).
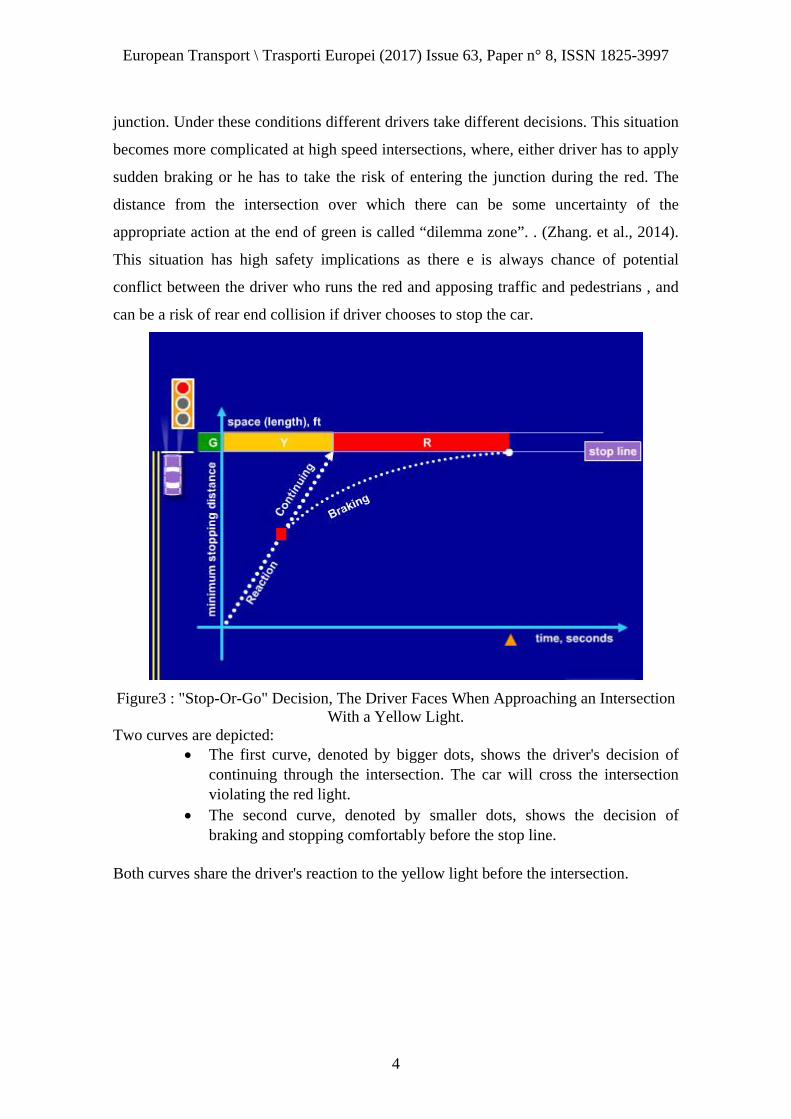
When green light ends, the drivers approaching traffic signals are faced with a decision
of whether they should apply brakes or they should carry on. These decisions some time
becomes quite marginal depending upon speed of the vehicle and its distance from the
European Transport \ Trasporti Europei (2017) Issue 63, Paper n° 8, ISSN 1825-3997
4
junction. Under these conditions different drivers take different decisions. This situation
becomes more complicated at high speed intersections, where, either driver has to apply
sudden braking or he has to take the risk of entering the junction during the red. The
distance from the intersection over which there can be some uncertainty of the
appropriate action at the end of green is called “dilemma zone”. . (Zhang. et al., 2014).
This situation has high safety implications as there e is always chance of potential
conflict between the driver who runs the red and apposing traffic and pedestrians , and
can be a risk of rear end collision if driver chooses to stop the car.
Figure3 : "Stop-Or-Go" Decision, The Driver Faces When Approaching an Intersection With a Yellow Light.
Two curves are depicted: The first curve, denoted by bigger dots, shows the driver's decision of
continuing through the intersection. The car will cross the intersection violating the red light.
The second curve, denoted by smaller dots, shows the decision of braking and stopping comfortably before the stop line.
Both curves share the driver's reaction to the yellow light before the intersection.
European Transport \ Trasporti Europei (2017) Issue 63, Paper n° 8, ISSN 1825-3997
5
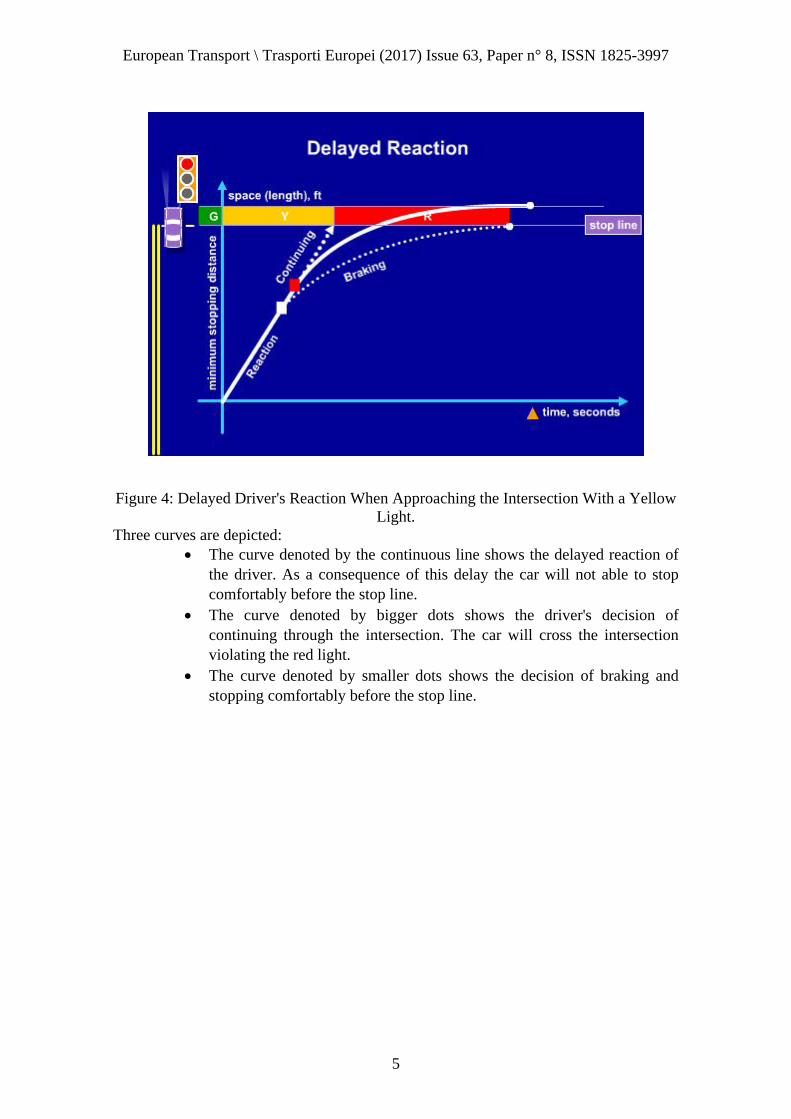
Figure 4: Delayed Driver's Reaction When Approaching the Intersection With a Yellow Light.
Three curves are depicted: The curve denoted by the continuous line shows the delayed reaction of
the driver. As a consequence of this delay the car will not able to stop comfortably before the stop line.
The curve denoted by bigger dots shows the driver's decision of continuing through the intersection. The car will cross the intersection violating the red light.
The curve denoted by smaller dots shows the decision of braking and stopping comfortably before the stop line.

European Transport \ Trasporti Europei (2017) Issue 63, Paper n° 8, ISSN 1825-3997
6
Figure 5: The Driver's Decision To Go, But The Decision Is Done Too Late So The Car
Will Not Be Able To Go Through The Intersection Safely.
Two curves are depicted: The curve denoted by the continuous line shows the decision to go that
results in violating the red light when the stop line is crossed. The curve denoted by smaller dots shows the decision of braking and
stopping comfortably before the stop line.

European Transport \ Trasporti Europei (2017) Issue 63, Paper n° 8, ISSN 1825-3997
7
Figure 6: Driver Started To Brake But Then Change His/hers Mind And Tries To Go
Through The Intersection.
Two curves are depicted The curve denoted by the continuous line shows the initial decision to
brake and then the decision to accelerate and continue. This decision will result in a violation of the red light when the stop line is crossed.
The curve denoted by smaller dots shows the decision of braking and stopping comfortably before the stop line.
2.2 Dilemma zone analysis
Most of the researches done on dilemma zone focused on definition and determination of boundaries of dilemma zone based on the data obtained from different surveys. According to Zhang et al. (2014) the definition of dilemma zone found in literature can be divided into two categories. First one is the definition based on probability of stopping (Zegeer et. al., 1977). Second one is the definition based on deterministic kinematical equations for safe stopping and clearance (ITE, 2001). In the first case, drivers’ probability for stopping defines the dilemma zone boundaries. The assumption that 90% of drivers will stop if amber were displayed defines the beginning of the zone, and, the distance within which 10% of driver will stop is defined as end of the zone. In case of varying decisions by the drivers this zone covers majority of the area. In the second case, the driver is said to be in dilemma zone if, at amber, he/she can neither stop safely nor clear the approach within the amber duration. According to Papaioannou (2007), if the driver decides to pass through signal, a critical crossing distance (CCD) is always associated with the driver approaching traffic signal. This critical crossing distance(CCD) depends upon, approaching speed(V) , perception reaction time (p), performance in accelerating and road gradient. If driver chose to stop instead, then a minimum safe stopping distance (SSD) is required for the vehicle to stop

European Transport \ Trasporti Europei (2017) Issue 63, Paper n° 8, ISSN 1825-3997
8
safely. The factors on which SSD depends are same as for CCD, but deceleration instead of acceleration and pavement condition as an additional factor is also important. SSD is also strongly depends upon friction coefficient (m). if the driver is within critical crossing distance, that corresponds to his/her speed, then driver should keep on going to cross the stop line. Similarly if the driver is outside safe stopping distance that corresponds to vehicles speed it is wise to brake and stop. Designing signalized junctions must be aimed in a way to avoid dilemma zone situation for drivers who are driving within speed limits. Dilemma zone elimination is not possible for the drivers driving over speed limits unless a long yellow time or possibly all red interval is set. At high speed signalized intersections, advance warning signs should be installed to ensure secure driver actions. Studies in US and Europe show that these signs had a significant effect on drivers (Head et al., 1992). There are several mathematical equations available for calculation of SSD and CCD.
PVx
vds
0
202/1
(1)
Where
sd Smooth deceleration rate
x Distance of vehicle from stop line at the onset of amber
0V The approaching speed of vehicle
P The perception/reaction time
mooc dvpvSSD 2/2 (2)
Where
0V The approaching speed of vehicle
P The perception/reaction time
md The maximum deceleration
)( lwtvCCD oo (3)
])([2/1)( 2ptalwtvCCDa mo (4)
Where
oCCD Critical crossing distance without acceleration
CCDa Critical crossing distance with maximum acceleration
ma The maximum acceleration rate
w The width of the crossing road t The yellow time interval l The vehicle length These four equations showed the mathematical forms for SSD and acceleration rate in case of force and smooth braking, as well as CCD in case of crossing with and without acceleration. Also, these equations include some of the driver factors, like, perception/reaction time, deceleration/acceleration rate, and decision making time. Whereas some characteristics are not taken into account, like, age and gender, experience, concentration level etc. so the choice of driver to stop or go depends upon the combination of these factors and both objective and subjective data are interrelated to each other. In short, following are the factors which can influence the decision of drivers while approaching to a signalized junction.
Driver characteristics

European Transport \ Trasporti Europei (2017) Issue 63, Paper n° 8, ISSN 1825-3997
9
Distance from stop line Gradient Pavement conditioner Vehicle characteristics Signal cycle length Phasing sequence Position in platoon Vehicle speed Overall intersection layout Yellow signal duration
Literature reviews has been studied to gain a greater understanding on dilemma zone situations and driver behaviors at signalized intersections. Different scenarios of dilemma zone and different aspects of driver behavior at signalized junctions have been reviewed in relation to safety at signalized junctions. Key points of impact of these situations on safety at signalized junctions have been obtained and main findings are discussed here. The real dilemma exists at high speed intersections. The situation become more complex as approaching speeds becomes high. There is always a problem for drivers in stopping safely during amber or crossing stop line before red. Drivers usually exposed to two kinds of risks in such conditions.
Rear end collisions in case of abrupt stopping. Angle accidents if attempts are made to cross at the onset of red interval.
As compared to other conflicts, more accidents happen due to red light conflicts in a road network. Design speed along with excessive approach speed is one of the major factors for such accidents. To avoid these kinds of conflicts and to minimize red light conflicts many studies were conducted in recent past, some with really good effects on controlling or minimizing red light running. Red light cameras are found to be affective in some cases with additional benefits of helping to determine the cause of crashes which is the biggest advantage for researchers. It was found in literature review that there are several sources of marginal violations which are:
Intentional red light violations Misjudgment Temporary inattentiveness Incorrect stop/go decisions Excessive reaction time Insufficient yellow time
The factors which are responsible for these situations are: Traffic conditions Approach speed Directional uncertainty Proximity to the intersection

European Transport \ Trasporti Europei (2017) Issue 63, Paper n° 8, ISSN 1825-3997
10
Another important finding from literature review is that duration of amber time is not universal; it varies with speed limits and local authorities policies.Appropriate amber timing along with all red intervals can be an important safety measure but these countermeasures are not intended to reduce red light running; rather it is a safety measure. At high speed junctions with approach speed over 40MPH warning signs or advance amber flashing lights are advantageous, especially at junctions with limited site distances. Warning signs are beneficial with steep grade or curved approaches. Adjusting the approach speed based on observations and studies can effectively help to control red light running problems. Recently countdown timers are introduced in different countries to review the impacts on red light running. According to Amer (2016), these methods have significant effects on other factors like discharge rate but no significant effect on red light running violations. For good signal operation and safety, understanding the all possible scenarios of dilemma zone is essential. Addressing those scenarios is a key to safety and performance of that junction. Some scenarios can be addressed by selection of appropriate amber change and red clearance intervals; some can be addressed by proper design of detection system and appropriate selection of controlling timing parameters (Koll et al., 2004). In last thirty years, automated traffic enforcement has mainly been applied to speed and red light violations; however, these technologies are now being used for other violations, e.g., headways, lane management, and toll payment violations. Use of technologies, like vehicle detection systems can be employed to hold the green time to its maximum and allow the vehicle to legally enter the intersection and safely clear it.Some other countermeasures like removal of unwanted traffic lights and minimizing on street parking may be beneficial some times. 3. Methodology
In order to get a greater of dilemma zone scenarios and right violations a survey has been designed and conducted. The survey was conducted at a signalized T-junction. Objective was to see how drivers behave at signalized intersections which usually reflect by their compliance to red lights. The aim was also to observe the different situations drivers have to face at the onset of amber, how they react to these situations and what are the effects of approaching speeds, distance from stop line or other conditions like, time of day, day of week etc. on their decisions. 3.1 Survey site
The survey was carried out at a signalized T-junction, located near University of Salford campus. The major arm is A6 (the crescent) minor arm is called Irwell place.

European Transport \ Trasporti Europei (2017) Issue 63, Paper n° 8, ISSN 1825-3997
11
Figure 7: Site View Taken From Google Earth. This signalized intersection is located near university of Salford campus connecting the ire well place to main A6. Volume of traffic is very high at A6 but for the minor arm it’s very low, and almost no traffic on minor arm at weekends. As shown in the figure, a pedestrian crossing exists just before the main signal, which also affects the behavior of the drivers and performance of the junction. The Crescent (A6) is a 40mph road. It consists of three lanes, prior to the junction. First lane is a bus lane; other two will be shared by the rest of the traffic. Cycle time is 120seconds for weekdays, it is different for weekends because of low traffic volumes on A6 and traffic at minor arm is negligible. 3.2 Survey methodology
The method adopted for this particular survey is of videotaping. A digital camera was used. Survey is carried out in free flowing condition and clear weather. The filming was done for the traffic at A6 for the traffic moving towards Manchester town centre as shown in figure.

European Transport \ Trasporti Europei (2017) Issue 63, Paper n° 8, ISSN 1825-3997
12
Figure 8: Site View And Camera Position(Derived From Google Earth) Same survey is repeated three times to compare different time of day, and different days of week.First survey was done on Wednesday morning from 11 am to 12 pm as morning off-peak time in weekdays. Second was done from 2:45pm to 3:45pm on Wednesday evening for evening off-peak. Final survey was for weekends, and was carried out on Saturday morning from 11am to 12pm. A continuous one hour filming was done for each survey. Analysis process subsequently was done at home using desktop computer. Microsoft movie maker software was used to watch and analyses the videos for all three surveys. 3.3 Extraction of data from videos
The traffic data were manually extracted from the videos, which was time consuming and fairly complicated. Data extracted from videos was on the basis of five different criteria of dilemma zone which were observed onsite. These criteria’s are; Criteria 1: Vehicle slowing down initially and then speed up to try to cross stop line but
violating red signal.
Criteria 2: Speeding up initially and then applying sudden brake.
Criteria 3: Carrying in same speed violate red light.
Criteria 4: accelerating after amber and violate red light.
Criteria 5: Carrying in same speed and apply sudden brakes.
Data extracted and its description is given below.
Camera position

European Transport \ Trasporti Europei (2017) Issue 63, Paper n° 8, ISSN 1825-3997
13
Table 1 Description of Extracted Data Type of data Description
Vehicle number Number of vehicles in frame at the onset of amber.
Criteria
Criteria’s mentioned above , that which vehicle falls
under which criteria
Probability
Probability of violation, if vehicle is under criteria 1,3 or
4 its 100 and zero otherwise
Cycle number There are 40 cycles recorded for weekdays mornings and
evening off-peak and 17 cycles for weekends
lane Whether the vehicle is in middle lane or far side lane.
Approaching speed Speed of vehicle as it enters the frame
Speed after amber
Distance from stop line Speed after signal turns to amber
Distance from stop line Distance of vehicle from stop line at the time of amber
4. Results
This part of paper includes:
Road user behavior analysis
Dilemma zone analysis
Speed analysis
Distance (from stop line) analysis
Combine effect of approaching speeds and distance from stop line at the
onset of amber
Focus of this exercise will be on key safety issues which will be determine by site
surveys and to come up with some sustainable solutions in the light of results obtained
by these exercises.
Table below showed the analysis table from the data extracted from the video of
weekday’s morning.
European Transport \ Trasporti Europei (2017) Issue 63, Paper n° 8, ISSN 1825-3997
14
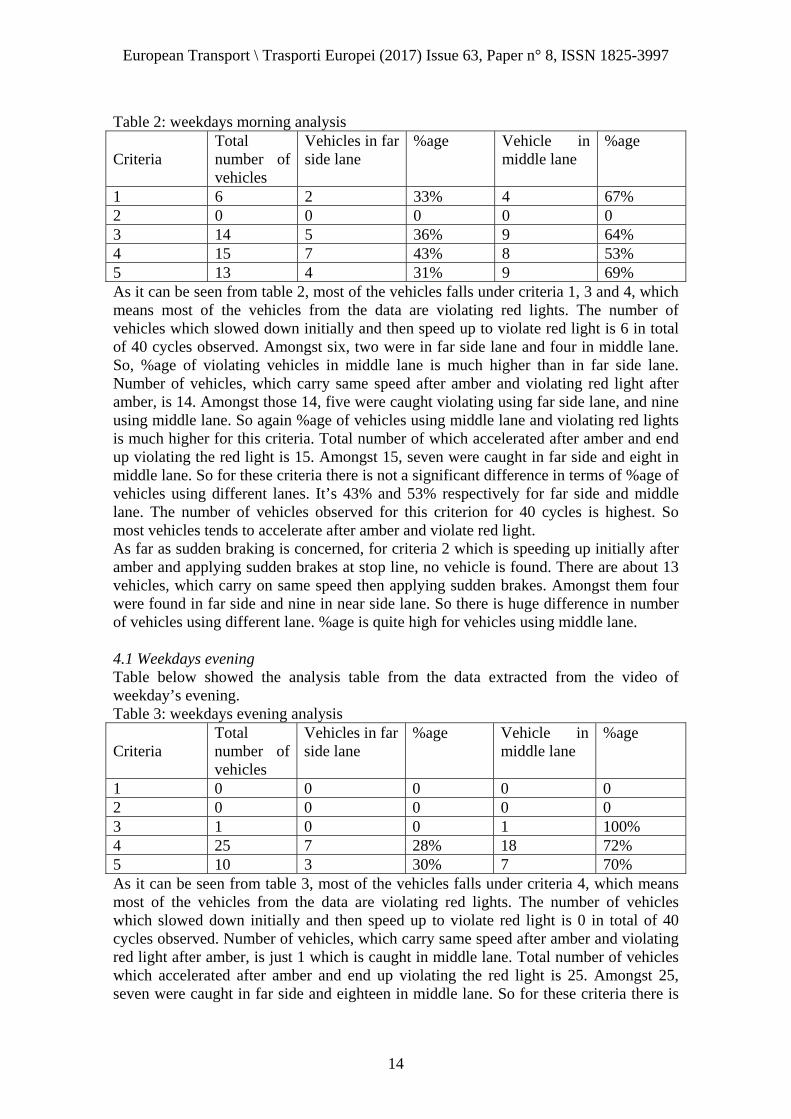
Table 2: weekdays morning analysis Criteria
Total number of vehicles
Vehicles in far side lane
%age Vehicle in middle lane
%age
1 6 2 33% 4 67% 2 0 0 0 0 0 3 14 5 36% 9 64% 4 15 7 43% 8 53% 5 13 4 31% 9 69% As it can be seen from table 2, most of the vehicles falls under criteria 1, 3 and 4, which means most of the vehicles from the data are violating red lights. The number of vehicles which slowed down initially and then speed up to violate red light is 6 in total of 40 cycles observed. Amongst six, two were in far side lane and four in middle lane. So, %age of violating vehicles in middle lane is much higher than in far side lane. Number of vehicles, which carry same speed after amber and violating red light after amber, is 14. Amongst those 14, five were caught violating using far side lane, and nine using middle lane. So again %age of vehicles using middle lane and violating red lights is much higher for this criteria. Total number of which accelerated after amber and end up violating the red light is 15. Amongst 15, seven were caught in far side and eight in middle lane. So for these criteria there is not a significant difference in terms of %age of vehicles using different lanes. It’s 43% and 53% respectively for far side and middle lane. The number of vehicles observed for this criterion for 40 cycles is highest. So most vehicles tends to accelerate after amber and violate red light. As far as sudden braking is concerned, for criteria 2 which is speeding up initially after amber and applying sudden brakes at stop line, no vehicle is found. There are about 13 vehicles, which carry on same speed then applying sudden brakes. Amongst them four were found in far side and nine in near side lane. So there is huge difference in number of vehicles using different lane. %age is quite high for vehicles using middle lane. 4.1 Weekdays evening Table below showed the analysis table from the data extracted from the video of weekday’s evening. Table 3: weekdays evening analysis Criteria
Total number of vehicles
Vehicles in far side lane
%age Vehicle in middle lane
%age
1 0 0 0 0 0 2 0 0 0 0 0 3 1 0 0 1 100% 4 25 7 28% 18 72% 5 10 3 30% 7 70% As it can be seen from table 3, most of the vehicles falls under criteria 4, which means most of the vehicles from the data are violating red lights. The number of vehicles which slowed down initially and then speed up to violate red light is 0 in total of 40 cycles observed. Number of vehicles, which carry same speed after amber and violating red light after amber, is just 1 which is caught in middle lane. Total number of vehicles which accelerated after amber and end up violating the red light is 25. Amongst 25, seven were caught in far side and eighteen in middle lane. So for these criteria there is

European Transport \ Trasporti Europei (2017) Issue 63, Paper n° 8, ISSN 1825-3997
15
significant difference in terms of %age of vehicles using different lanes. It’s 28% and 72% respectively for far side and middle lane, which is a huge contrast for these criteria from weekday’s mornings. The number of vehicles observed for this criterion for 40 cycles is highest. So most vehicles tends to accelerate after amber and violate red light. As far as sudden braking is concerned, for criteria 2 which is speeding up initially after amber and applying sudden brakes at stop line, no vehicle is found. There are about 10 vehicles, which carry on same speed then applying sudden brakes. Amongst them three were found in far side and seven in middle lane. So there is huge difference in number of vehicles using different lane. %age is quite high for vehicles using middle lane. 4.2 Weekends Table below showed the analysis table from the data extracted from the video of weekends. Table 4: weekend analysis Criteria
Total number of vehicles
Vehicles in far side lane
%age Vehicle in middle lane
%age
1 0 0 0 0 0 2 0 0 0 0 0 3 9 3 33% 6 67% 4 5 1 20% 4 80% 5 0 0 0 0 0 Traffic flow on A6 is usually very low on weekends. So the sample size from the weekend survey is very low, in fact consists of only 14 vehicles. There are no vehicles caught under criteria 1, 2 and 5. All the vehicles were violating red lights. Number of vehicles, which carry same speed after amber and violating red light after amber, is 9. Amongst those 9, three were caught violating using far side lane, and 6 using middle lane. So again %age of vehicles using middle lane and violating red lights is much higher for this criteria. Total number of vehicles which accelerated after amber and end up violating the red light is 5. Amongst 5, one was caught in far side and four in middle lane. So for these criteria there is again significant difference in terms of %age of vehicles using different lanes. It’s 20% and 80% respectively for far side and middle lane, which is a huge contrast for this criteria from weekdays mornings but more or like same to weekends evening despite low traffic volume. So most vehicles carry same speed after amber and violate red light on weekends. 4.3 Overall analysis Table below showed the analysis table from the data extracted from all the videos. Combining results of all three surveys together following results are obtained to analyze the general trend of behavior on site.

European Transport \ Trasporti Europei (2017) Issue 63, Paper n° 8, ISSN 1825-3997
16
Table 5: Overall Analyses Criteria
Total number of vehicles
Vehicles in far side lane
%age Vehicle in middle lane
%age
1 6 2 33% 4 67% 2 0 0 0 0 0 3 24 8 33% 16 67% 4 45 15 33% 30 67% 5 23 7 30% 16 70% As it can be seen from table 5, most of the vehicles falls under criteria 3, 4 and 5, which means most of the vehicles from the data are violating red lights or applying sudden brakes. The number of vehicles which slowed down initially and then speed up to violate red light is 6. Amongst six, two were in far side lane and four in middle lane. So, %age of violating vehicles in middle lane is much higher than in far side lane. All 6 vehicles are caught violating on weekdays morning, no vehicle under this category is found on weekdays evenings or weekends. Number of vehicles, which carry same speed after amber and violating red light after amber, is 24. Amongst those 24, eight were caught violating using far side lane, and sixteen using middle lane. So the overall %age of vehicles using middle lane and violating red lights is much higher. Total number of which accelerated after amber and end up violating the red light is 45 in total. Amongst 45, fifteen were caught in far side and thirty in middle lane. So for this criteria there again a significant difference in terms of %age of vehicles using different lanes. It’s 33% and 67% respectively for far side and middle lane. So the total %age of vehicles for this criteria is 44% amongst all the vehicles as compared to 23%for criteria 3 and just 5.8% for criteria1.The number of vehicles observed for this criterion for 40 cycles is highest amongst all criteria. So most vehicles tends to accelerate after amber and violate red light. As far as sudden braking is concerned, for criteria 2 which is speeding up initially after amber and applying sudden brakes at stop line, no vehicle is found. There are about 23 vehicles, which carry on same speed then applying sudden brakes. Amongst them seven were found in far side and 16 in middle lane. So there is huge difference in number of vehicles using different lane. %age is quite high for vehicles using middle lane. So it has been observed for vehicles violating red light, %age of vehicles travelling in middle lane is 62.5%, and for vehicles applying sudden braking its 70% for vehicles using middle lane. It also showed amongst all data total %age of vehicles which ends up violating red light is 73.5%. 4.4 Speed analysis Number of vehicles for all criteria in relation with their speeds is shown in table below.

European Transport \ Trasporti Europei (2017) Issue 63, Paper n° 8, ISSN 1825-3997
17
Table 6: Distribution of Data amongst Different Speed Groups.
Speed limit Criteria
Number of vehicles with approaching speeds.
Total vehicles
Number of vehicles with speeds after amber
Total vehicles
10-15
1 0
0
1
1
3 0 0
4 0 0
5 0 0
15-20
1 0
0
0
0
3 0 0
4 0 0
5 0 0
20-25
1 0
0
0
0
3 0 0
4 0 0
5 0 0
25-30
1 0
5
2
27
3 3 4
4 2 0
5 0 21
30-35
1 3
76
1
16
3 17 13
4 35 1
5 21 1
35-40
1 1
10
1
24
3 2 4
4 6 18
5 1 1
40-45
1 0
1
1
28
3 0 3
4 0 24
5 1 0
45-50
1 1
1
0
2
3 0 0
4 0 2
5 0 0 Table 6 shows the speed groups for all criteria. As it can be seen from the table for speed group 10-15MPH, there is only one vehicle found after amber in this range. There is no vehicle with approaching speed in this limit. For speed limits 15-25MPH and 20-25MPH there is no vehicle before or after amber. For speed group 25-30MPH, there are 5 vehicles in total with approaching speed and all of them ends up violating red light. Twenty seven vehicles found in this range after amber. Amongst them 21 stopped at stop line and 6 ended up violating red light. So

European Transport \ Trasporti Europei (2017) Issue 63, Paper n° 8, ISSN 1825-3997
18
vehicles with approaching speeds in this speed group more likely to violate, vehicles in this group found after amber are likely to stop. For speed group 30-35MPH, there are 76 vehicles with approach speed in this limit. Amongst 76, 55 end up violating red light and 21 apply sudden brakes. Vehicles for approaching speeds between 35-40MPH are more likely to run red light. Sixteen vehicles after amber are found in this group, 15 ends up violating red light. For speed group 35-40MPH, there are 10 vehicles with approach speed in this limit, 9 end up violating red light and just 1 apply sudden brakes. Vehicles for approaching speeds between 40-45MPH are more likely to run red light. Twenty four vehicles after amber are found in this group, 23 ends up violating red light. For speed group 40-45MPH, there is just 1 vehicle with approaching speed. Surprisingly, it stopped at stop line. Twenty eight vehicles are found after amber and they all end up violating red light. For speed group 45-50MPH, one vehicle is found with approaching speed and 2 with speeds after amber; all three of them end up violating red. 4.5 Distance (from stop line) analysis Table 7: Distribution of Data Based On Different Groups for Distances from Stop Line. Distance from stop line(meters) Criteria
No of vehicles
Percentage for criteria Total Percentage
18-20
1 4 4.08
31 31.63
3 9 9.18
4 17 17.35
5 1 1.02
20-22
1 2 2.04
41 41.84
3 14 14.29
4 20 20.41
5 5 5.10
22-24
1 0 0.00
15 15.31
3 1 1.02
4 8 8.16
5 6 6.12
24-26
1 0 0.00
11 11.22
3 0 0.00
4 0 0.00
5 11 11.22 Table 7 shows the distance groups for all criteria. As it can be seen from the table, for distance group 18-20 meters, total of 31 vehicles found at the onset of amber. Amongst them, 1 vehicle ends up applying sudden brake. All other 30 vehicles violate the red light. So percentage of vehicles violating for distances of 18-20meters from stop line is 97. For vehicles within the range of 20-22 meters from the stop line, there are a total of 41 vehicles found. Amongst them 5 end up applying sudden brake while 36 ends up violating. So the percentage of violation for this distance group is about 88% approximately.

European Transport \ Trasporti Europei (2017) Issue 63, Paper n° 8, ISSN 1825-3997
19
For distance group 22-24 meters there is a total of 15 vehicles found. Amongst 15, 9 end up violating red light and 5 applying sudden brake. So percentage of violators for this group is 60%. Finally for vehicles in range of 24-26 meters, total of 11 vehicles are found and all end up stopping before stop line. So for this group no vehicle is found violating red light. So it is quite obvious that as the distance from stop line increases percentage of red light violation reduces. 4.6 Distance vs. speed (violating red light)
Figure 9: Data Distribution between Distance and Speed Groups for Vehicles Violating Red Lights As can be seen in the figure above most vehicles caught violating with the speed limit of 30-45MPH and distance of 18-22 meters from stop line. So for this particular junction these speed and distance values are critical.
Distance (m) vs Speed (mph)
y = 0.0429x + 18.816
R2 = 0.0254
18
19
20
21
22
23
24
23 25 27 29 31 33 35 37 39 41 43 45 47
Speed (mph)
Distance
(m)
criteria 1‐4
Linear (criteria 1‐4)

European Transport \ Trasporti Europei (2017) Issue 63, Paper n° 8, ISSN 1825-3997
20
4.7 Distance vs. speed (applying sudden brake)
Figure 10: Data Distribution Between Distance And Speed Groups For Vehicles Applying Sudden Brake. As can be seen in the figure above, certain number of vehicles found to be applying sudden brake. But in contrast, most of the vehicles in this criteria are found to be in speed range of 25-30MPH and distance of 22-26 meters from stop line. 5. Conclusion and Recommendations
This paper focuses on safety at signalized junctions taking into account different aspects of red light running and situations of dilemma zone related to it. All drivers have their own perceptions to deal with different situations while driving, but at signalized junctions there are several factors which affect their decisions. Sometime there are situations where drivers have different choices but sometimes they have to deal with situations where they have only one choice. Several factors affect the decision of driver to stop or go in dilemma zone. Most important factor which influences the driver’s decision is their approaching speeds. Higher the approaching speed driver is more likely to violate. Second important factor is distance of vehicle from stop line at the onset of amber. Vehicles which are closer to stop line are more likely to violate or sudden stop. Combination of both approaching speeds and distance from stop line has significant effect on drivers. Some vehicles being very close to stop line at onset of amber can stop comfortably due to low approaching
Distance vs speed
y = ‐0.3469x + 33.057
R2 = 0.2161
18
19
20
21
22
23
24
25
26
27
24 25 26 27 28 29 30 31 32 33 34 35 36 37 38
Speed
Dista
nce
criteria 5
Linear (criteria 5)

European Transport \ Trasporti Europei (2017) Issue 63, Paper n° 8, ISSN 1825-3997
21
speed. Similarly vehicles with high approaching speeds find it comfortable to stop due to longer distance from stop line. The percentage of aggressive drivers seems to be quite high for all three surveys.A central value for overall noncompliance is 70%.This bears safety issues for studied signalized junction, since a large number of drivers may be caught in the middle of the intersection lacking adequate clearing time. Prolonging amber signal time will not improve the situation, since it will create longer option zones and subsequently uncertainty that may be the cause of rear end accidents(Koll et al., 2004) In this paper survey has been conducted at a specified site with specified time which provides audience a certain level of understanding how drivers behave at traffic signals, thus observing just few scenarios of dilemma zone and red light running, therefore observations on all possible scenarios are not fully studied. With respect to the appropriate measures aiming at improving the current situation, if approaching speeds are high, advance warning flashing lights and advance detection systems will have to be installed. In addition, stricter enforcement should be introduced at such locations. Adjustments of the speed limits may be necessary to reflect the real traffic conditions. Finally, educating drivers must be the preferred long-term measure that will improve the existing situation and that will secure in conjunction with the other measures a better behavior. Acknowledgement The authors thank the anonymous reviewers for their valuable comments. References
Amer, M. M. A. 2016. Statistical and behavioral modeling of driver behavior on signalized intersection approaches. PhD thesis, Virginia Polytechnic Institute and State University.
Head, L.K., P.B. Mirchandani, and D. Sheppard. 1992. Hierarchical Real-Time Traffic Control. Transportation Research Record, 1992. 1360: p. 82-88.
Institute of Transportation Engineers (ITE), Traffic Control Devices Handbook, ed. J.L. Pline. 2001, Washington, DC: Institute of Transportation Engineers.
Koll, H., Bader, M., Axhausen, K.W. 2004. Driver’s behavior during flashing green before amber: a comparative study. Accident Analysis and Prevention, 36 (2), 273–280.
Papaioannou, P. 2007. Driver Behaviour, Dilemma Zone and Safety Effects at Urban Signalised Intersections in Greece. Journal of Accident Analysis and Prevention. 39(1): p. 147-158.
Zegeer, C. V. 1977. Effectiveness of green-extension systems at high-
speed intersections.Research Report 472,Kentucky Department of
TransportationFrankfort. Zhang, Y., Fu, C., Hu, L. 2014 .Yellow light dilemma zone researches: a
review. Journal of Traffic and Transportation Engineering (English Edition), (5): 338-352.


![Rhotic contrasts in Arabana · 2019. 7. 31. · Three-way rhotic disti nctions are rare in Australia [4], and more generally [12]. In Arabana, th threeis -way opposition is neutralized](https://static.fdocuments.us/doc/165x107/610a9b7305461a71bd21ea2a/rhotic-contrasts-in-arabana-2019-7-31-three-way-rhotic-disti-nctions-are-rare.jpg)