IMPACTS OF A GLOBAL CARBON PRICE ON CONSUMPTION AND … › media › 1384 › carbon-pricing... ·...
35
IMPACTS OF A GLOBAL CARBON PRICE ON CONSUMPTION AND VALUE CREATION Implications for carbon pricing design
Transcript of IMPACTS OF A GLOBAL CARBON PRICE ON CONSUMPTION AND … › media › 1384 › carbon-pricing... ·...

IMPACTS OF A GLOBAL CARBON PRICE ON CONSUMPTION AND VALUE CREATIONImplications for carbon pricing design

This report was prepared under the Carbon Pricing Unlocked partnership by Maarten Neelis, Noémie Klein, Maurice Quant, and Kornelis Blok of Ecofys, Shalini Rao and Daniela Saltzman of the Generation Foundation, with inputs from Richard Wood, Daniel Moran, and Konstantin Stadler of the Norwegian University of Science and Technology and Harry Wilting of PBL Netherlands Environmental Assessment Agency.
We wish to thank everyone who offered their cooperation and insights during the development of this publication: Nicolette Bartlett (CDP), Andrzej Blachowicz (Climate Strategies), Stefanie Bradtner (Ecofys), Maria Carvalho (London School of Economics), Alyssa Gilbert (Imperial College London), Michael Grubb (University College London), Tom Lorber (Children’s Investment Fund Foundation), Lindee Wong (Ecofys), and Norihiko Yamano (Organisation for Economic Co-operation and Development).
The views expressed in this report are those of the authors. We accept any errors in this document as our own.
Rights and permissions This Report, and all text, artwork, photographs, layouts and other content and associated intellectual property rights, including copyright, included herein are owned by The Generation Foundation, or used with permission.
The content of this Report is provided to you for general, non-commercial purposes only. Although we endeavoured to ensure the content is accurate as at the date of publication, The Generation Foundation is not responsible for loss or damages arising from reliance on information contained herein.
November 2016
Unless otherwise stated, all content is licensed to you under the Creative Commons Attribution-Non-Commercial 3.0 Unported licence (http://creativecommons.org/licenses/by-nc/3.0/). This means you may share the content by copying, distributing, and transmitting it, and you may produce derivative works from the content, but you may not make commercial use of it and you must always attribute it to The Generation Foundation.
You must always make reference to the Creative Commons Attribution-NonCommercial 3.0 Unported licence with your use of any content of this Report and retain any other copyright or proprietary notices or other licensing information specified by The Generation Foundation.
Attribution Please cite the work as follows: Generation Foundation and Ecofys. 2016. Impacts of a global carbon price on consumption and value creation – Implications for carbon pricing design, London, United Kingdom. Prepared under the Carbon Pricing Unlocked partnership between the Generation Foundation and Ecofys with inputs from the Norwegian University of Science and Technology and PBL Netherlands Environment Assessment Agency.
Cover and interior design: Meike Naumann Visuelle Kommunikation

IMPACTS OF A GLOBAL CARBON PRICE ON CONSUMPTION AND VALUE CREATIONImplications for carbon pricing design

22
ABOUT US
About Ecofys
Established in 1984 with the mission of achieving “sustainable energy for everyone”, Ecofys has become the leading expert in energy policies, climate strategies and policies, energy systems and markets, urban energy as well as sustainable industries and services. Ecofys creates smart, effective, practical and sustainable solutions for and with public and corporate clients. With offices in Belgium, the Netherlands, Germany, and the United Kingdom, Ecofys employs over 200 experts dedicated to solving energy and climate challenges.
Carbon pricing forms part of Ecofys’ core expertise: since the European Union Emissions Trading System conception, we have advised the European Commission and other stakeholders on its design, and we continue to provide analyses on the potential impacts of proposed changes. Capturing the topic in its global scope, Ecofys has been assisting the World Bank in producing their annual flagship report State and Trends of Carbon Pricing over the past four years. We also work with the industry on compliance and internal carbon pricing strategies, and thereby provide a fully rounded perspective on carbon pricing that spans from policies and technological innovation, to impacts at the consumer level.
For more information, please contactNoémie Klein at [email protected]
www.ecofys.com
About Generation Foundation
The Generation Foundation (the ‘Foundation’) was part of the original vision of Generation Investment Management LLP (‘Generation’) since the firm was founded in 2004. The Foundation was established alongside Generation in order to strengthen the case for Sustainable Capitalism. Our strategy in pursuit of this vision is to mobilise asset owners, asset managers, companies and other key participants in financial markets in support of the business case for Sustainable Capitalism. In our effort to accelerate the transition to a more sustainable form of capitalism, we primarily use a partnership model to collaborate with individuals, organisations and institutions across sectors and geographies and provide catalytic capital when appropriate. In addition, the Foundation publishes in-house research, gives select grants related to the field of Sustainable Capitalism, engages with our local communities and supports a gift matching programme for the employees of Generation. All of the activities of the Foundation, a not-for-profit entity, are funded by a distribution of Generation’s annual profitability.
For more information, please contactDaniela Saltzman at [email protected]
www.genfound.org

3
ABOUT CARBON PRICING UNLOCKED
T oday, about 40 national jurisdictions and over 20 cities, states, and regions are putting a price on carbon. Despite this global uptake,
harmonisation of carbon pricing policies across different regions remains difficult. Furthermore, carbon prices are often too low to incentivise the investment necessary to decarbonise emissions-intensive value chains. At the end-consumer level, the impact of carbon pricing is often insufficient to drive changes towards consumption of low carbon goods and services.
How can carbon pricing facilitate sustainable global economic growth? To find answers to this question, the Generation Foundation has teamed up with Ecofys in the Carbon Pricing Unlocked (CPU) research partnership. The research extends over three years from 2016 to 2019 and tackles carbon pricing from a new angle, exploring the role of carbon pricing along value chains up to the end-consumers. The partnership aims to deliver quantified insights into the role carbon pricing can play in a 1.5°C future.
Ecofys is one of the pioneers in carbon pricing, and has worked on the topic for nearly two decades. The Generation Foundation is the advocacy initiative of Generation Investment Management LLP, which was co-founded by Al Gore and David Blood in 2004, and works on the decoupling of prosperity from resource-intensive growth. Combining in-depth expertise with a high-level stakeholder network, Ecofys and The Generation Foundation investigate how carbon pricing might be better integrated at an economic policy level in order to unlock its full mitigation potential.
For this first output under the CPU partnership, Ecofys and the Generation Foundation worked together with the Norwegian University of Science and Technology and PBL Netherlands Environmental Assessment Agency.
Our partnership welcomes collaboration with interested parties. To receive news and updates about our partnership, please sign up at [email protected].

4
T he 2015 Paris Agreement and its subsequent policy implications are pivotal steps for mankind in its effort to combat climate change. For the
first time in history, all Parties to the United Nations Framework Convention on Climate Change (UNFCCC) have committed to take action to limit global warming. According to UN Secretary-General Ban Ki-moon this momentum highlights “the urgency for action, and reflects the consensus of governments that robust global cooperation, grounded in national action, is essential to meet the climate challenge.” 1
With the Paris Agreement now in force, the attention is shifting to implementation. While the various Nationally Determined Contributions submitted by countries diverge in their foreseen climate change strategy, about two-thirds of the national pledges refer to carbon pricing as one of the measures to reduce greenhouse gas (GHG) emissions. Carbon pricing internalises the costs of climate change, making it part of the economic decision-making process. Carbon pricing thus has the potential to facilitate the decarbonisation of global value chains enabling sustainable economic value creation and growth.
Carbon pricing discussions often take a simple “vertical” view through a specific jurisdiction, company, or sector. However, climate change is a global issue with impacts across all jurisdictions, all companies and all sectors. In this study we provide a “horizontal” perspective on how carbon pricing affects global value chains across regions and sectors. We analyse GHG productivity: the ratio between the economic value created and GHG emissions along each stage in global value chains.
The GHG productivity, defined as the value created per unit of GHG emitted, ranges from US$0.2–3.6/kgCO2e for the consumption categories studied. The global average GHG productivity equals US$1.7/kgCO2e. The wide range is attributed to the diversity of the value chains in different sectors. Assuming a global carbon price of US$100/tCO2e, consistent with scenarios to limit global warming to 2°C, we derive the value at stake for the goods and services we consume, grouped by consumption category. The value at stake ranges from 3% for the consumption of medical care, public and other services to as high as 59% for the use of fuels for space heating and cooking.
Carbon pricing raises revenues for governments through taxes and allowance auctions. These revenues can be recycled back into the economy. Assuming that carbon pricing revenues are redistributed into the economy in proportion to the value created, we calculate the impact that global carbon price could have on consumer prices. A global carbon price could make consumption of services 3% cheaper, whereas consumption of material products (shelter and construction, clothes, furniture and appliances) as well as food consumption could become up to 3% more expensive. The average potential price increase for mobility is around 5%, the potential price increase for electricity and fuel use could be 50%. All these estimates are static and theoretical, assuming no value chain response in terms of uptake of GHG emissions abatement, no consumer behaviour responses, and no differentiation in carbon prices applied by region. The estimates nonetheless illustrate how different value chains are affected by a global carbon price.
1 Source: UN, “Paris Climate Agreement to Enter into Force on 4 November, 2016,” 2016, http://www.un.org/sustainabledevelopment/blog/2016/10/paris-climate-agreement-to-enter-into-force-on-4-november/.
EXECUTIVE SUMMARY

5
What does this analysis imply for the design of effective carbon pricing policies? Our main findings can be summarised as follows:
1. A global carbon price is unlikely to cause major shifts in consumption patterns between materials, food and services. This is due to the typically low price responsiveness of consumption in combination with modest price impacts due to carbon pricing.
2. In the value chains related to the consumption of materials and food, emissions occur upstream, whereas value creation happens more downstream. Carbon pricing is well suited to provide the necessary incentives to decarbonise lower GHG productive mining and manufacturing processes upstream given that these sectors compete on costs.
3. Governments often combine carbon pricing with measures to avoid negative impacts on industrial competiveness. As a result, the carbon price is not always passed on in the value chain and does not incentivise lower GHG emissions downstream.
4. The horizontal lens applied in this research reveals the need for carbon pricing approaches that incentivise higher GHG productivity throughout full value chains. Possible examples include a GHG consumption charge based on the material content of consumer goods, a carbon added tax or globally applied sectoral carbon pricing approaches for key industrial commodities.
5. For the consumption of food, clothing, furniture and appliances, large consumer-facing companies could play a role of “aggregators of GHG emissions” in their supply chain. At these companies, internal carbon pricing approaches, not only focused on the companies’ own emissions, but also on the supply chain emissions could play a role to incentivise decarbonisation throughout the supply chain. This is a topic we aim to address in the next phase of the CPU partnership.
6. For shelter and construction, a point to note is the important role of the public sector. Public entities could further step up in requiring the construction supply chain to disclose information on GHG productivity and use a carbon price as part of public procurement procedures or to create funds that could be re-invested in the supply chain to increase its GHG productivity.
7. Notable exceptions to the pattern of relatively modest impacts of carbon pricing on end-consumer prices are the consumption of electricity, the use of fuels for space heating, cooking, as well as our mobility. The low average GHG productivity of these often short and to a large extent localised value chains make them attractive candidates for the application of carbon pricing policies to drive decarbonisation.
8. For carbon pricing to cost-effectively support decarbonisation, it is essential that competing technologies fulfilling the same need all face a similar carbon price. This is an important implication for the design of carbon pricing policies resulting from the horizontal value chain lens applied in this research.
9. Income distribution effects resulting from carbon pricing policies need sufficient attention. A targeted revenue recycling approach could be used to compensate for price increases affecting certain low income or otherwise vulnerable groups and to enhance the impact of the policies. We intend to study revenue recycling models in more depth in the next phase of the CPU partnership.

6
TABLE OF CONTENTS
INTRODUCTIONPage 7
METHODOLOGYPage 9
MAPPING GLOBAL GHG PRODUCTIVITY ALONG VALUE CHAINSPage 12
CARBON PRICING IMPLICATIONS FOR FINAL CONSUMPTION CATEGORIESPage 16
INSIGHTS FOR EFFECTIVE CARBON PRICING DESIGNPage 25
1
2
3
4
5
6 LIST OF ABBREVIATIONS AND ACRONYMS Page 28
ANNEX I » LIST OF SECTORSPage 29
ANNEX II » LIST OF CONSUMPTION CATEGORIES Page 30

7
2 Source: World Bank, Ecofys and Vivid Economics, State and Trends of Carbon Pricing (Washington, DC: World Bank, 2016).
3 Source: CDP, Embedding a Carbon Price into Business Strategy, 2016.4 Source: J. Rydge, Implementing Effective Carbon Pricing. Contributing Paper for Seizing the Global Opportunity:
Partnerships for Better Growth and a Better Climate (London and Washington DC: New Climate Economy, 2015).5 “The value chain describes the full range of activities that firms and workers do to bring a product from its
conception to its end use and beyond. The activities that comprise a value chain can be contained within a single firm or divided among different firms. Value chain activities can produce goods or services, and can be contained within a single geographical location or spread over wider areas.” From https://globalvaluechains.org/concept-tools, accessed on 30 October 2016.
S upport for carbon pricing policies is growing worldwide given the urgency to reduce greenhouse gas (GHG) emissions. As of October
2016, 40 national jurisdictions and over 20 cities, states, and regions are putting a price on carbon - representing about 13% of global GHG emissions.2 Furthermore, over 1,200 businesses currently price their carbon emissions or intend to do so in the next two years to manage the risks associated with climate change.3
The entry into force of the Paris Agreement will further increase the momentum behind carbon pricing. While countries diverge in the policies they plan to apply, about two-thirds of the submitted national pledges for climate action refer to carbon pricing as a measure to tackle GHG emissions. New schemes are set to be introduced in China and Canada, amongst other countries. Declining oil, gas and coal prices over the past years have also provided a window of opportunity for policymakers and businesses to price carbon.4
Carbon pricing places a price on the external costs of GHG emissions. This allows these costs to be factored into total production costs and thus to become part of the economic rationale for actors taking investment decisions. GHG emissions are emitted as part of activities where economic value is created, and as such, carbon pricing has the potential to facilitate the decarbonisation of global value chains5 while enabling sustainable economic value creation and growth.
There are different forms of carbon pricing, including emission trading systems (ETSs)—both cap-and-trade and baseline-and-credit systems, carbon taxes, offset mechanisms and results-based climate finance mechanisms that use emission reductions related metrics. For governments, ETSs and carbon taxes are the main instruments. Over the last decade the difference between these two types of instruments has become less distinct. Several ETSs, including the Regional Greenhouse Gas Initiative in Northeast and Mid-Atlantic States of the United States and the New Zealand ETS, have included fixed price elements. Alternatively, carbon taxes can incorporate the use of credits, such as the proposed South African tax. Besides governments, companies can also set an internal carbon price or shadow price to facilitate decision-making toward more sustainable operations. More recently, the UN’s specialised aviation body—the Internal Civil Aviation Organization—has shown carbon pricing can be imposed on a complete sector, setting up a global offset mechanism to ensure international aviation follows a carbon-neutral growth trajectory.
The above examples illustrate that carbon pricing is often looked at through a “vertical” lens, either focusing on a specific jurisdiction, company or sector. However, climate change is a global issue with impacts across all jurisdictions, all companies and all sectors. The Paris Agreement recognises the cross-cutting nature of climate change and provides the impetus for countries, companies and sectors to limit the global temperature increase to 2°C, with the ambition of 1.5°C.
INTRODUCTION1

8
is created. How does this figure compare to the targets set out by the Paris Agreement? Assuming a global GDP growth of 3%7 per year until 2050, and required emission reductions of 40 to 70%8 compared to 2010 to keep global warming below 2°C, a global GHG productivity of around US$9-18/kgCO2e is needed by 2050. This means that global GHG productivity needs to increase by 4-6% each year to meet a 2°C target and even more for a 1.5°C target. There is thus an enormous need to decouple economic value creation from global GHG emissions.
Carbon pricing supports this increase in GHG productivity. It facilitates decision making towards production methods by producers as well as the end-consumption of goods and services (assuming cost pass-through) with relatively high value creation in relation to GHG emissions. For example, a carbon price could lead to more lightweight materials in products or consumers favouring a diet with less meat. The options are endless, raising multiple important questions. Where does carbon pricing work? Where is it most needed? What will be its impact? This report provides some answers to these questions.
In Chapter 2 of the report, we present the methodology we used in our research. In Chapter 3, we provide a global overview of global GHG emissions and value creation in the form of a global GHG productivity map. In Chapter 4, we then zoom in on specific consumption categories before drawing overarching conclusions on the implications for carbon pricing design in Chapter 5.
In this study, we provide a more “horizontal” perspective to these discussions, by looking at global value chains with the ultimate objective to provide insights in and support the design of more effective carbon pricing policies (see Figure 1). For example, we look at global food, mobility and service value chains to identify where value is created efficiently in relation to GHGs emitted.
The term “GHG productivity” is defined to describe this relationship, and represents the amount of value created per unit of GHG emitted. With global gross domestic product (GDP) approximately US$70.1 trillion and global emissions amounting to 41.6 GtCO2e,6 the global average GHG productivity is US$1.7/kgCO2e. In other words, for every kilogram of CO2-equivalent emissions emitted worldwide, US$1.7 of economic value
6 Derived from EXIOBASE 3 using 2011 data. Source: Richard Wood et al., “Global Sustainability Accounting—Developing EXIOBASE for Multi-Regional Footprint Analysis,” Sustainability Vol 7, Issue 1 (December 26, 2014): 138–163, doi:10.3390/su7010138.
7 Source: OECD, Long-Term Baseline Projections, 2014.8 Source: IPCC, Climate Change 2014: Synthesis Report. Contribution of Working Groups I, II and III to the Fifth
Assessment Report of the Intergovernmental Panel on Climate Change (Geneva, Switzerland, 2014).
FIGURE 1 Horizontal versus vertical perspective on carbon pricing
JURISDICTION
COMPANY
SECTORGLOBAL
VALUE CHAINS
Vertical perspective
Horizontal perspective

9
METHODOLOGY2
9 Source: Wassily W. Leontief, “Quantitative Input and Output Relations in the Economic Systems of the United States,” The Review of Economics and Statistics Vol 18, Issue 3 (August 1936): 105, doi:10.2307/1927837.
10 Source: Richard Wood et al., “Global Sustainability Accounting—Developing EXIOBASE for Multi-Regional Footprint Analysis,” Sustainability Vol 7, Issue 1 (December 26, 2014): 138–163, doi:10.3390/su7010138.
11 Using the six main greenhouse gases under the Kyoto Protocol: CO2, CH4, N2O, HFCs, PFCs, SF6. These are then converted to CO2e emissions using the global warming potential of 100 years from the IPCC (2007). Use-phase emissions from households are included, but emissions from land use, land-use change, and forestry are excluded as these are difficult to allocate to economic activity.
12 In this analysis we use GDP nominal and not purchasing power parity as regions in this analysis are aggregated.13 Various final end-consumption categories, including household and government consumption and capital
formation have been aggregated to one final demand category.
Linking GHG emissions and value creation through input-output analysis
In this research, we make use of input-output (I/O) analysis. I/O analysis depicts inter-industry relationships within an economy. It describes how the outputs from one sector of the economy become the inputs for other sectors of the economy. At the core of I/O models are input-output tables, representing trade flows between sectors within one region, and relating these flows to the final consumption of goods and services within a region. As the scope of our research is global, we have used a multiregional input-output model (MRIO), which also includes inter-sectoral trade flows between regions. MRIO models provide detailed insights into how the global economy is structured. The theoretical foundation of I/O analysis was set in the first half of the twentieth century, and can be found in the early work done by Leontief.9
Ecofys was supported by the Norwegian University of Science and Technology (NTNU) and PBL Netherlands Environmental Assessment Agency (PBL). NTNU is a leading research institution on I/O and is one of the co-founders of the I/O-database used in this study (EXIOBASE 3).10 NTNU assisted in data retrieval and interpretation of the results, and reviewed the report.
PBL is the Dutch national research institute in the fields of the environment, nature and spatial planning, and conducts strategic policy analyses on request of several Dutch ministries. PBL was involved in setting-up this study, interpreting the results, and critically reviewing the work done throughout the research.
We approach the relationship between GHG emissions11 and value creation12 in value chains in three different ways:
» Source perspective: we look at where emissions occur in the various value chains, and how these emissions relate to the creation of value at that point of the value chain.
» Value chain perspective: we allocate the full value chain emissions to the final demand13 for goods and services that sectors deliver to private and public consumers and link this to the value of the goods and services delivered to these end-consumers. Annex I provides an overview and definition of the sectors distinguished.
» Consumption perspective: we allocate these value chain emissions to the specific consumption categories given in Figure 3 to make the link to the needs of end-consumers.
Annex II provides a definition of the consumption categories distinguished.

10
Figure 2 provides an overview of how these three approaches are related. Figure 5 in the next chapter of this report is built on these perspectives, showing a global overview of GHG emissions and value creation.
Despite extensive research on embedded emissions in consumption and trade, few studies make the explicit link from the GHG emissions in value chains to value creation.14 Our study draws this link. This study also systemically attributes all global GHG emissions to end-consumption categories, and links this to the economic value created along the value chain.
Calculating GHG productivity of global value chains
In designing carbon pricing policies for global value chains, it is essential to understand the different characteristics of these value chains. In the context of carbon pricing, an important parameter is the ratio between value creation and GHG emissions. To study this ratio, we define a new metric: “GHG productivity” expressed as the value created in US dollars16 per kg of CO2 equivalent emissions (US$/kgCO2e). GHG productivity
14 Exceptions include studies published by PBL Netherlands Environmental Assessment Agency on embodied emissions and value added for different sectors in the Netherlands and by Stanford Center for International Development on trade in global value chains and embodied emissions.
15 Strictly speaking, fuel and electricity use are no separate consumption categories, but fulfil needs covered by other consumption categories such as a heated home (shelter and construction) or functioning appliances (furniture and domestic appliances). Given their importance in the GHG footprint of consumption, we decided to show them separately.
16 As EXIOBASE 3 provides the value added in euros, we converted euros to US$ using the annual average exchange rate for the year 2011 of 0.719424 (rounded). This number is taken from the online statistics database (www.statista.com) that uses data on the euro to US$ exchange rate from the European Central Bank.
FIGURE 2 Three approaches to global value chains
CONSUMPTION PERSPECTIVE
VALUE CHAIN PERSPECTIVE
SOURCE PERSPECTIVE
Assigns emissions and value from "source" perspective
to the final demand for goods and services
Allocates the emissions and value from the "value chain
perspective" to various consumption categories
Shows emissions where they occur in the value chain and relates this to the creation of
value at that point
FIGURE 3 Consumption categories15
FUEL USE FOR HEATING AND COOKING
MOBILITY ELECTRICITY USE
FOOD FURNITURE AND HOUSEHOLD APPLIANCES
CLOTHING SHELTER AND CONSTRUCTION
EDUCATION, MEDICAL CARE, PUBLIC AND OTHER SERVICES
Annex II provides a definition of the consumption categories

11
17 Here value added includes taxes, trade and transport margins in the purchased products (e.g. freight is included in the price of a book). While for modelling purposes it is important to use basic prices, we re-classify consumer expenditure on trade and transport margins to the corresponding good to show the impact by the actual purchased product. A description of the methodology (but employed in reverse here) can be found in Ivanova et al, 2016, “Environmental Impact Assessment of Household Consumption”. Journal of Industrial Ecology.
18 Source: IPCC, 2014, “Climate Change 2014: Mitigation of Climate Change. Contribution of Working Group III to the Fifth Assessment Report of the Intergovernmental Panel on Climate Change,” n.d.
19 Source: IEA, World Energy Outlook 2015, World Energy Outlook (OECD Publishing, 2015), http://www.oecd-ilibrary.org/energy/world-energy-outlook-2015_weo-2015-en.
is derived from the results of the I/O analysis. A global value chain with a high GHG productivity creates more value per kilogram of GHG emissions than a global value chain with relatively low GHG productivity. We use GHG productivity to highlight the opportunity to sustain economic value creation with lower GHG emissions.
Value at stake and impact on consumer prices: implications for carbon pricing design
By approaching value chains in three different ways and looking at their GHG productivity, we are able to point to parts of value chains where carbon pricing has significant potential as a tool to drive decarbonisation. To determine the impacts of carbon pricing on the value chain, we define the “value at stake”. This equals the amount of GHG emissions divided by the value added17, multiplied by a carbon price. We apply a carbon price equal to US$100/tCO2e, which is consistent with the estimate used by both the Intergovernmental Panel on Climate Change (IPCC)18 and the International Energy Agency (IEA)19 in their 450ppm scenarios that are in line with the goal to limit global warming to 2°C.
Carbon pricing raises revenues for governments that can be recycled back into the economy. To calculate the impact a carbon price could have on consumer prices,
we apply a simple carbon pricing revenue recycling approach by assuming revenues are recycled into the economy in proportion to the value created. Finally, by combining the quantitative results with qualitative insights in the value chains and insights from the assessment of carbon pricing policies already in place around the world, we arrive at conclusions on the implications for the design of carbon pricing policies.
It is important to note that all our estimates are static and theoretical, assuming no value chain response in terms of uptake of GHG emissions abatement, no consumer behaviour responses, and no differentiation in carbon prices applied by region. However, the estimates can nonetheless serve as a proxy to understand the implications of a global carbon price on consumers.
Expert consultation
The interim findings of the research were presented at an expert workshop convened by Ecofys, the Generation Foundation, NTNU and PBL. The workshop, which took place in July 2016, gathered experts from academia, foundations, not-for-profit organisations and the private sector. The purpose was to gather inputs from a wide range of stakeholders on the research and its implications for carbon pricing.
Our approach is summarised in Figure 4.
FIGURE 4 Summary of methodology
CALCULATING GHG PRODUCTIVITY, VALUE AT
STAKE AND IMPACT ON CONSUMER PRICES
ASSESSING IMPLICATIONS FOR CARBON PRICING
LINKING GHG EMISSIONS AND VALUE CREATION THROUGH
I/O ANALYSIS
EXPERT CONSULTATION

12
T his chapter provides an overview of the link between GHG emissions and value creation. This information is provided in a global GHG
productivity map (see Figure 5). This map shows the relationship between GHG emissions and value creation in global value chains using the three perspectives as described in Chapter 2.
Source perspective: » The left part of the diagram shows where emissions
occur in the value chain, and how these emissions relate to the creation of value by a specific sector.20
Value chain perspective: » The flows from the left to middle part of the diagram
represent embodied emissions in products traded between sectors.
» The middle part of the diagram represents the emissions associated with goods and services delivered by a specific sector for end-consumption.21
Consumption perspective: » The flows from the middle to right part of the
diagram represent a reclassification of goods and services to various consumption categories.22
» The right part of the diagram represents the emissions associated with various consumption categories.
The flows and bars in the diagram represent GHG emissions, where the width is proportional to the amount of GHG emissions. The colours depict GHG productivity, where green denotes high GHG productivity and red low GHG productivity. All colours in between denote medium GHG productivities (see the scale above Figure 5).
To illustrate this diagram, consider the following practical example. The electrical, machinery, metals and manufacturing sector (left) delivers the product steel to the construction sector (middle), which is used to construct houses. These houses are used as shelter. Hence, all emissions and value associated with this value chain is in the end assigned to the consumption category shelter and construction (right).
A number of key results are summarised for each consumption category in Table 1. The next chapter zooms in on each of the eight consumption categories presented on the right part of the diagram. It provides more detailed descriptions of these global value chains and discusses implications for carbon pricing policy design.
MAPPING GLOBAL GHG PRODUCTIVITY ALONG VALUE CHAINS
3
20 In GHG emissions accounting, this is often referred to as “production-based accounting”. This is the accounting method currently used under the UNFCCC, and is sometimes criticised for not including international transportation and carbon leakage, see e.g. Peters (2008) – From production-based to consumption-based national emission inventories.
21 In GHG emissions accounting, this is often referred to as “consumption-based accounting”. 22 No input-output calculation takes place at this step. Instead, GHG emissions are reallocated to consumption
categories.

13
CONSUMPTION CATEGORY
GHG PRODUCTIVITY(US$/kgCO2e)
SHARE IN GLOBAL CONSUMPTION VALUE(%)
SHARE IN GLOBAL GHG EMISSIONS(%)
Fuel use for heating and cooking
0.2 0.5% 5.1%
Electricity use 0.2 0.8% 7.5%
Mobility 0.8 8.0% 16.2%
Food and tobacco 1.1 8.2% 12.7%
Furniture and household appliances
1.5 11.8% 13.6%
Clothing 1.5 1.9% 2.1%
Shelter and construction
1.8 22.3% 21.2%
Education, medical care, public and other services
3.6 46.3% 21.6%
TABLE 1 Overview of final consumption categories

1514
FIGURE 5 Mapping global GHG productivity along value chains23
Use-phase emissions: GHG emissions occurring during end-consumption such as fuel use for space heating or cooking, as well as fuel use in private cars.
GHG PRODUCTIVITY
0 12(US$/kgCO2e)
Agriculture, hunting, forestry and fishing
Mining and quarrying
Food production, beverages and tobacco
Textiles, leather and wearing apparelWood, paper and publishing
Transport
Service sectors
Construction
Use-phase emissionsY
Electrical, machinery, metals and manufacturing
Petroleum, chemicals and non-metallic mineral products
Electricity, gas and water
Fuel use for heating and cooking
Furniture and household appliances
Mobility
Food
Clothing
Shelter and construction
Electricity use
Education, medical care, public and other services
Agriculture, hunting, forestry and fishing
Mining and quarrying
Food production, beverages and tobacco
Textiles, leather and wearing apparelWood, paper and publishing
Transport
Service sectors
Construction
Use-phase emissions
Electrical, machinery, metals and manufacturing
Petroleum, chemicals and non-metallic mineral products
Electricity, gas and water
SOURCE PERSPECTIVE
VALUE CHAIN PERSPECTIVE
CONSUMPTION PERSPECTIVE
23 For transparency reasons, flows smaller than 0.2 GtCO2e have been omitted unless a sector would otherwise disappear (i.e. the sectors ‘textiles, leather and wearing apparel’ and ‘wood, paper and publishing’ would have disappeared but have been kept in manually).

16
CARBON PRICING IMPLICATIONS FOR FINAL CONSUMPTION CATEGORIES
4
T his chapter zooms in on the eight final consumption categories depicted on the right part of the diagram presented in Chapter 3.
These consumption categories relate to various human needs, including food, shelter, and mobility. For each of the final consumption categories, we provide one-page factsheets. Each of the factsheet provides the following information:
» GHG productivity (US$/kgCO2e) » Share in global consumption value (%) » Share in global GHG emissions (%)
» List of sectors contributing most to value chain GHG emissions
» List of sectors contributing most to value creation in the value chain
» Value at stake and price impact assuming a global carbon price
» Characterisation of emissions along the value chain » Key characteristics of the value chain » Implications for carbon pricing
The consumption categories are presented in the order of increasing average GHG productivity.

17 Carbon pricing implications for final consumption categories
FUEL USE FOR HEATING AND COOKING
GHG productivity: 0.2 US$/kgCO2e
Share in global consumption value: 0.5%
Share in global GHG emissions: 5.1%
Sectors contributing most to value chain GHG emissions: use-phase emissions (64%), electricity, gas and water (17%), mining and quarrying (16%)
Sectors contributing most to value creation in the value chain: mining and quarrying (55%), petroleum, chemicals and non-metallic minerals (17%), service sectors (17%)
Value at stake and price impact using a global carbon price: 57% and 51%
» Emissions along the value chain: The majority of the value chain emissions occur at the end-consumer in the form of use-phase emissions when fuels are used for e.g. heating.
» Key characteristics of the value chain: › The value chain is short and international due to trade in fossil
fuels, but very much localised in terms of the final product being mainly space heating and cooking.
› Technologies with a higher GHG productivity compared to fossil fuel use include the use of bio-fuels and technologies replacing fuel use by renewable electricity (e.g. using heat pumps) or technologies reducing overall fuel use (e.g. better insulation).
› Decarbonisation of this value chain will induce a shift in value creation from the fossil fuel industry to the renewable electricity and advanced manufacturing sectors.
» Implications for carbon pricing: › Some jurisdictions already apply a carbon price to domestic fuel
use, either in the form of a carbon tax or via emissions trading with the point of obligation at the fuel delivering entities.
› For carbon pricing to adequately incentivise the decarbonisation, it is essential that both high and low GHG productive technologies fulfilling the same need are covered by carbon pricing in order to incentivise the higher GHG productive alternatives.
› For example, if electricity production is under a carbon price policy, but fuel use by end-consumers is not, consumers have a lower incentive to choose the higher GHG productive solution (electricity based heat pumps) compared to the lower GHG productive alternative (the use of fossil fuels for space heating).
› A further point of attention in the design of effective carbon pricing policies for this value chain is the integration of carbon pricing with existing energy taxation policies, e.g. by making (part of) the energy taxation dependent on the CO2 content of the energy used.

18 Carbon pricing implications for final consumption categories
ELECTRICITY USE
GHG productivity: US$0.2/kgCO2e
Share in global consumption value: 0.8%
Share in global GHG emissions: 7.5%
Sectors contributing most to value chain GHG emissions: electricity, gas and water (93%), mining and quarrying (5%)
Sectors contributing most to value creation in the value chain: electricity, gas and water (57%), service sectors (17%), mining and quarrying (14%)
Value at stake and price impact using a global carbon price: 53% and 47%.
» Emissions along the value chain: Over 90% of value chain emissions are related to the burning of fossil fuels, often in large fossil power plants, with the rest of the emissions dispersed over sectors upstream
» Key characteristics of the value chain: › Similar to the final consumption of fuels, the value chain is
typically simple and short, international in terms of fossil fuel trade, but very much localised in terms of the production and delivery of the final product.
› There are large differences in GHG productivity in this category, especially between fossil and renewable electricity production.
» Implications for carbon pricing: › Differential GHG productivity between high and low-carbon
technologies confirms what can be seen in carbon pricing initiatives around the world: carbon pricing can be instrumental in achieving the required low carbon transition of the electricity value chain.
› Effectively, a global carbon price of US$100/tCO2e would undermine the business case for virtually all fossil based power generation. Such a carbon price would support renewable technologies and other low-carbon technologies.
› Given the low GHG productivity of fossil power production, it is no surprise that most jurisdictions with carbon pricing in place target the production of electricity, albeit with typically much lower prices than US$100/tCO2e.
› One of the reasons why the electricity sector is often targeted by carbon pricing is that emissions take place at typically large point sources where emissions can well be monitored.
› The experience of the EU ETS shows that consistently applied carbon pricing policies have the potential to impact investments in electricity generation technologies and the extent to which these technologies are used for power production
› A key challenge for carbon pricing is the degree to which electricity markets are liberalised, allowing carbon costs to be passed through the value chain.
› Carbon pricing can, as a result of the high value at stake, have a profound effect on end-consumer prices for electricity. It is therefore important to consider how affordable access to electricity can be guaranteed, especially for low income groups, through the targeted use of carbon pricing revenues.

19 Carbon pricing implications for final consumption categories
MOBILITY
GHG productivity: US$0.8/kgCO2e
Share in global consumption value: 8.0%
Share in global GHG emissions: 16.2%
Sectors contributing most to value chain GHG emissions: use-phase emissions (44%), electricity, gas and water (15%), transport sector (13%)
Sectors contributing most to value creation in the value chain: service sectors (33%), electrical, machinery, metals and manufacturing (24%), transport (21%)
Value at stake and price impact using a global carbon price: 12% and 6%.
» Emissions along the value chain: Emissions at the point of consumption (e.g. road transport fuels) contribute 44%, emissions in the electricity, gas and water as well as the transport sector itself (including aviation) 28% with the remaining emissions dispersed over the various supplying industries such as transport equipment.
» Key characteristics of the value chain: › The length and degree of internationalisation of mobility differ
between the various mobility value chains delivering goods for final consumption.
› Material intensive consumption items such as cars and other transport equipment are characterised by long, diverse and international value chains, whereas the value chains related to transport fuel deliveries are short and very much localised.
» Implications for carbon pricing › The current application of carbon pricing in the mobility value
chain remains minimal at best, with carbon pricing being applied to transport fuels and domestic aviation in only a few jurisdictions. The aviation sector recently agreed on an offset based market mechanism that will start operation in 2021.
› For carbon pricing to incentivise a modal shift from low GHG productive transportation means (e.g. fossil-fuels based cars, short distance aviation) to higher GHG productivity transportation means (e.g. public transport, electric cars), it is important that a consistent carbon price is applied to competing technologies that fulfil the same need, in this case to all different transport modes, either in the form of a tax, or an ETS.
› Arguably, global carbon pricing could have some effect on consumer prices for the aviation sector. The recently agreed global mechanism for the aviation sector will make use of offsets generated outside of the sector to facilitate cost-effective mitigation.
20 Carbon pricing implications for final consumption categories
FOOD AND TOBACCO
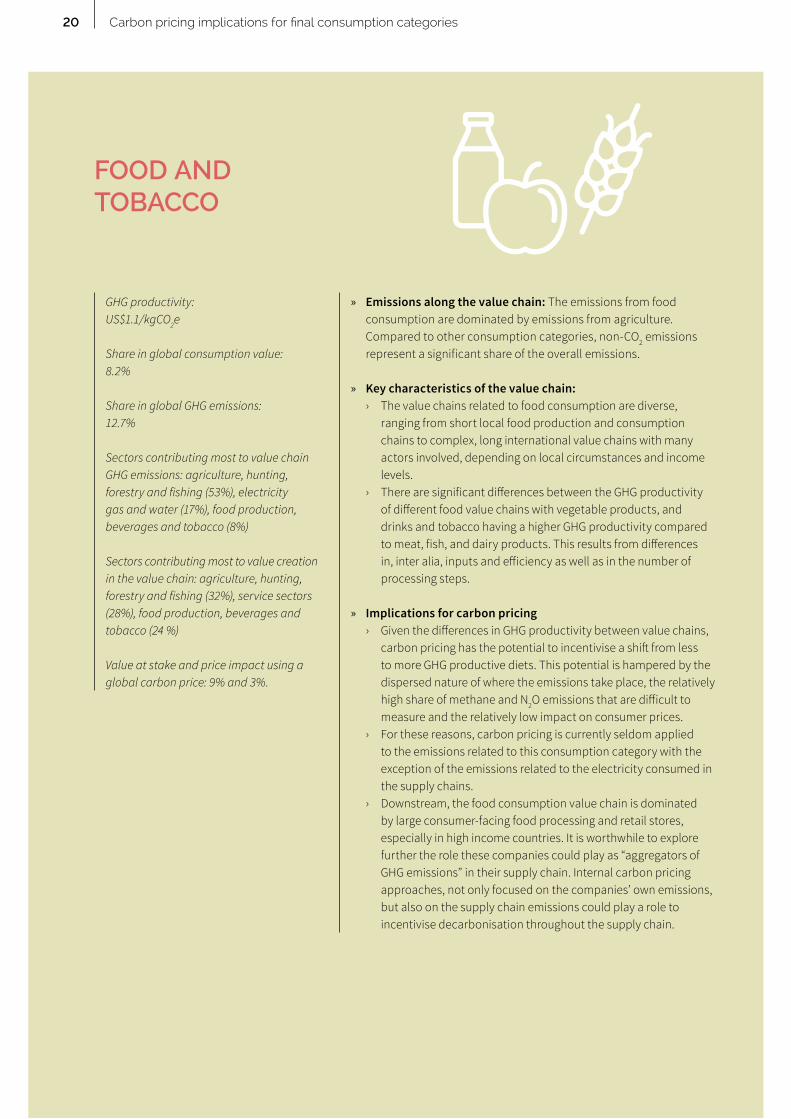
GHG productivity: US$1.1/kgCO2e
Share in global consumption value: 8.2%
Share in global GHG emissions: 12.7%
Sectors contributing most to value chain GHG emissions: agriculture, hunting, forestry and fishing (53%), electricity gas and water (17%), food production, beverages and tobacco (8%)
Sectors contributing most to value creation in the value chain: agriculture, hunting, forestry and fishing (32%), service sectors (28%), food production, beverages and tobacco (24 %)
Value at stake and price impact using a global carbon price: 9% and 3%.
» Emissions along the value chain: The emissions from food consumption are dominated by emissions from agriculture. Compared to other consumption categories, non-CO2 emissions represent a significant share of the overall emissions.
» Key characteristics of the value chain: › The value chains related to food consumption are diverse,
ranging from short local food production and consumption chains to complex, long international value chains with many actors involved, depending on local circumstances and income levels.
› There are significant differences between the GHG productivity of different food value chains with vegetable products, and drinks and tobacco having a higher GHG productivity compared to meat, fish, and dairy products. This results from differences in, inter alia, inputs and efficiency as well as in the number of processing steps.
» Implications for carbon pricing › Given the differences in GHG productivity between value chains,
carbon pricing has the potential to incentivise a shift from less to more GHG productive diets. This potential is hampered by the dispersed nature of where the emissions take place, the relatively high share of methane and N2O emissions that are difficult to measure and the relatively low impact on consumer prices.
› For these reasons, carbon pricing is currently seldom applied to the emissions related to this consumption category with the exception of the emissions related to the electricity consumed in the supply chains.
› Downstream, the food consumption value chain is dominated by large consumer-facing food processing and retail stores, especially in high income countries. It is worthwhile to explore further the role these companies could play as “aggregators of GHG emissions” in their supply chain. Internal carbon pricing approaches, not only focused on the companies’ own emissions, but also on the supply chain emissions could play a role to incentivise decarbonisation throughout the supply chain.

21 Carbon pricing implications for final consumption categories
FURNITURE AND HOUSEHOLD APPLIANCES
GHG productivity: US$1.5/kgCO2e
Share in global consumption value: 11.8%
Share in global GHG emissions: 13.6%
Sectors contributing most to value chain GHG emissions: electricity, gas and water (34%), electrical, machinery, metals and manufacturing (22%), petroleum, chemicals and non-metallic minerals (14%)
Sectors contributing most to value creation in the value chain: electrical, machinery, metals and manufacturing (36%), service sectors (32%), petroleum, chemicals and non-metallic mineral products (11%)
Value at stake and price impact using a global carbon price: 7% and 1%.
» Emissions along the value chain: The value chain emissions are dominated by electricity related emissions and emissions related to the manufacturing and processing of materials, together responsible for as much as 83% of the value chain emissions.
» Key characteristics of the value chain: › These material value chains are typically long, consisting of
many different processing steps, and very international with basic (industrial commodities such a steel that end up in our appliances), intermediate (semi-manufactured parts) and final products (the appliances itself) being traded all over the world.
› The GHG productivity of the upstream material production industries is low, and as a result, the impact of carbon pricing high. Given the cost-competitive characteristics of these production processes, carbon pricing therefore provides a strong incentive for decarbonisation of the production process itself.
» Implications for carbon pricing › Many of the existing carbon pricing schemes in the world include
significant parts of these upstream material production and processing industries.
› One reason for the inclusion of these upstream industries in carbon pricing schemes is that these emissions often occur in facilities with large point sources of emissions that are relatively easy to monitor.
› Carbon pricing policies are often combined with measures (either in the form of free allocation in an ETS or in the form of tax free thresholds) to avoid a loss of competiveness for domestic industries, resulting in a risk of carbon leakage.
› As a result, carbon prices are not fully passed through the supply chain and do not provide an incentive for downstream material efficiency.
› Global, sector-based approaches as well as carbon taxes applied at the level of consumption (including taxation at the border based on the carbon content of goods) are alternative carbon pricing models that could ensure incentives for full value chain decarbonisation, albeit that the feasibility of such policies needs further assessment.

22 Carbon pricing implications for final consumption categories
CLOTHING
GHG productivity: US$1.5/kgCO2e
Share in global consumption value: 1.9%
Share in global GHG emissions: 2.1%
Sectors contributing most to value chain GHG emissions: electricity, gas and water (39%), agriculture, hunting, forestry and fishing (18%), textiles, leather and wearing apparel (12%)
Sectors contributing most to value creation in the value chain: textiles, leather and wearing apparel (41%), service sectors (29%), agriculture, hunting, forestry and fishing (7%)
Value at stake and price impact using a global carbon price: 7% and 1%
» Emissions along the value chain: The value chain emissions originate in the agricultural value chain (leather, cotton), the material manufacturing industry as well as in the final processing industry producing the final products for consumption.
» Key characteristics of the value chain: › Value chains are typically long and international, with a significant
share of emissions originating in low income countries, e.g. in textile production. Non-CO2 emissions represent a significant share of the value chain emissions.
› Clothing and footwear represent a relatively minor share of both global value creation and global GHG emissions (2%).
» Implications for carbon pricing: › Carbon pricing is used to a very limited extent to GHG emissions
in this value chain. Similar to the food sector, the dispersed nature of the emission sources and the relatively low impact on prices throughout the value chain hampers the impact of carbon pricing
› Downstream, the clothing value chain is dominated by large consumer-facing clothing brands, especially for high income countries. Similar to the food sector, it is worthwhile to explore further the role internal carbon pricing could play in clothing sector companies to incentivise decarbonisation throughout the supply chain.
23 Carbon pricing implications for final consumption categories
SHELTER AND CONSTRUCTION
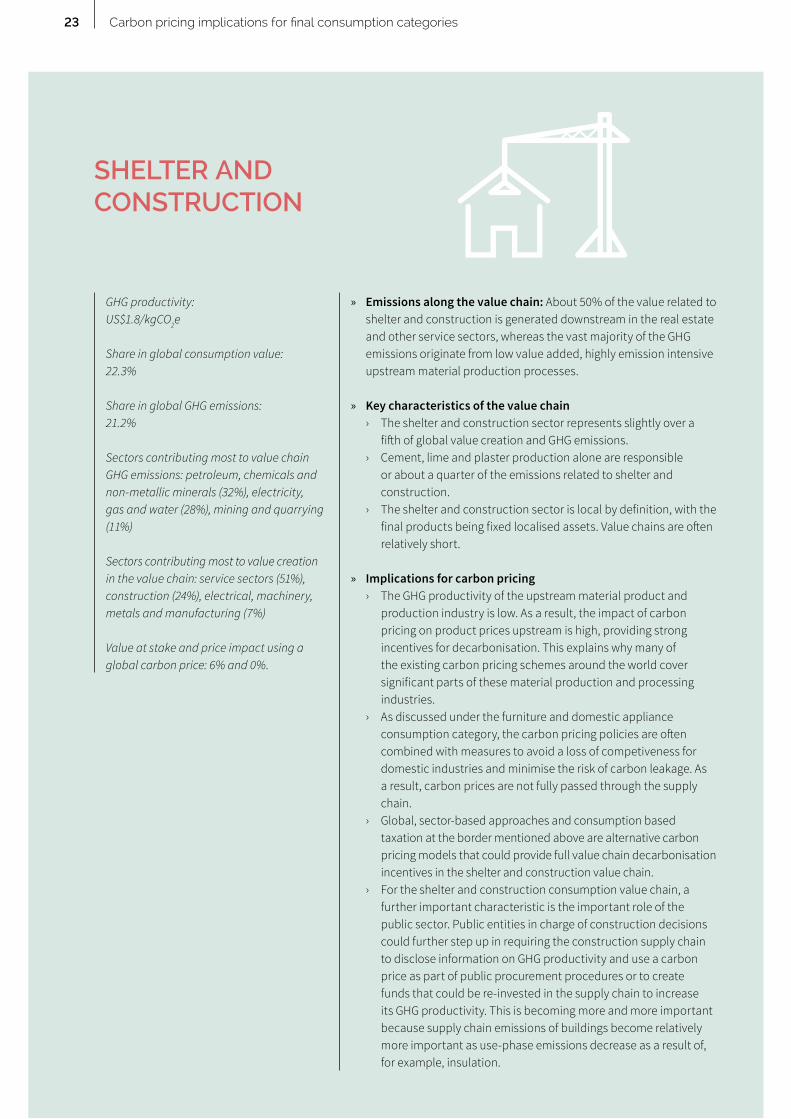
GHG productivity: US$1.8/kgCO2e
Share in global consumption value: 22.3%
Share in global GHG emissions: 21.2%
Sectors contributing most to value chain GHG emissions: petroleum, chemicals and non-metallic minerals (32%), electricity, gas and water (28%), mining and quarrying (11%)
Sectors contributing most to value creation in the value chain: service sectors (51%), construction (24%), electrical, machinery, metals and manufacturing (7%)
Value at stake and price impact using a global carbon price: 6% and 0%.
» Emissions along the value chain: About 50% of the value related to shelter and construction is generated downstream in the real estate and other service sectors, whereas the vast majority of the GHG emissions originate from low value added, highly emission intensive upstream material production processes.
» Key characteristics of the value chain › The shelter and construction sector represents slightly over a
fifth of global value creation and GHG emissions. › Cement, lime and plaster production alone are responsible
or about a quarter of the emissions related to shelter and construction.
› The shelter and construction sector is local by definition, with the final products being fixed localised assets. Value chains are often relatively short.
» Implications for carbon pricing › The GHG productivity of the upstream material product and
production industry is low. As a result, the impact of carbon pricing on product prices upstream is high, providing strong incentives for decarbonisation. This explains why many of the existing carbon pricing schemes around the world cover significant parts of these material production and processing industries.
› As discussed under the furniture and domestic appliance consumption category, the carbon pricing policies are often combined with measures to avoid a loss of competiveness for domestic industries and minimise the risk of carbon leakage. As a result, carbon prices are not fully passed through the supply chain.
› Global, sector-based approaches and consumption based taxation at the border mentioned above are alternative carbon pricing models that could provide full value chain decarbonisation incentives in the shelter and construction value chain.
› For the shelter and construction consumption value chain, a further important characteristic is the important role of the public sector. Public entities in charge of construction decisions could further step up in requiring the construction supply chain to disclose information on GHG productivity and use a carbon price as part of public procurement procedures or to create funds that could be re-invested in the supply chain to increase its GHG productivity. This is becoming more and more important because supply chain emissions of buildings become relatively more important as use-phase emissions decrease as a result of, for example, insulation.

24 Carbon pricing implications for final consumption categories
EDUCATION, MEDICAL CARE, PUBLIC AND OTHER SERVICES
GHG productivity: US$3.6/kgCO2e
Share in global consumption value: 46.3%
Share in global GHG emissions: 21.6%
Sectors contributing most to value chain GHG emissions: electricity, gas and water (35%), service sector (25%), agriculture, hunting, forestry and fishing (10%)
Sectors contributing most to value creation in the value chain: service sectors (85%)
Value at stake and price impact using a global carbon price: 3% and -3%
» Emissions along the value chain: It is dispersed in terms of the sectors contributing to GHG emissions, but emissions resulting from the consumption of electricity and fuels by the sector itself represent a significant share of the emissions.
» Key characteristics of the value chain › The final consumption of a variety of services now represents
already close to 50% of global consumption, but only slightly over 20% of global GHG emissions.
› Value chains are typically short and local.
» Implications for carbon pricing › Carbon pricing is seldom applied in this value chain, except for
the electricity consumed in this supply chain. › The low price impact and relatively low price responsiveness
of the service related value chains make it unlikely that carbon pricing will have a direct impact on the decarbonisation of this sector at the end-consumer level.
› Instead, effective carbon pricing design for the electricity sector as well as for the building-related emissions, discussed above, will support the decarbonisation of this consumption category.

25
INSIGHTS FOR EFFECTIVE CARBON PRICING DESIGN
5
C arbon pricing internalises the costs of climate change and makes it part of the economic decision process. In this research we looked
at carbon pricing with a horizontal lens by focusing on global value chains from raw material extraction to final consumption. Our findings are summarised in Figure 6.
Through I/O analysis, we traced the origins of value creation in the value chains and source of GHG emissions, and assessed the GHG productivity of global value chains. The GHG productivity, defined as the value created by tonne of CO2 emitted, ranges from US$0.2–3.6/kgCO2e for the consumption categories studied. This wide range can be attributed to the diversity of the value chains in different sectors.
How does carbon pricing affect consumer prices in global value chains?
We derived the value at stake for the goods and services being consumed, grouped by end-use consumption categories, under a carbon pricing regime. A carbon price of US$100/tCO2e is assumed to be consistent with scenarios to limit global warming to 2°C. The value at stake ranges from 3% for the consumption of medical care, public and other services to as high as 59% for our use of fuels for space heating and cooking. These estimates do not consider the use of revenues raised by carbon pricing through, e.g. through the collection of carbon taxes or the auction of emissions allowances. Assuming that these revenues are redistributed into the economy in proportion to the value created, we calculated the impact that carbon pricing can have on consumer prices. It should be noted that our estimates are static and theoretical, assuming no value chain response in terms of uptake of GHG emissions abatement, no consumer behaviour responses, and no differentiation in carbon prices applied by region. However, the estimates can nonetheless serve as a proxy to understand the implications of a global carbon price on consumers.
FIGURE 6 Potential price impact of a globally applied carbon price on main consumption categories before and after recycling of carbon pricing revenues
Value at stake Price impact after carbon price revenue recycling GHG productivity
GHG
prod
uctiv
ity
(in U
S$/k
gCO
2e)
Valu
e at
sta
ke a
nd
pric
e im
pact
(in
%)
3.75
3.5
3.25
3.0
2.75
2.5
2.25
2.0
1.75
1.5
1.25
1.0
0.75
0.5
0.25
0.0
60
50
40
30
20
10
0
-10
Fuel
use
for h
eatin
g an
d co
okin
g
Elec
tric
ity u
se
Mob
ility
Food
Furn
iture
and
ho
useh
old
appl
ianc
es
Clot
hing
Shel
ter a
nd c
onst
ruct
ion
Educ
atio
n, m
edic
al c
are,
pu
blic
and
oth
er s
ervi
ces
0.2 0.2
0.8
1.1
1.5 1.5
1.8
3.6
57%
53%
12%9%
7% 7% 6%3%
47%
6%3%
1% 1% 0%-3%
51%

26
Should carbon pricing be used if it does not impact consumer prices much?
Our analysis shows that highly GHG productive consumption of services could become 3% cheaper, whereas consumption of materials (shelter and construction, clothes, furniture and appliances) as well as food consumption could become up to 3% more expensive.
Given the typically low price responsiveness of consumption, this suggests that in contrast to global mobility and the use of electricity and fuels discussed below, carbon pricing might not lead to significant changes in consumption patterns for these consumption categories. This could suggest that carbon pricing should not be used at all in these sectors, but this is not necessarily the case.
In each of these value chains, large sources of GHG emissions can be detected upstream in the value chain that have a very low contribution to value creation. Downstream in the value chain, fewer emissions occur, but more value is created (see Table 2 for the shelter and construction category as an example).
These emissions intensive, low GHG productive upstream manufacturing processes are a natural candidate for inclusion in an effective carbon pricing scheme. These sectors are competing on costs, resulting in a high carbon price responsiveness. Given the large price impact of carbon pricing on these sectors, carbon pricing has the potential to induce change towards production technologies with a higher GHG productivity. This is recognised by most jurisdictions that implemented carbon pricing, with upstream material industries normally within the scope of their policies. However, another characteristic of at least some of these industries is that they compete in an international environment. Carbon pricing policy design in specific jurisdictions is therefore often combined with measures to avoid the negative impacts of carbon pricing on
industrial competiveness. As a result, the carbon price is not passed on in the value chain. Thus, while carbon pricing does incentivise a higher GHG productivity of production processes in the sectors covered, the price signal does not incentivise a higher GHG productivity more downstream. The horizontal lens applied in this research reveals the need for carbon pricing approaches that incentivise higher GHG productivity throughout full value chains, include those that involve cross-border trade. Possible examples include a GHG consumption charge based on the material content of consumption goods, a carbon added tax or globally applied sector carbon pricing approaches for key industrial commodities. These could be viable additions to more vertically applied carbon pricing approaches targeting mainly the upstream parts of these supply chains in combination with measures to avoid negative consequences on industrial competiveness.
Also, in the food, clothes, furniture and appliances sectors, large consumer-facing companies could play a role of “aggregators of GHG emissions” in their supply chain. These companies deliver final goods to consumers and often have significant power over parts of their supply chain. It is worthwhile to explore further the role of internal carbon pricing approaches in these large consumer facing companies. Approaches focused on the complete supply chain emissions could incentivise decarbonisation throughout the supply chain, even if the emissions in their supply chain are dispersed and spread over a large number of different point sources. This will be addressed in next phases of the CPU partnership.
For shelter and construction, it is important to highlight the role of the public sector. Public entities in charge of construction decisions could further step up in requiring the supply chain to disclose GHG productivity information and use a carbon price e.g. as part of public procurement procedures or to create funds that could be re-invested in the upstream supply chain to increase its GHG productivity. This is becoming more and more important because supply chain emissions of buildings become relatively more important as use-phase emissions decrease as a result of e.g. insulation.

27
What should be considered when designing carbon pricing policies that have a notable impact on consumer prices?
Exceptions to the pattern of relatively modest impact of carbon pricing on end-consumer prices are the consumption of electricity, the use of fuels for space heating and cooking and global mobility. The low average GHG productivity of these short and, to a large extent, localised value chains make them attractive candidates for the application of carbon pricing policies. Provided that producers in these value chains operate in markets where carbon costs can be passed through to the consumer, carbon pricing in these value chains has the potential to induce changes to higher GHG productive consumption. Examples include model shifts in transport, e.g. from private to public transport, and from planes to trains, as well as technology shifts, e.g. from fossil to renewable electricity, and from space
heating to better insulated homes. For this to happen, it is essential that competing technologies fulfilling the same need all face a similar carbon price. This could entail a revision in energy tax and excise duty used in many countries to include carbon pricing. This could ensure that carbon pricing is harmonised over different value chains that lead to the fulfillment of the same end-consumer needs. This is an important consideration for the design of carbon pricing policies resulting from the horizontal value chain lens applied in this research.
Given the potentially higher price impact of carbon pricing on these consumption categories, income distribution effects resulting from carbon pricing policies need sufficient attention. Above, we used a simple carbon pricing revenue model that recycles revenues in proportion to the value created, which could in practice be operationalised via lower income taxes. A more targeted revenue recycling approach could, however, be used to compensate for unwanted price increases for certain low income or otherwise vulnerable groups. Revenue recycling will be studied in more depth in the next phase of the CPU partnership.
SHARE IN GHG
EMISSIONS(%)
SHARE IN CONSUMPTION
VALUE (%)
GHG PRODUCTIVITY
(US$/kgCO2e)
UPSTREAM SECTORS
Petroleum, chemicals and non-metallic mineral products 31.7% 4.9% 0.6
Electricity, gas and water 27.8% 1.9% 0.1
Mining and quarrying 11.2% 6.4% 0.9
Electrical, machinery, metals and manufacturing 11.0% 6.8% 2.1
Agriculture, hunting, forestry and fishing 3.6% 1.3% 0.6
DOWNSTREAM SECTORS
Service sectors 5.2% 50.5% 12.1
Transport 4.4% 3.1% 1.3
Construction 4.1% 23.8% 10.3
TABLE 2 GHG productivity of all sectors contributing more than 1% to value chain GHG emissions of shelter and construction. Downstream sectors with high GHG productivity add value, upstream sectors with low GHG productivity add emissions.
28
°C Degrees Celsius
CO2 Carbon dioxide CO2e Carbon dioxide equivalent CPU Carbon Pricing Unlocked
ETS Emissions Trading Scheme EU ETS European Union Emissions Trading Scheme
GDP Gross domestic productGHG Greenhouse gas GtCO2e Gigaton of carbon dioxide equivalent
IEA International Energy Agency I/O Input-outputIPCC Intergovernmental Panel on Climate Change ISIC International Standard Industrial Classification
kgCO2e Kilogram of carbon dioxide equivalent
LLP Limited liability partnership
MRIO Multiregional input-output model
NTNU Norwegian University of Science and Technology
OECD Organisation for Economic Co-operation and Development
PBL Netherlands Environmental Assessment Agencyppm Parts per million
US$ United States dollarUNFCCC United National Framework Convention of Climate Change
C
E
G
I
K
L
M
N
O
P
U
LIST OF ABBREVIATIONS AND ACRONYMS 6
29
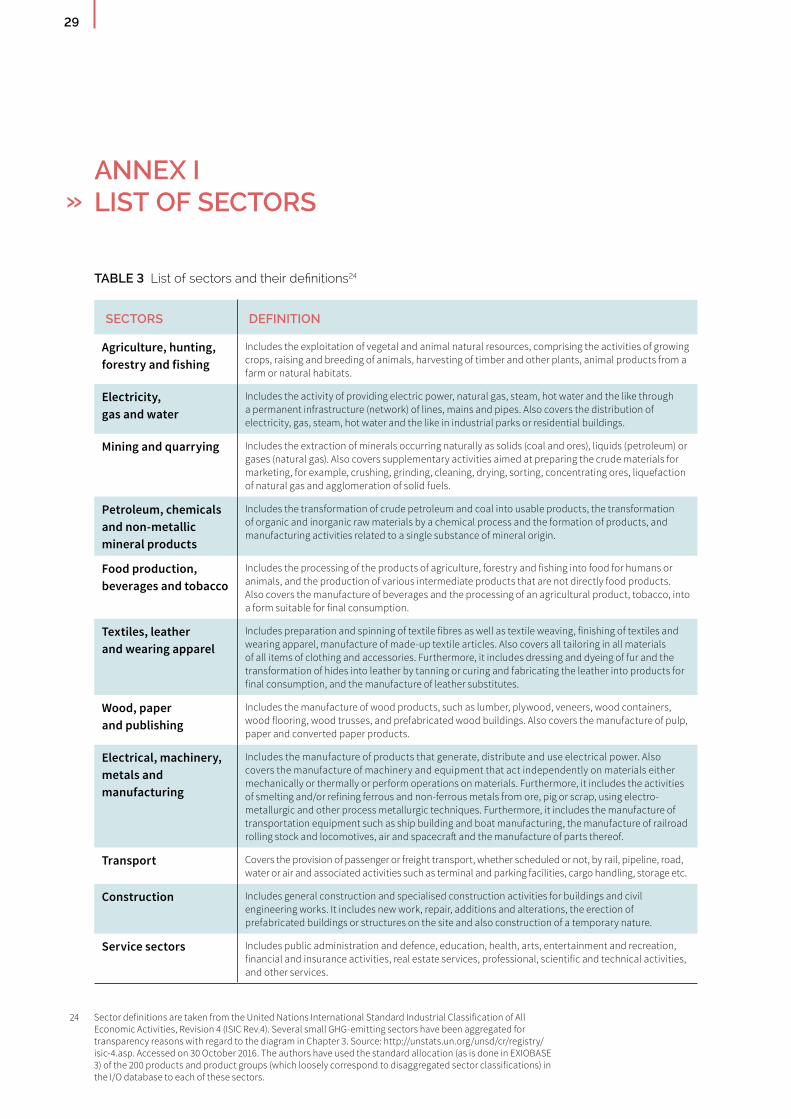
ANNEX ILIST OF SECTORS
SECTORS DEFINITION
Agriculture, hunting, forestry and fishing
Includes the exploitation of vegetal and animal natural resources, comprising the activities of growing crops, raising and breeding of animals, harvesting of timber and other plants, animal products from a farm or natural habitats.
Electricity, gas and water
Includes the activity of providing electric power, natural gas, steam, hot water and the like through a permanent infrastructure (network) of lines, mains and pipes. Also covers the distribution of electricity, gas, steam, hot water and the like in industrial parks or residential buildings.
Mining and quarrying Includes the extraction of minerals occurring naturally as solids (coal and ores), liquids (petroleum) or gases (natural gas). Also covers supplementary activities aimed at preparing the crude materials for marketing, for example, crushing, grinding, cleaning, drying, sorting, concentrating ores, liquefaction of natural gas and agglomeration of solid fuels.
Petroleum, chemicals and non-metallic mineral products
Includes the transformation of crude petroleum and coal into usable products, the transformation of organic and inorganic raw materials by a chemical process and the formation of products, and manufacturing activities related to a single substance of mineral origin.
Food production, beverages and tobacco
Includes the processing of the products of agriculture, forestry and fishing into food for humans or animals, and the production of various intermediate products that are not directly food products. Also covers the manufacture of beverages and the processing of an agricultural product, tobacco, into a form suitable for final consumption.
Textiles, leather and wearing apparel
Includes preparation and spinning of textile fibres as well as textile weaving, finishing of textiles and wearing apparel, manufacture of made-up textile articles. Also covers all tailoring in all materials of all items of clothing and accessories. Furthermore, it includes dressing and dyeing of fur and the transformation of hides into leather by tanning or curing and fabricating the leather into products for final consumption, and the manufacture of leather substitutes.
Wood, paper and publishing
Includes the manufacture of wood products, such as lumber, plywood, veneers, wood containers, wood flooring, wood trusses, and prefabricated wood buildings. Also covers the manufacture of pulp, paper and converted paper products.
Electrical, machinery, metals and manufacturing
Includes the manufacture of products that generate, distribute and use electrical power. Also covers the manufacture of machinery and equipment that act independently on materials either mechanically or thermally or perform operations on materials. Furthermore, it includes the activities of smelting and/or refining ferrous and non-ferrous metals from ore, pig or scrap, using electro-metallurgic and other process metallurgic techniques. Furthermore, it includes the manufacture of transportation equipment such as ship building and boat manufacturing, the manufacture of railroad rolling stock and locomotives, air and spacecraft and the manufacture of parts thereof.
Transport Covers the provision of passenger or freight transport, whether scheduled or not, by rail, pipeline, road, water or air and associated activities such as terminal and parking facilities, cargo handling, storage etc.
Construction Includes general construction and specialised construction activities for buildings and civil engineering works. It includes new work, repair, additions and alterations, the erection of prefabricated buildings or structures on the site and also construction of a temporary nature.
Service sectors Includes public administration and defence, education, health, arts, entertainment and recreation, financial and insurance activities, real estate services, professional, scientific and technical activities, and other services.
24 Sector definitions are taken from the United Nations International Standard Industrial Classification of All Economic Activities, Revision 4 (ISIC Rev.4). Several small GHG-emitting sectors have been aggregated for transparency reasons with regard to the diagram in Chapter 3. Source: http://unstats.un.org/unsd/cr/registry/isic-4.asp. Accessed on 30 October 2016. The authors have used the standard allocation (as is done in EXIOBASE 3) of the 200 products and product groups (which loosely correspond to disaggregated sector classifications) in the I/O database to each of these sectors.
»
TABLE 3 List of sectors and their definitions24
30
ANNEX II LIST OF CONSUMPTION CATEGORIES
CONSUMPTION CATEGORY
DEFINITION
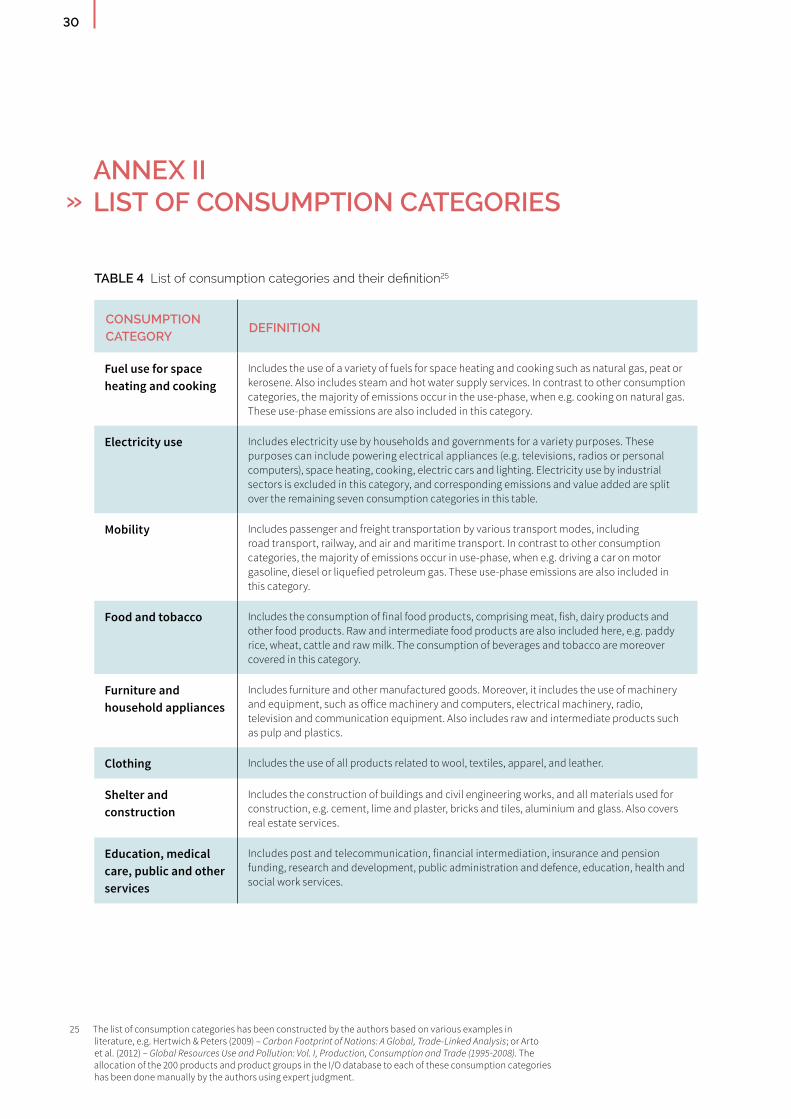
Fuel use for space heating and cooking
Includes the use of a variety of fuels for space heating and cooking such as natural gas, peat or kerosene. Also includes steam and hot water supply services. In contrast to other consumption categories, the majority of emissions occur in the use-phase, when e.g. cooking on natural gas. These use-phase emissions are also included in this category.
Electricity use Includes electricity use by households and governments for a variety purposes. These purposes can include powering electrical appliances (e.g. televisions, radios or personal computers), space heating, cooking, electric cars and lighting. Electricity use by industrial sectors is excluded in this category, and corresponding emissions and value added are split over the remaining seven consumption categories in this table.
Mobility Includes passenger and freight transportation by various transport modes, including road transport, railway, and air and maritime transport. In contrast to other consumption categories, the majority of emissions occur in use-phase, when e.g. driving a car on motor gasoline, diesel or liquefied petroleum gas. These use-phase emissions are also included in this category.
Food and tobacco Includes the consumption of final food products, comprising meat, fish, dairy products and other food products. Raw and intermediate food products are also included here, e.g. paddy rice, wheat, cattle and raw milk. The consumption of beverages and tobacco are moreover covered in this category.
Furniture and household appliances
Includes furniture and other manufactured goods. Moreover, it includes the use of machinery and equipment, such as office machinery and computers, electrical machinery, radio, television and communication equipment. Also includes raw and intermediate products such as pulp and plastics.
Clothing Includes the use of all products related to wool, textiles, apparel, and leather.
Shelter and construction
Includes the construction of buildings and civil engineering works, and all materials used for construction, e.g. cement, lime and plaster, bricks and tiles, aluminium and glass. Also covers real estate services.
Education, medical care, public and other services
Includes post and telecommunication, financial intermediation, insurance and pension funding, research and development, public administration and defence, education, health and social work services.
25 The list of consumption categories has been constructed by the authors based on various examples in literature, e.g. Hertwich & Peters (2009) – Carbon Footprint of Nations: A Global, Trade-Linked Analysis; or Arto et al. (2012) – Global Resources Use and Pollution: Vol. I, Production, Consumption and Trade (1995-2008). The allocation of the 200 products and product groups in the I/O database to each of these consumption categories has been done manually by the authors using expert judgment.
»
TABLE 4 List of consumption categories and their definition25

NOTES

NOTES


Generation Foundation and Ecofys. 2016. Impacts of a global carbon price on consumption and value creation – Implications for carbon pricing design, London, United Kingdom. Prepared under the Carbon Pricing Unlocked partnership between the Generation Foundation and Ecofys with inputs from the Norwegian University of Science and Technology and PBL Netherlands Environment Assessment Agency.
Ecofys UKLondon Office1 Alie StreetLondon E1 8DEUnited Kingdom
Generation FoundationLondon Office20 Air StreetLondon W1B 5ANUnited Kingdom