ImpactofITServiceManagementFrameworks ontheITOrganization ·...
14
BISE – RESEARCH PAPER Impact of IT Service Management Frameworks on the IT Organization An Empirical Study on Benefits, Challenges, and Processes The objective of this paper is to gain an understanding on the benefits provided by the implementation of ITIL. This study compares the challenges and benefits of companies at various levels of implementation. It also looks at the number of implemented processes at the various levels. Results indicate that as the maturity of implementation increases, the perception of challenges decreases. Findings also show that as the maturity of implementation increases, the number of realized benefits increases. Insight into the perception of effectiveness of ITIL is presented here, as well as implications for practitioners and researchers. DOI 10.1007/s12599-010-0141-5 The Authors Mauricio Marrone ( ) C/O MGSM Research Office Macquarie University Building E14B NSW 2109 Sydney Australia [email protected] Prof. Dr. Lutz M. Kolbe Chair of Information Management Institute of Information Systems Platz der Göttinger Sieben 5 37073 Göttingen Germany [email protected] Received: 2010-05-01 Accepted: 2010-11-05 Accepted after two revisions by Prof. Dr. Bichler. Published online: 2011-01-15 This article is also available in Ger- man in print and via http://www. wirtschaftsinformatik.de: Marrone M, Kolbe LM (2010) Einfluss von IT-Service-Management-Frameworks auf die IT-Organisation. Eine em- pirische Studie zu Vorteilen, Heraus- forderungen und Prozessen. WIRT- SCHAFTSINFORMATIK. doi: 10.1007/ s11576-010-0257-8. © The Author(s) 2011. This article is published with open access at Springerlink.com 1 Introduction In 1980, when listing the critical suc- cess factors of Information Systems (IS), Rockart (1982) argues that “the first, and most obvious, IS critical success factor is service”. The Information Technology (IT) departments in many organizations were previously focused on the produc- tion of software applications, and in the late 1980s it started to change to a service mode of operation. For IT Service Man- agement (ITSM), the main focus is not on the development of IT applications, but rather on the management of IT ser- vices. Several studies have focused on the adoption of ITSM frameworks as well as on specific service oriented IT frame- works. Winniford et al. (2009) claim that around 45% of US companies are us- ing an ITSM framework while 15% are planning its usage. The IT Governance Institute (2008) estimates that the IT operational framework with the high- est adoption rate is IT Infrastructure Li- brary (ITIL) with 24%, followed by Con- trol Objectives for Information and re- lated Technology (CobiT) with an adop- tion rate of 14%. Additional to the rising adoption rates of ITSM frameworks, a factor to look at is the costs entailed by IT Services. IT Ser- vices account for an estimated 70% to 80% of the expenditure of an IT orga- nization (Orlov 2005). Practitioners have an interest in understanding the possi- ble benefits realized by companies which adopt an ITSM framework. This empirical study focuses on ITIL as the most popular ITSM framework. In this research, importance is given to the understanding of how these benefits evolve as companies increase the adher- ence to the guidelines to the ITIL model. Also of interest is the perception of chal- lenges of implementing ITIL, and as ex- pressed previously, how the perceptions of challenges develop as companies in- crease their adherence to the model. The last point is to understand how the im- plementation of ITIL processes affects the maturity of the implementation of ITIL. So far there have been no academic studies on this matter, and the research methodology of a large scale interna- tional survey has not been employed. Therefore, this research, using empirical data gathered from a survey with leading companies from various industries, sets out to understand the following: Which effect does the total number of implemented processes have on the maturity of the ITIL implementation? How are challenges perceived at differ- ent levels of maturity of the ITIL im- plementation? How does the total number of realized benefits develop as the maturity of the ITIL implementation increases? This article begins with a literature re- view on IT Service Management, on pro- cesses of ITIL, as well as benefits and challenges of implementation. This is fol- lowed by a description of the methodol- ogy used for this research. The data gath- ered in our survey is analyzed using the Business & Information Systems Engineering 1|2011 5
Transcript of ImpactofITServiceManagementFrameworks ontheITOrganization ·...

BISE – RESEARCH PAPER
Impact of IT Service Management Frameworkson the IT Organization
An Empirical Study on Benefits, Challenges, and Processes
The objective of this paper is to gain an understanding on the benefits provided by theimplementation of ITIL. This study compares the challenges and benefits of companies atvarious levels of implementation. It also looks at the number of implemented processes atthe various levels. Results indicate that as the maturity of implementation increases,the perception of challenges decreases. Findings also show that as the maturity ofimplementation increases, the number of realized benefits increases. Insight into theperception of effectiveness of ITIL is presented here, as well as implications for practitionersand researchers.
DOI 10.1007/s12599-010-0141-5
The Authors
Mauricio Marrone (�)C/O MGSM Research OfficeMacquarie UniversityBuilding E14BNSW 2109 [email protected]
Prof. Dr. Lutz M. KolbeChair of Information ManagementInstitute of Information SystemsPlatz der Göttinger Sieben 537073 Gö[email protected]
Received: 2010-05-01Accepted: 2010-11-05Accepted after two revisions byProf. Dr. Bichler.Published online: 2011-01-15
This article is also available in Ger-man in print and via http://www.wirtschaftsinformatik.de: MarroneM, Kolbe LM (2010) Einfluss vonIT-Service-Management-Frameworksauf die IT-Organisation. Eine em-pirische Studie zu Vorteilen, Heraus-forderungen und Prozessen. WIRT-SCHAFTSINFORMATIK. doi: 10.1007/s11576-010-0257-8.
© The Author(s) 2011. This articleis published with open access atSpringerlink.com
1 Introduction
In 1980, when listing the critical suc-cess factors of Information Systems (IS),Rockart (1982) argues that “the first, andmost obvious, IS critical success factoris service”. The Information Technology(IT) departments in many organizationswere previously focused on the produc-tion of software applications, and in thelate 1980s it started to change to a servicemode of operation. For IT Service Man-agement (ITSM), the main focus is noton the development of IT applications,but rather on the management of IT ser-vices.
Several studies have focused on theadoption of ITSM frameworks as wellas on specific service oriented IT frame-works. Winniford et al. (2009) claim thataround 45% of US companies are us-ing an ITSM framework while 15% areplanning its usage. The IT GovernanceInstitute (2008) estimates that the IToperational framework with the high-est adoption rate is IT Infrastructure Li-brary (ITIL) with 24%, followed by Con-trol Objectives for Information and re-lated Technology (CobiT) with an adop-tion rate of 14%.
Additional to the rising adoption ratesof ITSM frameworks, a factor to look at isthe costs entailed by IT Services. IT Ser-vices account for an estimated 70% to80% of the expenditure of an IT orga-nization (Orlov 2005). Practitioners havean interest in understanding the possi-ble benefits realized by companies whichadopt an ITSM framework.
This empirical study focuses on ITILas the most popular ITSM framework.In this research, importance is given tothe understanding of how these benefitsevolve as companies increase the adher-ence to the guidelines to the ITIL model.Also of interest is the perception of chal-lenges of implementing ITIL, and as ex-pressed previously, how the perceptionsof challenges develop as companies in-crease their adherence to the model. Thelast point is to understand how the im-plementation of ITIL processes affects thematurity of the implementation of ITIL.
So far there have been no academicstudies on this matter, and the researchmethodology of a large scale interna-tional survey has not been employed.Therefore, this research, using empiricaldata gathered from a survey with leadingcompanies from various industries, setsout to understand the following:� Which effect does the total number
of implemented processes have on thematurity of the ITIL implementation?
� How are challenges perceived at differ-ent levels of maturity of the ITIL im-plementation?
� How does the total number of realizedbenefits develop as the maturity of theITIL implementation increases?This article begins with a literature re-
view on IT Service Management, on pro-cesses of ITIL, as well as benefits andchallenges of implementation. This is fol-lowed by a description of the methodol-ogy used for this research. The data gath-ered in our survey is analyzed using the
Business & Information Systems Engineering 1|2011 5

BISE – RESEARCH PAPER
Kruskal-Wallis and Mann-Whitney teststo complete comparisons within the dif-ferent implementation levels. Results ofthe survey are then analyzed and out-comes are discussed. Before the limita-tions and the future research sections,conclusions are drawn.
2 Literature Review
ITSM is a part of the Service Sciences thatconcentrates on IT Operations (Galup etal. 2009). It can be defined as “a set ofprocesses that cooperate to ensure thequality of live IT services, according tothe levels of service agreed to by thecustomer” (Young 2004). Conger et al.(2008) add that ITSM “focuses on defin-ing, managing, and delivering IT servicesto support business goals and customerneeds, usually in IT Operations”.
Service oriented IT Management canbe seen as a philosophy for an orienta-tion towards market, service, lifecycle andprocesses (Zarnekow et al. 2005). First,there is a market orientation which im-plies that there is a customer-supplier re-lation instead of a relationship as projectpartners. Second, there is a service ori-entation which means service providershave service portfolios instead of projectportfolios. These service portfolios in-clude all of the IT services offered bythe provider. Third, the focus is on theservice lifecycle hence, ITSM provides amethodical approach to the managementof IT services – from design, implemen-tation, operation to continual improve-ment. It does not only focus on the tech-nical aspects of IT but also allows thealignment of services and functions pro-vided by IT within the organization. Themain focus of the management of IT ser-vices is on the costs of the whole lifecycle,not merely on the costs of development.Fourth is the process orientation, so thatthe IT organization is oriented on pro-cesses and not on functional structures.
There are various concepts of ITSMframeworks. The most common ap-proach is the ITIL which is a defacto standard for IT Service Providers(Hochstein et al. 2005; IT Governance In-stitute 2008). A variety of ITSM frame-works have been developed using ITIL asa reference, such as Hewlett-Packard (HPITSM Reference model), IBM (IT ProcessModel) and Microsoft’s MOF (van Bon etal. 2007).
The current version of ITIL, Version 3,was published in May 2007. It consists of
26 sections which are included in the fol-lowing five lifecycle phases: Service Strat-egy, Service Design, Service Transition,Service Operation and Continual ServiceImprovement. The earlier version, Ver-sion 2, has a total of ten processes in twomain domains: Service Support and Ser-vice Delivery. There are other operationalguidance domains, but for this paper, wefocus on these two key domains.
Academic research on ITSM is still inits early stages despite its numerous ap-pearances in the popular press and prac-titioners’ magazines. Existing academicliterature merely presents the descriptionof the areas documented on ITIL (Cer-vone 2008; Hendriks and Carr 2002) oranalyses adopters of ITIL through casestudies (Hochstein et al. 2005; Cater-Steel et al. 2006b; Marrone et al. 2010).A few researchers have covered the topicof ITIL benefits, challenges of implemen-tation and the effectiveness of ITIL. Rel-evant academic research is shown in Ta-ble 1.
A summary of the benefits of ITSMframeworks found in literature sources isdisplayed in Table 2. In Table 3, a sum-mary of the challenges faced when imple-menting ITSM frameworks is shown.
To comprehend at which level of ad-herence or maturity companies are inwhen adopting ITSM frameworks, nu-merous researchers including Cater-Steelet al. (2007) and Marrone et al. (2010)have used the maturity model. The matu-rity model levels presented in these stud-ies are based on the model from CobiTand Capability Maturity Model Integra-tion (CMMI). These levels are intendedas profiles of IT processes, and companieswould identify these levels as a descrip-tion of their current state.
Until now, there has been no researchwhich has involved the benefits, chal-lenges and implementation of processesas well as their relation to the maturityof the ITIL implementation. Apart fromthat, the methodology of a large-scalesurvey for various countries has not beenutilized.
3 Research Design
This section describes the levels of adop-tion, known as maturity model, as well asthe propositions explored in this study.For the three questions listed in the in-troduction, a total of five propositions aredescribed. These are shown below.
3.1 Maturity Model Levels
The maturity model is divided in levelswhich range from non-existent (0) to op-timized (5). They were originally used bythe CMM framework and later by Co-biT. This study utilizes the same levelsof maturity as those proposed in theseframeworks. At the lowest level of thematurity model, the management pro-cesses are not applied at all. This level isknown as non-existent (0) implementa-tion. At the following level, named ini-tial, processes are ad hoc and disorga-nized. Level 2 is referred to as repeat-able, where the processes are intuitive,and provide, in most cases, determinis-tic and repeatable results. Level 3 is whereprocesses are documented and providestandard procedures and clearly definedresults/outputs. This level is known asdefined. Level 4, known as managed, isbased on critical success factors, wherekey performance indicators (KPIs) havebeen defined and are continually mea-sured to quantify process performance.The highest level of maturity is known asoptimized; this is where a continual im-provement cycle has been implementedand is based on KPIs and internal audits.At this level the process is improved ineffectiveness, efficiency and compliance.Companies would identify these levels asa description of their current state.
3.2 Implemented Processes andMaturity Level
The relation between the number of im-plemented processes and the levels of ma-turity is of interest for this research. Tounderstand the effect of the total numberof implemented processes on the matu-rity level of implementation, two possi-ble propositions were initially suggested.Only one of the two propositions wasthen selected by the researchers. One pos-sible proposition is that companies wouldselect and implement processes whichwould, in their opinion, provide theircompanies with the biggest benefits, orprocesses that would help them deal withareas in which they are performing defi-ciently. Gammelgård et al. (2007) suggestthat companies tend to adopt the pro-cesses that they require the most. Tut-tle and Vandervelde (2007) argue thatduring the implementation of BusinessProcess Management frameworks, not allprocesses are taken into consideration.Therefore, companies that have imple-mented only some of the processes would
6 Business & Information Systems Engineering 1|2011

BISE – RESEARCH PAPER
Table 1 Relevant research on ITSM and ITIL
Author and year Approach Issues addressed in study
Hochstein et al. (2005) Qualitative Lists four benefits: improvement in quality of IT services, efficiency andoptimization of processes and transparency, and comparability through processdocumentation and process monitoring. Lists six success factors whenimplementing ITSM frameworks: Demonstrating “quick wins”, Strive forcontinuous improvement, Market campaigns in order to create acceptance andunderstanding, Management support, training, and formation of virtual teamsso that “new” processes would be developed simultaneously with theoperational activities.
Potgieter et al. (2005) Qualitative Researches the effect of the implementation of ITIL on customer satisfactionand service quality. The researchers conclude that, at the research site, a largeservice unit of ICT in South Africa, there was a direct correlation betweencustomer satisfaction, service quality and the use of ITIL.
Brenner (2006) Conceptual Proposes ways of how the ITIL process can be implemented efficiently withprocess-oriented tools such as workflow management systems.
Cater-Steel et al.(2006a)
Conceptual andquantitative
Describes processes such as ITIL, CobiT, CMMI, and ISO 9001, describingpossible motivations and challenges for their adoption.
Cater-Steel et al.(2006b)
Qualitative Describes the challenges of adopting ITIL as the following four factors: lack ofmanagement support, cultural change in terms of resistance, delays in choosingan appropriate tool, and management problems for resources such as time,people and money.
Spremic et al. (2008) Qualitative Monitors an IT Service provider in Croatia and applied various KeyPerformance Indicator (KPI) metrics before and after the implementation of anumber of ITIL processes. The study concluded that the IT service providerunderwent improvements which were attributable to the implementation ofITIL.
Cervone (2008) Conceptual Provides an overview of ITIL and suggests the following three benefits: costreduction, improving customer satisfaction and improving the productivity ofthe IT department.
Marrone et al. (2010) Qualitative Identifies six factors considered benefits of an ITIL adoption: improvement incustomer satisfaction, improvement in internal processes, standardization ofprocesses, improvement in service quality, increase in efficiency, andimprovement in return on investment.
Tan et al. (2009) Qualitative Sheds light on the challenges of implementation. Focuses on CSF and concludesthat Senior Management, an appropriate Change Management strategy, a closerelation with multiple vendors and effective project governance are key factorsfor implementation.
Pollard and Cater-Steel(2009a, 2009b)
Qualitative Identifies the following CSF: Executive management support,Interdepartmental communication and collaboration, use of consultants,training and careful software selection, creating an ITIL-friendly culture,process as a priority, and customer-focused metrics.
Galup et al. (2009) Conceptual Presents an overview on ITSM, their global impact and the current initiatives.
Iden and Langeland(2010)
Qualitative Studied the most important factors for a successful adoption of ITIL. The mostimportant factors are management support, competence and training,information and communication, stakeholder involvement and ability tochange organizational culture.
then report the maturity level of theirITIL implementation based on the ma-turity of those processes which they haveimplemented, rather than on the wholeITIL framework.
Conversely, another possible proposi-tion is that the maturity of the implemen-tation of ITIL is based on the full life-cycle model. Therefore, rather than con-centrating on the maturity of their imple-mented processes, the perception of ma-turity level would be based on the com-
pleted ITIL model. Hence, the more pro-cesses of ITIL companies implement, thehigher the companies’ maturity of theITIL implementation. In this research, wesupport the latter. Since the number ofprocesses varies depending on the ver-sion, each version is analyzed separately.The proposition is:P1: There is a positive relationship be-
tween implemented processes and per-ceived maturity of the ITIL implemen-tation.
3.3 Perceived Challenges and MaturityLevel
This research aims to understand which
effect, if any, maturity levels have on the
perceived challenges of implementation.
The proposition of the effect of the per-
ceived challenges on the level of matu-
rity is based on the model of the learn-
ing curve effect. The learning curve, also
known as the experience curve, is a phe-
Business & Information Systems Engineering 1|2011 7

BISE – RESEARCH PAPER
Table 2 Summary of benefits of the implementation of ITSM frameworks
Improvement of. . . Hochstein et al.(2005)
Potgieter et al.(2005)
Marrone et al.(2010)
Cater-Steel et al.(2007, 2008)
Cervone (2008)
Service quality × × × × ×Standardization of services × × ×Customer satisfaction × × ×Return on investment × × ×Business-IT alignment ×Reduction of IT downtime × ×Operations throughimplementation of a bestpractice
×
Financial contributioncontrol
×
Call fix rate ×Morale of IT staff ×
Table 3 Challenges of implementing ITSM frameworks
Hochstein et al.(2005)
Tan et al. (2007) Cater-Steel et al.(2007, 2008)
Iden andLangeland(2010)
Pollard andCater-Steel(2009a, 2009b)
Lack of executive sponsorship × × × × ×Business understanding ITILobjectives
× ×
Lack of resources (time or people) ×Lack of internal skills/knowledgerelating to ITIL
× × × × ×
Lack of funding/Cost of adoption × ×Organizational/Cultural resistance tochange
× × ×
Maintaining momentum/Progressstagnates
(Plan objectives) × ×
nomenon which was initially observed byWright (1936). He observed that as thequantity of units manufactured doubles,the number of hours of direct labor re-quired to produce an individual unit de-creases at a uniform rate. Wright also ar-gued that learning can occur for the pro-duction of any good or service. Applyingthis model to our proposition we can as-sume that the organization gains experi-ence dealing with the challenges and be-comes more efficient as it progresses inits learning, allowing for the perceptionof the challenges to decrease over time.Therefore, our proposition is formulatedas follows:P2: There is a negative relationship be-
tween maturity levels of the ITIL im-plementation and perceived challengesof implementation.
3.4 Number of Realized Benefits andMaturity Levels
This question focuses on understandingthe total number of realized benefits dueto the implementation of ITIL for eachcompany. Rather than concentrating onthe individual benefits which were sur-veyed, the focus of this research is tounderstand the progression of the totalnumber of realized benefits for the com-panies. Consequently, for each company,benefits which they realize are added up.The same approach is used for the num-ber of benefits supported by metrics andthe number of benefits acknowledged bythe business.
We believe that the benefits providedby ITIL will be noticed by IT initially, andthat metrics to back up the benefits willnot be available at earlier stages. At laterlevels these benefits will be supported by
metrics and may also be acknowledged bythe business.
For this proposition, the Law of Dimin-ishing Returns is taken into considera-tion. It suggests that the continued im-provement efforts towards a particularproject or goal would lead to a decline ineffectiveness after a particular level of re-sult has been accomplished (Drucker etal. 1998). In other words, after a certainlevel of standardization, increasing thestandardization further provides few ad-ditional benefits. Consequently, the fol-lowing proposition is suggested:P3a: There is a positive relationship be-
tween maturity levels of the ITIL im-plementation and perceived realizedbenefits.
We also expect that the number of real-ized benefits which are supported by met-rics will become visible on the later levelsof maturity, rather than on the initial lev-
8 Business & Information Systems Engineering 1|2011

BISE – RESEARCH PAPER
els of maturity. We understand that as atlater levels of maturity companies are ex-pected to use metrics in a regular manner.Particularly, the interest of this proposi-tion is not to see if companies are usingmetrics per se, but rather if the metricsused were able to support the perceptionof the benefits that were attained. In otherwords, we are interested in understand-ing if IT executives were able to quan-tify the benefits of implementing ITILwith their use of metrics. Similarly, thebusiness may recognize the benefits ofthe ITIL implementation on the later lev-els of adoption, possibly due to a betterBusiness-IT alignment, which is a pro-posed benefit of ITIL. Therefore, the fol-lowing propositions are suggested:P3b: There is a positive relationship be-
tween maturity levels of the ITIL im-plementation and usage of metrics tomeasure the realized benefits.
P3c: There is a positive relationship be-tween maturity levels of the ITIL im-plementation and acknowledgementby the business of the realized bene-fits.
4 Methodology
The online questionnaire was made avail-able in the months of April and May2009. An invitational email was sent toindividuals who were on the mailing listsof Hornbill and the IT Service Manage-ment Forum (itSMF) in the United Statesof America and United Kingdom. Addi-tionally, in an attempt to expand the find-ings of this research, the survey was an-nounced in various internet groups andforums whose sole topic was ITIL. Thetarget participants would be ITIL cham-pions for their organization and would bebroadly involved in the implementationof ITIL.
The structure of the questionnaire ad-dressed many aspects of ITIL, its adop-tion, usage, implementation and matu-rity as well as effectiveness of processesand realized benefits. It also covered thetopics of Business-IT alignment and ser-vice desk usage. The survey containedquestions to which responses used Likertscales, nominal scales and open-endedquestions.
First, those surveyed were asked to ratethe perception of the maturity of theirITIL processes on a scale based on theCobiT and CMMI maturity.
Respondents were also requested tospecify which version of ITIL they had
implemented. Based on this, they wereasked to select which processes they hadimplemented considering their ITIL ver-sion. All processes were listed in the sur-vey.
Additionally, respondents were in-quired about their perception of chal-lenges of implementing ITIL. They wereasked to rate challenges on a scale from1 to 5, where 1 meant no challenge and5 meant major challenge. The challengesthat are studied, based on those gatheredin our literature review and summarizedin Table 3, are Lack of executive sponsor-ship, Business understanding of ITIL ob-jectives, Lack of resources (time or peo-ple), Lack of internal knowledge/skills re-lating to ITIL, Lack of funding/costs ofadoption, Organizational/cultural resis-tance to change, and Maintaining mo-mentum/progress stagnates.
Finally, those surveyed had to selectrealized benefits that could be achieveddue to the adoption of ITIL. The benefitslisted on the survey are Improvements: ofservice quality, of customer satisfaction,due to having standardized processes, ofinteraction of IT with the rest of the busi-ness, of reduction in IT downtime, of re-turn on IT spending (ROI), by apply-ing best practice experience of others, inmeasuring the financial contribution ofIT to the business, of call fix rate andof the morale of the IT staff. These ben-efits are those shown in Table 2. If re-spondents had realized one of these bene-fits, they were able to select whether thesebenefits were supported by metrics andwhether the business had acknowledgedthe improvements.
5 Results
5.1 Respondents’ profile
More than 5,000 invitations were sent outto members of the itSMF UK and US andto the mailing list of Hornbill. Out of the784 IT executives, who started the survey,503 completed and submitted the survey.Twelve responses were identified as notvalid and were excluded from the statis-tical analysis. Partially completed surveyswere not used for the study. Four fifth ofthose who completed the survey were di-rectly invited to participate in the survey,the others were recruited through the fo-rum posting. The return rate of the sur-vey invitations was of eight percent.
Respondents were asked about theircompanies’ industry, number of sites
supported by IT, number of employees inthe company as well as their title and theirlocation. Table 4 shows the profile of therespondents. In the sample, around threefourths of those surveyed were from thetechnology, public, financial and bankingsectors. Other industries include the pro-fessional, retail and manufacturing in-dustries.
Nearly 70% of the respondents had tenor more sites supported by central IT, andclose to 20% had two to five sites. Al-most 45% of those interviewed worked ina company which had more than 10,000employees. The job roles of those inter-viewed is also shown. Of those surveyed33% were IT managers, while 23% wereProcess Specific Managers. Due to the us-age of mailing lists and posting of invita-tions to the survey on English speakingwebsites, the majority of answers camefrom the United Kingdom (52%) andUnited States (36%) with various answerscoming from Canada, India and Ireland.
Figure 1 reveals the implementationmaturity of ITSM frameworks for all par-ticipants. As can be observed, more thanhalf of those surveyed place their im-plementations to be either on Level 2(Repeatable), with 32%, or Level 3 (De-fined), with 25%, while a minority placedthemselves at the extremes, Level 1 (Ini-tial) with 13% and Level 5 (Optimized)with 11%.
5.2 Empirical Results
An exploratory analysis was conductedfor each variable to test for normality.Both, the Kolmogorov-Smirnov and theShapiro-Wilk tests showed significancefor versions of ITIL (p < 0.001), all thevariables describing challenges of ITIL’sadoption (p < 0.001) and the realizedbenefits of ITIL (p < 0.001). As the datawas non-normal, the Kruskal-Wallis, anon-parametric one way analysis of vari-ance, was used to study the data. If thedata using the Kruskal-Wallis showed sig-nificant differences between the groups,the Mann-Whitney U test was applied.
Since the study was concerned withhow the nominated variables were im-pacted as the ITIL implementation in-creases, caution was taken with the choiceof test measures. The Mann-Whitney Utests inflate the Type I error rate, so carewas taken in the choice of comparisonsmade.
The suggested comparisons are be-tween the first and middle levels of ITILimplementation maturity, the first and
Business & Information Systems Engineering 1|2011 9

BISE – RESEARCH PAPER
Table 4 Profile of responding organizations (n = 491)
Industry % Countries % Number of sites %
Technology 31 United Kingdom 52 10+ 69
Public 23 United States of America 36 2–5 18
Financial and Banking 18 Canada 1 6–10 7
Professional 5 India 1 1 6
Manufacturing 5 Ireland 1
Retail and Distribution 5 Other 9
Other 4
Utility 3
Entertainment and hospitality 2
Healthcare 2
Telecommunication 2
Number of employees % Job role %
10000+ 40 IT manager 32
1001–5000 21 Process specific manager 22
5001–10000 16 Service delivery manager 17
501–1000 9 IT director – Organization level 14
101–500 8 Help/Service desk manager 11
<100 6 Help/Service desk operative 4
Fig. 1 Maturity of ITIL implementation of respondents (n = 491)
last levels of ITIL implementation matu-rity, and between the middle and finallevels of ITIL implementation maturity.Therefore, the following three tests wereconducted:� Test 1: Level 1 (Initial) compared to
Level 3 (Defined)� Test 2: Level 1 (Initial) compared to
Level 5 (Optimized)� Test 3: Level 3 (Defined) compared to
Level 5 (Optimized)Since three tests were conducted, a Bon-ferroni correction was applied. Due tothis correction, rather than using the crit-ical level of significance of 0.05, all ef-fects were reported at 0.0167 level of sig-nificance. All reported p values are us-ing 2-tailed Monte Carlo p values with aconfidence level of 99% and a number ofsamples of 10,000. This method was usedbecause of the large sample size.
Additionally, to understand the trendsin the data the Jonckheere-Terpstra testwas used. Lastly, r was used to measurethe strengths of a relationship betweenvariables (Rosenthal, 1991 p. 19). Cohensuggests that the sizes of the effect aresmall (0.1), medium (0.3) or large (0.5).In the next sections, the following abbre-viations are used: H corresponds to theKruskal-Wallis statistic, U represents theMann-Whitney U statistic, while J sym-bolizes the observed J–T statistic.
5.2.1 Implemented Processes andMaturity Level (P1)
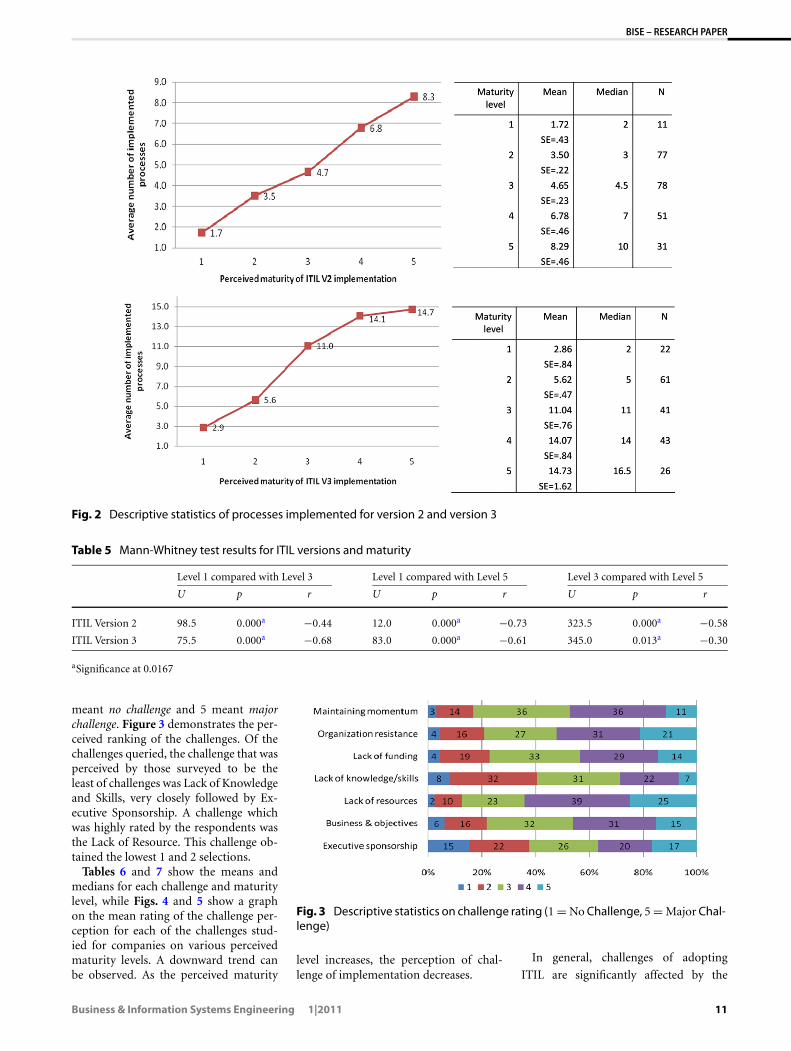
The number of implemented processesfor both versions of ITIL, version 2(n = 248) and version 3 (n = 193), arestudied to understand the effect on thematurity level of implementation. Fig-ure 2 presents the mean and median of
the number of implemented processes ofITIL version 2 or ITIL version 3 for eachof the maturity levels.
In general, the numbers of imple-mented processes significantly affect thematurity level of the implementation(Version 2 H(4) = 99.03, p < 0.001, Ver-sion 3 H(4) = 82.108, p < 0.001). Mann-Whitney U tests were used to follow upon the findings. Table 5 shows that thenumber of implemented processes is sig-nificant when comparing the Initial level(1) with the Defined level (3). The sameoccurs when comparing the Initial level(1) with the Optimized level (5). Whencomparing the Defined level (3) with theOptimized level (5) significance was alsoobserved. Using Cohen’s benchmark, weobserve that there is a medium to largechange on the number of implementedprocesses as maturity increases.
With the help of Jonckheere’s test, a sig-nificant trend in the data can be ob-served. As the level of maturity goesup, the median of number of imple-mented processes increases. (Version 2:J = 18001, z = 10.49, r = .67, Version 3:J = 11398, z = 9.63, r = .69)
In conclusion, regardless of the ver-sion of ITIL implemented, as the level ofmaturity goes up, the number of imple-mented processes also ascends.
5.2.2 Perceived Challenges and MaturityLevel (P2)
Respondents were asked to rate chal-lenges on a scale from 1 to 5, where 1
10 Business & Information Systems Engineering 1|2011
BISE – RESEARCH PAPER
Fig. 2 Descriptive statistics of processes implemented for version 2 and version 3
Table 5 Mann-Whitney test results for ITIL versions and maturity
Level 1 compared with Level 3 Level 1 compared with Level 5 Level 3 compared with Level 5
U p r U p r U p r
ITIL Version 2 98.5 0.000a −0.44 12.0 0.000a −0.73 323.5 0.000a −0.58
ITIL Version 3 75.5 0.000a −0.68 83.0 0.000a −0.61 345.0 0.013a −0.30
aSignificance at 0.0167
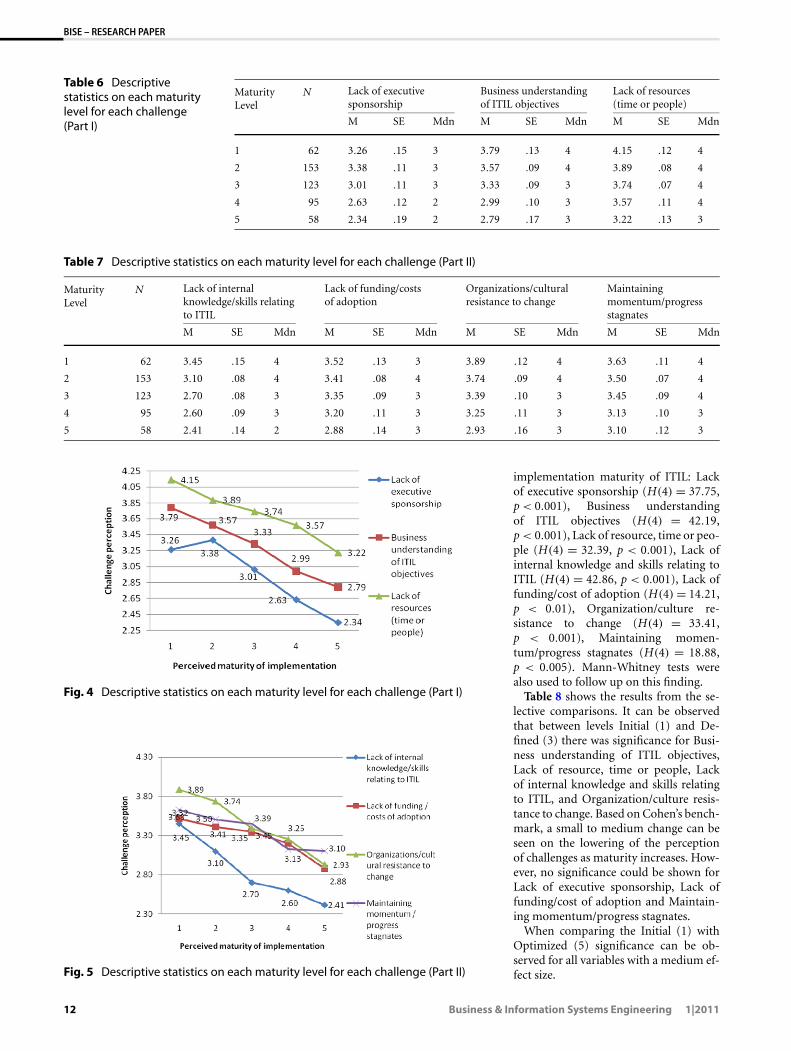
meant no challenge and 5 meant majorchallenge. Figure 3 demonstrates the per-ceived ranking of the challenges. Of thechallenges queried, the challenge that wasperceived by those surveyed to be theleast of challenges was Lack of Knowledgeand Skills, very closely followed by Ex-ecutive Sponsorship. A challenge whichwas highly rated by the respondents wasthe Lack of Resource. This challenge ob-tained the lowest 1 and 2 selections.
Tables 6 and 7 show the means andmedians for each challenge and maturitylevel, while Figs. 4 and 5 show a graphon the mean rating of the challenge per-ception for each of the challenges stud-ied for companies on various perceivedmaturity levels. A downward trend canbe observed. As the perceived maturity
Fig. 3 Descriptive statistics on challenge rating (1 = No Challenge, 5 = Major Chal-lenge)
level increases, the perception of chal-lenge of implementation decreases.
In general, challenges of adopting
ITIL are significantly affected by the
Business & Information Systems Engineering 1|2011 11
BISE – RESEARCH PAPER
Table 6 Descriptivestatistics on each maturitylevel for each challenge(Part I)
MaturityLevel
N Lack of executivesponsorship
Business understandingof ITIL objectives
Lack of resources(time or people)
M SE Mdn M SE Mdn M SE Mdn
1 62 3.26 .15 3 3.79 .13 4 4.15 .12 4
2 153 3.38 .11 3 3.57 .09 4 3.89 .08 4
3 123 3.01 .11 3 3.33 .09 3 3.74 .07 4
4 95 2.63 .12 2 2.99 .10 3 3.57 .11 4
5 58 2.34 .19 2 2.79 .17 3 3.22 .13 3
Table 7 Descriptive statistics on each maturity level for each challenge (Part II)
MaturityLevel
N Lack of internalknowledge/skills relatingto ITIL
Lack of funding/costsof adoption
Organizations/culturalresistance to change
Maintainingmomentum/progressstagnates
M SE Mdn M SE Mdn M SE Mdn M SE Mdn
1 62 3.45 .15 4 3.52 .13 3 3.89 .12 4 3.63 .11 4
2 153 3.10 .08 4 3.41 .08 4 3.74 .09 4 3.50 .07 4
3 123 2.70 .08 3 3.35 .09 3 3.39 .10 3 3.45 .09 4
4 95 2.60 .09 3 3.20 .11 3 3.25 .11 3 3.13 .10 3
5 58 2.41 .14 2 2.88 .14 3 2.93 .16 3 3.10 .12 3
Fig. 4 Descriptive statistics on each maturity level for each challenge (Part I)
Fig. 5 Descriptive statistics on each maturity level for each challenge (Part II)
implementation maturity of ITIL: Lackof executive sponsorship (H(4) = 37.75,p < 0.001), Business understandingof ITIL objectives (H(4) = 42.19,p < 0.001), Lack of resource, time or peo-ple (H(4) = 32.39, p < 0.001), Lack ofinternal knowledge and skills relating toITIL (H(4) = 42.86, p < 0.001), Lack offunding/cost of adoption (H(4) = 14.21,p < 0.01), Organization/culture re-sistance to change (H(4) = 33.41,p < 0.001), Maintaining momen-tum/progress stagnates (H(4) = 18.88,p < 0.005). Mann-Whitney tests werealso used to follow up on this finding.
Table 8 shows the results from the se-lective comparisons. It can be observedthat between levels Initial (1) and De-fined (3) there was significance for Busi-ness understanding of ITIL objectives,Lack of resource, time or people, Lackof internal knowledge and skills relatingto ITIL, and Organization/culture resis-tance to change. Based on Cohen’s bench-mark, a small to medium change can beseen on the lowering of the perceptionof challenges as maturity increases. How-ever, no significance could be shown forLack of executive sponsorship, Lack offunding/cost of adoption and Maintain-ing momentum/progress stagnates.
When comparing the Initial (1) withOptimized (5) significance can be ob-served for all variables with a medium ef-fect size.
12 Business & Information Systems Engineering 1|2011

BISE – RESEARCH PAPER
Table 8 Mann-Whitney test results for perception of challenges and maturity levels
Challenges Level 1 compared with Level 3 Level 1 compared with Level 5 Level 3 compared with Level 5
U p r U p r U p r
Lack of executive sponsorship 3375.0 0.189 −0.10 1104.5 0.000a −0.34 2492.0 0.001a −0.25
Business understanding of ITILobjectives
2736.5 0.001a −0.24 993.0 0.000a −0.40 2634.0 0.003a −0.22
Lack of resources (time or people) 2756.5 0.001a −0.24 894.0 0.000a −0.45 2496.5 0.001a −0.26
Lack of internal knowledge/skillsrelating to ITIL
2461.0 0.000a −0.30 977.5 0.000a −0.40 2884.5 0.031 −0.16
Lack of funding/costs of adoption 3433.0 0.254 −0.09 1234.0 0.002a −0.28 2724.5 0.008a −0.20
Organizations/cultural resistanceto change
2825.0 0.003a −0.22 1017.5 0.000a −0.39 2785.0 0.014a −0.18
Maintainingmomentum/progress stagnates
3419.5 0.225 −0.09 1245.0 0.003a −0.28 2869.0 0.027a −0.17
aSignificance at 0.0167
Lastly, comparing the Defined (3) withthe Optimized (5) maturity level, signifi-cance can be observed for Lack of execu-tive sponsorship, Business understandingof ITIL objectives, Lack of resource, timeor people, Lack of funding/cost of adop-tion, Organization/culture resistance tochange. Marginal significance can be ob-served for Lack of internal knowledgeand skills relating to ITIL and Maintain-ing momentum/progress stagnates.
Jonckheere’s test revealed a signifi-cant trend in the data. As the levelof maturity goes up, the median ofchallenges decreases (Lack of execu-tive sponsorship J = 36500, z = −5.9,r = −.26, Business understanding ofITIL objectives J = 35298, z = −6.6,r = −.30 Lack of resource, time or peo-ple J = 37332, z = −5.5, r = −.25, Lackof internal knowledge and skills re-lating to ITIL J = 35233, z = −6.7,r = −.30, Lack of funding/cost of adop-tion J = 40536, z = −3.6, r = −.16, Or-ganization/culture resistance to changeJ = 36699, z = −5.8, r = −.26, Main-taining momentum/progress stagnatesJ = 39816, z = −4.0, r = −.18).
We can conclude that as the matu-rity of implementation increases there isa reduction on the perception of diffi-culty when facing the challenges studiedin this research. The challenge of Main-taining momentum/progress stagnates isthe only factor that has no significancewhen examining the Initial (1) and De-fined (3) level, and only marginal signif-icance when comparing the Defined (3)and Optimized (5) level. However, whenexamining the Initial (1) and Optimized(5) level significance does exist. When ex-amining the variables Lack of executive
Fig. 6 Percentages of companies that have realized a benefit
sponsorship and Lack of funding/cost ofadoption one can observe that at thelower levels of implementation one candetect no significance. However, whencomparing the Defined (3) with the Op-timized (5) level significance can be ob-served.
5.2.3 Number of Realized Benefits andMaturity Levels (P3)
Figure 6 provides detail of the bene-fits received by those who implementedan ITSM framework. Overall, the figurewould appear to suggest that half of thosesurveyed would perceive a service qualityimprovement and also an increase in theusage of standardized processes. Threebenefits which were only seen by closeto one tenth of those surveyed includeimprovement of Return on Investment(ROI), IT staff morale and an improve-ment on measuring of the financial con-tribution of IT.
When conducting the Kruskal-Wallistest, the number of realized benefits is
significantly affected by the level of im-plementation maturity (H(4) = 134.49,p < 0.001 for the total number of real-ized benefits, H(4) = 139.37, p < 0.001for realized benefits backed by metrics,H(4) = 91.64, p < 0.001 for realized ben-efits acknowledged by the business). Themean and median of the benefits for eachof the different maturity levels is dis-played on Table 9.
Figure 7 plots the perceived number ofrealized benefits for companies at variousmaturity levels of implementation. In thisfigure an upward trend can be observed.Companies at higher levels of perceivedimplementation maturity believe to real-ize a larger number of benefits.
As shown in Table 10, the number ofrealized benefits is significantly higherwhen comparing the Initial (1) with theDefined (3) level of maturity of im-plementation. Based on Cohen’s bench-mark, there is a large change on the num-ber of realized benefits as maturity in-creases. One can also observe this when
Business & Information Systems Engineering 1|2011 13

BISE – RESEARCH PAPER
Table 9 Descriptive statistics of realized benefits (n = 491)
MaturityLevel
N Total realized benefits Total realized benefitsbacked by metrics
Total realized benefitsacknowledged by business
M SE Mdn M SE Mdn M SE Mdn
1 62 1.03 0.19 0 0.48 0.15 0 0.44 0.14 0
2 153 2.46 0.14 2 1.04 0.1 1 0.75 0.1 0
3 123 4.06 0.19 4 2.49 0.17 2 1.71 0.16 1
4 95 4.13 0.21 4 2.65 0.19 2 2.23 0.22 2
5 58 4.89 0.37 5 3.89 0.37 4 3.34 0.41 3
Fig. 7 Descriptive statistics of realized benefits (n = 491)
comparing the Initial (1) with the Opti-mized (5) level. Finally, when comparingthe Defined (3) with Optimized (5) levelno significance can be determined. Yet,significance can be observed when exam-ining the number of realized benefits thathave been backed by metrics as well aswhen observing the number of realizedbenefits that have been acknowledged bythe business.
To corroborate with the findings, anadditional analysis is conducted for eachof the benefits listed. In this analysis, theindividual benefits of implementation areevaluated at the different levels of ma-turity. Each variable is dichotomous (re-alized benefit or not realized benefit).The Kruskal-Wallis test shows that allof the benefits realized are significantlyaffected by the level of implementationmaturity (Service Quality H(4) = 92.08,p < 0.001, Customer Satisfaction H(4) =44.41, p < 0.001, IT resource down-time H(4) = 46.41, p < 0.001, Benefitsfrom the usage of a best practice H(4) =42.05,p < 0.001, Business-IT alignmentH(4) = 25.45, p < 0.001, Call fix rateH(4) = 34.65, p < 0.001, StandardizedProcess H(4) = 68.20, p < 0.001, ITmorale H(4) = 19.61, p < 0.001, Returnon Investment H(4) = 26.40, p < 0.001,
Measurement of the financialcontribution H(4) = 18.93, p <
0.001). Mann-Whitney tests wereused to follow up on the findings.
Table 11 provides the results from thistest. When comparing the companies onthe Initial (1) level with those on theDefined (3), all variables had a signif-icant change with the exception of theImprovement of IT morale, Return onInvestment, and Financial Contribution.When comparing the Defined (3) withthe Optimized (5) level, only Return onInvestment was significant, and all othervariables had no significant change. Thisconfirms and expands the findings ofthe previous analysis (P3a). Finally, whencontrasting the benefits received on theInitial (1) level with the Optimized (5)level significance can be observed for allvariables.
Jonckheere’s test shows a significanttrend in the data, as the level of ma-turity goes up, the median of numberof realized benefits increases (J = 66553,z = 11.44, r = .52), the median of num-ber of realized benefits backed by metricsincreases (J = 67164, z = 11.69, r = .54),and finally, the median of number of re-alized benefits acknowledged by businessincreases (J = 62730, z = 9.73, r = .44).
We can conclude that as the level ofmaturity increases, so does the numberof realized benefits. However, there ap-pears to be a stall in the number of re-alized benefits between the Defined (3)and the Optimized (5) level. In contrast,on the later stages companies are able toshow the benefits of the implementationof ITIL through the metrics used and arealso showing the realized benefits to thebusiness.
6 Discussion
The results of the current study confirmP1. It states that as more processes of ITILare implemented, the perceived maturityof the ITIL implementation increases. Itcan be observed that there is a positivedirect influence between the number ofimplemented ITIL processes and the ma-turity level of the ITIL implementation.This result may also give an insight onhow ITIL adopters are implementing theITIL processes, which is on increasingimplementation of processes rather thanof implementing all processes at once.While IT executives may hand pick theprocesses that they implement, they un-derstand the framework as a whole andperceive the maturity of their implemen-tation to be based on the maturity fromthe whole framework perspective.
In general, the second proposition P2is also confirmed. This proposition statesthat the perception of the listed chal-lenges of implementation decreases asthe maturity levels of implementation in-crease. This can be due to the fact that asadopters overcome the initial challengesof implementation, experience is gained,and future challenges are perceived to beless complex than those in the earlier lev-els. As well, it follows the pattern of thelearning curve model, where at the initiallevels there is a difficulty in undergoingthe implementation, yet, as experience isgained, these difficulties decrease.
14 Business & Information Systems Engineering 1|2011

BISE – RESEARCH PAPER
Table 10 Mann-Whitney test results for realized benefits and maturity levels
. . . per company Level 1 compared with Level 3 Level 1 compared with Level 5 Level 3 compared with Level 5
U p r U p r U p r
Total realized benefits 980.5 0.000a −0.61 434.0 0.000a −0.67 2956.5 0.060 −0.14
Total realized benefits backed by metrics 1209.5 0.000a −0.57 478.5 0.000a −0.67 2529.5 0.002a −0.24
Total realized benefits acknowledged bybusiness
2099.0 0.000a −0.40 658.0 0.000a −0.59 2511.5 0.001a −0.24
aSignificance at 0.0167
Table 11 Mann-Whitney test results for each benefits and maturity levels
Improvements in Level 1 compared with Level 3 Level 1 compared with Level 5 Level 3 compared with Level 5
U p r U p r U p r
Service quality 1544.0 0.000a −0.57 720.0 0.000a −0.59 3551.0 0.560 −0.05
Customer satisfaction 2536.5 0.000a −0.32 908.0 0.000a −0.49 2994.5 0.027 −0.15
Reduction in IT downtime 2416.0 0.000a −0.37 1046.0 0.000a −0.47 3382.0 0.301 −0.05
Best practice 2352.5 0.000a −0.37 978.0 0.000a −0.48 3306.5 0.218 −0.07
Business-IT alignment 2909.0 0.001a −0.24 1220.0 0.000a −0.34 3266.0 0.178 −0.08
Call fix rate 2601.5 0.000a −0.33 1137.0 0.000a −0.41 3389.0 0.311 −0.05
Standardized process 1856.0 0.000a −0.48 852.0 0.000a −0.53 3521.0 0.494 −0.01
IT staff morale 3346.0 0.018 −0.16 1449.0 0.003a −0.26 3311.5 0.176 −0.08
ROI 3502.5 0.034 −0.15 1300.0 0.000a −0.38 2869.5 0.001a −0.24
Financial contribution 3533.0 0.073 −0.13 1422.0 0.001a −0.30 3083.0 0.018 −0.17
aSignificance at 0.0167
It can also indicate that these chal-lenges are reduced because the benefitsof ITIL are made evident to the busi-ness and those involved in the project ofimplementation. As explained by Huber(1991), organization learning occurs toa larger extent when the knowledge ob-tained is recognized to be useful. In otherwords, the organization is more likely tolearn if there are benefits presented to theindividuals and to the organization. Inthe case of this study, the reason why thechallenge perception decreases over timemay also be due to the benefits shownby the implementation, which may en-courage the organization and individualsto learn and to implement further pro-cesses.
When looking at the listed challengesspecifically, challenges such as Lack of ex-ecutive sponsorship, Lack of funding, andMaintaining momentum/project stag-nates show no significance when compar-ing the maturity levels of implementa-tion Initial (1) and Defined (3). However,when the maturity levels of implemen-tation Defined (3) and Optimized (5)are compared, these challenges decrease.This may be due to the fact that at the
earlier levels, the business has yet to re-alize benefits and skepticism exists. Con-versely, in the later stages of implementa-tion, once the business has acknowledgedbenefits of the ITIL implementation it islikely to support the further implementa-tion of ITIL.
When comparing the maturity levels ofimplementation Defined (3) and Opti-mized (5), marginal significance can beobserved in the challenges such as theLack of internal knowledge and skills andMaintaining momentum/project stag-nates. In the case of Lack of inter-nal knowledge and skills, this couldbe due to the fact that acquiring per-sonnel that have specialized knowledgein this field may be difficult, or thatthe training programs, being new, arenot often available. Maintaining momen-tum/project stagnates is the only chal-lenge that was not proven statistically sig-nificant in two of the three comparisons,the two being the comparison betweenInitial (1) and the Defined (3) level aswell as the comparison of Defined (3)and Optimized (5) level. This indicatesthat, throughout the project, this chal-lenge must be the focus of IT Managers
and may be a critical success factor for theimplementation. As well, this factor canbe considered to be independent of theITIL implementation and may be a fac-tor attributed to those executing the im-plementation of ITIL.
Finally, results from P3a, P3b and P3calso showed to be statistically significant.The fact that there are benefits due tothe adoption of ITIL agrees with the re-sults from individual case studies on theeffectiveness of ITIL presented by Pot-gieter et al. (2005) and Spremic et al.(2008). As reported by Hochstein et al.(2005), “Quick wins” are critical successfactors when implementing ITIL. Thus,some companies may be attempting torealize benefits on the lower levels of im-plementation.
As it can be observed from the resultsof P3a, as the maturity level increasesthe number of realized benefits increases.However, there is no significance whencomparing the Defined (3) with the Op-timized (5) level of the ITIL implemen-tation. Therefore, looking only at this re-sult the Law of Diminishing Returns forthe studied benefits of ITIL appears toapply. When we look at the individual
Business & Information Systems Engineering 1|2011 15

BISE – RESEARCH PAPER
AbstractMauricio Marrone, Lutz M. Kolbe
Impact of IT ServiceManagement Frameworkson the IT Organization
An Empirical Study on Benefits,Challenges, and Processes
Over 90 percent of companies are es-timated to use IT Service Management(ITSM) frameworks, yet there is little re-search on their benefits to the Informa-tion Technology (IT) department andthe business units. An international sur-vey of 491 firms was conducted to as-sess the benefits of the IT InfrastructureLibrary (ITIL), the de-facto ITSM frame-work, specifically on how these bene-fits evolve as companies increase theiradoption of the ITIL model. Also stud-ied are the perception of challenges ofthe implementation and the number ofITIL processes implemented in relationto the progress of the adoption of ITIL.Results indicate that as the maturity ofimplementation increases, the percep-tion of challenges decreases. Findingsalso show that as the maturity of imple-mentation increases, the number of re-alized benefits increases, as well as thenumber of implemented ITIL processes.Implications for practitioners and re-searchers are also discussed.
Keywords: IT Infrastructure Library,IT Service Management, Best Practice,ITIL, ITSM, IT Services
benefits of implementation, none of thevariables studies showed a change ex-cept for Return on Investment. This indi-cates that during the earlier stages com-panies will receive most of the directbenefit from the ITIL implementation. Itcould also indicate that most of the vari-ables studied apply only to companies inthe earlier stages, and that other benefitscould exist.
Considering the results of P3b and P3cwe cannot be certain that the Law of Di-minishing Returns applies. As revealedfrom the findings of P3b, improvementsbacked by metrics are seen on the laterlevels of implementation. As well, ben-efits of the ITIL implementation, whichare acknowledged by the business (P3c),are also demonstrated at the later levelsof implementation.
The contribution to research is that itdelivers insight into the perception of ef-fectiveness of ITIL, the implementationof processes and the evolution of chal-lenges. Additionally, this research opensthe path for future research. In practice,the findings can serve as a guideline forthose IT managers considering or whohave already adopted ITIL. For those con-sidering the adoption and having doubtson the benefits of ITIL, the results showthat due to the implementation of ITILcompanies do receive several benefits. Forthose IT departments that have adoptedITIL and ponder on the idea of expand-ing their implementation of ITIL, theyare provided with the understanding ofthe evolution of benefits realizable, andhow their perception of challenges of im-plementation is affected as they continueimplementing ITIL.
7 Conclusion
Based on the results gained in the pre-vious sections, it has been shown thatas the maturity of the ITIL implemen-tation increases the number of imple-mented processes also increases. In addi-tion to this, as the maturity increases, thechallenges of implementation decrease.This is explained using the learning curveas well as insights from organizationallearning. Results conclude that as the ma-turity of ITIL increases, so does the num-ber of realized benefits. Marginal returnscan be observed after the implementationreaches the Defined (3) level. Yet, in laterlevels of implementation further returnsof the ITIL implementation can be seen.In these later levels, there is an increase in
the usage of metrics to measure the ben-efits of the implementation as well as inthe business acknowledging the benefitsprovided by IT.
Limitations of this study are that thestudy concentrates only on the UnitedStates and United Kingdom, and that itover-samples the larger enterprises. Thisresearch aimed only at surveying IT exec-utives, and only their views are includedin this study. Another limitation is thatempirical studies are dependent on thequality of data provided by the respon-dents. Additionally, the paper uses a per-ceived maturity which is based on a sin-gle measurement. As well, the results arebased only on the challenges and benefitsthat were listed on the survey.
Since this research is targeted towardsIT experts, further studies will be con-ducted to understand the views of thebusiness in respect to the challenges andbenefits of the ITIL implementation. Acomparison of views, the IT and the busi-ness view, on these topics is relevant. Aswell, studies will be conducted to un-derstand how Business-IT alignment isaffected by the implementation of ITIL.This could be done by conducting a sur-vey and using a proven method of mea-suring Business-IT alignment and mea-suring ITIL maturity. Future work shouldcomplete a longitudinal study of the im-pact of ITIL.
Open Access This article is distributed un-der the terms of the Creative Commons Attri-bution Noncommercial License which permitsany noncommercial use, distribution, and re-production in any medium, provided the orig-inal author(s) and source are credited.
Appendix: Survey Used
(1) Which of the following statementsbest describes your IT organization?� We have not adopted ITIL
(Level 0)� We are new to ITIL and have just
started to implement processes(Level 1)
� We have a relatively low level ofITIL process maturity. Some pro-cesses are documented and theseare generally understood, but er-rors are likely (Level 2)
� We have a medium level of ITILprocess maturity. Processes aredocumented monitored for com-pliance (Level 3)
16 Business & Information Systems Engineering 1|2011

BISE – RESEARCH PAPER
� We have a reasonably high levelof ITIL process maturity. Ourprocesses are documented, andmeasured according to estab-lished metrics (Level 4)
� We have a very high level of ITILprocess maturity. Our processesare documented, understood,backed by metrics and continu-ally reviewed for improvement(Level 5)
(2) Which version of ITIL (if any) areyou using?� ITIL V2� ITIL V3, upgraded from V2� ITIL V3� Have not adopted ITIL(The following two questions areonly for respondents who answeredITIL V2 on question 2)
(3) Which of the following ITIL V2 Ser-vice Support processes have you im-plemented?� Incident Management� Problem Management� Change Management� Release Management� Configuration Management
(4) Which of the following ITIL V2Service Delivery processes have youimplemented?� Availability Management� Capacity Management� Financial Management� Service Level Management� IT Service Continuity Manage-
ment(The following five questions areonly for respondents who answeredITIL V3 or ITIL V3, upgraded fromV2 on question 2)
(5) Which Service Strategy processhave you implemented?� Strategy Generation� Service Portfolio Management� Demand Management� Financial Management
(6) Which Service Design process haveyou implemented?� Service Catalogue Management� Service Level Management� Availability Management� Capacity Management� IT Service Continuity Manage-
ment� Information Security Manage-
ment� Supplier Management
(7) Which Service Transition processhave you implemented?� Transition Planning and Support� Change Management
� Service Asset & ConfigurationManagement
� Release & Deployment Manage-ment
� Service Validation & Testing� Evaluation� Knowledge Management
(8) Which Service Operation processhave you implemented?� Incident Management� Problem Management� Request Fulfillment� Event Management� Access Management
(9) Which Continual Service Improve-ment process have you imple-mented?� Service Level Management –
Seven Level improvement pro-cess
� Service Measurement� Service Reporting
(10) On a scale of 1–5, where 1 = NoChallenge and 5 = Major Chal-lenge, how would you rate the fol-lowing barriers to ITIL implemen-tation in your organization?� Lack of Executive sponsorship� Business understanding of ITIL
objectives� Lack of resources (time or peo-
ple)� Lack of internal knowledge/skills
relating to ITIL� Lack of funding/cost of adoption� Organization/cultural resistance
to change� Maintaining momen-
tum/progress stagnates(11) Owing to the ITIL implementation,
have you had an improvement inthe following areas?� Service Quality� Customer satisfaction� Standardized process adoption
across all of IT� Interaction of IT with rest of
business� Reduction in IT downtime� Return on investments in IT� Benefited from best practice ex-
perience of others� Financial contribution of IT to
the business� Call fix rate� Morale of IT staff(Follow-up question, only for theselected elements of the previousquestion)
(12) Have the improvements in the areasbeen noted by the business?
(13) Have the improvements beenbacked by metrics?
References
Brenner M (2006) Classifying ITIL processes.In: Proceedings of the first IEEE/IFIP inter-national workshop on business-driven ITmanagement (BDIM 2006)
Cater-Steel A, Tan WG, Toleman M (2006a)Challenge of adopting multiple process im-provement frameworks. In: Proceedings of14th European conference on informationsystems (ECIS 2006)
Cater-Steel A, Toleman M, Tan WG (2006b)Transforming IT service management—theITIL impact. In: 17th Australasian confer-ence on information systems, Adelaide
Cater-Steel A, Tan WG, Toleman M (2007)itSMF Australia 2006 conference: summaryof ITIL adoption survey responses
Cater-Steel A, Tan WG, Toleman M (2008)itSMF Australia 2007 conference: summaryof ITSM standards and frameworks surveyresponses
Cervone F (2008) ITIL: a framework for manag-ing digital library services. OCLC Systems &Services 24:87–90
Conger S, Winniford MA, Erickson-Harris L(2008) Service management in operations.In: Proceedings of the 14th Americas con-ference on information systems, Canada
Drucker PF, Garvin D, Leonard D, Straus S,Brown JS (1998) Harvard business reviewon knowledge management. Harvard Busi-ness School Press
Galup SD, Dattero R, Quan JJ, Conger S (2009)An overview of IT service management.Communications of the ACM 52:124–127
Gammelgård M, Simonsson M, LindströmÅ (2007) An IT management assessmentframework: evaluating enterprise architec-ture scenarios. Information Systems and E-Business Management 5:415–435
Hendriks L, Carr M (2002) ITIL: best practicein IT service management. The Guide to ITService Management 1:131–150
Hochstein A, Tamm G, Brenner W (2005)Service-oriented IT management: benefit,cost and success factors. In: Proceedings ofthe 13th European conference on informa-tion systems, Regensburg
Huber GP (1991) Organizational learning: thecontributing processes and the literatures.Organization Science 2:88–115
Iden J, Langeland L (2010) Setting the stagefor a successful ITIL-adoption: a Delphistudy of IT-experts in the Norwegian armedforces. Information Systems Management27:103
IT Governance Institute (2008) IT gover-nance global status report 2008 http://www.isaca.org/AMTemplate.cfm?Section=ITGI_Research_Publications&Template=/ContentManagement/ContentDisplay.cfm&ContentID=39735. Accessed 2008-07-30
Marrone M, Kießling M, Kolbe LM (2010) Arewe really innovating? An exploratory studyon innovation management and servicemanagement. In: IEEE international confer-ence on management of innovation andtechnology (ICMIT), 2010, pp 378–383
Orlov LM (2005) Make IT matter for businessinnovation. Forrester
Pollard C, Cater-Steel A (2009a) Justifica-tions, strategies, and critical success factorsin successful ITIL implementations in USand Australian companies: an exploratorystudy. Information Systems Management26:164–175
Business & Information Systems Engineering 1|2011 17
BISE – RESEARCH PAPER
Pollard C, Cater-Steel A (2009b) Justifica-tions, strategies, and critical success factorsin successful ITIL implementations in U.S.and Australian companies: an exploratorystudy. Information Systems Management26:164–175
Potgieter BC, Botha JH, Lew C (2005) Evidencethat use of the ITIL framework is effective.In: 18th annual conference of the nationaladvisory committee on computing qualifi-cations, Tauranga
Rockart JF (1982) The changing role of the in-formation systems executive: a critical suc-cess factors perspective. Sloan Manage-ment Review 24:3–13
Rosenthal DR (1991) Meta-analytic proce-dures for social research revised. Sage Pub-lications, Thousand Oaks
Spremic M, Zmirak Z, Kraljevic K (2008) ITand business process performance man-
agement: case study of ITIL implementa-tion in finance service industry. In: Informa-tion technology interfaces, 2008 (ITI 2008),30th international conference
Tan WG, Cater-Steel A, Toleman M, SeanigerR (2007) Implementing centralised IT ser-vice management: drawing lessons fromthe public sector. In: ACIS 2007 proceed-ings of the 18th Australasian conference oninformation systems, pp 1060–1068
Tan W, Cater-Stel A, Toleman M (2009) Im-plementing IT service management: a casestudy focusing on critical success factors.Journal of Computer Information Systems50:1–12
Tuttle B, Vandervelde SD (2007) An empiricalexamination of CobiT as an internal controlframework for information technology. In-ternational Journal of Accounting. Informa-tion Systems 8:240–263
van Bon J, Jong AD, Kolthof A, Pieper M, Tjass-ing R, Veen AVD (2007) Foundations of ITservice management based on ITIL V3: anintroduction. Van Haren
Winniford MA, Conger S, Erickson-Harris L(2009) Confusion in the ranks: IT servicemanagement practice and terminology. In-formation Systems Management 26:153–163
Wright TP (1936) Factors affecting the cost ofairplanes. Journal of Aeronautical Sciences3:122–128
Young CM (2004) An introduction to IT servicemanagement. Gartner
Zarnekow R, Hochstein A, Brenner W (2005)Service-orientiertes IT-management: ITIL-Best-Practices und Fallstudien. Springer,Heidelberg
18 Business & Information Systems Engineering 1|2011