Impact’Assessment’of’High’Speed’Rail’Syste...
36
Impact Assessment of High Speed Rail Syste m in Korea Sep. 30th, 2013 Dr. Jin Young Park Director
Transcript of Impact’Assessment’of’High’Speed’Rail’Syste...

Impact Assessment of High Speed Rail System in Korea
Sep. 30th, 2013
Dr. Jin Young Park Director
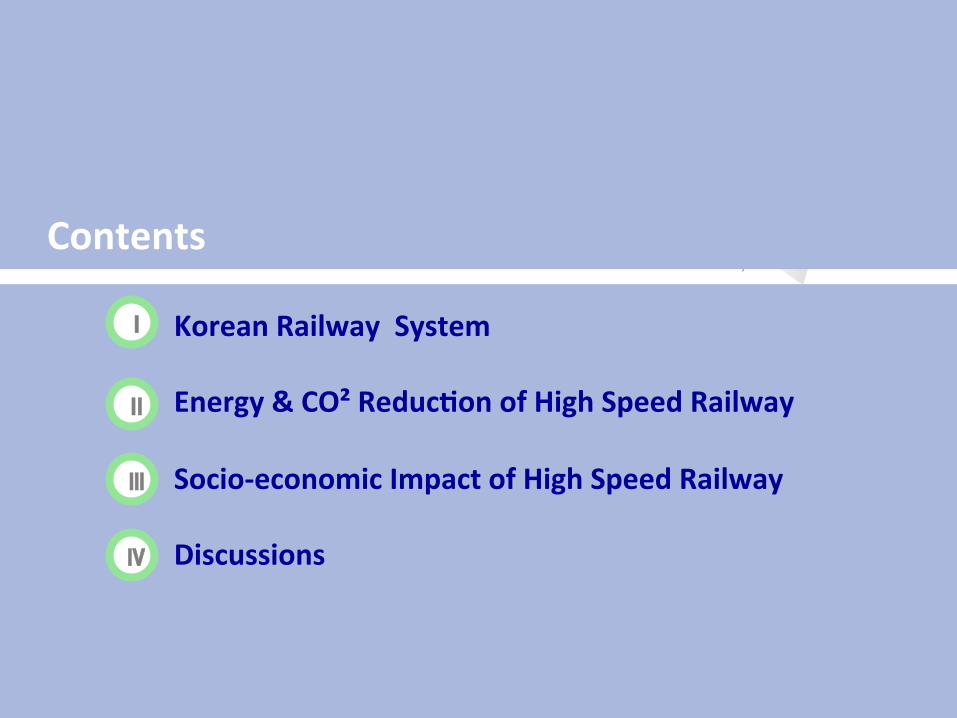
Korean Railway System Energy & CO² ReducKon of High Speed Railway Socio-‐economic Impact of High Speed Railway Discussions
Ⅱ
Ⅲ
Ⅰ
Ⅳ
Contents

Korean Railway System Energy & CO² reducKon of High Speed Railway Socio-‐economic Impact of High Speed Railway Discussions
Ⅱ
Ⅲ
Ⅰ
Ⅳ
Contents

4
1. Railway Development during Economic Development Period (’60s~’80s) 1) The focus of the transport policy changed from railway to road § Decreasing railway investment during Five -‐Yearly Economy Development Plan
Period * Share of railway investment : 61% → 29% → 22%→ 12%→ 10%
15% 12% 14% 10% 8% 8%
0% 4% 3%
16% 31%
1%
61%
29% 29% 22%
12%
10%
17%
52% 52% 48% 47%
80%
0%
10%
20%
30%
40%
50%
60%
70%
80%
90%
100%
1st('62~'66) 2nd('67~'71) 3rd('72~'76) 4th('77~'81) 5th('82~'86) 6th('87~'91)
Road
Rail
Metro
Water
Air
<Transport Infrastructure Investment>

5
2. Expansion of Seoul Metropolitan Railway Lines (’80~’00) 1) New railway projects in conjuncKon with the new town development policy § Support of new town development § Improvement of commuTng traffic condiTons connected Seoul § Gwacheon line, Ilsan line, Bundang line (New residenTal ciTes) opened in 1990
s § New bundang line constructed by private investment & land development cha
rges -‐ Driverless operaTon system

6
3. Expansion of High Speed Rail Service Area (’90~) 1) ConstrucTon of Gyeongbu (Seoul~Busan) high speed railway § Relieve severe road congesKon in Gyeongbu Corridor -‐ ConcentraTon in Gyeongbu corridor : PopulaTon 65%, GDP 74%
§ HSR plan included in the NaTonal Plan(’80s) § Technical Survey (’89~’91) § HSR ConstrucTon (’92)
§ 1st stage open(2004) -‐ New line 238.6km -‐ ExisTng line 171.2km § 2nd stage open(2010) -‐ 417.5km (New line 368.5km) -‐ Under construcTon (unTl 2014)
Gyeongbu HSR
Legend
Seoul
Cheonan
Daegu
Daejeon
Gyeongju
Busan
Existing Line
Osong

7
4. Current Status 1) Railway Facility Size(2011) § Track length : 3135→3635km § Double track : 23 →59.7% § ElectrificaTon : 14→71.6% * Except urban railway
2) Railway Speed § 1900s 30Km/h : Steam locomoTve § 1950s 100km/h : Diesel locomoTve § 1980s 140km/h : Saemaeul train § 2004 300km/h : KTX(High Speed Train) § 2010 350km/h : KTX2 § 2015 400km/h : HEMU
0
1000
2000
3000
4000
1980 1990 2000 2004 2010
Route Length Double Track ElectrificaTon
• Project Period : 6 Years (’07.7~’13.7) • Max. speed : 430km/h • Distributed Power System
HEMU – 430X

Korean Railway System Energy & CO² RducKon of High Speed Railway Socio-‐economic Impact of High Speed Railway Discussions
Ⅱ
Ⅲ
Ⅰ
Ⅳ
Contents

1. Plan for KTX Network (2020) Link between major ciTes within 90 minutes Access Tme to KTX staTons within 30 minutes Benefit range from KTX : 84% of populaTon, 82% of naTonal territory
9 <Plan����������� ������������������ for����������� ������������������ KTX����������� ������������������ network>����������� ������������������

2. Impact Assessment methodology Time & cost saving : can be directly measured by number of passengers Energy consumpTon & emissions : integrated approach with other transpo
rt modes for specific origin-‐desTnaTon -‐ Energy consumpTon & emission unit per person-‐km of different mode
s (car, convenTonal railway, air, high speed railway) -‐ MulTply of unit with number of traffic by each modes Socio-‐economic benefit : regional study of before & aler -‐ Business acTvity -‐ Land price -‐ PopulaTon change
10

KTX Auto Express Bus Airplane
Seoul ~
Daegu
Time (min) raTo
106 (1.00)
228 (2.15)
240 (2.26) -‐
Cost (Won) raTo
42,950 (1.00)
64,100 (1.49)
21,950 (0.51) -‐
Seoul ~
Busan
Time (min) raTo
150 (1.00)
302 (2.01)
317 (2.11)
164 (1’09)
Cost (Won) raTo
53,200 (1.00)
89,100 (1.67)
29,250 (0.55)
78,500 (1.48)
3. Direct Effect : Travel Time & Cost
11

4. Energy consumpKon : French Data
12
DescripKon Liter/person-‐km Regular inter-‐city railway 0.044
TGV 0.008 Car Min. 0.144
Max. 0.217 Bus 0.049
Air Min. 0.123 Max. 0.205
Source: ADEME, France

1. Energy consumpKon : during 2004~2008
13
DescripKon Amount Seoul-‐Busan Min. 813
Max. 1,243 Seoul-‐Daegu Min. 123
Max. 232 Seoul-‐Gwangju Min. 218
Max. 332 Seoul-‐Mokpo Min. 29
Max. 39 total Min. 1,184
Max. 1,848
Unit : million Liter
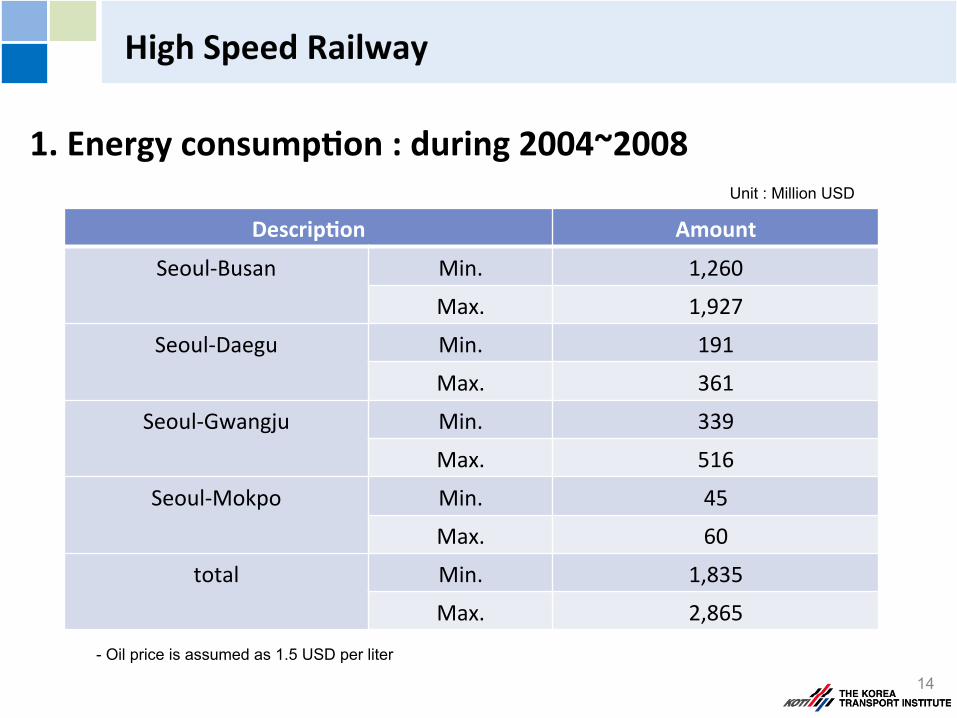
1. Energy consumpKon : during 2004~2008
14
DescripKon Amount Seoul-‐Busan Min. 1,260
Max. 1,927 Seoul-‐Daegu Min. 191
Max. 361 Seoul-‐Gwangju Min. 339
Max. 516 Seoul-‐Mokpo Min. 45
Max. 60 total Min. 1,835
Max. 2,865 - Oil price is assumed as 1.5 USD per liter
Unit : Million USD

2. Energy consumpKon : Korean Data
15
DescripKon Liter/person-‐km RaKo with KTX Car 0.067 10.47
Inter-‐city Bus 0.021 3.26 KTX 0.006 1.00
Inter-‐city Railway (Diesel) 0.023 3.50 CommuTng Railway (Diesel) 0.032 5.04
Metro 0.006 0.96
Source: Korea Railway Corporation, 2009

2. Energy consumpKon : during 2004~2008
16
DescripKon Amount
Seoul-‐Busan 647
Seoul-‐Daegu 152
Seoul-‐Gwangju 142
Seoul-‐Mokpo 8
total 950
Unit : million Liter

2. Energy consumpKon : during 2004~2008
17
DescripKon Amount
Seoul-‐Busan 931
Seoul-‐Daegu 219
Seoul-‐Gwangju 205
Seoul-‐Mokpo 12
total 1,368
Unit : Million USD
- Oil price is assumed as 1.5 USD per liter

3. CO² ReducKon : French Data
18
DescripKon Kg/person-‐km Regular inter-‐city railway 0.017
TGV 0.007 Car Min. 0.047
Max. 0.071 Bus 0.017
Air Min. 0.039 Max. 0.066
Source: ADEME, France

3. CO² ReducKon : during 2004~2008
19
DescripKon Amount Seoul-‐Busan Min. 226
Max. 364 Seoul-‐Daegu Min. 3
Max. 38 Seoul-‐Gwangju Min. 63
Max. 101 Seoul-‐Mokpo Min. 6
Max. 9 total Min. 298
Max. 513
Unit : thousand ton

3. CO² ReducKon : during 2004~2008
20
DescripKon Amount Seoul-‐Busan Min. 8
Max. 13 Seoul-‐Daegu Min. 0.1
Max. 1 Seoul-‐Gwangju Min. 2
Max. 4 Seoul-‐Mokpo Min. 0.2
Max. 0.3 total Min. 10
Max. 18 - Value of CO² is esKmated as 35 USD per ton.
Unit : Million USD

4. CO² ReducKon : Korean Data
21
DescripKon g/person-‐km RaKo with KTX Car 168.2 6.3
Inter-‐city Bus 55.7 2.1 KTX 26.9 1.0
Inter-‐city Railway (Diesel) 66.4 2.5 CommuTng Railway (Diesel) 95.5 3.6
Metro 25.9 1.0
Source: Korea Railway Corporation, 2009

4. CO² ReducKon : during 2004~2008
22
DescripKon Amount
Seoul-‐Busan 270
Seoul-‐Daegu + 231
Seoul-‐Gwangju 136
Seoul-‐Mokpo 13
total 189
Unit : Thousand ton

4. CO² ReducKon : during 2004~2008
23
DescripKon Amount
Seoul-‐Busan 9
Seoul-‐Daegu + 8
Seoul-‐Gwangju 5
Seoul-‐Mokpo 1
total 7
Unit : Million USD
- Oil price is assumed as 1.5 USD per liter

5. Environmental Cost ReducKon : Korean Data
24
DescripKon Korean won/person-‐km
Car 45.4
Inter-‐city Bus 14.07
KTX 0.0
Inter-‐city Railway (Diesel) 13.62
AviaTon 54.03
Source : Ministry of Environment, 2007
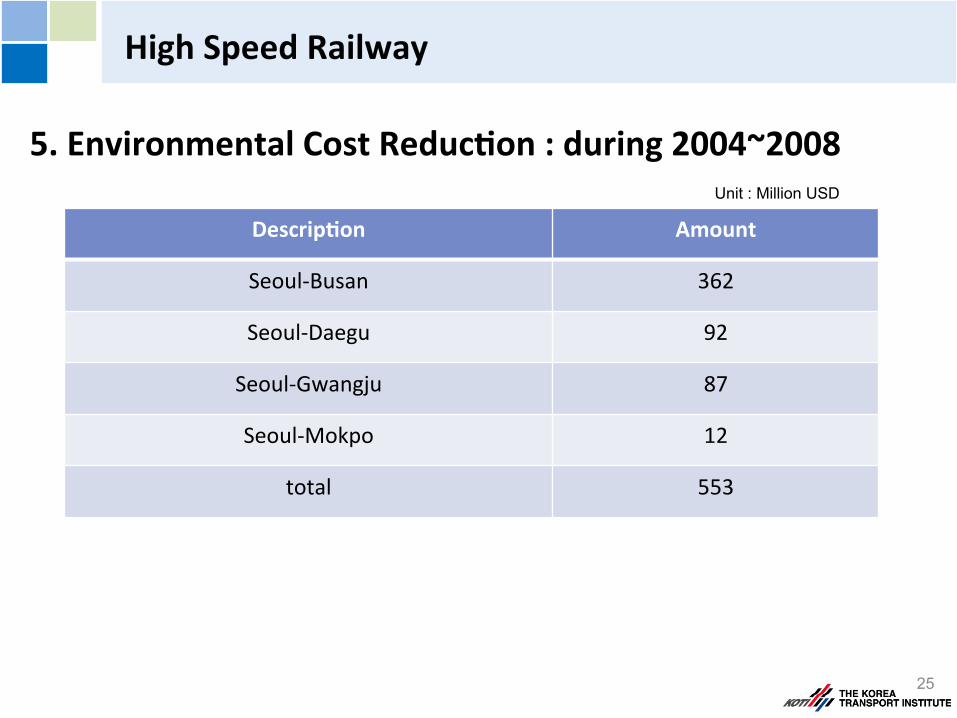
5. Environmental Cost ReducKon : during 2004~2008
25
DescripKon Amount
Seoul-‐Busan 362
Seoul-‐Daegu 92
Seoul-‐Gwangju 87
Seoul-‐Mokpo 12
total 553
Unit : Million USD

Korean Railway System Energy & CO² reducKon of High Speed Railway Socio-‐economic Impact of High Speed Railway Discussions
Ⅱ
Ⅲ
Ⅰ
Ⅳ
Contents

1. Inter-‐city transport mode share 2003 2011 feature
Seoul -
Daegu
- Airplane: 19%→0%
- KTX: 59.7%
Seoul -
Busan
- Airplane: 49→19%
- KTX: 64.5%
27

1. Transport hub of the KTX staKon l KTX East-‐Daegu staTon -‐ Transport hub of the surrounding region (Seoul~Daegu traffic volume: 7.6 million → 11.9 million) -‐ Transferable distance 60~70km
Seoul
Daegu
Pohang
Seoul
Daegu
7.6 million Trip 11.9 million Trip
<2003> <2008>
28
Pohang
Gyeongsan Gyeongsan
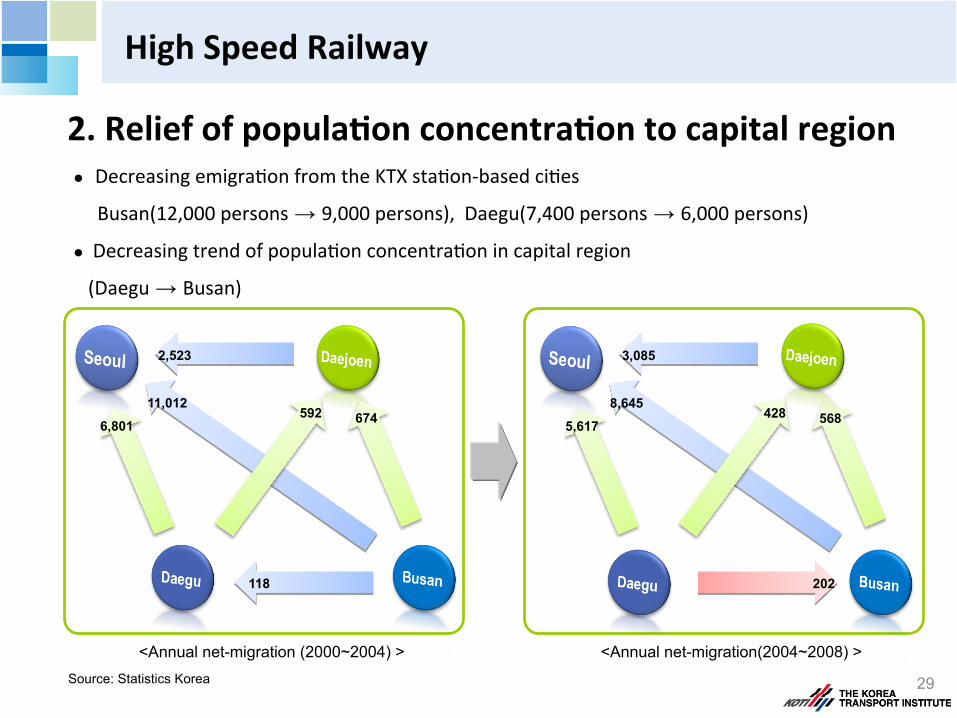
2. Relief of populaKon concentraKon to capital region
11,012 6,801
2,523
7,009 118
674 592
<Annual net-migration (2000~2004) >
8,645 5,617
3,085
7,009 202
568 428
<Annual net-migration(2004~2008) > Source: Statistics Korea
l Decreasing emigraTon from the KTX staTon-‐based ciTes
Busan(12,000 persons → 9,000 persons), Daegu(7,400 persons → 6,000 persons)
l Decreasing trend of populaTon concentraTon in capital region
(Daegu → Busan)
29

3. New economic acKviKes using KTX : ConvenKon & Commerce l ConvenTon and commerce around KTX StaTon
30
153
11,447
2005년 2011년
MeeKng Frequency No. of Users
2011년 2005년
4,012
341,534
Rent����������� ������������������ Profit(mil.����������� ������������������ won)
17 286
870
1,245 1,511 1,575
2,098
-
500
1,000
1,500
2,000
2,500
2005년 2006년 2007년 2008년 2009년 2010년 2011년
Source: Korail
2011년 2005년 2011 2005 2011 2005
2006 2005 2007 2008 2009 2010 2011

31
4. New economic acKviKes using KTX : InternaKonal conference
Share of InternaTonal Seminar of Busan : 6.4%(2003) → 20.9%(2010)
SOURCE : ‘MICE Industry Statistics’, KOREA TOURISM ORGANIZATION, Annually
경부축 호남축
158
14 6 19 1
191
18 15
82
9
343
80
28
224
43
서울 대전 대구 부산 광주
2003년 2006년 2010년
Gyoungbu KTX line Honam KTX line
Daejeon Daegu Busan Seoul Gwangju
2003 2006 2010

5. New Economic AcKviKes : whole sale and retail industry l Rapid increase of Busan city’s sale
l Straw effect to Seoul is not clear
32 Source: The Korea Transport Institute, 「2011 KTX Economic Development Study」 , 2011.
Wholesale & R
etail
(Daegu VS. Gyeon
gbuk)
EducaKon Servi
ce
(Gwangju VS. Geo
nnam)
Enterprise Serv
ice1)
(Daejun VS. Chun
gnam)
(Number)
260 306 411 163 162 257
2003 2004 2011
대구 경북
115 169 241 45 92 271
2003 2005 2011
대전 충남
6 9 21 3 9 11
2003 2005 2011
광주 전남
(Number)
(Number)
Daegu Gyeongbuk
Gwangju Geonnam
Daejeon Chungnam

33
2001 2002 2003 2004 2005 2006 2007 2008 2009
NaKonal growth rate 0.22 2.04 12.35 16.07 12.97 15.44 10.96 8.88 -‐1.48
Large ciKes 0.26 2.26 15.39 14.38 8.67 15.05 12.26 10.03 -‐1.73
Small and medium ciKes 0.61 1.81 9.15 19.62 19.15 15.85 9.77 7.73 -‐1.28
KTX based-‐ciK
es
Average 2.65 0.80 4.88 30.53 33.10 35.88 14.20 6.95 -‐0.21
ExisKng staKon -‐4.04 -‐1.79 0.37 6.66 6.12 11.42 6.97 3.90 -‐1.28
New staKon 4.88 1.66 6.39 38.48 42.09 44.03 16.60 7.97 0.14
Opened in 2004 -‐0.38 0.29 7.85 25.54 22.34 19.66 7.99 5.44 -‐1.01
Expected opening in 2
010 5.68 1.31 1.91 35.52 43.85 52.10 20.40 8.46 0.58
Source: Korea Real Estate Research Institute (2009)
(unit : %)
6. Change of Land Price in KTX staKon-‐based CiKes l KTX staTon-‐based ciTes: two Tmes more than naTonal growth rate
l New KTX staTon-‐based ciTes: five Tmes more than exisTng staTon-‐based

Korean Railway System Energy & CO² reducKon of High Speed Railway Socio-‐economic Impact of High Speed Railway Discussions
Ⅱ
Ⅲ
Ⅰ
Ⅳ
Contents

35
1. Railway can reduce energy consumpKon & CO² l RelaTvely low energy consumpTon & CO² emission than car or air
3. Do we have impact assessment model for railway? l Current B/C model can not include wide impact of railway system
l Time/cost saving, energy/environmental impact
2. Railway system is relaKvely expensive l Financial/technical resource
l Feasibility study(?)

Thank you. ([email protected])