IMPACT Your Reliable Partner in Catastrophe Risk … - Lombok...Bali: premium (in millions IDR);...
7
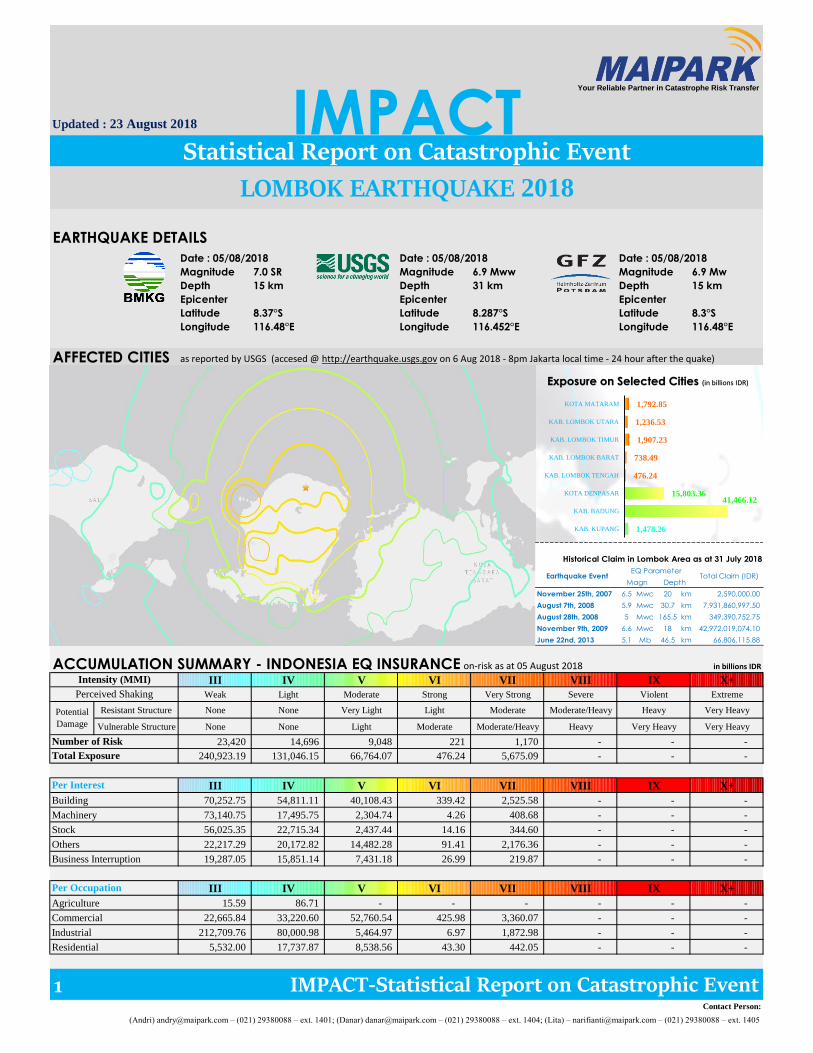
Updated : 23 August 2018 EARTHQUAKE DETAILS Date : 05/08/2018 Date : 05/08/2018 Date : 05/08/2018 Magnitude 7.0 SR Magnitude 6.9 Mww Magnitude 6.9 Mw Depth 15 km Depth 31 km Depth 15 km Epicenter Epicenter Epicenter Latitude 8.37°S Latitude 8.287°S Latitude 8.3°S Longitude 116.48°E Longitude 116.452°E Longitude 116.48°E AFFECTED CITIES as reported by USGS (accesed @ http://earthquake.usgs.gov on 6 Aug 2018 - 8pm Jakarta local time - 24 hour after the quake) ACCUMULATION SUMMARY - INDONESIA EQ INSURANCE on-risk as at 05 August 2018 in billions IDR III IV V VI VII VIII IX X+ Weak Light Moderate Strong Very Strong Severe Violent Extreme Resistant Structure None None Very Light Light Moderate Moderate/Heavy Heavy Very Heavy Vulnerable Structure None None Light Moderate Moderate/Heavy Heavy Very Heavy Very Heavy 23,420 14,696 9,048 221 1,170 - - - 240,923.19 131,046.15 66,764.07 476.24 5,675.09 - - - III IV V VI VII VIII IX X+ 70,252.75 54,811.11 40,108.43 339.42 2,525.58 - - - 73,140.75 17,495.75 2,304.74 4.26 408.68 - - - 56,025.35 22,715.34 2,437.44 14.16 344.60 - - - 22,217.29 20,172.82 14,482.28 91.41 2,176.36 - - - 19,287.05 15,851.14 7,431.18 26.99 219.87 - - - III IV V VI VII VIII IX X+ 15.59 86.71 - - - - - - 22,665.84 33,220.60 52,760.54 425.98 3,360.07 - - - 212,709.76 80,000.98 5,464.97 6.97 1,872.98 - - - 5,532.00 17,737.87 8,538.56 43.30 442.05 - - - 1 IMPACT-Statistical Report on Catastrophic Event Statistical Report on Catastrophic Event LOMBOK EARTHQUAKE 2018 Per Interest Intensity (MMI) Perceived Shaking Potential Damage Number of Risk Total Exposure Contact Person: (Andri) [email protected] – (021) 29380088 – ext. 1401; (Danar) [email protected] – (021) 29380088 – ext. 1404; (Lita) – [email protected] – (021) 29380088 – ext. 1405 Agriculture Commercial Industrial Residential Building Machinery Stock Others Business Interruption Per Occupation Your Reliable Partner in Catastrophe Risk Transfer IMPACT 1,478.26 41,466.12 15,803.36 476.24 738.49 1,907.23 1,236.53 1,792.85 KAB. KUPANG KAB. BADUNG KOTA DENPASAR KAB. LOMBOK TENGAH KAB. LOMBOK BARAT KAB. LOMBOK TIMUR KAB. LOMBOK UTARA KOTA MATARAM Exposure on Selected Cities (in billions IDR) November 25th, 2007 6.5 Mwc 20 km 2,590,000.00 August 7th, 2008 5.9 Mwc 30.7 km 7,931,860,997.50 August 28th, 2008 5 Mwc 165.5 km 349,390,752.75 November 9th, 2009 6.6 Mwc 18 km 42,972,019,074.10 June 22nd, 2013 5.1 Mb 46.5 km 66,806,115.88 Historical Claim in Lombok Area as at 31 July 2018 Earthquake Event EQ Parameter Total Claim (IDR) Magn Depth
Transcript of IMPACT Your Reliable Partner in Catastrophe Risk … - Lombok...Bali: premium (in millions IDR);...
Updated : 23 August 2018
EARTHQUAKE DETAILS
Date : 05/08/2018 Date : 05/08/2018 Date : 05/08/2018
Magnitude 7.0 SR Magnitude 6.9 Mww Magnitude 6.9 Mw
Depth 15 km Depth 31 km Depth 15 km
Epicenter Epicenter Epicenter
Latitude 8.37°S Latitude 8.287°S Latitude 8.3°S
Longitude 116.48°E Longitude 116.452°E Longitude 116.48°E
AFFECTED CITIES as reported by USGS (accesed @ http://earthquake.usgs.gov on 6 Aug 2018 - 8pm Jakarta local time - 24 hour after the quake)
ACCUMULATION SUMMARY - INDONESIA EQ INSURANCE on-risk as at 05 August 2018 in billions IDR
III IV V VI VII VIII IX X+
Weak Light Moderate Strong Very Strong Severe Violent Extreme
Resistant Structure None None Very Light Light Moderate Moderate/Heavy Heavy Very Heavy
Vulnerable Structure None None Light Moderate Moderate/Heavy Heavy Very Heavy Very Heavy
23,420 14,696 9,048 221 1,170 - - -
240,923.19 131,046.15 66,764.07 476.24 5,675.09 - - -
III IV V VI VII VIII IX X+
70,252.75 54,811.11 40,108.43 339.42 2,525.58 - - -
73,140.75 17,495.75 2,304.74 4.26 408.68 - - -
56,025.35 22,715.34 2,437.44 14.16 344.60 - - -
22,217.29 20,172.82 14,482.28 91.41 2,176.36 - - -
19,287.05 15,851.14 7,431.18 26.99 219.87 - - -
III IV V VI VII VIII IX X+
15.59 86.71 - - - - - -
22,665.84 33,220.60 52,760.54 425.98 3,360.07 - - -
212,709.76 80,000.98 5,464.97 6.97 1,872.98 - - -
5,532.00 17,737.87 8,538.56 43.30 442.05 - - -
1 IMPACT-Statistical Report on Catastrophic Event
Statistical Report on Catastrophic Event
LOMBOK EARTHQUAKE 2018
Per Interest
Intensity (MMI)
Perceived Shaking
Potential
Damage
Number of Risk
Total Exposure
Contact Person:
(Andri) [email protected] – (021) 29380088 – ext. 1401; (Danar) [email protected] – (021) 29380088 – ext. 1404; (Lita) – [email protected] – (021) 29380088 – ext. 1405
Agriculture
Commercial
Industrial
Residential
Building
Machinery
Stock
Others
Business Interruption
Per Occupation
Your Reliable Partner in Catastrophe Risk Transfer
IMPACT
1,478.26
41,466.12 15,803.36
476.24
738.49
1,907.23
1,236.53
1,792.85
KAB. KUPANG
KAB. BADUNG
KOTA DENPASAR
KAB. LOMBOK TENGAH
KAB. LOMBOK BARAT
KAB. LOMBOK TIMUR
KAB. LOMBOK UTARA
KOTA MATARAM
Exposure on Selected Cities (in billions IDR)
November 25th, 2007 6.5 Mwc 20 km 2,590,000.00
August 7th, 2008 5.9 Mwc 30.7 km 7,931,860,997.50
August 28th, 2008 5 Mwc 165.5 km 349,390,752.75
November 9th, 2009 6.6 Mwc 18 km 42,972,019,074.10
June 22nd, 2013 5.1 Mb 46.5 km 66,806,115.88
Historical Claim in Lombok Area as at 31 July 2018
Earthquake EventEQ Parameter
Total Claim (IDR)Magn Depth
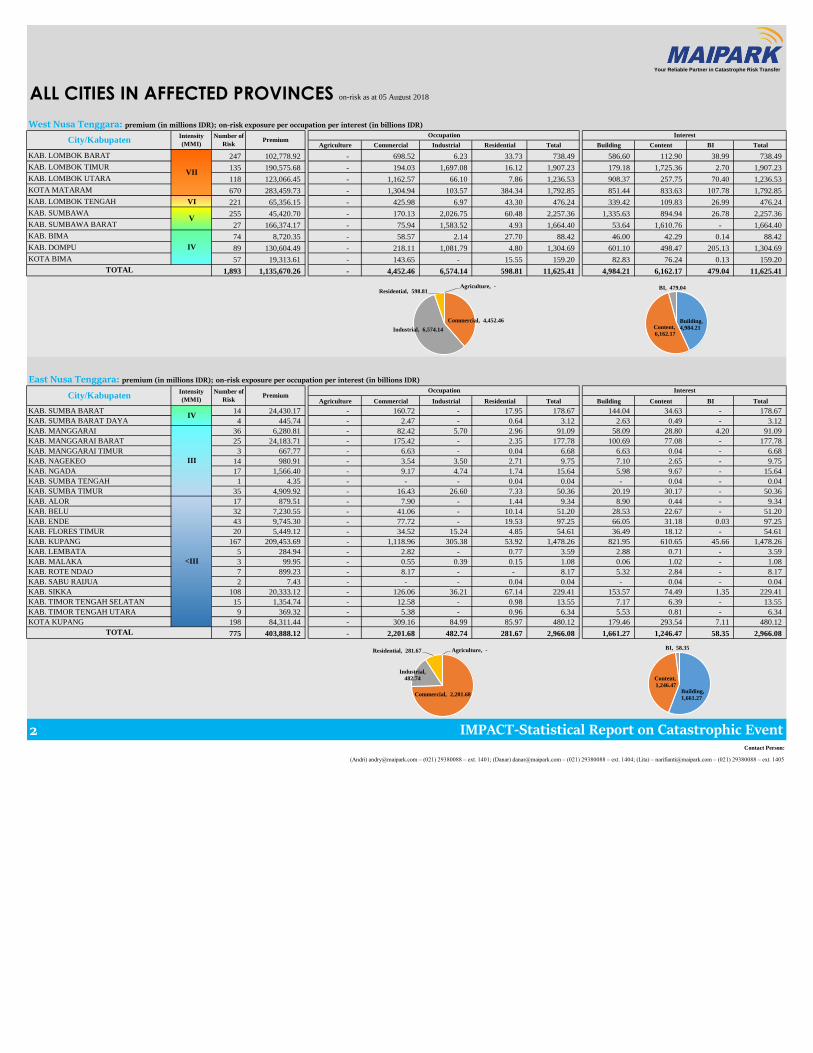
ALL CITIES IN AFFECTED PROVINCES on-risk as at 05 August 2018
West Nusa Tenggara: premium (in millions IDR); on-risk exposure per occupation per interest (in billions IDR)
Agriculture Commercial Industrial Residential Total Building Content BI Total
KAB. LOMBOK BARAT 247 102,778.92 - 698.52 6.23 33.73 738.49 586.60 112.90 38.99 738.49
KAB. LOMBOK TIMUR 135 190,575.68 - 194.03 1,697.08 16.12 1,907.23 179.18 1,725.36 2.70 1,907.23
KAB. LOMBOK UTARA 118 123,066.45 - 1,162.57 66.10 7.86 1,236.53 908.37 257.75 70.40 1,236.53
KOTA MATARAM 670 283,459.73 - 1,304.94 103.57 384.34 1,792.85 851.44 833.63 107.78 1,792.85
KAB. LOMBOK TENGAH VI 221 65,356.15 - 425.98 6.97 43.30 476.24 339.42 109.83 26.99 476.24
KAB. SUMBAWA 255 45,420.70 - 170.13 2,026.75 60.48 2,257.36 1,335.63 894.94 26.78 2,257.36
KAB. SUMBAWA BARAT 27 166,374.17 - 75.94 1,583.52 4.93 1,664.40 53.64 1,610.76 - 1,664.40
KAB. BIMA 74 8,720.35 - 58.57 2.14 27.70 88.42 46.00 42.29 0.14 88.42
KAB. DOMPU 89 130,604.49 - 218.11 1,081.79 4.80 1,304.69 601.10 498.47 205.13 1,304.69
KOTA BIMA 57 19,313.61 - 143.65 - 15.55 159.20 82.83 76.24 0.13 159.20
1,893 1,135,670.26 - 4,452.46 6,574.14 598.81 11,625.41 4,984.21 6,162.17 479.04 11,625.41
East Nusa Tenggara: premium (in millions IDR); on-risk exposure per occupation per interest (in billions IDR)
Agriculture Commercial Industrial Residential Total Building Content BI Total
KAB. SUMBA BARAT 14 24,430.17 - 160.72 - 17.95 178.67 144.04 34.63 - 178.67
KAB. SUMBA BARAT DAYA 4 445.74 - 2.47 - 0.64 3.12 2.63 0.49 - 3.12
KAB. MANGGARAI 36 6,280.81 - 82.42 5.70 2.96 91.09 58.09 28.80 4.20 91.09
KAB. MANGGARAI BARAT 25 24,183.71 - 175.42 - 2.35 177.78 100.69 77.08 - 177.78
KAB. MANGGARAI TIMUR 3 667.77 - 6.63 - 0.04 6.68 6.63 0.04 - 6.68
KAB. NAGEKEO 14 980.91 - 3.54 3.50 2.71 9.75 7.10 2.65 - 9.75
KAB. NGADA 17 1,566.40 - 9.17 4.74 1.74 15.64 5.98 9.67 - 15.64
KAB. SUMBA TENGAH 1 4.35 - - - 0.04 0.04 - 0.04 - 0.04
KAB. SUMBA TIMUR 35 4,909.92 - 16.43 26.60 7.33 50.36 20.19 30.17 - 50.36
KAB. ALOR 17 879.51 - 7.90 - 1.44 9.34 8.90 0.44 - 9.34
KAB. BELU 32 7,230.55 - 41.06 - 10.14 51.20 28.53 22.67 - 51.20
KAB. ENDE 43 9,745.30 - 77.72 - 19.53 97.25 66.05 31.18 0.03 97.25
KAB. FLORES TIMUR 20 5,449.12 - 34.52 15.24 4.85 54.61 36.49 18.12 - 54.61
KAB. KUPANG 167 209,453.69 - 1,118.96 305.38 53.92 1,478.26 821.95 610.65 45.66 1,478.26
KAB. LEMBATA 5 284.94 - 2.82 - 0.77 3.59 2.88 0.71 - 3.59
KAB. MALAKA 3 99.95 - 0.55 0.39 0.15 1.08 0.06 1.02 - 1.08
KAB. ROTE NDAO 7 899.23 - 8.17 - - 8.17 5.32 2.84 - 8.17
KAB. SABU RAIJUA 2 7.43 - - - 0.04 0.04 - 0.04 - 0.04
KAB. SIKKA 108 20,333.12 - 126.06 36.21 67.14 229.41 153.57 74.49 1.35 229.41
KAB. TIMOR TENGAH SELATAN 15 1,354.74 - 12.58 - 0.98 13.55 7.17 6.39 - 13.55
KAB. TIMOR TENGAH UTARA 9 369.32 - 5.38 - 0.96 6.34 5.53 0.81 - 6.34
KOTA KUPANG 198 84,311.44 - 309.16 84.99 85.97 480.12 179.46 293.54 7.11 480.12
775 403,888.12 - 2,201.68 482.74 281.67 2,966.08 1,661.27 1,246.47 58.35 2,966.08
2
PremiumInterest
City/KabupatenIntensity
(MMI)
Number of
Risk
Occupation Interest
TOTAL
City/KabupatenIntensity
(MMI)
Number of
Risk
Occupation
VII
V
IV
Premium
IV
III
<III
TOTAL
Contact Person:
(Andri) [email protected] – (021) 29380088 – ext. 1401; (Danar) [email protected] – (021) 29380088 – ext. 1404; (Lita) – [email protected] – (021) 29380088 – ext. 1405
IMPACT-Statistical Report on Catastrophic Event
Agriculture, -
Commercial, 4,452.46
Industrial, 6,574.14
Residential, 598.81
Building,
4,984.21 Content,
6,162.17
BI, 479.04
Agriculture, -
Commercial, 2,201.68
Industrial,
482.74
Residential, 281.67
Building,
1,661.27
Content,
1,246.47
BI, 58.35
Your Reliable Partner in Catastrophe Risk Transfer

Bali: premium (in millions IDR); on-risk exposure per occupation per interest (in billions IDR)
Agriculture Commercial Industrial Residential Total Building Content BI Total
KAB. BADUNG 3,919 5,484,927.44 - 36,107.38 478.21 4,880.52 41,466.12 26,788.93 8,700.50 5,976.69 41,466.12
KAB. BANGLI 52 6,292.79 - 53.76 5.05 10.62 69.44 52.25 17.19 - 69.44
KAB. GIANYAR 669 509,076.05 - 3,222.95 282.46 406.80 3,912.21 2,883.10 854.60 174.50 3,912.21
KAB. KARANG ASEM 346 90,698.52 - 786.66 40.25 177.54 1,004.45 791.42 189.13 23.90 1,004.45
KAB. KLUNGKUNG 111 47,919.17 - 478.97 40.81 66.96 586.75 408.04 174.69 4.03 586.75
KOTA DENPASAR 3,669 2,085,983.75 - 11,864.73 1,007.91 2,930.72 15,803.36 7,795.42 6,782.66 1,225.28 15,803.36
KAB. BULELENG 549 94,022.04 - 832.59 5,887.84 155.59 6,876.02 755.23 6,089.13 31.65 6,876.02
KAB. JEMBRANA 126 45,554.49 - 133.15 239.40 125.80 498.36 261.83 236.54 - 498.36
KAB. TABANAN 341 115,679.47 - 660.21 99.54 375.02 1,134.77 861.61 271.40 1.76 1,134.77
9,782 8,480,153.72 - 54,140.41 8,081.48 9,129.57 71,351.46 40,597.82 23,315.83 7,437.81 71,351.46
East Java: premium (in millions IDR); on-risk exposure per occupation per interest (in billions IDR)
Agriculture Commercial Industrial Residential Total Building Content BI Total
KAB. BANYUWANGI 524 481,839.11 0.83 536.46 4,215.67 110.85 4,863.82 2,405.15 2,152.49 306.17 4,863.82
KAB. BONDOWOSO 98 41,450.02 - 312.26 110.42 6.35 429.02 153.44 272.39 3.19 429.02
KAB. GRESIK 774 3,126,340.47 - 4,231.22 27,935.38 146.60 32,313.21 17,615.78 12,216.32 2,481.12 32,313.21
KAB. JEMBER 2,273 317,675.67 25.33 1,752.61 431.62 213.00 2,422.56 1,112.20 1,199.48 110.88 2,422.56
KAB. LUMAJANG 394 80,617.91 - 155.88 581.60 44.03 781.51 248.89 522.83 9.79 781.51
KAB. PAMEKASAN 196 76,785.48 - 675.32 170.11 16.24 861.67 283.75 577.93 - 861.67
KAB. PROBOLINGGO 670 277,304.84 25.68 246.15 2,228.42 146.17 2,646.42 669.82 1,962.39 14.20 2,646.42
KAB. SAMPANG 48 6,650.91 - 15.78 2.01 46.88 64.67 39.86 24.81 - 64.67
KAB. SIDOARJO 1,848 1,814,969.41 - 2,703.27 16,351.35 512.77 19,567.38 4,923.07 11,791.68 2,852.64 19,567.38
KAB. SITUBONDO 167 114,803.00 34.87 55.58 1,145.37 23.05 1,258.86 134.49 1,124.34 0.02 1,258.86
KAB. SUMENEP 64 7,827.26 - 17.28 32.85 28.05 78.18 49.62 27.98 0.58 78.18
KOTA PROBOLINGGO 755 54,840.29 - 36.93 160.62 79.86 277.40 120.32 155.63 1.45 277.40
KOTA SURABAYA 5,631 5,390,226.63 - 20,272.38 19,324.87 15,640.96 55,238.20 24,299.45 21,106.45 9,832.30 55,238.20
KAB. BANGKALAN 101 14,448.68 - 47.71 77.29 20.21 145.20 97.75 39.36 8.09 145.20
KAB. BLITAR 187 18,654.91 0.63 76.97 95.33 47.00 219.93 112.84 106.33 0.76 219.93
KAB. BOJONEGORO 230 1,527,017.89 - 436.20 14,784.77 89.86 15,310.83 14,964.30 330.73 15.80 15,310.83
KAB. JOMBANG 272 563,320.94 - 158.55 5,372.35 82.43 5,613.33 890.31 4,362.76 360.27 5,613.33
KAB. KEDIRI 342 1,833,567.77 5.64 806.08 18,584.57 124.40 19,520.68 2,484.42 16,994.70 41.57 19,520.68
KAB. LAMONGAN 231 511,272.82 - 628.54 4,487.56 26.52 5,142.62 976.31 4,075.31 91.00 5,142.62
KAB. MADIUN 274 74,498.54 - 343.00 369.83 47.40 760.23 158.84 486.89 114.50 760.23
KAB. MALANG 8,396 704,835.43 0.24 1,859.58 2,068.42 969.16 4,897.40 2,056.93 2,704.45 136.02 4,897.40
KAB. MOJOKERTO 426 1,386,842.75 - 1,214.69 12,762.63 46.18 14,023.50 2,404.28 9,421.32 2,197.90 14,023.50
KAB. NGANJUK 136 52,030.67 - 117.90 532.63 15.90 666.42 190.99 438.40 37.03 666.42
KAB. PASURUAN 2,006 7,577,550.81 - 4,009.80 82,675.65 287.98 86,973.43 16,367.57 61,070.36 9,535.49 86,973.43
KAB. PONOROGO 121 18,714.24 - 160.53 0.04 29.95 190.51 146.50 41.37 2.65 190.51
KAB. TRENGGALEK 73 3,838.09 - 13.30 0.34 14.87 28.51 16.65 11.86 - 28.51
KAB. TUBAN 184 1,644,669.78 - 85.13 16,360.08 39.67 16,484.88 4,499.36 10,911.48 1,074.04 16,484.88
KAB. TULUNGAGUNG 178 113,089.36 - 109.46 966.71 88.10 1,164.27 207.12 954.68 2.47 1,164.27
KOTA BATU 499 68,148.96 - 359.71 2.67 98.33 460.71 327.59 121.12 12.00 460.71
KOTA BLITAR 58 10,047.11 - 41.02 56.46 3.70 101.18 41.77 59.41 - 101.18
KOTA KEDIRI 189 626,964.80 - 223.00 16,541.04 431.33 17,195.37 11,594.35 5,582.97 18.05 17,195.37
KOTA MADIUN 128 81,326.37 - 114.25 677.01 24.37 815.64 76.37 734.20 5.06 815.64
KOTA MALANG 4,048 305,520.37 - 1,497.79 515.97 667.27 2,681.02 1,607.06 940.34 133.62 2,681.02
KOTA MOJOKERTO 136 680,758.99 - 690.59 7,022.41 37.41 7,750.42 1,520.02 5,578.01 652.39 7,750.42
KOTA PASURUAN 817 1,725,916.99 - 2,439.19 15,459.46 120.63 18,019.28 1,779.50 12,501.94 3,737.83 18,019.28
KAB. MAGETAN 65 15,257.67 - 10.85 120.37 21.70 152.92 90.36 62.56 - 152.92
KAB. NGAWI 80 38,447.23 - 27.10 353.94 6.67 387.70 75.42 287.29 25.00 387.70
KAB. PACITAN 66 4,853.82 - 24.05 3.81 11.34 39.20 14.10 25.10 0.00 39.20
32,685 31,392,925.97 93.22 46,506.11 272,581.60 20,367.18 339,548.11 114,756.57 190,977.67 33,813.87 339,548.11
3
Premium
Premium
TOTAL
Interest
City/KabupatenIntensity
(MMI)
Number of
Risk
Occupation Interest
V
IV
City/KabupatenIntensity
(MMI)
Number of
Risk
Occupation
IV
III
<III
TOTAL
Contact Person:
(Andri) [email protected] – (021) 29380088 – ext. 1401; (Danar) [email protected] – (021) 29380088 – ext. 1404; (Lita) – [email protected] – (021) 29380088 – ext. 1405
IMPACT-Statistical Report on Catastrophic Event
Agriculture, -
Commercial, 54,140.41
Industrial, 8,081.48
Residential, 9,129.57
Building, 40,597.82 Content,
23,315.83
BI, 7,437.81
Agriculture, 93.22
Commercial, 46,506.11
Industrial,
272,581.60
Residential, 20,367.18
Building, 114,756.57
Content,
190,977.67
BI,
33,813.87
Your Reliable Partner in Catastrophe Risk Transfer

South Sulawesi: premium (in millions IDR); on-risk exposure per occupation per interest (in billions IDR)
Agriculture Commercial Industrial Residential Total Building Content BI Total
KAB. BANTAENG 39 4,839.95 - 8.30 49.88 5.47 63.66 42.84 20.82 - 63.66
KAB. BARRU 35 1,467.74 - 1.91 13.52 3.88 19.31 7.19 11.68 0.44 19.31
KAB. BONE 111 3,917.27 - 32.90 1.32 20.46 54.68 20.33 34.35 - 54.68
KAB. BULUKUMBA 102 3,737.51 - 18.08 7.81 25.45 51.34 21.27 30.07 0.00 51.34
KAB. ENREKANG 13 510.94 - - - 5.11 5.11 2.99 2.12 - 5.11
KAB. GOWA 167 38,785.30 - 103.98 438.28 55.71 597.97 264.27 312.27 21.43 597.97
KAB. JENEPONTO 23 240,957.80 - 4.12 3,120.15 46.16 3,170.43 45.60 3,124.83 - 3,170.43
KAB. MAROS 96 11,820.60 - 20.01 103.25 34.90 158.16 71.44 86.72 - 158.16
KAB. PANGKAJENE DAN KEPULAUAN 34 12,992.95 - 3.89 112.94 12.87 129.70 49.89 79.80 - 129.70
KAB. PINRANG 51 3,881.59 - 15.27 - 24.99 40.26 22.55 17.71 - 40.26
KAB. SELAYAR 13 947.54 - 1.03 - 5.61 6.64 5.75 0.89 - 6.64
KAB. SIDENRENG RAPPANG 63 2,982.65 - 6.73 4.00 11.84 22.57 13.95 8.63 - 22.57
KAB. SINJAI 32 8,973.60 - 19.59 40.25 58.07 117.91 73.88 39.02 5.00 117.91
KAB. SOPPENG 30 796.25 - 5.00 - 3.20 8.20 4.76 3.44 - 8.20
KAB. TAKALAR 53 6,422.85 - 9.17 95.60 7.15 111.92 43.21 68.71 - 111.92
KAB. WAJO 64 4,742.14 - 10.52 7.73 29.28 47.53 21.44 26.07 0.02 47.53
KOTA MAKASSAR 2,803 761,643.60 - 6,022.55 2,699.36 1,618.39 10,340.29 5,592.88 4,368.94 378.47 10,340.29
KOTA PARE-PARE 175 16,348.34 - 48.00 8.14 112.15 168.29 95.12 73.10 0.07 168.29
KAB. LUWU 21 3,318.53 - 3.13 28.91 12.10 44.14 22.61 21.54 - 44.14
KAB. LUWU TIMUR 252 11,657,360.42 0.07 15.80 81,482.22 22.53 81,520.63 24,043.36 52,740.07 4,737.19 81,520.63
KAB. LUWU UTARA 36 8,045.61 - 8.42 70.00 2.02 80.43 21.89 58.55 - 80.43
KAB. TANA TORAJA 27 12,325.67 - 10.03 111.04 2.28 123.35 53.74 69.62 - 123.35
KAB. TORAJA UTARA 24 5,667.25 - 36.35 - 20.34 56.69 39.57 15.12 2.00 56.69
KOTA PALOPO 175 15,027.44 - 84.09 1.30 66.51 151.91 62.93 76.65 12.32 151.91
4,439 12,827,513.54 0.07 6,488.88 88,395.71 2,206.45 97,091.11 30,643.46 61,290.71 5,156.94 97,091.11
South Kalimantan: premium (in millions IDR); on-risk exposure per occupation per interest (in billions IDR)
Agriculture Commercial Industrial Residential Total Building Content BI Total
KAB. BANJAR 103 41,626.21 - 373.61 146.03 26.50 546.14 212.38 322.27 11.49 546.14
KAB. TANAH BUMBU 153 158,860.60 9.07 190.76 1,947.20 80.50 2,227.54 314.60 1,470.84 442.10 2,227.54
KAB. TANAH LAUT 97 338,383.40 - 43.80 4,460.57 14.48 4,518.84 606.89 3,664.66 247.29 4,518.84
KOTA BANJARBARU 148 25,162.56 - 238.36 86.73 14.37 339.46 96.03 216.92 26.51 339.46
KAB. BALANGAN 10 649.03 - 8.02 0.56 0.07 8.65 1.68 6.97 - 8.65
KAB. BARITO KUALA 11 1,713.87 - 22.54 - 0.31 22.85 15.49 5.34 2.03 22.85
KAB. HULU SUNGAI SELATAN 14 1,451.62 - 18.22 0.63 0.47 19.31 15.61 3.70 - 19.31
KAB. HULU SUNGAI TENGAH 51 1,677.02 - 16.61 0.38 5.41 22.40 4.17 18.23 - 22.40
KAB. HULU SUNGAI UTARA 12 2,260.88 - 29.09 - 1.00 30.09 24.72 5.37 - 30.09
KAB. KOTABARU 102 499,048.65 50.09 855.23 5,843.28 11.39 6,759.99 510.59 6,040.99 208.41 6,759.99
KAB. TABALONG 63 260,699.49 - 242.39 3,220.08 16.17 3,478.65 1,086.25 2,212.19 180.22 3,478.65
KAB. TAPIN 26 25,679.53 187.61 85.02 41.28 43.37 357.29 97.43 259.79 0.07 357.29
KOTA BANJARMASIN 713 109,044.00 0.07 697.37 590.64 215.42 1,503.50 533.32 860.95 109.23 1,503.50
1,503 1,466,256.87 246.85 2,821.02 16,337.38 429.46 19,834.71 3,519.14 15,088.22 1,227.34 19,834.71
DISCLAIMER
ALL INSURANCE DATA PRESENTED BASED ON CEDED PORTFOLIO FROM INSURANCE COMPANIES IN INDONESIA TO MAIPARK AS AT DATE STATED.
MAP AND INTENSITY ARE PRESENTED BASED ON USGS CALCULATION. ALL FORMULAS AND METHODOLOGIES ARE ACCESSIBLE ON ITS WEBSITES.
4
Premium
Premium
Interest
III
<III
ALL EARTHQUAKE PARAMETER(S) IS BASED ON PUBLISHED DATA FROM Badan Meteorologi Klimatologi dan Geofisika (BMKG), United States Geological Survey (USGS) and Geo Forschungs Zentrum (GFZ) ON THEIR
RESPECTIVE WEBSITES. ALL INFORMATION PRESENTED IS DIFFERENT BETWEEN INSTITUTE, DEPENDING ON SEISMIC DATA AND METHODOLOGY APPLIED. MAIPARK DOES NOT SUGGEST THESE EQ INFORMATION TO
BE USED AS AN UNDERWRITING GUIDELINE AS THESE ONLY REPRESENT CIRCUMSTANCE FOR RELATED SPECIFIC EVENT.
Number of
Risk
Occupation
TOTAL
City/KabupatenIntensity
(MMI)
Number of
Risk
Occupation Interest
Contact Person:
(Andri) [email protected] – (021) 29380088 – ext. 1401; (Danar) [email protected] – (021) 29380088 – ext. 1404; (Lita) – [email protected] – (021) 29380088 – ext. 1405
III
<III
City/KabupatenIntensity
(MMI)
TOTAL
IMPACT-Statistical Report on Catastrophic Event
Agriculture, 0.07
Commercial, 6,488.88
Industrial, 88,395.71
Residential, 2,206.45
Building,
30,643.46
Content,
61,290.71
BI, 5,156.94
Agriculture, 246.85
Commercial,
2,821.02
Industrial, 16,337.38
Residential, 429.46
Building, 3,519.14
Content,
15,088.22
BI, 1,227.34
Your Reliable Partner in Catastrophe Risk Transfer

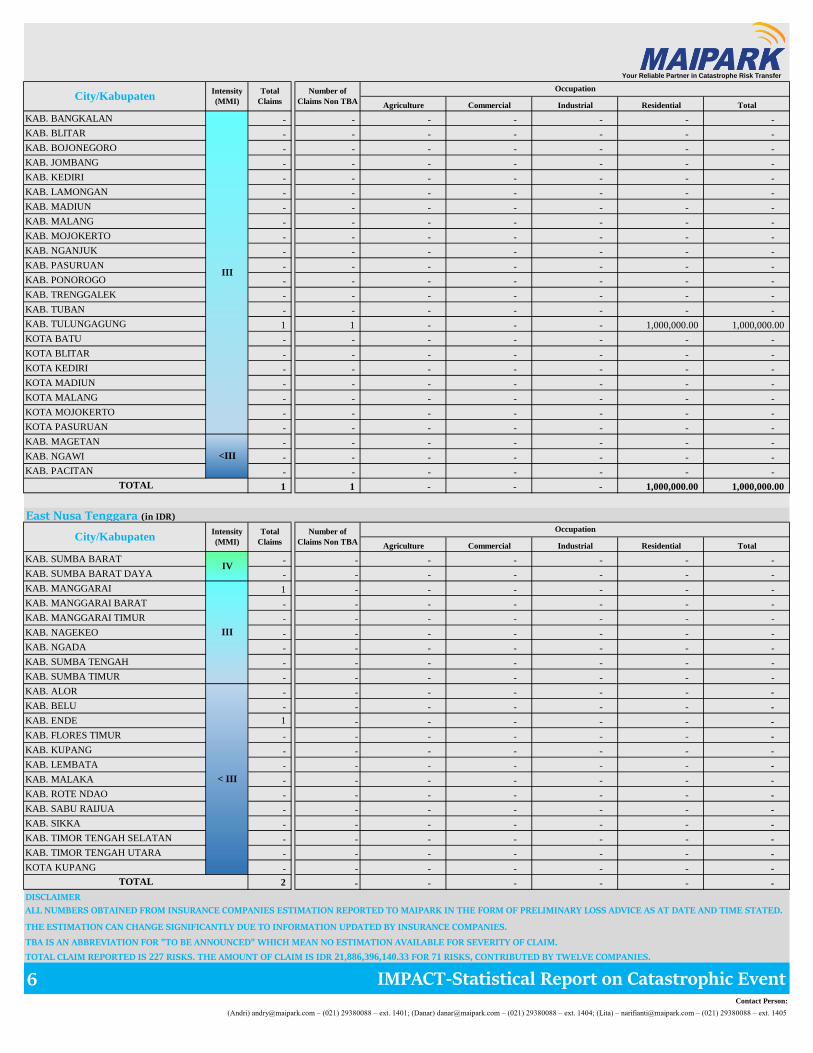
REPORTED CLAIMS accumulated as at 11:00 WIB
West Nusa Tenggara (in IDR)
Agriculture Commercial Industrial Residential Total
KAB. LOMBOK BARAT 22 6 - 4,518,016,250.00 - 110,000,000.00 4,628,016,250.00
KAB. LOMBOK TIMUR 5 - - - - - -
KAB. LOMBOK UTARA 27 4 - 274,978,626.15 - - 274,978,626.15
KOTA MATARAM 74 24 - 7,520,022,573.76 - 367,651,334.52 7,887,673,908.28
KAB. LOMBOK TENGAH VI 6 1 - 1,000,000.00 - - 1,000,000.00
KAB. SUMBAWA - - - - - - -
KAB. SUMBAWA BARAT 2 - - - - - -
KAB. BIMA 1 - - - - - -
KAB. DOMPU - - - - - - -
KOTA BIMA - - - - - - -
137 35 - 12,314,017,449.91 - 477,651,334.52 12,791,668,784.43
Bali (in IDR)
Agriculture Commercial Industrial Residential Total
KAB. BADUNG 37 16 - 453,814,918.90 - 50,000,000.00 503,814,918.90
KAB. BANGLI - - - - - - -
KAB. GIANYAR 8 2 - 1,250,000.00 - 1,000,000.00 2,250,000.00
KAB. KARANG ASEM 9 8 - 5,082,998,412.00 - 2,908,406,025.00 7,991,404,437.00
KAB. KLUNGKUNG - - - - - - -
KOTA DENPASAR 28 8 - 276,258,000.00 - 20,000,000.00 296,258,000.00
KAB. BULELENG 3 1 - - - 300,000,000.00 300,000,000.00
KAB. JEMBRANA 1 - - - - - -
KAB. TABANAN 1 - - - - - -
87 35 - 5,814,321,330.90 - 3,279,406,025.00 9,093,727,355.90
East Java (in IDR)
Agriculture Commercial Industrial Residential Total
KAB. BANYUWANGI - - - - - - -
KAB. BONDOWOSO - - - - - - -
KAB. GRESIK - - - - - - -
KAB. JEMBER - - - - - - -
KAB. LUMAJANG - - - - - - -
KAB. PAMEKASAN - - - - - - -
KAB. PROBOLINGGO - - - - - - -
KAB. SAMPANG - - - - - - -
KAB. SIDOARJO - - - - - - -
KAB. SITUBONDO - - - - - - -
KAB. SUMENEP - - - - - - -
KOTA PROBOLINGGO - - - - - - -
KOTA SURABAYA - - - - - - -
5
(Andri) [email protected] – (021) 29380088 – ext. 1401; (Danar) [email protected] – (021) 29380088 – ext. 1404; (Lita) – [email protected] – (021) 29380088 – ext. 1405
Total
Claims
Occupation
City/KabupatenIntensity
(MMI)
Number of
Claims Non TBA
Occupation
VII
V
IV
TOTAL
City/KabupatenIntensity
(MMI)
Number of
Claims Non TBA
Total
Claims
Total
Claims
Number of
Claims Non TBA
Occupation
IV
IMPACT-Statistical Report on Catastrophic EventContact Person:
V
IV
TOTAL
City/KabupatenIntensity
(MMI)
Your Reliable Partner in Catastrophe Risk Transfer
Agriculture Commercial Industrial Residential Total
KAB. BANGKALAN - - - - - - -
KAB. BLITAR - - - - - - -
KAB. BOJONEGORO - - - - - - -
KAB. JOMBANG - - - - - - -
KAB. KEDIRI - - - - - - -
KAB. LAMONGAN - - - - - - -
KAB. MADIUN - - - - - - -
KAB. MALANG - - - - - - -
KAB. MOJOKERTO - - - - - - -
KAB. NGANJUK - - - - - - -
KAB. PASURUAN - - - - - - -
KAB. PONOROGO - - - - - - -
KAB. TRENGGALEK - - - - - - -
KAB. TUBAN - - - - - - -
KAB. TULUNGAGUNG 1 1 - - - 1,000,000.00 1,000,000.00
KOTA BATU - - - - - - -
KOTA BLITAR - - - - - - -
KOTA KEDIRI - - - - - - -
KOTA MADIUN - - - - - - -
KOTA MALANG - - - - - - -
KOTA MOJOKERTO - - - - - - -
KOTA PASURUAN - - - - - - -
KAB. MAGETAN - - - - - - -
KAB. NGAWI - - - - - - -
KAB. PACITAN - - - - - - -
1 1 - - - 1,000,000.00 1,000,000.00
East Nusa Tenggara (in IDR)
Agriculture Commercial Industrial Residential Total
KAB. SUMBA BARAT - - - - - - -
KAB. SUMBA BARAT DAYA - - - - - - -
KAB. MANGGARAI 1 - - - - - -
KAB. MANGGARAI BARAT - - - - - - -
KAB. MANGGARAI TIMUR - - - - - - -
KAB. NAGEKEO - - - - - - -
KAB. NGADA - - - - - - -
KAB. SUMBA TENGAH - - - - - - -
KAB. SUMBA TIMUR - - - - - - -
KAB. ALOR - - - - - - -
KAB. BELU - - - - - - -
KAB. ENDE 1 - - - - - -
KAB. FLORES TIMUR - - - - - - -
KAB. KUPANG - - - - - - -
KAB. LEMBATA - - - - - - -
KAB. MALAKA - - - - - - -
KAB. ROTE NDAO - - - - - - -
KAB. SABU RAIJUA - - - - - - -
KAB. SIKKA - - - - - - -
KAB. TIMOR TENGAH SELATAN - - - - - - -
KAB. TIMOR TENGAH UTARA - - - - - - -
KOTA KUPANG - - - - - - -
2 - - - - - -
DISCLAIMER
6
TBA IS AN ABBREVIATION FOR "TO BE ANNOUNCED" WHICH MEAN NO ESTIMATION AVAILABLE FOR SEVERITY OF CLAIM.
TOTAL CLAIM REPORTED IS 227 RISKS. THE AMOUNT OF CLAIM IS IDR 21,886,396,140.33 FOR 71 RISKS, CONTRIBUTED BY TWELVE COMPANIES.
TOTAL
City/KabupatenIntensity
(MMI)
Number of
Claims Non TBA
OccupationTotal
Claims
Total
Claims
(Andri) [email protected] – (021) 29380088 – ext. 1401; (Danar) [email protected] – (021) 29380088 – ext. 1404; (Lita) – [email protected] – (021) 29380088 – ext. 1405
III
<III
TOTAL
ALL NUMBERS OBTAINED FROM INSURANCE COMPANIES ESTIMATION REPORTED TO MAIPARK IN THE FORM OF PRELIMINARY LOSS ADVICE AS AT DATE AND TIME STATED.
THE ESTIMATION CAN CHANGE SIGNIFICANTLY DUE TO INFORMATION UPDATED BY INSURANCE COMPANIES.
IMPACT-Statistical Report on Catastrophic EventContact Person:
City/KabupatenIntensity
(MMI)
Number of
Claims Non TBA
Occupation
IV
III
< III
Your Reliable Partner in Catastrophe Risk Transfer

EXPOSURE PROFIL OF NUSA TENGGARA BARAT (NTB)
7 IMPACT-Statistical Report on Catastrophic EventContact Person:
(Andri) [email protected] – (021) 29380088 – ext. 1401; (Danar) [email protected] – (021) 29380088 – ext. 1404; (Lita) – [email protected] – (021) 29380088 – ext. 1405
Your Reliable Partner in Catastrophe Risk Transfer
11,838 11,836 11,836 11,840 11,833 11,832 11,822
11,694
11,650 11,643 11,643 11,625 11,622 11,616 11,616 11,611
11,598
11,540 11,535 11,535 11,535 11,530 11,530 11,519 11,519 11,515 11,514
11,377
11,331 11,331
11,000
11,100
11,200
11,300
11,400
11,500
11,600
11,700
11,800
11,900
25 July
2018
26 July
2018
27 July
2018
28 July
2018
29 July
2018
30 July
2018
31 July
2018
01
August
2018
02
August
2018
03
August
2018
04
August
2018
05
August
2018
06
August
2018
07
August
2018
08
August
2018
09
August
2018
10
August
2018
11
August
2018
12
August
2018
13
August
2018
14
August
2018
15
August
2018
16
August
2018
17
August
2018
18
August
2018
19
August
2018
20
August
2018
21
August
2018
22
August
2018
23
August
2018
EX
PO
SU
RE
(IN
BIL
LIO
NS
ID
R)
ON-RIKS AS AT
ON-RISK EXPOSURE