
IMPACT Project Field Tests Data Analysis - vliz.be · Figure1:Designdata for Test1-02 3...
30
Integrated Flood Risk Analysis and Management Methodologies IMPACT Project Field Tests Data Analysis August 2008 Report Number T04-08-04 Revision Number 3_3_P01 Task Leader Partner Mark Morris HR Wallingford FLOODsite is co-funded by the European Community Sixth Framework Programme for European Research and Technological Development (2002-2006) FLOODsite is an Integrated Project in the Global Change and Eco-systems Sub-Priority Start date March 2004, duration 5 Years Document Dissemination PU Public PU PP Restricted to other programme participants (including the Commission Services) RE Restricted to a group specified by the consortium (including the Commission Services) CO Confidential, only for members of the consortium (including the Commission Services) Co-ordinator: HR Wallingford, UK Project Contract No: GOCE-CT-2004-505420 Project website: www.floodsite.net
Transcript of IMPACT Project Field Tests Data Analysis - vliz.be · Figure1:Designdata for Test1-02 3...

Integrated Flood Risk Analysis and Management Methodologies
IMPACT Project Field Tests Data Analysis
August 2008
Report Number T04-08-04 Revision Number 3_3_P01
Task Leader Partner Mark Morris HR Wallingford
FLOODsite is co-funded by the European Community
Sixth Framework Programme for European Research and Technological Development (2002-2006)
FLOODsite is an Integrated Project in the Global Change and Eco-systems Sub-Priority
Start date March 2004, duration 5 Years
Document Dissemination
PU Public PU
PP Restricted to other programme participants (including the Commission Services)
RE Restricted to a group specified by the consortium (including the Commission Services)
CO Confidential, only for members of the consortium (including the Commission Services)
Co-ordinator: HR Wallingford, UK Project Contract No: GOCE-CT-2004-505420 Project website: www.floodsite.net


FLOODsite Project Report
Contract No:GOCE-CT-2004-505420
T04_08_04_IMPACT_Data_Analysis_v3_3.doc 2nd February 2009 iii
DOCUMENT INFORMATION
Title IMPACT Project Field Tests Data Analysis
Lead Author Mohamed Hassan
Contributors Mark Morris
Distribution PUBLIC
Document Reference T04-08-04
DOCUMENT HISTORY Date Revision Prepared by Organisation Approved by Notes
24/04/08 1_0_P01 MAM HRW MWM Initial draft summary
25/04/08 1_0_P01 MAM HRW
07/07/08 2_4_P01 MAM HRW Added missing info to complete test
case definitions
11/07/08 3_0_P01 MWM HRW Public version
16/07/08 2_5_P01 MAM HRW Added test 2-03
7/8/08 3_1_P01 MWM HRW Integrated V2_5 additional info, notes
on field tests and final review for
public release of final draft version
13/8/08 3_2_P01 MWM HRW Review edits for final draft release
02/02/09 3_3_P01 MAM HRW MWM Correct dry density values
ACKNOWLEDGEMENT
The work described in this publication was supported by the European Community’s Sixth Framework
Programme through the grant to the budget of the Integrated Project FLOODsite, Contract GOCE-CT-
2004-505420.
This work was prompted by discrepancies identified from work within the CEATI facilitated Dam
Safety Interest Group project on breach modelling. Contributions from the DSIG team and Jean-
Robert Courivaud (EDF, France) and Greg Hanson (USDA-ARS, USA) in particular, are gratefully
acknowledged. Contributions from Kjetil Vaskinn (SWECO, Norway) and Aslak Løvoll (Norconsult,
Norway) have also helped clarify differences within the data sets.
DISCLAIMER
This document reflects only the authors’ views and not those of the European Community. This work
may rely on data from sources external to the FLOODsite project Consortium. Members of the
Consortium do not accept liability for loss or damage suffered by any third party as a result of errors
or inaccuracies in such data. The information in this document is provided “as is” and no guarantee or
warranty is given that the information is fit for any particular purpose. The user thereof uses the
information at its sole risk and neither the European Community nor any member of the FLOODsite
Consortium is liable for any use that may be made of the information.
© FLOODsite Consortium

FLOODsite Project Report
Contract No:GOCE-CT-2004-505420
T04_08_04_IMPACT_Data_Analysis_v3_3.doc 2nd February 2009 iv

FLOODsite Project Report
Contract No:GOCE-CT-2004-505420
T04_08_04_IMPACT_Data_Analysis_v3_3.doc 2nd February 2009 v
SUMMARY
Part of the FLOODsite Task 4 research programme included a review and more detailed analysis of
the IMPACT Project field and laboratory test data relating to breach growth and breach modelling (see
www.impact-project.net work package 2). As part of FLOODsite Task 6, HR Wallingford established
links with the CEATI facilitated Dam Safety Interest Group project on breach modelling. Through this
project, copies of data arising from the IMPACT project, but provided via the original IMPACT
Project Norwegian partner, and a number of intermediary organisations, was received by HR
Wallingford and noted to significantly differ from the original master data sets held by HR
Wallingford (as coordinator of the IMPACT Project, and work package leader for the breach work).
This report presents the conclusions of a long term investigation into the source of the differences in
the IMPACT data sets, and concludes recommended values for future use of the IMPACT data. The
investigation concluded that:
• There are significant differences between the IMPACT data now being used, as compared to
the data used during breach model testing under the IMPACT project. The extent to which
this affects research conclusions from the IMPACT project is unclear. Researchers using data
originating from the IMPACT project itself should refer to this report and associated data sets
to ensure they are using correct data
• It appears that much of the data provided from Norway during the IMPACT project (i.e. the
field test data) related to proposed rather than as built test conditions. Significant differences
between proposed and as built conditions which were not reported at the time have now been
identified. However, whilst these explain a significant number of the data differences, they do
not explain all differences, including some of the major differences.
• Some flow data has been recalculated. This includes reservoir releases providing inflow to the
test site as well as measured breach flow
• Some revised calculations provided from Norway still appear to be incorrect, hence some
questions still remain as to actual data values
These findings are disappointing, both for the IMPACT partners who were assured of data quality at
the time of the original research and more recently for a growing number of researchers around the
world who have been using data from the original project reports. Whilst the original data was not
formally released pending final analyses at the end of the project, it is clear that data has been shared
and a number of researchers have published work using the original data. It is recommended that
these researchers review their analyses in light of the findings reported here.
This report endeavours to identify errors and offers a ‘best estimate’ of correct data sets that may
subsequently be used in breach model verification and validation.
Copies of the IMPACT project breach data are also now being made publicly available alongside this
report.
FLOODsite Project Report
Contract No:GOCE-CT-2004-505420
T04_08_04_IMPACT_Data_Analysis_v3_3.doc 2nd February 2009 vi
FLOODsite Project Report
Contract No:GOCE-CT-2004-505420
T04_08_04_IMPACT_Data_Analysis_v3_3.doc 2nd February 2009 vii
CONTENTS
Document Information iii Document History iii Acknowledgement iii Disclaimer iii Summary v Contents vii
1. Introduction ......................................................................................................................1 1.1 Background ..........................................................................................................1
2. Test 1-02 – Homogeneous Cohesive (Clay) Test - Overflow ..........................................3 2.1 Data checks ..........................................................................................................3
2.1.1 Dam geometry: .......................................................................................3 2.1.2 Soil properties:........................................................................................4 2.1.3 Flow and water level data:......................................................................4
2.2 Additional comments ...........................................................................................6
3. Test 2C-02 – Homogeneous Non Cohesive (Gravel) Test - Overflow.............................8 3.1 Data checks ..........................................................................................................8
3.1.1 Dam geometry: .......................................................................................8 3.1.2 Soil properties:........................................................................................9 3.1.3 Flow and water level data:......................................................................9
3.2 Additional comments .........................................................................................10
4. Test 1-03 – Composite Structure (Gravel with Moraine Core) - Overflow....................12 4.1 Data checks ........................................................................................................12
4.1.1 Dam geometry: .....................................................................................12 4.1.2 Soil properties:......................................................................................13 4.1.3 Flow and water level data:....................................................................15
4.2 Additional comments .........................................................................................15
5. Test 2-03 – Composite Structure (Gravel with Moraine Core) - Piping.........................16 5.1 Data checks ........................................................................................................16
5.1.1 Dam geometry: .....................................................................................16 5.1.2 Soil properties:......................................................................................17 5.1.3 Flow and water level data:....................................................................17
5.2 Additional comments .........................................................................................17
6. Test 3-03 – Homogeneous (Moraine) - Piping ...............................................................18 6.1 Data checks ........................................................................................................18
6.1.1 Dam geometry: .....................................................................................18 6.1.2 Soil properties:......................................................................................18 6.1.3 Flow and water level data:....................................................................19
6.2 Additional comments .........................................................................................19
7. References ......................................................................................................................21
Tables
Table 1: Test 1-02 dam geometry 3 Table 2: Test 1-02 soil properties 4

FLOODsite Project Report
Contract No:GOCE-CT-2004-505420
T04_08_04_IMPACT_Data_Analysis_v3_3.doc 2nd February 2009 viii
Table 3: Test 2C-02 dam geometry 8 Table 4: Test 2C-02 soil properties 9 Table 5: Test 1-03 dam geometry 12 Table 6: Test 1-03 soil properties 13 Table 7: Data provided (by SWECO) during IMPACT for tests undertaken in 2003. 14 Table 8: Test 2-03 dam geometry 16 Table 9: Test 3-03 dam geometry 18
Figures
Figure 1: Design data for Test 1-02 3 Figure 2: Inflow to the reservoir 5 Figure 3: Test 1-02 water level. 5 Figure 4: Test 1-02 outflow hydrograph 6 Figure 5: Test 1-02 outflow hydrograph from the SP3 report (called flow VM5 in the legend) 6 Figure 6: Design data for Test 2C-02 8 Figure 7: Test 2C-02 outflow hydrograph. 10 Figure 8: Design data for Test 1-03 12 Figure 9: Grading curves for moraine and rock fill used in test 1-03 14 Figure 10: Design data for Test 2-03 16 Figure 11: Design data for Test 3-03 18

FLOODsite Project Report
Contract No:GOCE-CT-2004-505420
T04_08_04_IMPACT_Data_Analysis_v3_3.doc 2nd February 2009 ix
FLOODsite Project Report
Contract No:GOCE-CT-2004-505420
T04_08_04_IMPACT_Data_Analysis_v3_3.doc 2nd February 2009 1
1. Introduction
1.1 Background
The Investigation of Extreme Flood Processes & Uncertainty (IMPACT) project was funded by the
European Commission (EC), with additional financial support from various partners, and addressed
the assessment and reduction of risks from extreme flooding caused by natural events or the failure of
dams and flood defence structures. The project started in 2002 and lasted for 3 years. For more
information see www.impact-project.net
Research for this project was structured in order to advance scientific knowledge and understanding,
and develop predictive modelling tools in four key areas. Firstly, the movement of sediment generated
by a failure. Secondly, the mechanisms for the breaching of embankments (dams or flood control
dykes) and factors determining breach location. Thirdly, the simulation of catastrophic inundation of
valleys and urban areas and fourthly the use of geophysical techniques for the rapid integrity
assessment of flood defence embankments.
To advance knowledge in the area of embankment breaching, a series of 5 field and 22 laboratory tests
were undertaken at a test site in Norway and at HR Wallingford in the UK, respectively. The
Norwegian partner in IMPACT was SWECO (formerly Statkraft Groner). SWECO undertook the
field testing in Norway in conjunction with a supporting Norwegian national research programme on
dam safety. A range of additional Norwegian partners operated on this project; Norconsult was
responsible for the field test construction, implementation and data collection and processing. The data
from both the Norwegian field tests and UK laboratory tests wasused to establish a programme of
numerical breach model comparison and development within the IMPACT project.
The responsibility for data quality for field, laboratory and numerical model tests resided with the
partner responsible for collection of their data, and subsequent provision to the wider research team.
As coordinator for this work package, HR Wallingford undertook periodic consistency checks on data
provided by all partners during the testing programme. At the time, this identified a number of data
quality issues with the field test data which were supposedly addressed. It is clear from the analysis
within this report that these issues went much further than originally identified and were not
adequately addressed by SWECO at that time – particularly in light of how the data was being used
within the IMPACT project team for numerical breach model development, comparison and
validation.
After completion of the IMPACT project, HR Wallingford has actively continued with the
development of the HR BREACH model. This model which was developed prior to the IMPACT
project and is one of the models that was included in the IMPACT numerical modelling programme.
The Dam Safety Interest Group (DSIG) is composed of dam owners from around the world (Canada,
US, Australia, Sweden, France, UK and Germany) who jointly sponsor research & development
projects designed to help assess and improve the safety of dams (see www.ceatech.ca/DSIG.php). In
January 2007 the DSIG invited HR Wallingford to participate in the DSIG breach modelling
programme. The programme involves the evaluation of 3 breach models and aims to find the best
approach(s) to modelling the breaching of embankments. The DSIG has also identified 7 potential
benchmark test cases for the purpose of this program. Three of the test cases are from the IMPACT
field tests that were undertaken in Norway. The DSIG acquired this data from SWECO after the
completion of the IMPACT project.
HR Wallingford received the benchmark data from the DSIG in order to prepare for the numerical
modelling programme. As a quality check, the data received from the DSIG was compared against the
data already held by HR Wallingford from the IMPACT project. The initial checks showed differences
and discrepancies between the two data sets and hence a more detailed data check was undertaken by
FLOODsite Project Report
Contract No:GOCE-CT-2004-505420
T04_08_04_IMPACT_Data_Analysis_v3_3.doc 2nd February 2009 2
HR Wallingford which revealed that there are significant differences between the DSIG and IMPACT
data sets.
In light of the differences found, the DSIG testing programme was delayed pending clarification.
Conclusions from the IMPACT project analyses may also be affected by these data differences,
however the extent of any impact is not immediately obvious. Discussions were held between HR
Wallingford, DSIG, SWECO, and Norconsult by email and personal communication to identify the
cause of any differences and hence agree on definitive data sets. The response from the Norwegian
partners in this exercise was disappointing.
A wide range of data differences were identified. The investigation concluded that:
• There are significant differences between the IMPACT data now being used, as compared to
the data used during breach model testing under the IMPACT project. The extent to which
this affects research conclusions from the IMPACT project is unclear. Researchers using data
originating from the IMPACT project itself should refer to this report and associated data sets
to ensure they are using correct data
• Much of the data provided from Norway during the IMPACT project (i.e. the field test data)
related to proposed rather than as built test conditions. Significant differences between
proposed and as built conditions which were not reported at the time have now been
identified. However, whilst these explain a significant number of the data differences, they do
not explain all differences, including some of the major differences.
• Some flow data has been recalculated. This includes reservoir releases providing inflow to the
test site as well as measured breach flow
• Some revised calculations provided from Norway still appear to be incorrect
This report aims to present the field test data discrepancies and endeavour to establish logically and
objectively a ‘correct’ data set for each of the field tests that can be used in the DSIG modelling
programme. To achieve that, this report depends mainly on two sources of data which are the
IMPACT project technical report for Work Package 2 (WP2) ‘the breach physical and numerical
modelling’ and the Norwegian project stability and breaching of embankment dams report on Sub-
project 3 (SP3) ‘breaching of embankment dams’.

FLOODsite Project Report
Contract No:GOCE-CT-2004-505420
T04_08_04_IMPACT_Data_Analysis_v3_3.doc 2nd February 2009 3
2. Test 1-02 – Homogeneous Cohesive (Clay) Test - Overflow
This test was undertaken in September 2002. The embankment (See Figure 1) was built mainly from
clay and silt (D50 < 0.01 mm) with less than 15% sand. The purpose of this test was to better
understand breach formation and to identify the different failure mechanisms in homogeneous
cohesive embankments failed by overtopping.
2 m
2.0
16 m
Concrete sill
1
Rock
Figure 1: Design data for Test 1-02
2.1 Data checks
2.1.1 Dam geometry:
Table 1 shows the geometry data collected from the SP3 and the IMPACT WP2 reports. As shown in
the table, there is a difference between all the items listed. The effect of data differences on breach
modelling will depend upon which aspect of breach model performance was being assessed. For
example, errors in notch initial size and elevation could significantly affect breach timing. The
differences are explained by SWECO and Norconsult as originating from the differences between the
design and as built conditions. This shows a disturbing level of variance from design to as built – for
example, 100mm difference in crest elevation and a difference in side slopes resulting in a base width
some 3.5m greater than planned!
Despite being aware of the purpose of the IMPACT project tests, SWECO and Norconsult did not
emphasise any significant differences in design and as built data during the IMPACT project, hence
this was not recognised as a potential issue affecting data quality. To the contrary, all reports and
publications arising from the work in Norway continued to present the ‘design condition data’ as the
data for research use, including the material provided for the end of project reports.
In the absence of any data to the contrary our recommendation can only be to now use the as built data
provided in the SP3 report for the dam geometry of this test case.
Table 1: Test 1-02 dam geometry
Dam Geometry: SP3 IMPACT WP2 Recommended Values
Dam Height (m) 5.9 6 5.9
Upstream shoulder slope 1:2.4 1:2.0 1:2.4
Downstream shoulder slope 1:2.25 1:2.0 1:2.25
Initial breach depth (m) 0.4-0.5 0.5 0.4-0.5
Initial bottom breach width (m) 5.5 5.4 5.5
Initial top breach width (m) 7.8 8 7.8
FLOODsite Project Report
Contract No:GOCE-CT-2004-505420
T04_08_04_IMPACT_Data_Analysis_v3_3.doc 2nd February 2009 4
2.1.2 Soil properties:
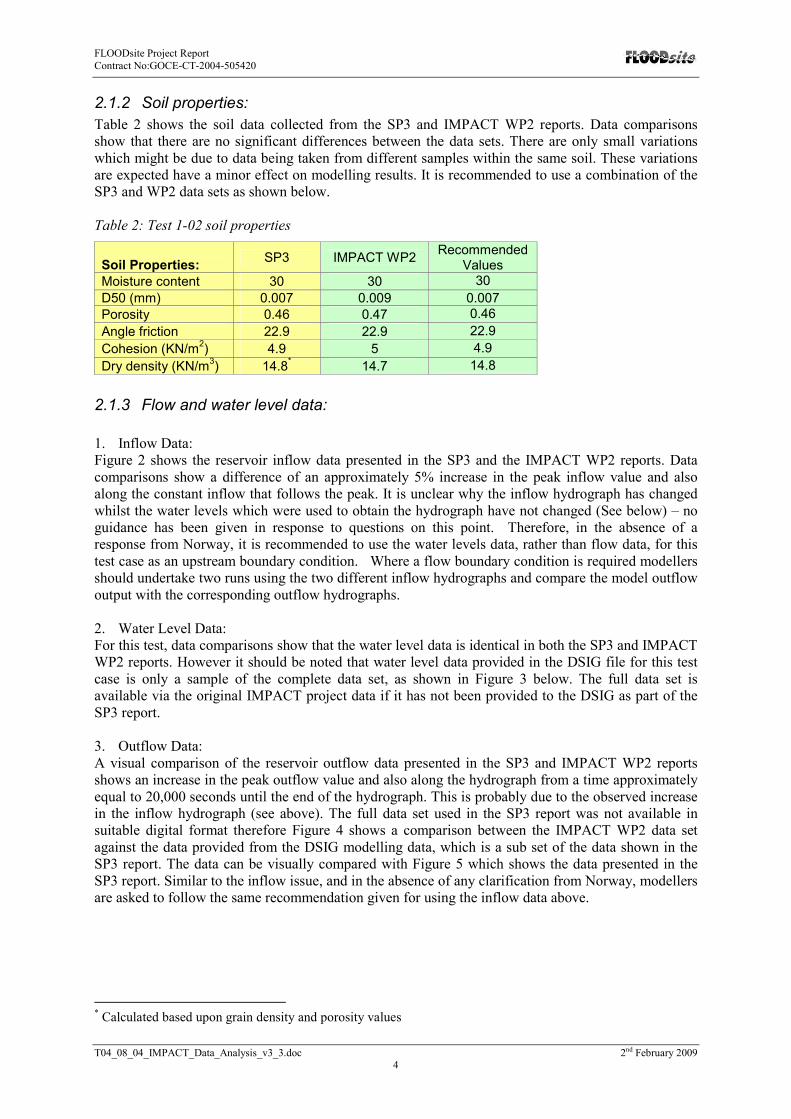
Table 2 shows the soil data collected from the SP3 and IMPACT WP2 reports. Data comparisons
show that there are no significant differences between the data sets. There are only small variations
which might be due to data being taken from different samples within the same soil. These variations
are expected have a minor effect on modelling results. It is recommended to use a combination of the
SP3 and WP2 data sets as shown below.
Table 2: Test 1-02 soil properties
Soil Properties: SP3 IMPACT WP2
Recommended Values
Moisture content 30 30 30
D50 (mm) 0.007 0.009 0.007
Porosity 0.46 0.47 0.46
Angle friction 22.9 22.9 22.9
Cohesion (KN/m2) 4.9 5 4.9
Dry density (KN/m3) 14.8
* 14.7 14.8
2.1.3 Flow and water level data:
1. Inflow Data:
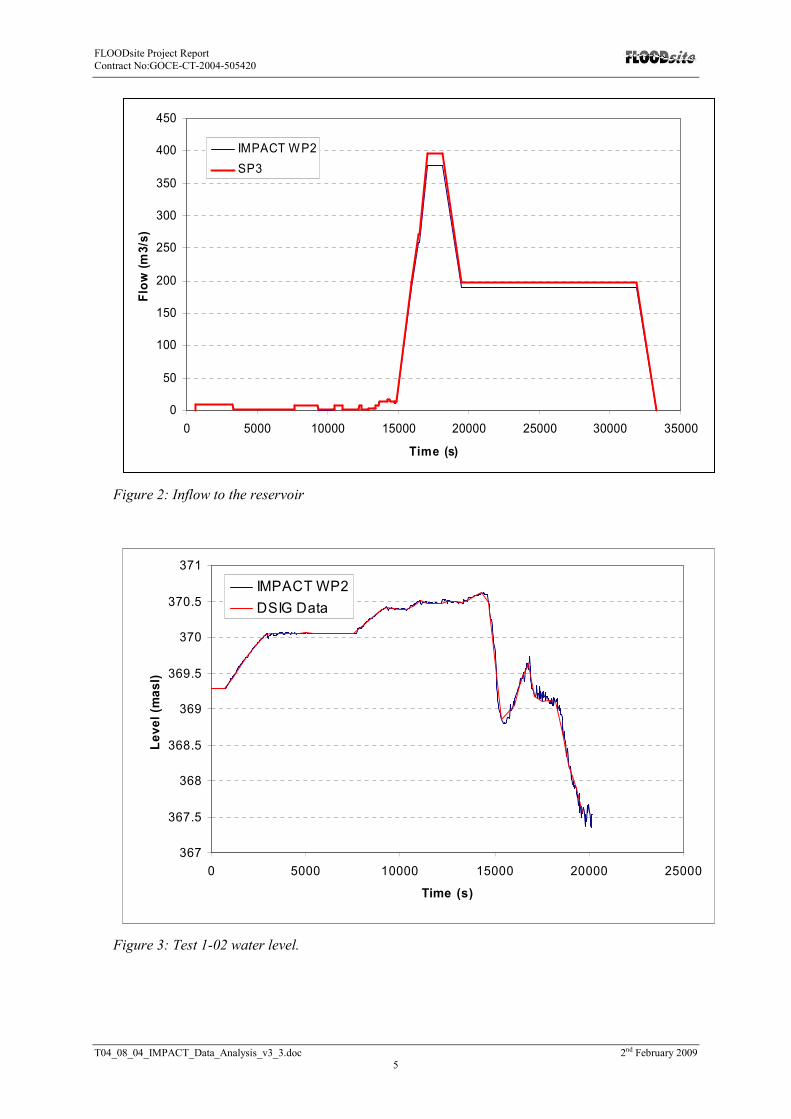
Figure 2 shows the reservoir inflow data presented in the SP3 and the IMPACT WP2 reports. Data
comparisons show a difference of an approximately 5% increase in the peak inflow value and also
along the constant inflow that follows the peak. It is unclear why the inflow hydrograph has changed
whilst the water levels which were used to obtain the hydrograph have not changed (See below) – no
guidance has been given in response to questions on this point. Therefore, in the absence of a
response from Norway, it is recommended to use the water levels data, rather than flow data, for this
test case as an upstream boundary condition. Where a flow boundary condition is required modellers
should undertake two runs using the two different inflow hydrographs and compare the model outflow
output with the corresponding outflow hydrographs.
2. Water Level Data:
For this test, data comparisons show that the water level data is identical in both the SP3 and IMPACT
WP2 reports. However it should be noted that water level data provided in the DSIG file for this test
case is only a sample of the complete data set, as shown in Figure 3 below. The full data set is
available via the original IMPACT project data if it has not been provided to the DSIG as part of the
SP3 report.
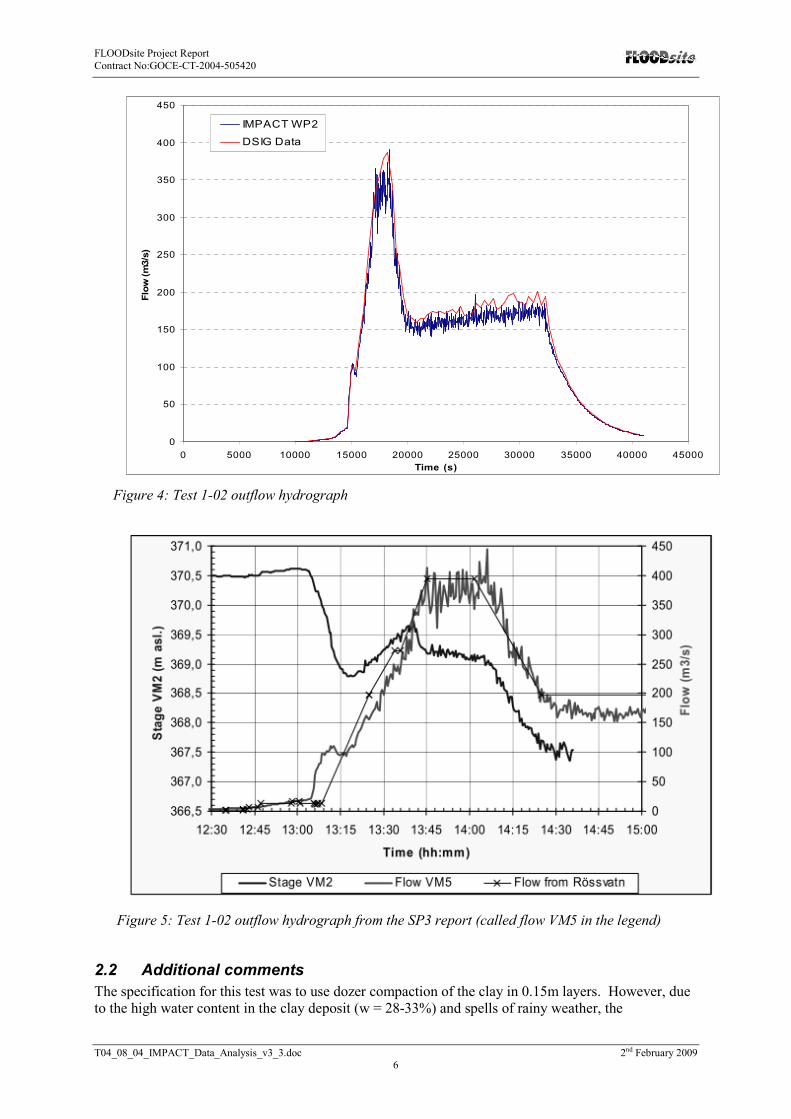
3. Outflow Data:
A visual comparison of the reservoir outflow data presented in the SP3 and IMPACT WP2 reports
shows an increase in the peak outflow value and also along the hydrograph from a time approximately
equal to 20,000 seconds until the end of the hydrograph. This is probably due to the observed increase
in the inflow hydrograph (see above). The full data set used in the SP3 report was not available in
suitable digital format therefore Figure 4 shows a comparison between the IMPACT WP2 data set
against the data provided from the DSIG modelling data, which is a sub set of the data shown in the
SP3 report. The data can be visually compared with Figure 5 which shows the data presented in the
SP3 report. Similar to the inflow issue, and in the absence of any clarification from Norway, modellers
are asked to follow the same recommendation given for using the inflow data above.
* Calculated based upon grain density and porosity values
FLOODsite Project Report
Contract No:GOCE-CT-2004-505420
T04_08_04_IMPACT_Data_Analysis_v3_3.doc 2nd February 2009 5
0
50
100
150
200
250
300
350
400
450
0 5000 10000 15000 20000 25000 30000 35000
Time (s)
Flo
w (m
3/s
)IMPACT WP2
SP3
Figure 2: Inflow to the reservoir
367
367.5
368
368.5
369
369.5
370
370.5
371
0 5000 10000 15000 20000 25000
Time (s)
Level (m
asl)
IMPACT WP2
DSIG Data
Figure 3: Test 1-02 water level.
FLOODsite Project Report
Contract No:GOCE-CT-2004-505420
T04_08_04_IMPACT_Data_Analysis_v3_3.doc 2nd February 2009 6
0
50
100
150
200
250
300
350
400
450
0 5000 10000 15000 20000 25000 30000 35000 40000 45000
Time (s)
Flo
w (m
3/s
)
IMPACT WP2
DSIG Data
Figure 4: Test 1-02 outflow hydrograph
Figure 5: Test 1-02 outflow hydrograph from the SP3 report (called flow VM5 in the legend)
2.2 Additional comments
The specification for this test was to use dozer compaction of the clay in 0.15m layers. However, due
to the high water content in the clay deposit (w = 28-33%) and spells of rainy weather, the
FLOODsite Project Report
Contract No:GOCE-CT-2004-505420
T04_08_04_IMPACT_Data_Analysis_v3_3.doc 2nd February 2009 7
construction of this dam became difficult. At a height 1.5-2 m (and maybe even as high as 3 m) above
foundation the compaction layer thickness was increased to 0.4 m to improve construction speed and
the compaction pressure of about 50 kN/m2 was reduced by replacing the 30-ton backhoe by a 17-ton
backhoe with wider belts.
The effect of this for breach modelling is that the embankment is likely to comprise of broadly two
layers of clay, compacted to different conditions and hence with different erodibility. The magnitude
of this effect on breach growth is not immediately clear.
FLOODsite Project Report
Contract No:GOCE-CT-2004-505420
T04_08_04_IMPACT_Data_Analysis_v3_3.doc 2nd February 2009 8
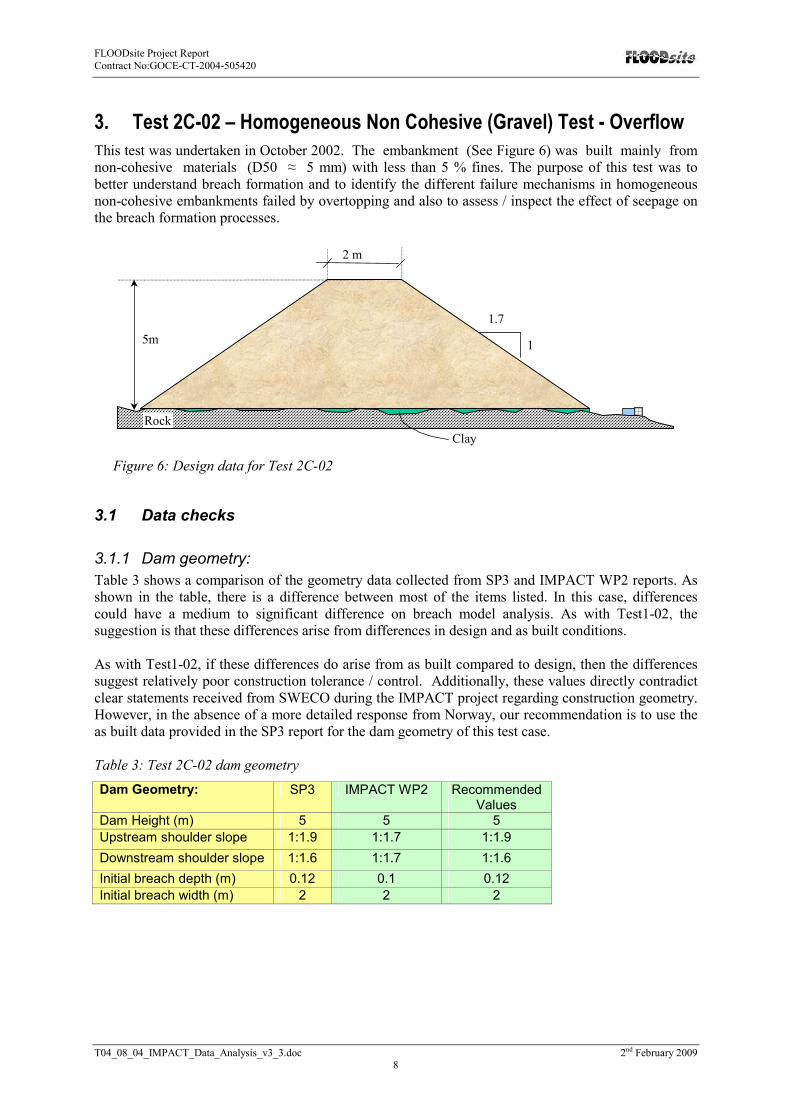
3. Test 2C-02 – Homogeneous Non Cohesive (Gravel) Test - Overflow
This test was undertaken in October 2002. The embankment (See Figure 6) was built mainly from
non-cohesive materials (D50 ≈ 5 mm) with less than 5 % fines. The purpose of this test was to
better understand breach formation and to identify the different failure mechanisms in homogeneous
non-cohesive embankments failed by overtopping and also to assess / inspect the effect of seepage on
the breach formation processes.
2 m
1.7
15m
Clay
Rock
Figure 6: Design data for Test 2C-02
3.1 Data checks
3.1.1 Dam geometry:
Table 3 shows a comparison of the geometry data collected from SP3 and IMPACT WP2 reports. As
shown in the table, there is a difference between most of the items listed. In this case, differences
could have a medium to significant difference on breach model analysis. As with Test1-02, the
suggestion is that these differences arise from differences in design and as built conditions.
As with Test1-02, if these differences do arise from as built compared to design, then the differences
suggest relatively poor construction tolerance / control. Additionally, these values directly contradict
clear statements received from SWECO during the IMPACT project regarding construction geometry.
However, in the absence of a more detailed response from Norway, our recommendation is to use the
as built data provided in the SP3 report for the dam geometry of this test case.
Table 3: Test 2C-02 dam geometry
Dam Geometry: SP3 IMPACT WP2 Recommended Values
Dam Height (m) 5 5 5
Upstream shoulder slope 1:1.9 1:1.7 1:1.9
Downstream shoulder slope 1:1.6 1:1.7 1:1.6
Initial breach depth (m) 0.12 0.1 0.12
Initial breach width (m) 2 2 2

FLOODsite Project Report
Contract No:GOCE-CT-2004-505420
T04_08_04_IMPACT_Data_Analysis_v3_3.doc 2nd February 2009 9
3.1.2 Soil properties:
Table 4 shows the soil data collected from SP3 and IMPACT WP2 reports. Data comparisons show
that there is no significant difference between the data sets except for the values of the angle of friction
and dry density which can have a significant effect on modelling results.
Table 4: Test 2C-02 soil properties
Soil Properties: SP3 IMPACT WP2 Recommended
Values
Moisture content 7 7 7
D50 (mm) 4.75 4.65 4.75
Porosity 0.22 0.22 0.22
Angle friction - 42 42
Cohesion (KN/m2) 0 0.9 0.9
Dry density (KN/m3) 21.2
* 21.2 21.2
Specific data of the angle of friction and dry density for this test was sent to HR Wallingford by
SWECO during the IMPACT project. For all the other soil properties, there are only small variations
which might arise from data being taken from different soil samples. These variations are expected
have a minor effect on modelling results. It is recommended to use a combination of the SP3 and WP2
data sets as shown in Table 4 above.
3.1.3 Flow and water level data:
1. Inflow Data:
Data comparisons show that the inflow data is identical in both the SP3 and IMPACT WP2 reports.
2. Water level Data:
Data comparisons show that water levels data is identical in both the SP3 and IMPACT WP2 reports.
3. Outflow Data:
Data comparisons show a significant difference between the data reported in the SP3 and IMPACT
WP2 reports (See Figure 7). SP3 shows data calculated using HECRAS. This suggests a recalculation
of breach flow in some form. It is stated in the SP3 report that errors were found in the volume balance
calculation for this test case which is probably due to ice build up at the location of the flow
measurement downstream of the dam. However, email records show that corrections to data were
made during the IMPACT project and that modified data was correct at that time. .
Recent volume calculations undertaken by HR Wallingford show that neither of the hydrographs
shown in Figure 7 satisfy the volume balance equation. Based upon the hydrographs shown in Figure
7, the volume of water under the SP3 and WP2 hydrographs is 23,478 and 81,227 m3 respectively
starting from time T=0 to T=2690 seconds. The inflow volume for this period of time is approximately
1,100 m3. The reservoir water level at T=0 was 369.808 (m.a.s.l.) which translates to a volume equals
31,920 m3. Based upon the information presented in the SP3 report, the reservoir was empty at the end
of the test. Using the above figures for both data sets does not satisfy the following volume balance
equation:
Inflow Volume + Initial Reservoir Volume – Outflow Volume – Final Reservoir Volume = 0
For the SP3 Report:
1100 + 31920 – 23478 – 0 = 9542 m3
* Calculated based upon grain density and porosity values
FLOODsite Project Report
Contract No:GOCE-CT-2004-505420
T04_08_04_IMPACT_Data_Analysis_v3_3.doc 2nd February 2009 10
For the WP2 data
1100 + 31920 – 81227 - 0 = -48207 m3
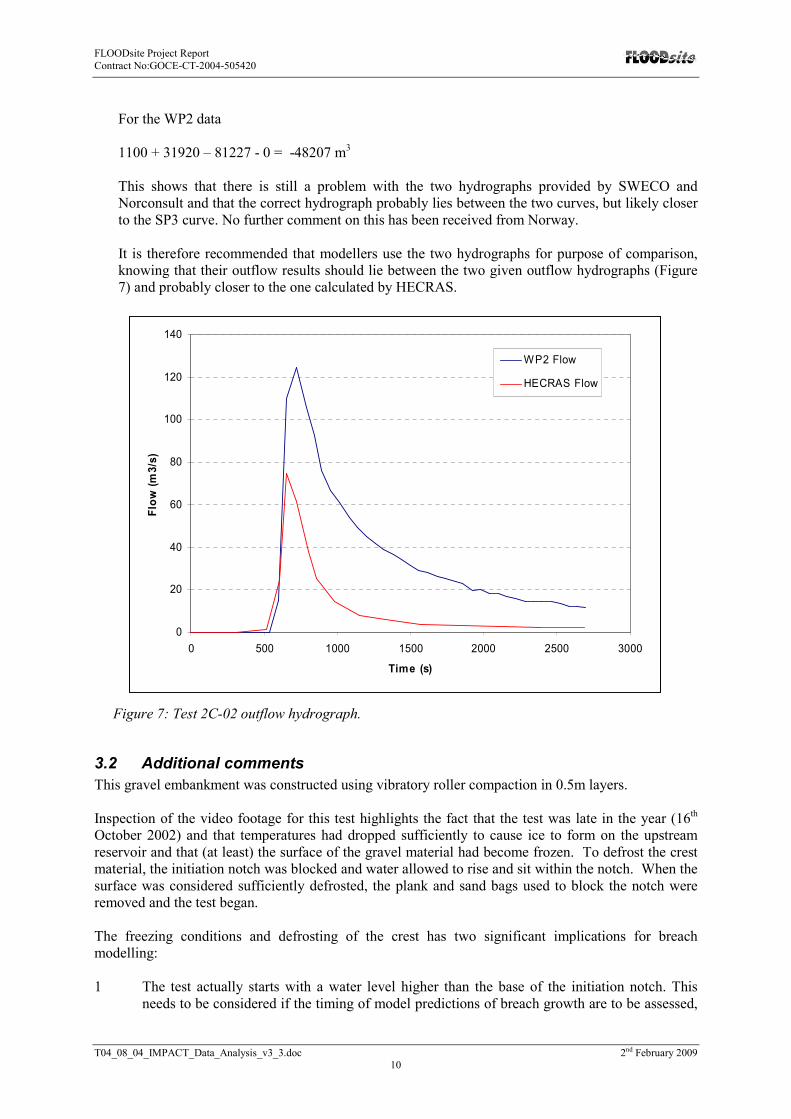
This shows that there is still a problem with the two hydrographs provided by SWECO and
Norconsult and that the correct hydrograph probably lies between the two curves, but likely closer
to the SP3 curve. No further comment on this has been received from Norway.
It is therefore recommended that modellers use the two hydrographs for purpose of comparison,
knowing that their outflow results should lie between the two given outflow hydrographs (Figure
7) and probably closer to the one calculated by HECRAS.
0
20
40
60
80
100
120
140
0 500 1000 1500 2000 2500 3000
Time (s)
Flo
w (m
3/s
)
WP2 Flow
HECRAS Flow
Figure 7: Test 2C-02 outflow hydrograph.
3.2 Additional comments
This gravel embankment was constructed using vibratory roller compaction in 0.5m layers.
Inspection of the video footage for this test highlights the fact that the test was late in the year (16th
October 2002) and that temperatures had dropped sufficiently to cause ice to form on the upstream
reservoir and that (at least) the surface of the gravel material had become frozen. To defrost the crest
material, the initiation notch was blocked and water allowed to rise and sit within the notch. When the
surface was considered sufficiently defrosted, the plank and sand bags used to block the notch were
removed and the test began.
The freezing conditions and defrosting of the crest has two significant implications for breach
modelling:
1 The test actually starts with a water level higher than the base of the initiation notch. This
needs to be considered if the timing of model predictions of breach growth are to be assessed,
FLOODsite Project Report
Contract No:GOCE-CT-2004-505420
T04_08_04_IMPACT_Data_Analysis_v3_3.doc 2nd February 2009 11
since modelling this breach and ignoring this effect will invariably result in models predicting
breach earlier than was observed.
2 The subsequent growth of the breach through the embankment may have be affected by frozen
material. The breach growth demonstrates strict headcut growth with rigidly vertical sides and
migrating erosion face that remains vertical until it cuts back through the upstream face of the
embankment. This behaviour is not normally expected of a non cohesive gravel material and
may reflect significant ice formation within the embankment.

FLOODsite Project Report
Contract No:GOCE-CT-2004-505420
T04_08_04_IMPACT_Data_Analysis_v3_3.doc 2nd February 2009 12
4. Test 1-03 – Composite Structure (Gravel with Moraine Core) - Overflow
This test was undertaken in August 2003. The upstream and downstream shoulders were built from
rock fill with a central moraine core. The purpose of this test was to better understand breach
formation and to identify the different failure mechanisms in composite embankments failed by
overtopping.
Figure 8: Design data for Test 1-03
4.1 Data checks
4.1.1 Dam geometry:
Table 5 shows the geometry data collected from the SP3 and the IMPACT WP2 reports. As shown in
the, table there is a difference between all the items listed. Some differences would have a small effect
on breach modelling, whilst others could have a medium to significant difference. . As with the
previous tests it has been suggested by SWECO that these differences originated from the difference
between the design and as built data. .
Again, as with previous test data, there are inconsistencies between email correspondence from the
IMPACT project and the current suggestion as to the cause of differences. In particular,
correspondence relating to the size of the initiation notch is quite clear and contradictory.
Our recommendation is to use the as built data provided in the SP3 report for the dam geometry of this
test case except for the notch dimensions where as built data sent to HR Wallingford should be used.
Table 5: Test 1-03 dam geometry
Dam Geometry: SP3 IMPACT WP2 Recommended Values
Dam Height (m) 5.9 6 5.9
Upstream shoulder slope 1:1.55 1:1.5 1:1.55
Downstream shoulder slope 1:1.45 1:1.5 1:1.55
Core slopes 4:1 5:1 4:1
Initial breach depth (m) 0.24 0.2 0.24
Initial bottom breach width (m) 6.5 8 6.1
Initial top breach width (m) 6.5 8 7.8

FLOODsite Project Report
Contract No:GOCE-CT-2004-505420
T04_08_04_IMPACT_Data_Analysis_v3_3.doc 2nd February 2009 13
4.1.2 Soil properties:
Table 6 shows the soil data collected from SP3 and IMPACT WP2 reports. Data comparisons show
that there are some differences between the data sets for both the moraine and the rock fill materials.
The following explanation was received from Norway:
1. The same grading data was reported in the SP3 and the IMPACT WP2 reports for both the
moraine and rock fill.
2. The angle of friction was never measured for rock fill.
3. For other differences, several samples were taken with different moisture content, sieve curves and
dry density.
Data checks show that:
1. Point No.1 above is correct. The same curves are used in the SP3 and the IMPACT WP2 reports.
However, by using that curve (See Figure 9) it can be concluded that the D50 is between 6 and 7
mm and a value equals 7 mm was used. (It is hard to see how using this curve provides a D50 equal
to 5.5 mm).
2. Point No. 2 contradicts information emailed to HR Wallingford during the IMPACT project in
which laboratory data is given for the moraine and rockfill material for all the tests undertaken in
2003.
3. Point No 3 may be true but was not previously advised.
Table 6: Test 1-03 soil properties
Moraine SP3 IMPACT WP2
Recommended Values
D50 (mm) 5.5 7 7
Moisture content
0.06 0.06 0.06
Angle of friction
45.6 42 45.6
Cohesion (KN/m
2)
- 20 20
Porosity 0.244 0.21 0.244
Dry density (KN/m
3)
20.6* 20.5 20.6
Rockfill
D50 (mm) 85 85 85
Moisture content
0.02 - 0.02
Angle of friction
- 42 42
Porosity 0.235 0.163 0.235
* Calculated based upon grain density and porosity values

FLOODsite Project Report
Contract No:GOCE-CT-2004-505420
T04_08_04_IMPACT_Data_Analysis_v3_3.doc 2nd February 2009 14
Figure 9: Grading curves for moraine and rock fill used in test 1-03
Table 7: Data provided (by SWECO) during IMPACT for tests undertaken in 2003.
Moraine units 1-2003 2-2003 3-2003
Dry density ton/m3 2.09 2.09 2.09
Moisture content
% 5.99 6 6
Friction angel
tg Fi 0.9 0.9 0.9
Cohesion 20 20 20
Permeability
From test m/s 7,7*10-6
7,7*10-6
7,7*10-6
From sieve curve
m/s 2,5 -4,85*10
-6 2,5 -4,85*10
-
6 2,5 -4,85*10
-
6
Rock fill
Downstream Density bulk ton/m3 2.173 2.173
Density dry ton/m3 2.12 2.12
Density grain
ton/m3 2.53 2.53
Porosity n 0.163 0.163
Cohesion 0 0
Friction angel
tg Fi 0.9 0.9
Upstream Porosity n 0.4 0.4
Density dry ton/m3 1.67 1.67
Density grain
ton/m3 2.776 2.776
Cohesion 0 0
Friction angel
tg Fi 0.9 0.9

FLOODsite Project Report
Contract No:GOCE-CT-2004-505420
T04_08_04_IMPACT_Data_Analysis_v3_3.doc 2nd February 2009 15
It can be noted from the above table that the angle of friction and porosity for rockfill and the
cohesion for moraine were provided. It should be also noted that moraine porosity was calculated
by HR Wallingford using the moraine dry density data provided above and assuming a grain
density of 2.65. This might explain the difference in the moraine porosity.
4.1.3 Flow and water level data:
1. Inflow Data:
Data comparisons show that the inflow data is identical in both the SP3 and IMPACT WP2
reports.
2. Water Level Data:
Data comparisons show that water levels data is identical in both the SP3 and IMPACT WP2
reports.
3. Outflow Data:
Data comparisons show that the outflow data is identical in both the SP3 and IMPACT WP2
reports.
4.2 Additional comments
Undertaken in August 2003, this embankment comprised a moraine core that was vibratory roller
compacted in 0.5m layers, with well graded rock fill from tunnel spoil 0-500mm, vibratory roller
compacted in 1m layer thicknesses and uniform rock fill 300-400mm, also vibratory roller compacted
in 1m layer thicknesses.
Viewing video footage of the breach formation raises some further concerns regarding the geometry of
the layer construction. Depth of rock fill on the moraine core should be in the order of 700mm
however eroded faces suggest this may have been significantly less, in some areas the rockfill acting
more as a surface layer covering than a substantial zone within the embankment body.

FLOODsite Project Report
Contract No:GOCE-CT-2004-505420
T04_08_04_IMPACT_Data_Analysis_v3_3.doc 2nd February 2009 16
5. Test 2-03 – Composite Structure (Gravel with Moraine Core) - Piping
This test was undertaken in September 2003. The upstream and downstream shoulders were built from rock fill with a central moraine core (Figure 10). The purpose of this test was to better understand breach formation processes and to identify the different failure mechanisms that occur in composite embankments failing through piping. Two triggering options were used in this test case. Option #1 was a pipe that was perforated along certain lengths and built with a valve at the downstream end to control initial flow. The pipe was filled and surrounded by sand, providing an easy erosion route through the dam. Option #2 was similar to Option #1, but with the surrounding sand fill extended from the bottom of the dam to the top. Option #1 did not appear to work during initial testing so failure was initiated using Option #2 instead.
Figure 10: Design data for Test 2-03
5.1 Data checks
5.1.1 Dam geometry:
Table 5 shows the geometry data collected from the SP3 and the IMPACT WP2 reports. As shown in
the table there is no significant differences between all of the items listed.
Table 8: Test 2-03 dam geometry
Dam Geometry: SP3 IMPACT WP2 Recommended Values
Dam Height (m) 6 6 6
Upstream shoulder slope 1:1.56 1:1.5 1:56
Downstream shoulder slope 1:1.48 1:1.5 1.48
Core slopes 4:1 4:1 4:1
Initial pipe diameter (m) --- 0.215 0.215
Initial piping level (mOAD) --- 365.1 365.1
Our recommendation is to use the data provided in Table 5 for the dam geometry of this test case.
6m
6m
Option #1
3m
Clay
Rock
Rock fill 300-500 mm
Moraine Rock fill 0-500 mm
Option #2

FLOODsite Project Report
Contract No:GOCE-CT-2004-505420
T04_08_04_IMPACT_Data_Analysis_v3_3.doc 2nd February 2009 17
5.1.2 Soil properties:
Discussion in Section 0 for Test 1-03 also applies to this test case. Recommended values for use in the
modelling for this test are as given in Table 6 .
5.1.3 Flow and water level data:
1. Inflow Data:
Data comparisons show that the inflow data is identical in both the SP3 and IMPACT WP2 reports.
2. Water Level Data:
Data comparisons show that water levels data is identical in both the SP3 and IMPACT WP2 reports
but data in the SP3 report extends beyond that of the WP2 report.
3. Outflow Data:
Data comparisons show that the outflow data is identical in both the SP3 and IMPACT WP2 reports.
5.2 Additional comments
Undertaken in September 2003, this embankment comprised a moraine core that was vibratory roller
compacted in 0.5m layers, with well graded rock fill from tunnel spoil 0-500mm, vibratory roller
compacted in 1m layer thicknesses and uniform rock fill 300-400mm, also vibratory roller compacted
in 1m layer thicknesses (i.e. same construction method and materials as Test 1-03).
It was unfortunate that the first of the large scale piping tests were undertaken on a composite
structure, since the outer layers of rock fill material made it very difficult to determine what action, if
any, was occurring through the core material. The following test (Test3-03) was through a single
homogeneous embankment. Initiation using Option#1 was allowed to run for many hours, but was
perceived to have failed, in that no significant change in flow or erosion was observed. Consequently,
failure was initiated using Option#2, which did successfully lead to failure of the embankment. Upon
investigation (excavation), it was found that the Option#1 triggering mechanism had in fact worked
and that failure would have ensued if the test had been allowed to run for longer. Flow through the
pipe in Option#1 had led to erosion, but material within the embankment body had progressively
collapsed into the eroding flow and the seepage path had migrated up through the embankment. When
the test was stopped, the erosion had migrated close to the crest, and would eventually have resulted in
collapse of material near the crest and then overflowing breach generation.
FLOODsite Project Report
Contract No:GOCE-CT-2004-505420
T04_08_04_IMPACT_Data_Analysis_v3_3.doc 2nd February 2009 18
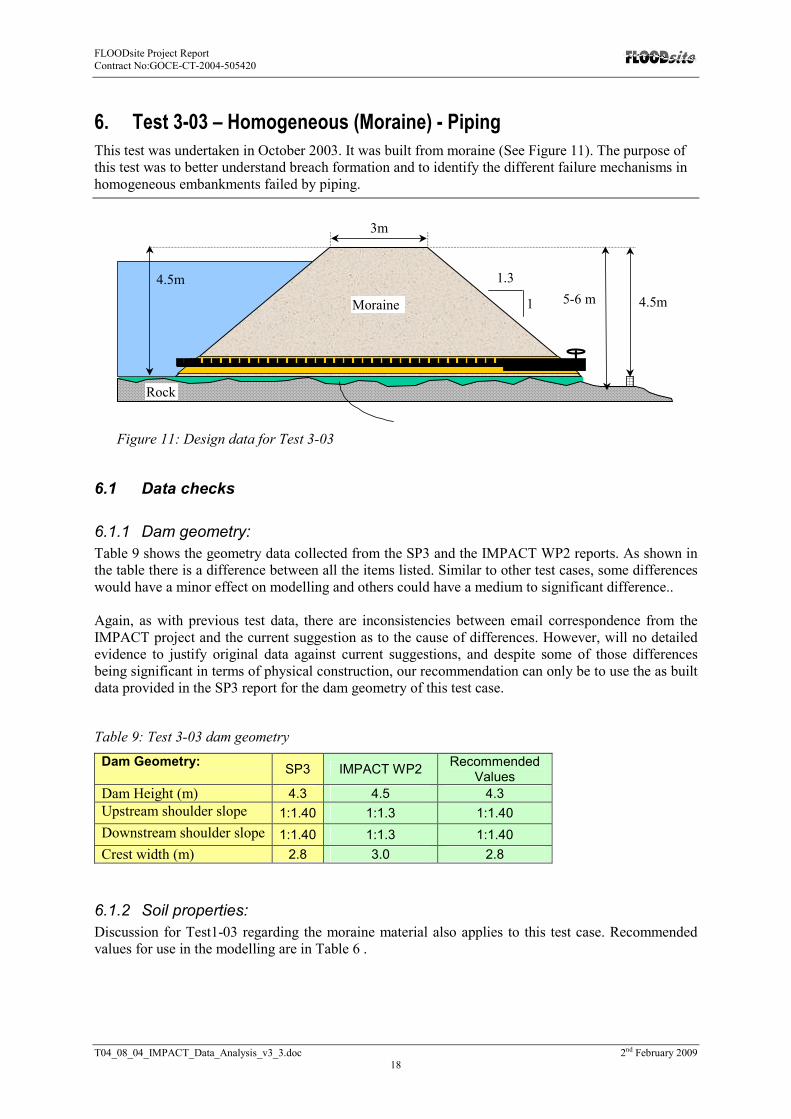
6. Test 3-03 – Homogeneous (Moraine) - Piping
This test was undertaken in October 2003. It was built from moraine (See Figure 11). The purpose of
this test was to better understand breach formation and to identify the different failure mechanisms in
homogeneous embankments failed by piping.
4.5m
1
1.3
3m
Rock
4.5m5-6 mMoraine
Figure 11: Design data for Test 3-03
6.1 Data checks
6.1.1 Dam geometry:
Table 9 shows the geometry data collected from the SP3 and the IMPACT WP2 reports. As shown in
the table there is a difference between all the items listed. Similar to other test cases, some differences
would have a minor effect on modelling and others could have a medium to significant difference..
Again, as with previous test data, there are inconsistencies between email correspondence from the
IMPACT project and the current suggestion as to the cause of differences. However, will no detailed
evidence to justify original data against current suggestions, and despite some of those differences
being significant in terms of physical construction, our recommendation can only be to use the as built
data provided in the SP3 report for the dam geometry of this test case.
Table 9: Test 3-03 dam geometry
Dam Geometry: SP3 IMPACT WP2
Recommended Values
Dam Height (m) 4.3 4.5 4.3
Upstream shoulder slope 1:1.40 1:1.3 1:1.40
Downstream shoulder slope 1:1.40 1:1.3 1:1.40
Crest width (m) 2.8 3.0 2.8
6.1.2 Soil properties:
Discussion for Test1-03 regarding the moraine material also applies to this test case. Recommended
values for use in the modelling are in Table 6 .
FLOODsite Project Report
Contract No:GOCE-CT-2004-505420
T04_08_04_IMPACT_Data_Analysis_v3_3.doc 2nd February 2009 19
6.1.3 Flow and water level data:
1. Inflow Data:
The SP3 data was not available in suitable digital format to allow direct comparisons with the
IMPACT WP2 data. However, visual data comparisons did not reveal any obvious differences either
in value or timing between the data sets of both reports.
2. Water Level Data:
The SP3 data was not available in suitable digital format to allow direct comparisons with the
IMPACT WP2 data. However, visual data comparisons did not reveal any obvious differences either
in value or timing between the data sets of both reports.
3. Outflow Data:
The SP3 data was not available in suitable digital format to allow direct comparisons with the
IMPACT WP2 data. However, visual data comparisons did not reveal any obvious differences either
in value or timing between the data sets of both reports.
6.2 Additional comments
Construction of this embankment from moraine material was undertaken using vibratory plate
compaction in 0.5m layer thicknesses.
FLOODsite Project Report
Contract No:GOCE-CT-2004-505420
T04_08_04_IMPACT_Data_Analysis_v3_3.doc 2nd February 2009 20
7. Conclusions
A thorough review of the quality and validity of the IMPACT Project breach field data has been
undertaken following the identification of inconsistencies between data provided recently to the Dam
Safety Interest Group (DSIG) breach modelling project (originating from Norway), as compared to
original project data sets held by HR Wallingford.
The differences between data sets are significant, and particularly relevant to researchers using the
data for the development and validation of predictive breach models. The extent of impact of these
differences upon breach research work carried out during the IMPACT project has not been assessed
here; the aim of this review was to indentify errors and establish a best estimate of ‘correct’ data set
for each of the field tests that can be used in the DSIG and subsequent breach modelling programmes.
A range of differences in data were noted. Discussions were held between HR Wallingford, DSIG,
SWECO, and Norconsult by email and personal communication to try and identify the cause of these
differences and hence agree on definitive data sets. The response from the Norwegian partners in this
exercise was disappointing; in some areas it has not been possible to demonstrate the scientific basis
for using revised values.
The investigation concluded that:
• There are significant differences between the IMPACT data now being used, as compared to
the data used during breach model testing under the IMPACT project. The extent to which
this affects research conclusions from the IMPACT project is unclear. Researchers using data
originating from the IMPACT project itself should refer to this report and associated data sets
to ensure they are using correct data
• It appears that much of the data provided from Norway during the IMPACT project (i.e. the
field test data) related to proposed rather than as built test conditions. Significant differences
between proposed and as built conditions which were not reported at the time have now been
identified. However, whilst these explain a significant number of the data differences, they do
not explain all differences, including some of the major differences.
• Some flow data has been recalculated. This includes reservoir releases providing inflow to the
test site as well as measured breach flow
• Some revised calculations provided from Norway still appear to be incorrect, hence some
questions still remain as to actual data values
These findings are disappointing, both for the IMPACT partners who were assured of data quality at
the time of the original research and more recently for a growing number of researchers around the
world who have been using data from the original project reports. Whilst the original data was not
formally released pending final analyses at the end of the project, it is clear that data has been shared
and a number of researchers have published work using the original data. It is recommended that
these researchers review their analyses in light of the findings reported here.

FLOODsite Project Report
Contract No:GOCE-CT-2004-505420
T04_08_04_IMPACT_Data_Analysis_v3_3.doc 2nd February 2009 21
8. References
1. Lovell, A (2004). Breach formation in embankment dams. Results from Norwegian field tests.
International Seminar: Stability and Breaching of Embankment Dams, Oslo, Norway 21-22
October 2004.
2. Lovell, A, Vaskinn, K.A. and Valstad, T (2003). Stability and breaching of dams. Data report
number 4. Large scale field tests 2002. European IMPACT Project. European Commission,
FP5 Research Programme. Contract No. EVG1-CT-2001-00037. (www.impact-project.net)
3. Lovell, A. and Vaskinn, K.A. (2004). Stability and breaching of dams. Data report number 5.
Large scale field tests 2003. European IMPACT Project. European Commission, FP5
Research Programme. Contract No. EVG1-CT-2001-00037. (www.impact-project.net)
4. Morris, M.W. and Hassan, M.A.A.M., (2005), IMPACT: Breach Formation Technical Report
(WP2). European Commission, FP5 Research Programme. Contract No. EVG1-CT-2001-
00037. (www.impact-project.net)
5. Norwegian Electricity Industry Association (EBL-K) (2006). Stability and breaching of
embankment dams. Report on Sub-project 3 (SP3): Breaching of Embankment Dams. EBL
Publication XXX-2006