IMPACT OF THE UW SYSTEM ON THE WISCONSIN … · his help in pulling together the framework...
24
THE $24 BILLION IMPACT OF THE UW SYSTEM ON THE WISCONSIN ECONOMY 2018 Economic Impact Study prepared by NorthStar Analytics
Transcript of IMPACT OF THE UW SYSTEM ON THE WISCONSIN … · his help in pulling together the framework...

THE $24 BILLION IMPACT OF THE UW SYSTEM ON THE WISCONSIN ECONOMY
2018 Economic Impact Studyprepared by
NorthStar Analytics


1
ACKNOWLEDGMENTS
NorthStar Analytics would like to thank the University of Wisconsin System for assistance in completing this comprehensive economic impact study. The support we received from university personnel was outstanding throughout the project.
Special thanks to UW System President Ray Cross and Associate Vice President for Economic Development David Brukardt for their support, encouragement, and guidance.
Also, thanks to UW System intern Jack McGovern for his help in pulling together the framework approach; Senior Associate Vice President for Finance Julie Gordon and her staff for gathering the financial data; Director for Policy Analysis and Research Sue Buth for providing the UW System enrollment data; and Interim Director of Communications Heather LaRoi, graphic designer Karin Wrzesinski, and editors Jennifer Moore and Ethan Schuh for their work on proofreading and layout.
Finally, thanks to Dr. Russ Kashian, Director of UW-Whitewater’s Fiscal and Economic Research Center, for his quality work and project advice.
Northstar Analytics Dr. David J. Ward Dr. Bruce Siebold
UW-Washington County
UW-EAU CLAIREUW-GREEN BAY
UW-MADISON
UW-MILWAUKEE
UW-OSHKOSH
UW-PLATTEVILLE
UW-STEVENS POINT
UW-WHITEWATER
UW-Baraboo/Sauk County
UW-Barron County
UW-Fond du Lac
UW-Fox Valley
UW-Manitowoc
UW-Marathon County
UW-Marinette
UW-Richland
UW-Rock County
UW-Sheboygan
UW-Waukesha
UW-LA CROSSE
UW-PARKSIDE
UW-RIVER FALLS
UW-STOUT
UW-SUPERIOR
UNIVERSITY OF WISCONSIN SYSTEM
wisconsin.edu
2
TABLE OF CONTENTSExecutive Summary ..................................................................................................................................................................................3
UW System Economic Impact at a Glance .............................................................................................................................................4
Introduction ...............................................................................................................................................................................................5
Overall Economic Impact of UW System on the Wisconsin Economy ................................................................................................6
UW System Impact on Jobs in Wisconsin ...............................................................................................................................................8
UW System Impact on State and Local Taxes .....................................................................................................................................10
Who Benefits from UW System Economic Activity? ............................................................................................................................11
Leveraging State Investment in the UW System .................................................................................................................................12
UW System Economic Impact: Beyond the Traditional Numbers.....................................................................................................13
Methodology for this Study ...................................................................................................................................................................18
Conclusion and Context .........................................................................................................................................................................20

3
The University of Wisconsin System plays a significant role in Wisconsin’s economy. This 2018 economic impact study identifies the following annual impact areas, based on 2016-17 fiscal year data:
■■ Total economic impact on the Wisconsin economy: $24 billion■■ Number of jobs generated and supported: 167,000■■ Local and state taxes generated: $1.1 billion■■ Percentage of private-sector benefit: 75%, or $18 billion — Overall, private sector companies receive 75% of the economic benefit that comes
from UW System activity. This amounts to $18 billion annually.
This study updates the 2002 economic impact study completed by NorthStar Economics and indicates the University of Wisconsin System’s impact has more than doubled in that timeframe. The largest contributors to the UW System’s economic impact are the UW System campuses, followed by UW Hospitals, UW startups, UW student spending, UW visitor spending, UW Research Park, and UW affiliated organizations.
The study shows a 23:1 return on investment for every dollar invested by the State of Wisconsin. These dollars spent in local and regional areas generate jobs and taxes as they cycle through the local economies across the entire state.
EXECUTIVE SUMMARY

4
5
This 2018 UW System Economic Impact Study updates a 2002 economic impact study for the UW System done by NorthStar Economics of Madison, Wis. The 2002 study reported an economic impact of $9.5 billion on the Wisconsin economy. It also estimated that UW System economic activity supported or created 150,000 jobs and generated $408 million in local and state tax revenue.
Since that study, the UW System has grown in enrollment, research activity, economic development engagement, and educational programs and outreach. The breadth of UW System activity is striking. The UW System has a presence in every county in Wisconsin and its graduates live and work throughout the state.
A significant challenge to completing an economic impact study for the UW System is finding and recording all economic activity associated with the work of the UW System, including its campuses and many related groups and organizations throughout the state. This study reports on the economic activity of the UW System in the most conservative terms.
INTRODUCTIONThis study was completed by researching and compiling spending data from UW System activities for the 2016-17 fiscal year in the following major areas:
■■ UW campuses■■ UW hospitals■■ UW startup companies■■ UW student spending■■ UW visitor spending■■ UW research park activities■■ UW affiliated organizations
Spending is the primary focus of economic impact studies because money spent in local and regional activities generates further economic activity, jobs, and tax revenues while cycling through local and regional economies.
In this study, the overall economic impact of the UW System ($24 billion), the jobs generated or supported (nearly 167,000), and the amount of taxes generated ($1.1 billion) are explained in detail.

6
The UW System had an economic impact of over $24 billion for the 2016-17 fiscal year.
The largest source of this economic impact comes from the direct spending (and subsequent indirect and induced spending cycles) of UW System campuses. Spending on operations, as well as employee salaries and benefits (subsequently spent in local and regional economies - see Figure 1), accounted for nearly $12 billion of UW System’s overall economic impact.
The second largest contributor to UW System’s economic impact is UW Hospitals and Clinics, an organization long affiliated with the University of Wisconsin–Madison. UW Hospitals was established as a public authority in 1996 but has deep and continuing ties to the UW School of Medicine and Public Health. UW Hospitals accounted for $3.5 billion of UW System’s overall economic impact in the 2016-17 fiscal year.
The third largest contributor to UW System’s economic impact is startup companies, many of which are founded by professors and staff conducting research at the UW System. The data in this calculation comes from startups out of UW-Madison. Approximately 350 startups came from UW-Madison (not including those in UW Research Park) in the 2016-17 fiscal year and accounted for $3 billion of the UW System’s overall economic impact.
Additional startup and established companies located in UW Research Park in Madison, Wis., accounted for $1.1 billion of the UW System’s impact on Wisconsin’s economy in 2016-17.
The next largest contributor to UW System’s economic impact is the spending of UW students who are located on campuses across the state. With 2016-17 fall enrollment slightly above 175,000, student spending accounted for $2.2 billion of the UW System’s overall economic impact.
OVERALL ECONOMIC IMPACT OF UW SYSTEM ON THE WISCONSIN ECONOMY
7
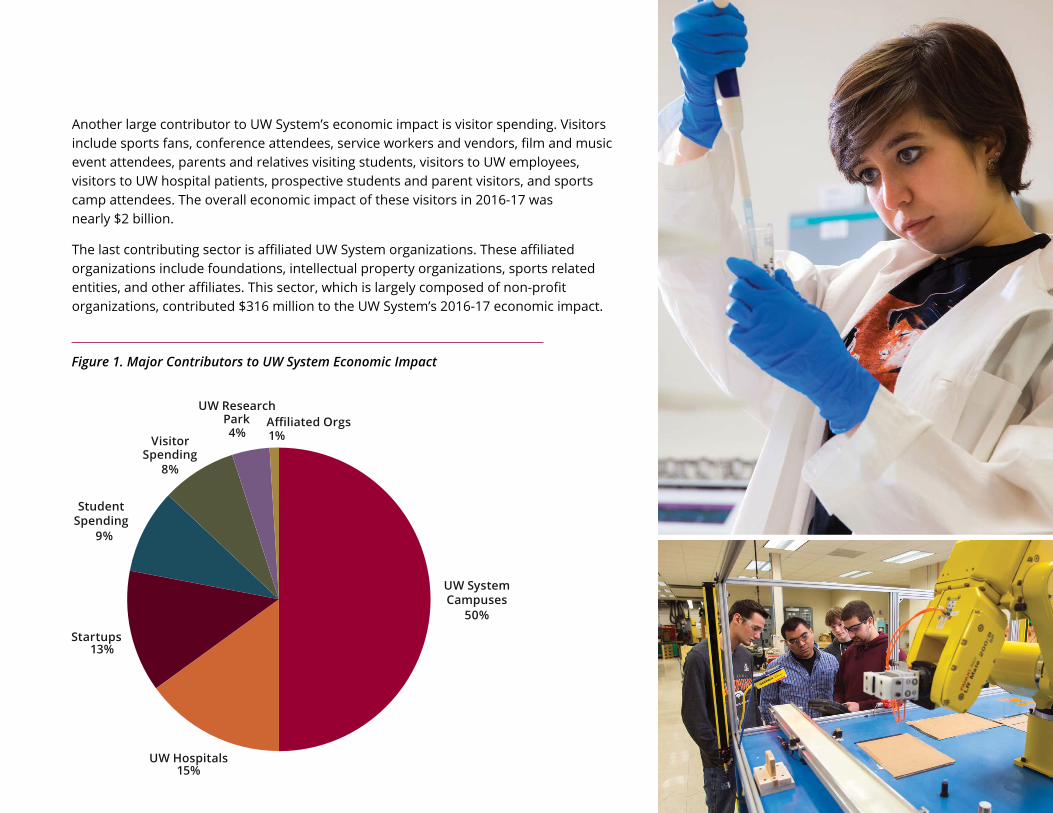
Figure 1. Major Contributors to UW System Economic Impact
Another large contributor to UW System’s economic impact is visitor spending. Visitors include sports fans, conference attendees, service workers and vendors, film and music event attendees, parents and relatives visiting students, visitors to UW employees, visitors to UW hospital patients, prospective students and parent visitors, and sports camp attendees. The overall economic impact of these visitors in 2016-17 was nearly $2 billion.
The last contributing sector is affiliated UW System organizations. These affiliated organizations include foundations, intellectual property organizations, sports related entities, and other affiliates. This sector, which is largely composed of non-profit organizations, contributed $316 million to the UW System’s 2016-17 economic impact.

8
Nearly 167,000 jobs are generated and/or supported by the economic activity of UW System campuses, organizations, and activities.
The production of jobs comes as a natural part of the economic cycle that relates to spending. A clear example of this comes from the spending of UW System employees. This payroll money is spent on an array of household and personal items such as groceries, auto purchases and repairs, utilities, rent, telecommunication services, food purchased from restaurants, and more. For example, money spent at the grocery store supports the jobs of clerks, meat cutters, managers, and others.
Jobs generated by the economic activity of the UW System come from the direct effect of spending, the indirect effect of the direct spending, and the induced effect of indirect economic activity (see Methodology section, pp. 18-19).
As shown in Figure 2, the direct economic effect results in more than 92,000 jobs, the indirect effect produces nearly 29,000 jobs, and the induced effect results in more than 46,000 jobs.
The labor income derived from jobs generated from UW System activity is nearly $9.3 billion. As defined in the IMPLAN model (see pp. 18-19), this includes “all forms of income, including
Figure 2. Employment and Labor Income by Impact Type
Impact Type Employment Labor Income
Direct Effect 92,055 $6,025,707,492
Indirect Effect 28,696 $1,275,584,486
Induced Effect 46,115 $1,960,216,141
Total Effect 166,866 $9,261,508,119
UW SYSTEM IMPACT ON JOBS IN WISCONSIN
9
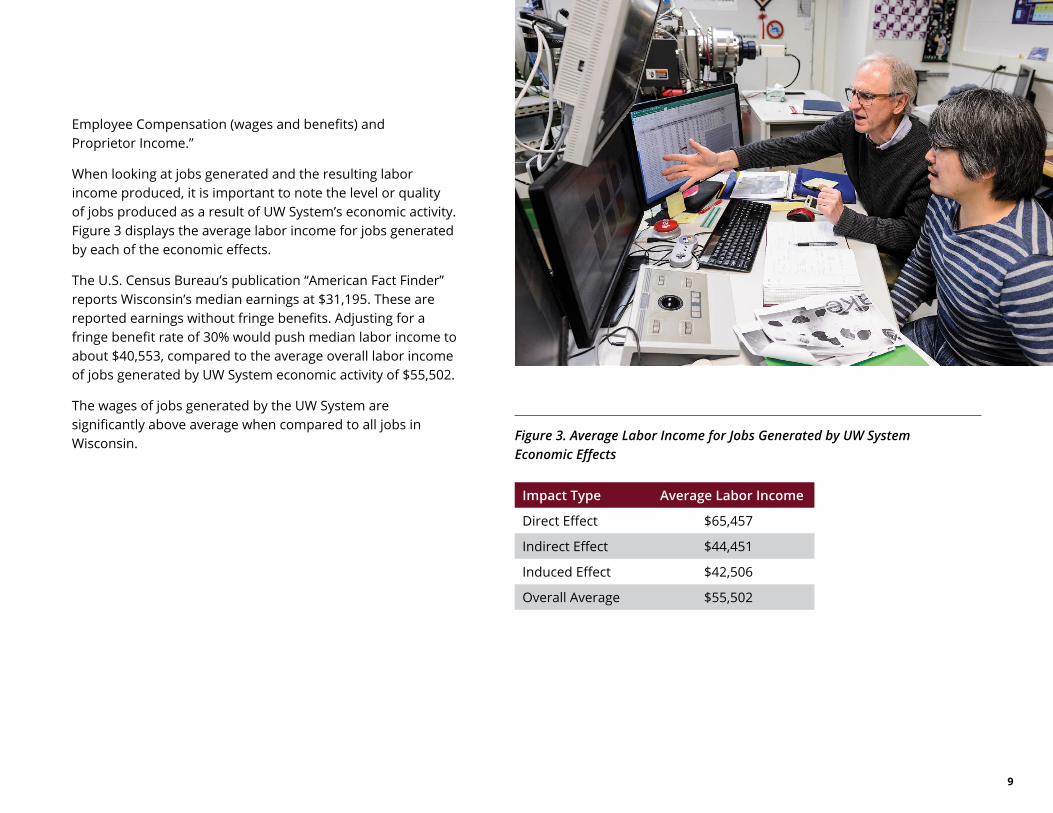
Figure 3. Average Labor Income for Jobs Generated by UW System Economic Effects
Impact Type Average Labor Income
Direct Effect $65,457
Indirect Effect $44,451
Induced Effect $42,506
Overall Average $55,502
Employee Compensation (wages and benefits) and Proprietor Income.”
When looking at jobs generated and the resulting labor income produced, it is important to note the level or quality of jobs produced as a result of UW System’s economic activity. Figure 3 displays the average labor income for jobs generated by each of the economic effects.
The U.S. Census Bureau’s publication “American Fact Finder” reports Wisconsin’s median earnings at $31,195. These are reported earnings without fringe benefits. Adjusting for a fringe benefit rate of 30% would push median labor income to about $40,553, compared to the average overall labor income of jobs generated by UW System economic activity of $55,502.
The wages of jobs generated by the UW System are significantly above average when compared to all jobs in Wisconsin.

10
The $24 billion of UW System economic activity generated $1.1 billion in local and state taxes in 2016-17.
This revenue includes taxes generated from the following sources (as shown in Figure 4):
■■ Local property tax■■ State, county, and special sales tax■■ State personal income tax■■ Corporate income tax
In addition to this $1.1 billion, other taxes and fees — such as state fuel taxes, wheel taxes, cigarette taxes, sports licenses and fees, permit fees, and many others — are generated from UW System economic activity. These additional taxes amount to over $100 million.
Figure 4. State and Local Taxes Generated by UW System Economic Activity
Type of Tax Amount
Property Tax $471,811,768
Sales Tax $382,330,953
Personal Income Tax $211,156,549
Corporate Income Tax $40,215,774
Total Tax Impact $1,105,515,044
UW SYSTEM IMPACT ON STATE AND LOCAL TAXES
11
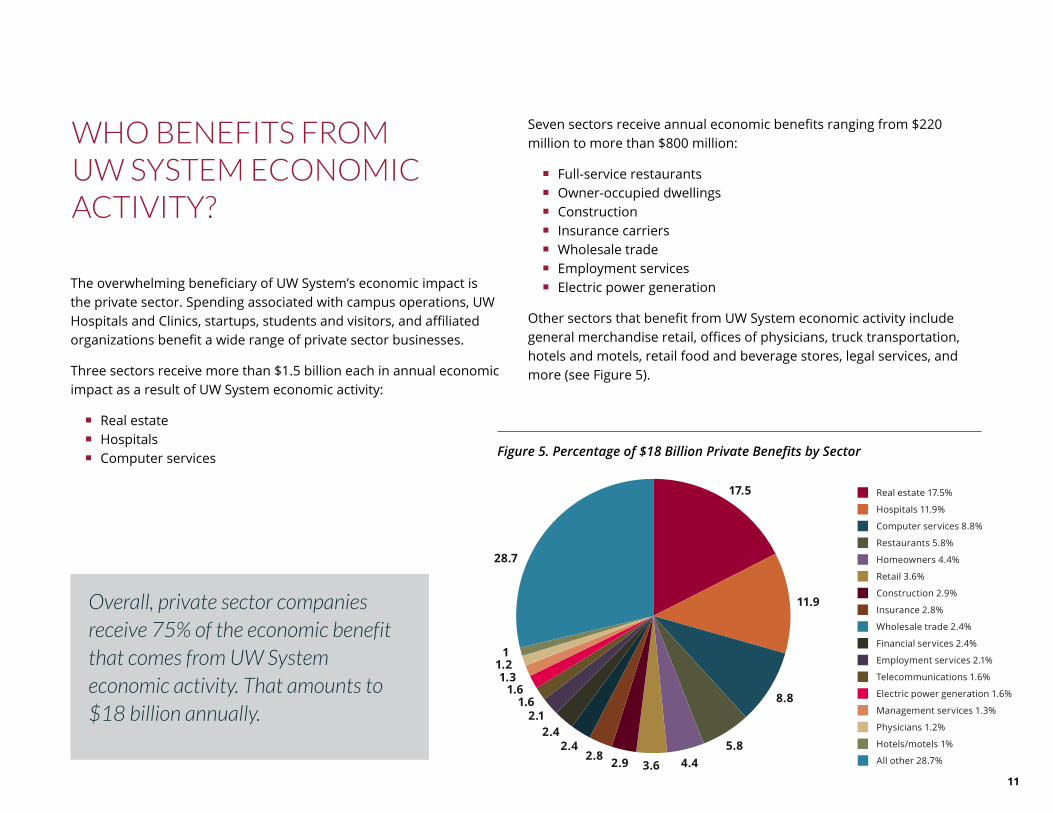
The overwhelming beneficiary of UW System’s economic impact is the private sector. Spending associated with campus operations, UW Hospitals and Clinics, startups, students and visitors, and affiliated organizations benefit a wide range of private sector businesses.
Three sectors receive more than $1.5 billion each in annual economic impact as a result of UW System economic activity:
■■ Real estate■■ Hospitals■■ Computer services
Overall, private sector companies receive 75% of the economic benefit that comes from UW System economic activity. That amounts to $18 billion annually.
Figure 5. Percentage of $18 Billion Private Benefits by Sector
WHO BENEFITS FROM UW SYSTEM ECONOMIC ACTIVITY?
Seven sectors receive annual economic benefits ranging from $220 million to more than $800 million:
■■ Full-service restaurants■■ Owner-occupied dwellings■■ Construction■■ Insurance carriers■■ Wholesale trade■■ Employment services■■ Electric power generation
Other sectors that benefit from UW System economic activity include general merchandise retail, offices of physicians, truck transportation, hotels and motels, retail food and beverage stores, legal services, and more (see Figure 5).

12
The State of Wisconsin has made long-term investments in the University of Wisconsin System. Most of the key academic and research buildings on campuses have been built through state bonding.
In addition to the long-term capital investments, the state contributes to the annual budget of the UW System.
For fiscal year 2016-17, the state allocated slightly over $1 billion to UW System’s operating budget, which helped to support over $24 billion in UW System economic activity. Each dollar of state investment was leveraged to support more than $23 dollars of economic activity.
$1 billion-plus in state tax support helps produce $24 billion of economic activity and 167,000 jobs in Wisconsin.
LEVERAGING STATE INVESTMENT IN THE UW SYSTEM

13
The scope of this study is limited to updating the 2002 UW System economic impact study and reporting the economic impact of UW System campuses, related organizations and activity, startups, and other major contributors. As reported earlier, that economic impact is over $24 billion annually based upon data from fiscal year 2016-17.
However, the economic impacts not included within the scope of this study likely far outweigh those reported here, including:
■■ Wisconsin workforce/talent base■■ Wisconsin tax base■■ Wisconsin research and innovation
One year after graduation, 91% of UW System graduates live in Wisconsin.
UW SYSTEM ECONOMIC IMPACT: BEYOND THE TRADITIONAL NUMBERS

14
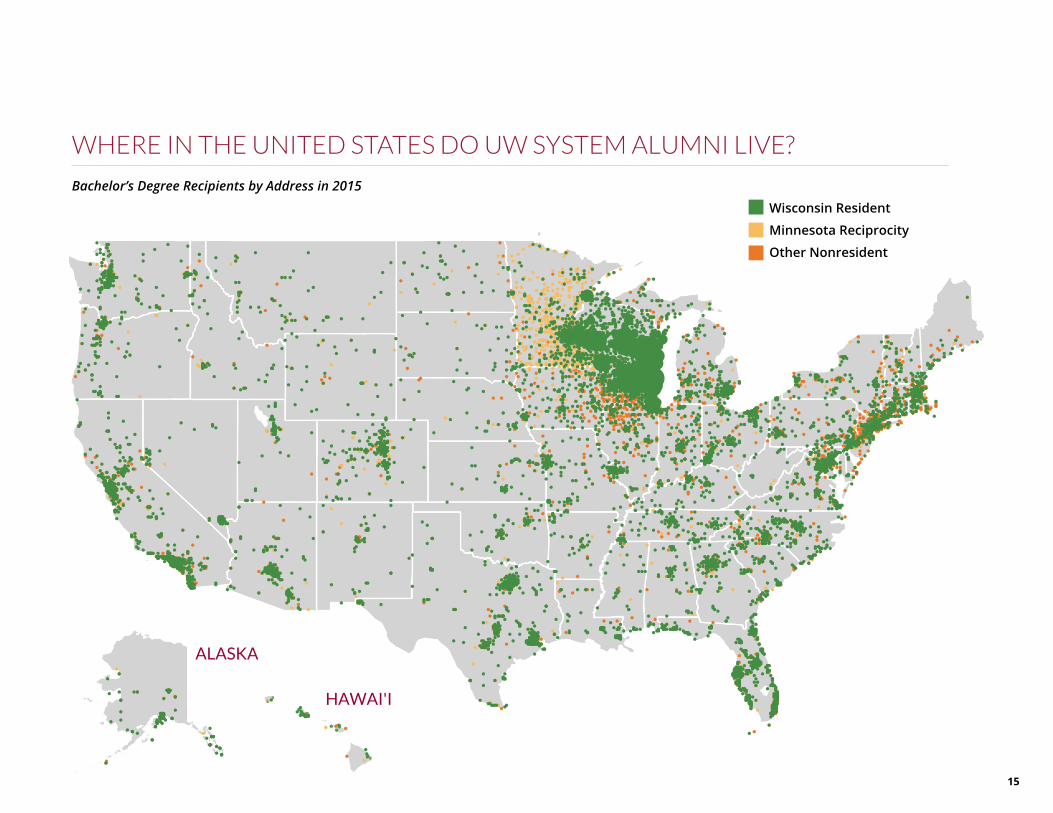
W I S C O N S I N W O R K F O RC E A N D TA L E N T B A S EIn 2016-17, UW System campuses conferred a total of 27,459 bachelor’s degrees. Surveys from prior-year graduating classes indicate that a very high percentage of recent graduates stay and work in Wisconsin. For example, 91% of 2013-14 bachelor’s degree recipients lived in Wisconsin one year after graduation. This stream of college graduates adds to the talent base of Wisconsin’s workforce and provides skilled employees for Wisconsin businesses (see map, p. 15).
Additional data also show that UW System graduates with bachelor’s degrees are filling key shortages in health care, science, and engineering fields. In 2016-17, there were 9,716 science, technology, engineering, and math (STEM) graduates and 3,460 health care graduates.
UW SYSTEM ECONOMIC IMPACT: BEYOND THE TRADITIONAL NUMBERS(continued)
15
WHERE IN THE UNITED STATES DO UW SYSTEM ALUMNI LIVE?
Bachelor’s Degree Recipients by Address in 2015Wisconsin Resident
Minnesota Reciprocity
Other Nonresident
ALASKA
HAWAI'I
16
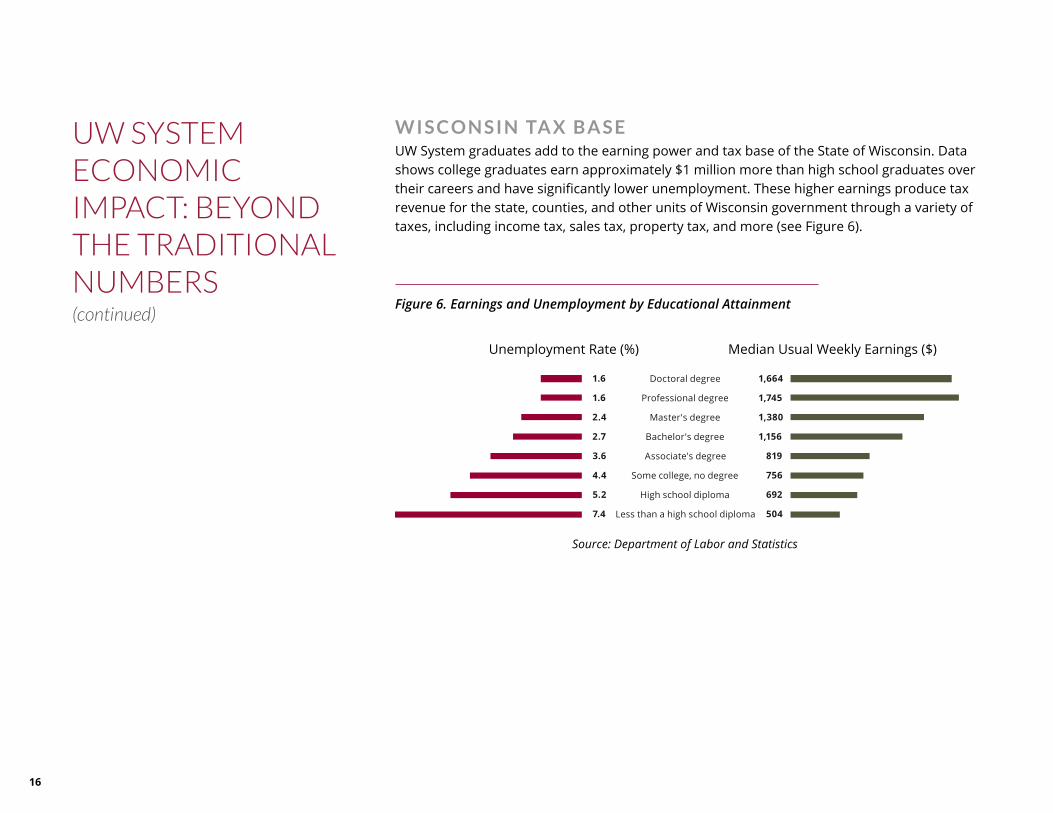
W I S C O N S I N TA X B A S EUW System graduates add to the earning power and tax base of the State of Wisconsin. Data shows college graduates earn approximately $1 million more than high school graduates over their careers and have significantly lower unemployment. These higher earnings produce tax revenue for the state, counties, and other units of Wisconsin government through a variety of taxes, including income tax, sales tax, property tax, and more (see Figure 6).
Figure 6. Earnings and Unemployment by Educational Attainment
Source: Department of Labor and Statistics
Unemployment Rate (%) Median Usual Weekly Earnings ($)
UW SYSTEM ECONOMIC IMPACT: BEYOND THE TRADITIONAL NUMBERS(continued)

17
W I S C O N S I N R E S E A RC H A N D I N N OVAT I O NThe UW System is a major source of research and innovation. More than $1 billion of sponsored research activity occurs on UW System campuses each year. The output of much of that research benefits citizens and businesses in Wisconsin, as well as across the nation.
Three affiliated UW System organizations are particularly important to innovation in the Wisconsin economy. The oldest and largest of these organizations is the Wisconsin Alumni Research Foundation (WARF).
Established in 1925, WARF facilitates the technology transfer needs of UW-Madison. From the discovery of Vitamin D to groundbreaking work with stem cells, WARF continues to convert UW-Madison research into commercial products or applications.
Of growing importance in the innovation space are the UW-Milwaukee Research Foundation (UWMRF) and the WiSys Technology Foundation (WiSys). Both foundations are approximately 20 years old and they serve the technology transfer needs of UW-Milwaukee and the UW System comprehensive universities. Both foundations are ranked in the top 130 technology transfer organizations in the United States.
Ideas that lead to new or better products and services come from UW System campuses around the state thanks to the support of these foundations.
18
To identify and estimate the total economic contribution that a project, business entity, or activity makes to the local, regional, and state economies, it is necessary to look beyond the direct expenditures made by the business or activity itself. There is an economic “ripple effect” of the expenditures made for goods and services related to the business or activity. Spending cycles through the economy as direct expenses, such as purchases made at the grocery store, which are in turn paid out as wages to store workers, who in turn spend money. Wages paid to workers are spent on housing, food, clothing, entertainment, etc. This multiplier effect is accounted for both in terms of indirect effects of the direct spending, as well as induced effects (essentially, the further effects of the indirect spending) to calculate total economic impact.
The “multiplier effect” refers to the recurrent economic activity generated by an initial expenditure. For example, money spent directly on construction will cycle through the local economy again as wages to workers, purchases of construction materials (such as lumber, tools, and nails), gasoline for machinery, and worker transportation. The initial wave of spending generates a second and third wave of spending as wages paid and profits made on the direct construction spending spin through the economy in several cycles. Thus, the original direct expenditure yields a greater economic impact than just the money initially spent. Some money “leaks out” of the regional economy at each level because of spending made outside the area (for example, some goods may be purchased from another state). As a result, the subsequent spending cycles decrease in impact.
The study quantifies the total economic contribution of spending related to the UW System.
METHODOLOGY FOR THIS STUDY
This study quantifies the total annual economic contribution of spending related to the University of Wisconsin System, including its campuses and related organizations and activities. The spending of UW System students, employees, and visitors, as well as spending on university operations, was compiled from various sources. The UW System budget office supplied university spending data. Student spending data was derived from prior NorthStar studies that included student expenditure surveys at several UW System campuses. This data in turn is processed in an econometric model to produce estimates of economic impact, jobs, and tax revenues.
Economic multiplier models (sometimes called Input/Output models) are the framework for analyzing economic impact. Derived mathematically, these models estimate the magnitude and distribution of economic impacts, and measure three types of effects: direct, indirect, and induced changes within the economy. Direct effects are determined by the amount of the initial spending. Indirect effects are determined by the amount of the direct effect spending within the study region on

19
Economic impact is calculated using the IMPLAN economic impact modeling system from the IMPLAN Group. IMPLAN is used to
create detailed social accounting matrices and multiplier models of local economies. IMPLAN Group provides region-specific data to enable users to make in-depth examinations of state, multi-county, county, sub-county, and metropolitan regional economies. IMPLAN Group has been developing complex localized databases and distributing IMPLAN® software to public and private organizations since 1993.
supplies, services, labor, and taxes. Finally, the induced effect measures the money that is re-spent in the study area as a result of spending from the indirect effect. Each of these steps recognizes that some money “leaks out” of the economic study region through purchases made outside the defined area. Eventually these leakages will slow or stop the cycle.
For this project, the econometric model used is produced by the IMPLAN Group, Inc. (IMPLAN). IMPLAN is the developer of the IMPLAN® economic impact modeling system, which is used to create complete, extremely detailed Social Accounting Matrices and Multiplier Models of local economies. IMPLAN tools are in use by more than 2,000 public and private institutions.
The University of Wisconsin–Whitewater Fiscal and Economic Research Center (FERC) was engaged to run the economic impact numbers. FERC uses the IMPLAN model and regularly updates the multipliers used in the model. Dr. Russ Kashian, director of FERC, was very helpful in running and analyzing the data in this study.

20
Many economic impact studies contain very large numbers that may be hard to put into context. For example, what does it mean if the economic impact of the UW System is $24 billion on an annual basis? Or what does 167,000 jobs mean to the average person in Wisconsin?
The size of the UW System economic impact can be reported in terms of its proportion of the entire amount of economic activity in Wisconsin. For 2017, the value of all goods and services produced by Wisconsin workers was $313 billion. The UW System economic activity in 2016-17 amounts to 7.7% of the total economic activity in the state. In other words, UW System activity amounts to $7.70 for each $100 of economic activity in the state.
It is also useful to look at the jobs generated by UW System activity in the context of the entire Wisconsin workforce and total employment. Wisconsin’s workforce numbers about 3.16 million workers of whom about 3.06 million are employed. The nearly 167,000 jobs generated or supported by UW System economic activity represents 5.5% of the total number of employed workers in Wisconsin. Stated another way, about 1 in 20 jobs are related to UW System economic activity in the state.
In summary, the numbers reported in this study are large and very important to the Wisconsin economy. UW System campuses and related organizations and activities constitute one of the largest enterprises in the state. In total, they produce an annual economic impact of over $24 billion. They further generate nearly 167,000 jobs and over $1.1 billion in state and local taxes.
The UW System accounts for $7.70 of each $100 of economic activity in Wisconsin.
1 in 20 Wisconsin jobs are related to UW System economic activity.
CONCLUSION AND CONTEXT

21

UNIVERSITY OF WISCONSIN SYSTEM
wisconsin.edu