Impact of the recession on household expenditure - Home …€¦ · · 2017-08-25Chapter 5:...
41
Chapter 5: Impact of the recession on household expenditure Family Spending: 2011 Edition Impact of the recession on household expenditure Office for National Statistics 84
Transcript of Impact of the recession on household expenditure - Home …€¦ · · 2017-08-25Chapter 5:...

Chapter 5: Impact of the recession on household expenditure Family Spending: 2011 Edition
Impact of the recession on household expenditure
Office for National Statistics
84

Chapter 5: Impact of the recession on household expenditure Family Spending: 2011 Edition
Executive Summary
Introduction Household expenditure plays an important part in the UK economy and might also be expected to reflect economic trends. This chapter compares expenditure during the peak of the economic cycle in 2007, with expenditure in 2010, when the UK was recovering from recession. The findings are considered in the context of the macroeconomic changes seen over this period of economic instability.
The chapter follows on from the general trends reported in Chapter 4, and focuses on statistically significant differences observed comparing the two snapshot years. It provides a detailed analysis of differences in expenditure by geographic areas that share common characteristics using the Output Area Code (OAC) categorisation system based on the 2001 Census. The categorisation is based on variables associated with: demographic structure, household composition, housing, socio-economic status and employment (see Family Spending 20106 for more details).
The results are reported at 2010 prices to remove the effects of inflation and to enable figures for the two years to be compared on a like-for-like basis.
2007 and 2010: UK expenditure and income When average household expenditure for the two years is considered for the UK, statistically significant decreases were observed for some categories: clothing and footwear; health; recreation and culture; restaurants and hotels; and miscellaneous goods and services. Significant increases were seen for others: education; housing; and water and electricity. While these changes in expenditure were statistically significant, some were small. Interestingly, average disposable income was very similar in 2007 and 2010.
Considered overall, these changes amount to surprisingly little change in average household expenditure and income over the period of recession in the UK. We therefore categorised households according to OAC super group, to consider whether there were any significant changes in expenditure when households are classified according to common characteristics of their local areas. We also disaggregated the broad expenditure categories to enable us to consider spending patterns more fully.
Expenditure by OAC super group The highest level of OAC categorisation is the super group, which define seven categories of geographic area with common characteristics. (See Table 5.2 for a list of super groups and groups.) Examination of expenditure by OAC super group revealed interesting differences comparing 2007 and 2010:
Transport Countryside and Prospering Suburbs super groups spent significantly more in 2010 compared with 2007 on operation of personal transport, including fuel, but less on vehicle purchase. In contrast, Typical Traits and Multicultural super groups spent less on private transport but more on public transport. These findings suggest that households reallocate their spending, but how they do this reflects their circumstances. For instance, Countryside or Prospering Suburbs households may find
Office for National Statistics
85

Chapter 5: Impact of the recession on household expenditure Family Spending: 2011 Edition
it more difficult to substitute private for public transport than other super groups, but they may be able to make savings by spending less on new vehicles.
Housing, fuel and power Spending on housing, fuel and power increased across all OAC super groups between 2007 and 2010, but increases in spending on rent were notable for Blue Collar Communities, Countryside, Constrained by Circumstances and Typical Traits.
Spending on electricity, gas and other fuels increased fairly uniformly across super groups, with the exception of Constrained by Circumstances (the lowest spenders in this category), perhaps reflecting this group’s economising on fuel.
Recreation and culture; Restaurants and hotels Changes in expenditure on recreation and culture were variable. For example, Prospering Suburbs and Typical Traits spent less on this category in 2010 than in 2007, but City Living spent significantly more. The patterns by sub-category were complex, with relatively consistent expenditure in some categories suggesting that many households no longer consider some of this spending to be discretionary. Spending on restaurants and hotels gives a similar story, with spending reduced for only some categories.
Expenditure by OAC group The data were examined at a more detailed level of OAC categorisation: the 21 groups within super groups. This analysis revealed further differences that were masked at the group level:
Alcohol and tobacco showed a significant fall for Prospering Younger Families and a significant increase for Older Workers.
The observed fall in transport expenditure in the Prospering Suburbs super group was driven largely by Prospering Younger Families.
The increase in housing, fuel and power spending among Blue Collar Communities was due to Younger Blue Collar Workers.
Expenditure on food and non-alcoholic drink showed few changes even at this level of breakdown, reflecting the essential nature of purchasing food.
Conclusion The analysis showed surprisingly little change in average household expenditure between 2007 and 2010, given the scope of the recession. However, when household characteristics are taken into account, using OAC categorisation, a more complex picture emerges: different groups show different changes between 2007 and 2010. It appears that it is difficult to define the impact of the recession on the typical household, with the effect depending greatly on household circumstances and preferences.
Office for National Statistics
86

Chapter 5: Impact of the recession on household expenditure Family Spending: 2011 Edition
Introduction Household expenditure plays a large part in determining the economic path of the UK. In this chapter, the Living Costs and Food Survey (LCF) data are used to compare 2010 household expenditure when the UK economy was recovering from recession, with expenditure during the peak of the economic cycle in 2007. The macroeconomic environment changed significantly between these two periods; understanding the changes in household expenditure during this period of economic instability is of high general interest.
Context Between 2008 quarter 1 and 2009 quarter 3, Gross Domestic Product (GDP) fell by 7.1 per cent1, making this recession more severe than that of the 1990s (where GDP fell by 2.5 per cent) and 1980s (where GDP fell by 5.9 per cent)2. Figure 5.1 illustrates that although economic growth returned in the final quarter of 2009, recovery has been slow. Latest estimates continue to show a gradual recovery, with GDP growth not yet returning to pre-recession levels3. The impact of the recession on the labour market was gradual and not as severe as in the 1990s recession4. Unemployment increased steadily from 5.2 per cent in 2008 quarter 1 to 8 per cent in 2010 quarter 1. However, during the recovery unemployment did not fall immediately. As a consequence, the percentage of workless households, which increased from 17.7 per cent in 2007 to 18.7 per cent in 2009, actually increased again in 2010 to 18.9 per cent. Jenkins (2010) reports that there has also been a fall in the number of full-time workers, illustrating that many households with employed residents have experienced a reduction in hours worked5. In 2010 therefore, it is likely that households continued to have been affected by the recession.
Figure 5.1 UK Quarterly GDP growth and unemployment rate, 2006q4 – 2011q2
-4
-2
0
2
4
6
8
102006q4
2007q1
2007q2
2007q3
2007q4
2008q1
2008q2
2008q3
2008q4
2009q1
2009q2
2009q3
2009q4
2010q1
2010q2
2010q3
2010q4
2011q1
2011q2
Unemployment(% )
GDP (%change)
Source: Quarterly National Accounts Dataset, q2 2011; Labour Market Statistics, October 2011
Office for National Statistics
87

Chapter 5: Impact of the recession on household expenditure Family Spending: 2011 Edition
Although the macroeconomic statistics provide us with an overall indication of the impact of the recession for the average household, they are unable to provide the detail on how specific household groups have been affected. To do this, we therefore examine household expenditure by Output Area Classification (OAC) super group and group (described later), following the analysis presented in Family Spending 20106, to consider the impact of changing economic conditions by household characteristics. This is particularly relevant, as labour market statistics indicate that the young, males, and those with fewer educational qualifications, were most affected by deteriorating employment conditions7.
We first consider the impact upon households that we may expect. For so-called ‘normal goods’ and luxury items, we would expect less favourable economic conditions to result in a fall in their consumption. Conversely, we would expect to see the consumption of ‘inferior goods’, such as supermarket own-brand products for example, to rise as a direct response to constrained income or the expectation of reduced household income in the future. This view however, may be too simplistic for a number of reasons. First, it is important to note that the impact on the household is likely to differ considerably from the impact on the individual. Households can be grouped according to many different circumstances, including for instance, number of working age residents, number of children, and tenure. The impact of rising unemployment may therefore be felt more significantly by households with a greater number of working age adults. In addition, households with a greater number of young adults with few qualifications are likely to have been more affected by rising unemployment. The low interest rates will have had a very different impact upon those households with a large variable-rate mortgage compared with households that have significant savings. Rising inflation will also have had a detrimental impact upon households with large savings. Supporting this view, Howell et al. (2010)8 showed that while households overall experienced little change in their disposable income during the recession, the impact was uneven. By examining expenditure by OAC super group, and also disaggregating further by OAC group, here we are able to examine changes in household expenditure according to circumstances. This approach enables us to investigate beyond the average impact.
The classification of expenditure into broad Classification Of Individual COnsumption by Purpose (COICOP) items may also mask a degree of substitutability within these categories. Disaggregating expenditure categories may therefore improve our understanding of how households respond to changes in economic conditions.
We should also consider that households may not alter their spending patterns in response to changes in economic conditions. Consumers may determine their spending based upon their long-term expectations of income rather than their current income. This permanent income hypothesis implies that households may not react to any reduction in their household income during the recession, as they expect conditions to improve long-term.
Our view of what constitutes essential item expenditure may also be too simplistic. Certain items that may have traditionally been considered discretionary, such as recreation and culture expenditure for instance, may be considered essential by many households through a habituation effect. Some households may have enjoyed regular holidays and gym subscriptions for many years during economic prosperity and continue with this consumption despite the less favourable economic conditions. Related to this, the spending behaviour of other households may have an impact upon individual household expenditure. Consequently, if friends and neighbours choose not
Office for National Statistics
88

Chapter 5: Impact of the recession on household expenditure Family Spending: 2011 Edition
to alter their expenditure and continue to visit restaurants and purchase luxury items, individual households may also be more reluctant to alter their own spending habits. This relative income hypothesis suggests that households are more concerned with relative levels of consumption than absolute levels.
Overall, household expenditure is potentially influenced by many factors, and consequently it is very difficult to predict the household reaction to changing economic conditions. In this chapter, we examine spending behaviour by OAC group and super group to improve our understanding of the impact of the most recent recession upon household expenditure.
Average household COICOP expenditure This chapter categorises the LCF mean household expenditure estimates using the Classification Of Individual COnsumption by Purpose (COICOP). This is the internationally agreed standard classification for reporting household consumption expenditure.
Table 5.1 presents weekly household COICOP expenditure and weekly household income by year between 2006 and 2010 in 2010 prices9. All statistics reported in this article have been deflated to reflect 2010 prices using All Items Retail Price Index data. We should be aware that the price of some goods will have increased at a greater rate relative to others, but this is not accounted for through the use of an All Items deflator. It should be noted that the LCF survey is cross-sectional (the results for each survey year representing a snapshot) and is not primarily intended for analysis over a longer period. Therefore, some caution should be taken when directly looking at trends over time. For this reason, the remainder of the chapter focuses upon comparing snapshots of years 2007 and 2010.
Office for National Statistics
89

Chapter 5: Impact of the recession on household expenditure Family Spending: 2011 Edition
Office for National Statistics 90
Table 5.1 Mean COICOP weekly household expenditure and income time series weighted and in 2010 prices United Kingdom
2006 2007 2008 2009 2010
Weighted number of households 25,440 25,350 25,690 25,980 26,320
Commodity or service
Food & non-alcoholic drinks 52.30 52.10 52.80 54.60 53.20
Alcoholic drinks, tobacco & narcotics 12.50 12.10 11.20 11.70 11.80
Clothing & footwear 25.90 23.80 22.50 21.90 23.40
Housing(net)1, fuel & power 53.60 56.00 55.20 59.90 60.40
Household goods & services 33.80 33.30 31.40 29.20 31.40
Health 6.60 6.20 5.30 5.50 5.00
Transport 68.60 66.70 66.00 61.10 64.90
Communication 13.10 12.90 12.40 12.20 13.00
Recreation & culture 65.00 62.10 62.50 60.50 58.10
Education 7.90 7.30 6.40 7.30 10.00
Restaurants & hotels 42.40 40.30 39.30 40.10 39.20
Miscellaneous goods & services 40.20 38.20 37.10 36.70 35.90
Total expenditure 506.70 496.90 490.30 476.00 473.60
Income (£)
Disposable weekly household income 582 578 605 584 578
Gross weekly household income 716 714 742 714 700
1 Excluding mortgage interest payments, council tax and Northern Ireland rates
Average w eekly household expenditure (£)
In terms of gross and disposable weekly household income, Table 5.1 illustrates that this actually increased between 2007 and 2008. This has been reported elsewhere10, and is partly due to increases in social security benefits and reductions in taxes. Both then fell in 2009 and increased only slightly in 2010, despite the fact that the economy was no longer in recession. This is consistent with labour market statistics reported in the introduction, with unemployment increasing gradually during the recession and only falling gradually during the recovery. Continued limited wage growth is also likely to have contributed to the fall in disposable income in 2010.
Comparing COICOP expenditure in 2007 with 2010, statistically significant falls in expenditure are observed for clothing and footwear, health, recreation and culture, restaurants and hotels, and miscellaneous goods and services. Conversely, there have been significant11 increases in education; and housing, fuel and power expenditure. It should again be noted that some of the changes in expenditure, although significant, were relatively small. For instance, average household clothing expenditure fell by only 43p in real terms. Figure 5.2 illustrates the change in COICOP expenditure between 2006 and 2010.
Chapter 5: Impact of the recession on household expenditure Family Spending: 2011 Edition
Figure 5.2 COICOP item expenditure as a percentage of total COICOP expenditure time series United Kingdom
0.00
10.00
20.00
30.00
40.00
50.00
60.00
70.00
80.00
2006 2007 2008 2009 2010Year
£ per week Food & non-alcoholic drinks
Alcoholic drinks , tobacco & narcotics
Clothing & footwear
Hous ing(net)1, fuel & power
Household goods & services
Health
Transport
Com m unication
Recreation & culture
Education
Res taurants & hotels
Miscellaneous goods & services
Considering the extent of the fall in GDP, we find little change in average household expenditure for COICOP items during and immediately following the recession. This is surprising, as we had expected to see much greater falls in discretionary item expenditure. However, this is consistent with evidence reported here and elsewhere that average household disposable income actually grew during the recession, and only began to fall later so that ‘the pain was delayed but not avoided’12.
OAC super group and group composition Evidence elsewhere has suggested that the impact of the recession upon employment and disposable income was disproportionate8. The average household classification may therefore be masking many impacts. To investigate further, we classify households according to Output Area Classification (OAC) super group and group. Family Spending 2010 details the methodology for deriving Output Areas, of which there are over 223,000. To assist with developing a clearer understanding of these geographic areas, output areas were clustered into groups based upon a number of characteristics. This resulted in seven super groups, which can be further disaggregated into 21 groups. These super groups and groups share a series of characteristics, but may be distributed over different parts of the UK. The characteristics common to each super group are outlined in Family Spending 2010 (Table 5.3, page 106): www.ons.gov.uk/ons/rel/family-spending/family-spending/2010-edition/family-spending-2010--living-costs-and-food-survey-2009-.pdf
Office for National Statistics
91

Chapter 5: Impact of the recession on household expenditure Family Spending: 2011 Edition
Table 5.2 OAC super groups and groups classification (percentages) United Kingdom
2007 2010
1 Blue Collar Communities 16 171A Terraced Blue Collar 4 41B Younger Blue Collar 6 61C Older Blue Collar 6 7
2 City Living 7 72A Transient Communities 2 22B Settled in the City 5 5
3 Countryside 11 133A Village Life 5 53B Agricultural 3 33C Accessible Countryside 4 4
4 Prospering Suburbs 23 224A Prospering Younger Families 4 44B Prospering Older Families 7 64C Prospering Semis 7 74D Thriving Suburbs 5 5
5 Constrained by Circumstances 12 125A Senior Communities 2 25B Older Workers 7 85C Public Housing 2 3
6 Typical Traits 20 206A Settled Households 5 66B Least Divergent 5 66C Young Families in Terraced Homes 5 56D Aspiring Households 5 4
7 Multicultural 11 97A Asian Communities 7 57B Afro-Caribbean Communities 4 3
Totals may not add up due to the independent rounding of component categories N.B. Super groups are shown in bold
Table 5.2 reports the proportion of Living Costs and Food Survey respondents in each OAC super group (in bold) and group over time. The percentage of respondents in each super group remained relatively stable between 2007 and 2010, with only a slight increase in the Countryside and Constrained by Circumstances groups, and a fall in the Multicultural group. When we disaggregate each super group, further differences in the proportion contributing to the sample are observed. For instance, within the Typical Traits category there has been an increase in Young Families in Terraced Homes and a fall in Aspiring Households. This illustrates that broad super group classification could be masking differences at the group level.
Office for National Statistics
92

Chapter 5: Impact of the recession on household expenditure Family Spending: 2011 Edition
COICOP expenditure by OAC super group
Overall COICOP expenditure Table 5.3 reports mean weekly household COICOP expenditure and income by OAC super group in 2010. A detailed discussion of the differences in expenditure by OAC group in 2009 was reported in Family Spending 2010. Similar trends are observed here. For instance, housing, fuel and power made up the greatest component of total COICOP expenditure for all super groups except Countryside and Prospering Suburbs for which transport costs make up the largest proportion.
Table 5.3 Mean COICOP weekly household expenditure and income 2010, by OAC super group (weighted) United Kingdom
Blue collar
comm
unities
City living
Countryside
Prospering
suburbs
Constrained by
circumstances
Typical Traits
Multicultural
All households
Commodity or service
Food & non-alcoholic drinks 49.70 48.00 59.90 61.00 40.50 51.60 55.90 53.20
Alcoholic drinks , tobacco & narcotics 13.50 10.80 13.80 11.00 11.60 11.50 9.70 11.80
Clothing & footwear 20.80 26.60 23.70 26.50 16.00 24.50 25.10 23.40
Hous ing(net)1, fuel & power 53.50 115.10 60.10 48.90 51.30 56.30 83.10 60.40
Household goods & services 22.40 39.00 39.30 41.00 19.40 30.50 25.60 31.40
Health 3.40 6.00 5.30 6.50 2.50 5.40 6.30 5.00
Transport 50.80 61.70 83.00 84.80 33.00 64.40 63.00 64.90
Com munication 12.40 13.80 13.50 13.50 9.80 13.30 16.00 13.00
Recreation & culture 49.50 48.30 81.10 73.20 36.90 53.70 49.80 58.10
Education 1.50 37.50 15.30 8.00 1.60 10.70 12.60 10.00
Res taurants & hotels 30.80 52.10 40.70 48.10 24.40 38.80 42.70 39.20
Miscellaneous goods & services 25.70 42.00 45.60 44.60 20.70 37.20 32.80 35.90
Income (£)
Disposable weekly household incom e 458.40 681.80 639.90 692.80 361.50 589.50 626.70 578.40
Gross weekly household incom e 537.60 861.50 776.30 851.90 416.00 714.70 757.50 700.50
1 Excluding mortgage interes t paym ents , council tax and Northern Ireland rates
Average weekly household expenditure (£)
Office for National Statistics
93

Chapter 5: Impact of the recession on household expenditure Family Spending: 2011 Edition
Office for National Statistics 94
City Living reports the highest gross weekly household income (£861.50), whilst Prospering Suburbs (£692.80) report the highest disposable weekly household income (which takes account of national insurance contributions and income tax). The Constrained by Circumstances super group report both the lowest gross (£416.00) and disposable (£361.50) household incomes. The difference between the super groups with the highest and lowest average disposable weekly household income is therefore fairly large at £331.30.
Table 5.4 Mean COICOP weekly household expenditure and income 2007, by OAC super group (weighted) 2010 prices United Kingdom
Blue Collar Com
munities
City Living
Countryside
Prospering Suburbs
Constrained by Circum
stances
Typical Traits
Multicultural
All households
Commodity or service
Food & non-alcoholic drinks 49.60 45.50 57.80 58.90 40.70 52.00 49.90 52.10
Alcoholic drinks, tobacco & narcotics 13.80 11.30 14.30 11.30 13.00 11.70 8.80 12.10
Clothing & footwear 20.10 25.40 22.40 27.10 14.70 25.00 26.60 23.80
Housing(net)1, fuel & power 47.90 101.90 56.50 48.10 46.80 52.50 73.90 56.10
Household goods & services 29.60 30.40 43.10 37.60 20.70 35.90 28.10 33.30
Health 3.30 9.10 9.00 9.20 3.90 4.90 4.70 6.20
Transport 50.00 62.40 88.20 90.40 35.60 71.30 47.80 66.70
Communication 12.00 13.40 13.10 12.90 10.00 13.20 14.40 12.90
Recreation & culture 50.40 58.60 79.30 79.40 39.10 65.40 43.20 62.10
Education 3.00 12.10 13.10 8.30 1.50 5.30 12.90 7.40
Restaurants & hotels 30.70 48.20 45.50 46.90 24.20 44.00 36.50 40.30
Miscellaneous goods & services 28.20 40.10 47.50 48.70 22.30 38.70 34.20 38.20
Income (£)
Disposable weekly household income 490.70 593.00 679.60 697.50 353.30 609.70 551.70 577.80
Gross weekly household income 559.80 743.60 864.20 873.60 409.00 757.60 679.90 713.60
1 Excluding mortgage interest payments, council tax and Northern Ireland rates
Average w eekly household expenditure (£)
In 2007, Prospering Suburbs reported the highest real gross (£873.60) and real disposable (£697.50) household income (‘real’ income refers to income after the affects of inflation have been accounted for). These figures are above the equivalent highest household incomes reported in 2010 (disposable income decreased by £4.70 between 2007 and 2010 for Prospering Suburbs in

Chapter 5: Impact of the recession on household expenditure Family Spending: 2011 Edition
Office for National Statistics 95
real terms). As in 2010, Constrained by Circumstances report both the lowest real gross (£409.00) and real disposable (£353.30) incomes. For this group therefore, real disposable income increased by £8.20 between 2007 and 2010. Real disposable income increased for three super groups between 2007 and 2010. However, the increases between super groups vary greatly. Real disposable income increased by £75.00 for Multicultural and £88.80 for the City Living super group. In contrast, it decreased £32.30 for Blue Collar Communities and £39.70 for the Countryside super group. At the average household level, Table 5.1 showed very little change in real average household disposable income when comparing 2007 with 2010. This highlights that examining data at the average household level masks many differences.
Expenditure is also presented as a percentage of total COICOP expenditure by OAC super group for 2010 (Figure 5.3) and 2007 (Figure 5.4).
Figure 5.3 OAC mean COICOP expenditure graph by OAC super group (as a percentage of total COICOP expenditure), 2010 United Kingdom
0%
10%
20%
30%
40%
50%
60%
70%
80%
90%
100%
Blue C
ollarC
omm
unities
City Living
Countryside
ProsperingS
uburbs
Constrained by
Circum
stances
Typical Traits
Multicultural
Miscellaneous goods & services
Restaurants & hotels
Education
Recreation & culture
Com m unication
Transport
Health
Household goods & services
Hous ing, fuel & power
Clothing & footwear
Alcoholic drinks , tobacco & narcotics
Food & non-alcoholic drinks
Chapter 5: Impact of the recession on household expenditure Family Spending: 2011 Edition
Figure 5.4 Mean COICOP expenditure graph by OAC super group (as a percentage of total COICOP expenditure), 2007 United Kingdom
0%
10%
20%
30%
40%
50%
60%
70%
80%
90%
100%
Blue C
ollarC
omm
unities
City Living
Countryside
ProsperingS
uburbs
Constrained by
Circum
stances
Typical Traits
Multicultural
Miscellaneous goods & services
Restaurants & hotels
Education
Recreation & culture
Communication
Transport
Health
Household goods & services
Housing, fuel & power
Clothing & footwear
Alcoholic drinks, tobacco & narcotics
Food & non-alcoholic drinks
In terms of comparing COICOP item expenditure in 2010 with 2007 by OAC super group, we consider that there are two potential impacts. Households may have changed their weekly expenditure on particular items, but they may not have changed the relative importance of the item in terms of their overall COICOP expenditure. This would account for households altering their total expenditure in 2010. The analysis supports this, as Table 5.1 illustrates a fall in expenditure for most COICOP categories between 2007 and 2010. We therefore examine if households have significantly changed the amount spent on each item, and also if they have changed the relative importance placed on a particular item in terms of their total COICOP expenditure.
Table 5.5 reports statistical significance levels of differences in mean real household expenditure in 2007 and 2010 by super group, following the calculation of t statistics. Bold figures indicate statistical significance above the 10 per cent significance levels, while red indicates an increase in expenditure, and blue a decrease. This highlights that:
Blue Collar Communities, Prospering Suburbs and Typical Traits have two significant categories of reduced expenditure.
The Countryside super group have one significant category of reduced expenditure.
City Living and Typical Traits each have one significant category of increased expenditure.
The Multicultural super group has two significant categories of increased expenditure.
Office for National Statistics
96

Chapter 5: Impact of the recession on household expenditure Family Spending: 2011 Edition
Office for National Statistics 97
Table 5.5 Statistical significance of mean differences in 2010 and 2007 expenditure United Kingdom
Blue Collar com
munities
City Living
Countryside
Prospering suburbs
Constrained by
circumstances
Typical Traits
Multicultural
Food & non-alcoholic drinks 0.90 0.30 0.20 0.70 0.10
0.70
0.90 0.90 1.00 0.80
0.00 0.50 0.20 0.90 0.20 0.10 0.20
0.20
0.30 0.30
1.00 0.00
0.90 0.20
0.10 0.60 1.00 0.20
0.80 0.50 0.001.00 0.80 0.70 0.80
0.90
Red f
0.60 0.80
Alcoholic drinks, tobacco & narcotics 0.70 0.80 0.70 0.60 0.20 0.20
Clothing & footwear 0.80 0.40 1.00
Housing(net)1, fuel & power
Household goods & services 0.00 0.50 0.50 0.30 0.20 0.80
Health 1.00 0.30 0.00 0.10 0.20
Transport 0.80 0.40 0.30 0.30 0.20
Recreation & culture 0.60 0.30 0.00 0.20 0.00
Education 0.30 0.80 0.90
Restaurants & hotels 0.70 0.10 0.90 0.10Communication 0.70 0.40 0.20
Miscellaneous goods & services 0.00 0.80 0.60 0.10 0.20 0.80
1 Excluding mortgage interest payments, council tax and Northern Ireland ratesBold font s ignifies s ignificantly different expenditure in 2010Blue increase in 2010
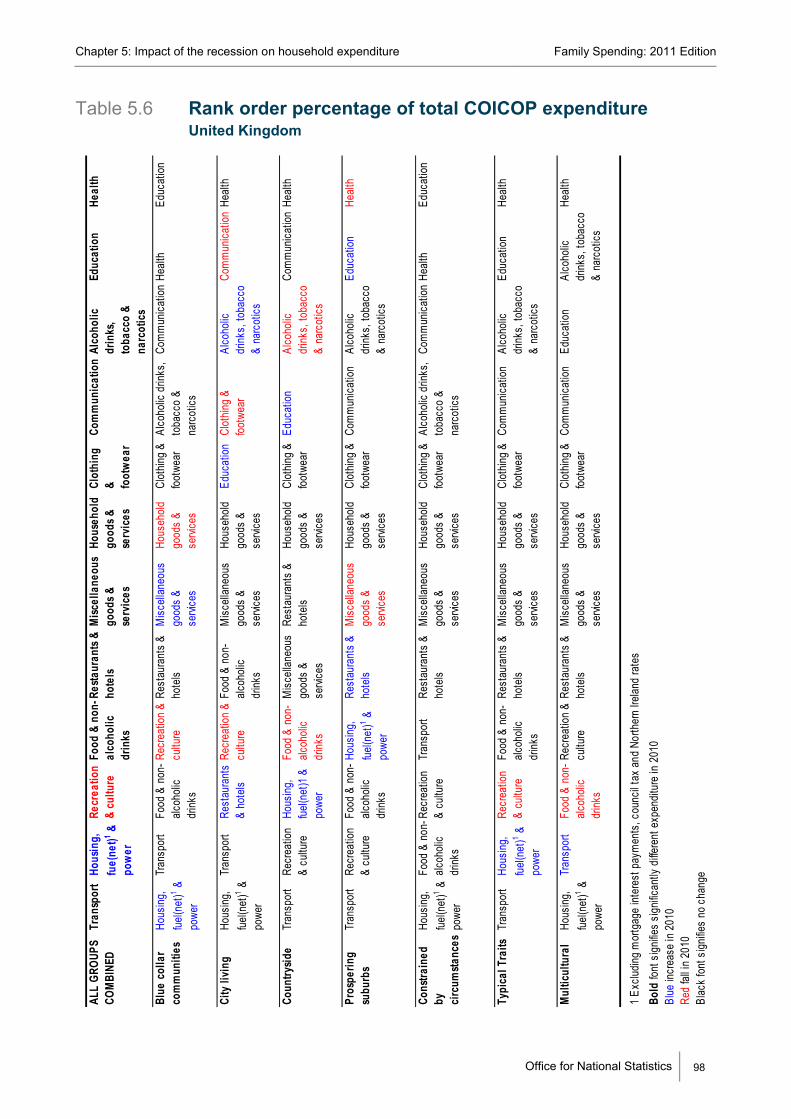
all in 2010Black font s ignifies no change Table 5.6 then ranks each COICOP item in terms of amount spent in 2010 for each OAC super group. Red indicates a decrease and blue an increase in the importance of the item in terms of total expenditure in 2010 compared with 2007. For instance, the amount spent on housing, fuel and power by Blue Collar Communities increased in 2010 compared with 2007, with this group spending the most on this compared with any other COICOP item.
Chapter 5: Impact of the recession on household expenditure Family Spending: 2011 Edition
Office for National Statistics
Table 5.6 Rank order percentage of total COICOP expenditure United Kingdom
ALL
GROU
PS
COM
BINE
DTr
ansp
ort
Hous
ing,
fu
e(ne
t)1 &
pow
er
Food
& n
on-
alco
holic
dr
inks
Resta
uran
ts &
hote
lsM
iscel
lane
ous
good
s &
serv
ices
Hous
ehol
d go
ods &
se
rvic
es
Clot
hing
& fo
otw
ear
Com
mun
icat
ion
Alco
holic
dr
inks
, to
bacc
o &
narc
otic
s
Educ
atio
nHe
alth
Blue
col
lar
com
mun
ities
Hous
ing,
fuel(n
et)1 &
po
wer
Tran
spor
tFo
od &
non
-alc
oholi
c dr
inks
Rest
aura
nts
& ho
tels
Misc
ellan
eous
go
ods
& se
rvice
s
Clot
hing
& foo
twea
rAl
coho
lic d
rinks
, to
bacc
o &
narc
otics
Com
mun
icatio
nHe
alth
Educ
ation
City
livi
ngHo
using
, fue
l(net
)1 &
powe
r
Tran
spor
tRe
stau
rant
s &
hote
lsFo
od &
non
-alc
oholi
c dr
inks
Misc
ellan
eous
go
ods
& se
rvice
s
Hous
ehold
go
ods
& se
rvice
s
Educ
ation
Alco
holic
dr
inks,
toba
cco
& na
rcot
ics
Healt
h
Coun
trysid
eTr
ansp
ort
Recr
eatio
n &
cultu
re
Hous
ing,
fuel(n
et)1
&
powe
r
Misc
ellan
eous
go
ods
& se
rvice
s
Rest
aura
nts
& ho
tels
Hous
ehold
go
ods
& se
rvice
s
Clot
hing
& foo
twea
rEd
ucat
ionCo
mm
unica
tion
Healt
h
Pros
perin
g su
burb
sTr
ansp
ort
Recr
eatio
n &
cultu
re
Food
& n
on-
alcoh
olic
drink
s
Hous
ing,
fuel(n
et)1 &
po
wer
Rest
aura
nts
& ho
tels
Hous
ehold
go
ods
& se
rvice
s
Clot
hing
& foo
twea
rCo
mm
unica
tion
Alco
holic
dr
inks,
toba
cco
& na
rcot
ics
Educ
ation
Cons
train
ed
by
circ
umsta
nces
Hous
ing,
fuel(n
et)1 &
po
wer
Food
& n
on-
alcoh
olic
drink
s
Recr
eatio
n &
cultu
re
Tran
spor
tRe
stau
rant
s &
hote
lsM
iscell
aneo
us
good
s &
servi
ces
Hous
ehold
go
ods
& se
rvice
s
Clot
hing
& foo
twea
rAl
coho
lic d
rinks
, to
bacc
o &
narc
otics
Com
mun
icatio
nHe
alth
Educ
ation
Typi
cal T
raits
Tran
spor
tHo
using
, fue
l(net
)1 &
powe
r
Food
& n
on-
alcoh
olic
drink
s
Rest
aura
nts
& ho
tels
Misc
ellan
eous
go
ods
& se
rvice
s
Hous
ehold
go
ods
& se
rvice
s
Clot
hing
& foo
twea
rCo
mm
unica
tion
Alco
holic
dr
inks,
toba
cco
& na
rcot
ics
Educ
ation
Healt
h
Mul
ticul
tura
l Ho
using
, fue
l(net
)1 &
powe
r
Tran
spor
tRe
crea
tion
& cu
lture
Re
stau
rant
s &
hote
lsM
iscell
aneo
us
good
s &
servi
ces
Hous
ehold
go
ods
& se
rvice
s
Clot
hing
& foo
twea
rCo
mm
unica
tion
Educ
ation
Alco
holic
dr
inks,
toba
cco
& na
rcot
ics
Healt
h
1 Ex
cludin
g m
ortg
age
inter
est p
aym
ents
, cou
ncil t
ax a
nd N
orth
ern
Irelan
d ra
tes
Bold
font
sign
ifies
signif
icant
ly dif
feren
t exp
endit
ure
in 20
10Bl
ue in
crea
se in
201
0 fa
ll in
2010
k fo
nt s
ignifie
s no
cha
nge
R ecr
eatio
n &
cultu
re
Recr
eatio
n &
cultu
re
Hous
ehold
go
ods
& se
rvice
s
Recr
eatio
n &
cultu
re
Clot
hing
& foo
twea
r Co
mm
unica
tion
Food
& n
on-
alcoh
olic
drink
s
Alco
holic
dr
inks,
toba
cco
& na
rcot
ics
Misc
ellan
eous
go
ods
& se
rvice
s
Healt
h
Recr
eatio
n &
cultu
re
Food
& n
on-
alcoh
olic
drink
s
Red
Blac
98

Chapter 5: Impact of the recession on household expenditure Family Spending: 2011 Edition
Housing, fuel and power expenditure We first consider the COICOP expenditure items that make up the greatest proportion of expenditure for both years for all groups. Housing, fuel and power expenditure (Figure 5.5) increased for all groups in 2010, but only significantly so for Blue Collar Communities (from £47.90 to £53.50) and Typical Traits (from £56.30 to £52.50). In 2007 expenditure on this item made up 14.2 per cent of the total Blue Collar Communities super group expenditure, increasing to 16 per cent in 2010. For Typical Traits, the percentage of total expenditure spent increased from 12.5 per cent to 14.3 per cent. Households are also likely to be fairly limited in their ability to look for alternatives for these items following price increases, which is likely to have resulted in the increase observed.
Figure 5.5 Housing, fuel and power expenditure – percentage of total COICOP expenditure United Kingdom
0
5
10
15
20
25
Blue Collar
Com
munities
City Living
Countryside
ProsperingSuburbs
Constrained by
Circum
stances
Typical Traits
Multicultural
AverageH
ousehold
Per cent
20072010
We disaggregate this COICOP item further. Figure 5.6 presents weekly expenditure on rentals for housing, which makes-up a substantial element of total housing, fuel and power expenditure, although it should be noted that the rental market in the UK is fairly small. Significant real increases in 2010 expenditure, compared with 20079 were observed for Blue Collar Communities, Countryside, Constrained by Circumstances and Typical Traits. This impact was fairly consistent for the majority of super groups. It should be noted that rental expenditure is smaller for the Prospering Suburbs and Countryside super groups due to the increased likelihood that households in this category do not live in a rental property. Mortgage payments are not considered in the
Office for National Statistics
99

Chapter 5: Impact of the recession on household expenditure Family Spending: 2011 Edition
COICOP classification, as this is regarded as investment expenditure. Overall, this illustrates that some households renting property paid significantly more in 2010 compared with 2007 in real terms. Given the low interest rates during this period, those households with a variable rate mortgage are likely to have seen smaller increases in this key element of housing expenditure.
Figure 5.6 Actual rentals for housing (subset of housing fuel and power) weekly household expenditure (£) 2010 prices United Kingdom
0
20
40
60
80
100
Blue Collar
Com
munities
City Living
Countryside
ProsperingSuburbs
Constrained by
Circum
stances
Typical Traits
Multicultural
AverageH
ousehold
£ per week
20072010
We also consider water and miscellaneous services relating to the dwelling expenditure (Figure 5.7). Fewer changes are observed, although there was a significant fall for City Living and a significant increase for Multicultural in real terms. The miscellaneous service element is likely to explain the fall for City Living and the relatively greater amount spent on this item by this super group. City Living households are more likely to live in a rental property (Table 5.3 Family Spending 2010), and the miscellaneous services category includes ‘Other regular housing payments including service charge for rent’.
Office for National Statistics
100

Chapter 5: Impact of the recession on household expenditure Family Spending: 2011 Edition
Figure 5.7 Water and miscellaneous services relating to the dwelling (subset of housing fuel and power) weekly household expenditure (£) 2010 prices United Kingdom
0
2
4
6
8
10
12
14
16
Blue Collar
Com
munities
City Living
Countryside
ProsperingSuburbs
Constrained by
Circum
stances
Typical Traits
Multicultural
AverageH
ousehold
£ per week
20072010
Figure 5.8 presents household expenditure on electricity, gas and other fuels. Similar to rental expenditure, Figure 5.8 illustrates that expenditure on electricity, gas and other fuels increased fairly uniformly across super groups in 2010. Increases were significant for all super groups except Constrained by Circumstances. This is particularly interesting as this super group also spend less on electricity, gas and other fuels than any other super group. All households pay the same proportion of fuel duty per unit of fuel purchased, regardless of their income. Because lower income households pay proportionally more of their income on fuel duty, we may therefore, expect Constrained by Circumstances households, who are more likely to have lower household income, to economise on this item, as suggested here.
Office for National Statistics
101

Chapter 5: Impact of the recession on household expenditure Family Spending: 2011 Edition
Figure 5.8 Electricity, gas and other fuels (subset of housing fuel and power) weekly household expenditure (£) 2010 prices United Kingdom
0
5
10
15
20
25
30
35
Blue Collar
Com
munities
City Living
Countryside
ProsperingSuburbs
Constrained by
Circum
stances
Typical Traits
Multicultural
AverageH
ousehold
£ per week
20072010
Overall, the rise in housing, fuel and power expenditure can mostly be explained by increases in rent and fuel costs. In terms of fuel payments, with the exception of the Constrained by Circumstances super group, there is a fairly uniform impact. This reflects the fact that this is essential expenditure, and households will have had limited opportunities to switch to cheaper alternatives when price increases above general inflation were observed across suppliers. For Constrained by Circumstances there appears to have been some economising on fuel in 2010, possibly as a response to fuel price increases over the period.
Transport expenditure Transport costs expenditure (Figure 5.9), which also makes up a large percentage of total COICOP expenditure for many, did not change significantly at the average household level. However, it increased significantly in 2010 for the Multicultural super group, making up 12.5 per cent of this group’s total expenditure in 2007 rising to 14.9 per cent in 2010. For many other super groups however, transport expenditure fell in 2010. We examine further to see if disaggregating transport expenditure reveals any other impacts.
Office for National Statistics
102

Chapter 5: Impact of the recession on household expenditure Family Spending: 2011 Edition
Figure 5.9 Transport expenditure percentage of total COICOP expenditure United Kingdom
02468
101214161820
Blue Collar
Com
munities
City Living
Countryside
ProsperingSuburbs
Constrained by
Circum
stances
Typical Traits
Multicultural
AverageH
ousehold
Per cent
20072010
Many households may be able to substitute one form of transport for another. We therefore examine transport expenditure more closely. The Vehicle Scrappage Scheme, which subsidised the purchase of new cars, ran from May 2009 to March 2010. This is likely to have resulted in an increase in the purchase of new vehicles in the first quarter of 2010, but we would expect this to be partially offset by a fall in purchases immediately after the scheme expired. We are unable to examine this more closely because LCF data are annual. However, when interpreting these results, the existence of this scheme should be considered.
Office for National Statistics
103

Chapter 5: Impact of the recession on household expenditure Family Spending: 2011 Edition
Office for National Statistics
Figure 5.10 Purchase of vehicles (subset of transport) weekly household expenditure (£) 2010 prices United Kingdom
0
5
10
15
20
25
30
35
40
45
Blue Collar
Com
munities
City Living
Countryside
ProsperingS
uburbs
Constrained by
Circum
stances
Typical Traits
Multicultural
Average
Household
£ per week
20072010
Many differences by OAC super group are highlighted. For instance, in 2010 there was a
el r
significant fall in the amount spent on Vehicle Purchase for Countryside, Typical Traits andProspering Suburbs (Figure 5.10). Countryside and Prospering Suburbs super groups then significantly increased their expenditure on operation of personal transport, which includes fu(Figure 5.11). This suggests that in the face of rising fuel prices, these super groups altered theiexpenditure so that the increase in fuel payments was partially offset by spending less on vehicle purchases.
104

Chapter 5: Impact of the recession on household expenditure Family Spending: 2011 Edition
Figure 5.11 Operation of personal transport (subset of transport) weekly household expenditure (£) 2010 prices United Kingdom
0
10
20
30
40
50
60
Blue Collar
Com
munities
City Living
Countryside
ProsperingSuburbs
Constrained by
Circum
stances
Typical Traits
Multicultural
AverageH
ousehold
£ per week
20072010
There were also significant increases in transport services expenditure, which includes public transport (Figure 5.12) for Typical Traits and Multicultural super groups. The increase in transport services expenditure by the Multicultural super group is particularly large, and closer examination reveals this increase to be largely down to an increase in international air fare expenditure. This is particularly interesting, as this element of expenditure could be considered essential by the Multicultural household super group. In the face of rising air fare prices above general inflation, visiting family and friends abroad is likely to be an essential component of the Multicultural super group outgoings. Other household super groups may be able to reduce this element of discretionary expenditure following price increases. Increases in air fuel duty will therefore have had a greater impact upon the Multicultural super group.
Office for National Statistics
105

Chapter 5: Impact of the recession on household expenditure Family Spending: 2011 Edition
Figure 5.12 Transport services (subset of transport) weekly household expenditure (£) 2010 prices United Kingdom
0
5
10
15
20
25
30
Blue Collar
Com
munities
City Living
Countryside
ProsperingSuburbs
Constrained by
Circum
stances
Typical Traits
Multicultural
AverageH
ousehold
£ per week
20072010
It is likely that changes in transport expenditure were observed partly as a result of changing fuel prices. Countryside and Prospering Suburbs appear to have continued to use personal transport, spending more on operation but spending less on purchasing vehicles. Conversely, Typical Traits and Multicultural reduced the amount spent on personal, private transport and increased their consumption of public transport services.
Overall, although there were few significant differences in overall transport expenditure by OAC super group, closer examination reveals there to be significant differences in the composition of this expenditure during the recession. While Countryside and Prospering Suburbs super groups have limited options and spent more on personal private transport, spending more on fuel but partially offsetting by spending less on vehicle purchases, Typical Traits and Multicultural super groups reduced private transport expenditure and spent more on public transport services. This supports the suggestion that although the average household may not have significantly altered their expenditure on main COICOP items, there may be differences in expenditure when we disaggregate. Households may reallocate their expenditure between general COICOP items. The ability for this type of reallocation depends upon household characteristics. The recession, while not appearing to have had a substantial impact upon overall COICOP expenditure for the average household, may have altered expenditure patterns in complex ways that are largely determined by specific household characteristics.
Office for National Statistics
106

Chapter 5: Impact of the recession on household expenditure Family Spending: 2011 Edition
Recreation and culture expenditure Recreation and culture expenditure makes up a similar proportion of total COICOP expenditure as some of the necessity items for the average household (£58.10 in 2010, which is very similar to the £53.20 spent on food). This supports the earlier suggestion that what may once have been considered discretionary items are now considered essential. Table 5.6 illustrates that this item makes up the second largest expenditure component in 2010 for Countryside and Prospering Suburbs. Interestingly, although recreation and culture expenditure remained the second largest expenditure item for Prospering Suburbs, Figure 5.13 shows the expenditure on recreation and culture as a proportion of total expenditure in 2007 and 2010. The mean amount spent on these items by this super group fell significantly in 2010 (from £79.40 to £73.20). There was also a statistically significant fall in the amount spent by Typical Traits (from £65.40 to £53.70). In terms of recreation and culture expenditure therefore, the amount spent fell in 2010 for many super groups. We may however, have expected a greater fall in expenditure for this traditionally non-essential item.
Figure 5.13 Recreation and culture expenditure percentage of total COICOP expenditure United Kingdom
0
2
4
6
8
10
12
14
16
18
Blue C
ollarC
omm
unities
City Living
Countryside
ProsperingS
uburbs
Constrained by
Circum
stances
Typical Traits
Multicultural
AverageH
ousehold
Per cent20072010
We investigate this possibility further by disaggregating recreation and culture expenditure to see if households made changes within the recreation and culture category. This reveals a significant fall in expenditure on package holidays abroad by the Prospering Suburbs and City Living super groups (Figure 5.14). In addition, for Prospering Suburbs, there was a significant fall for sports admissions, subscriptions, leisure class fees and equipment hire (Figure 5.15). In contrast, for the
Office for National Statistics
107

Chapter 5: Impact of the recession on household expenditure Family Spending: 2011 Edition
Office for National Statistics
City Living super group, there was a significant increase in this type of expenditure in 2010. This indicates that there is a degree of item selection within the recreation category, with the details of this differing by complex household circumstances and preferences.
Figure 5.14 Package holidays abroad (subset of recreation and culture) weekly household expenditure (£) 2010 prices United Kingdom
0
5
10
15
20
25
Blue Collar
Com
munities
City Living
Countryside
ProsperingSuburbs
Constrained by
Circum
stances
Typical Traits
Multicultural
AverageH
ousehold
£ per week2007
2010
Figure 5.15 Sports admissions, subscriptions, leisure class fees and
equipment hire (subset of recreation and culture) weekly household expenditure 2010 prices United Kingdom
0123456789
10
Blue Collar
Com
munities
City Living
Countryside
ProsperingSuburbs
Constrained by
Circum
stances
Typical Traits
Multicultural
AverageH
ousehold
£ per week
2007
2010
108

Chapter 5: Impact of the recession on household expenditure Family Spending: 2011 Edition
Restaurants and hotels expenditure Some significant differences by OAC super group were also observed for restaurant and hotel expenditure (Figure 5.16). These traditionally non-essential items typically rank fifth in terms of amount spent. Significant falls in expenditure, comparing 2010 with 2007, were observed for Countryside (falling from £45.20 to £40.70), Multicultural (from £38.80 to £36.50), and Typical Traits (from £38.80 to £36.50). However, this item did not change the rank in terms of proportion spent for any of these groups, which is surprising. Again, it could be that this item is no longer considered discretionary by many groups.
Figure 5.16 Restaurants and hotels expenditure percentage of total COICOP expenditure United Kingdom
0
2
4
6
8
10
12
Blue C
ollarC
omm
unities
City Living
Countryside
ProsperingS
uburbs
Constrained by
Circum
stances
Typical Traits
Multicultural
AverageH
ousehold
Per cent20072010
We investigate further to see if there are any within-group expenditure changes. When we do this, we do find further differences by OAC super group. For instance, the amount spent on takeaway meals eaten at home fell significantly for Constrained by Circumstances and Typical Traits (Figure 5.17). The amount spent on alcoholic drinks away from home also fell for Countryside, Constrained by Circumstances and Typical Traits (Figure 5.18), although it should be noted that such expenditure is prone to under-reporting.
Office for National Statistics
109

Chapter 5: Impact of the recession on household expenditure Family Spending: 2011 Edition
Office for National Statistics
Figure 5.17 Takeaway meals eaten at home (subset of restaurants and hotels) weekly household expenditure (£) 2010 prices United Kingdom
0
1
2
3
4
5
6
Blue C
ollarC
omm
unities
City Living
Countryside
ProsperingSuburbs
Constrained by
Circum
stances
Typical Traits
Multicultural
AverageH
ousehold
£ per week
20072010
Figure 5.18 Alcoholic drinks away from home (subset of restaurants
and hotels) weekly household expenditure (£) 2010 prices United Kingdom
0
2
4
6
8
10
12
14
Blue Collar
Com
munities
City Living
Countryside
ProsperingSuburbs
Constrained by
Circum
stances
Typical Traits
Multicultural
AverageH
ousehold
£ per week
2007
2010
110

Chapter 5: Impact of the recession on household expenditure Family Spending: 2011 Edition
Overall, there are fewer changes than expected in restaurant and hotel expenditure. It appears that rather than significantly reduce the total amount spent, many households have instead chosen to reallocate expenditure between these types of items, perhaps to gain more value for their money in the face of rising prices and stagnant wage growth. This appears to be particularly true for the Constrained by Circumstances and Typical Traits super groups.
Household goods and services Household goods and services expenditure ranks seventh in terms of relative amount spent for all groups in 2010. The only statistically significant change comparing 2010 with 2007 is a fall for Blue Collar Communities, where the amount spent fell from £29.60 to £22.40 (Figure 5.19). Further examination reveals that a large proportion of this expenditure fall for this group was due to a significant fall in household appliances expenditure (Figure 5.20). When we examine tools and equipment for house and garden expenditure, significant falls in 2010 expenditure are observed for Typical Traits and Constrained by Circumstances (Figure 5.21)
Figure 5.19 Household goods and services expenditure percentage of total COICOP expenditure United Kingdom
0
1
2
3
4
5
6
7
8
9
10
Blue Collar
Com
munities
City Living
Countryside
ProsperingSuburbs
Constrained by
Circum
stances
Typical Traits
Multicultural
AverageH
ousehold
Per cent2007
2010
Office for National Statistics
111

Chapter 5: Impact of the recession on household expenditure Family Spending: 2011 Edition
Office for National Statistics
Figure 5.20 Household appliances (subset of household goods and furnishings) weekly household expenditure (£) 2010 prices United Kingdom
0
1
2
3
4
5
6
7
Blue Collar
Com
munities
City Living
Countryside
ProsperingSuburbs
Constrained by
Circum
stances
Typical Traits
Multicultural
AverageH
ousehold
£ per week
2007
2010
Figure 5.21 Tools and equipment for house and garden (subset of household goods and services) weekly household expenditure (£) 2010 prices United Kingdom
0
1
2
3
4
5
Blue C
ollarC
omm
unities
City Living
Countryside
ProsperingSuburbs
Constrained by
Circum
stances
Typical Traits
Multicultural
AverageH
ousehold
£ per week
20072010
112

Chapter 5: Impact of the recession on household expenditure Family Spending: 2011 Edition
COICOP items with no significant change For several COICOP expenditure items, there is no significant change in expenditure from 2007 to 2010 for any OAC super group. For instance, there were no significant changes in communication, health, and alcoholic drinks, tobacco and narcotics (although this is often under-reported) expenditure. These items could be considered non-essential. In addition, total expenditure for these items is relatively small for each group for both years examined, and they also make up a small proportion of total COICOP expenditure in 2010 as illustrated by Table 5.6. Households did not significantly change their expenditure on these items during the recession, which goes against expectations, as we would on average expect households to reduce non-essential item expenditure during uncertain economic conditions.
Figure 5.22 Alcoholic drinks (subset of alcoholic drinks, tobacco and narcotics) weekly household expenditure (£) 2010 prices United Kingdom
0
2
4
6
8
10
12
Blue C
ollarC
omm
unities
City Living
Countryside
ProsperingS
uburbs
Constrained by
Circum
stances
Typical Traits
Multicultural
Average
Household
£ per week
20072010
When we disaggregate expenditure on these COICOP items, we again find few differences in mean expenditure between 2007 and 2010. The only significant change is observed for alcohol expenditure (disaggregating the alcohol, tobacco and narcotics category), with a significant increase observed for the Multicultural super group in 2010, as shown in Figure 5.22. However, these results should be interpreted with caution, as there is thought to be under-reporting in this expenditure category.
Office for National Statistics
113

Chapter 5: Impact of the recession on household expenditure Family Spending: 2011 Edition
Figure 5.23 Clothing and footwear expenditure percentage of total COICOP expenditure United Kingdom
012345678
Blue C
ollarC
omm
unities
City Living
Countryside
ProsperingS
uburbs
Constrained by
Circum
stances
Typical Traits
Multicultural
Average
Household
Per cent20072010
Figure 5.24 Footwear (subset of clothing and footwear) weekly household expenditure (£) 2010 prices United Kingdom
0
1
2
3
4
5
6
7B
lue Collar
Com
munities
City Living
Countryside
ProsperingS
uburbs
Constrained by
Circum
stances
Typical Traits
Multicultural
Average
household
£ per week20072010
Office for National Statistics
114
Chapter 5: Impact of the recession on household expenditure Family Spending: 2011 Edition
Household mean expenditure on food and non-alcoholic drinks, and clothing and footwear (Figure 5.23), also exhibit no significant change for any super group. There is also limited change in their order of total expenditure for each group, with food typically the third greatest expenditure item, and clothing typically the eighth largest. However, these are essential items, so we would not necessarily expect to see large changes in expenditure, even during a recession. Disaggregating clothing and footwear expenditure however, we do find a significant fall in 2010 footwear expenditure for Blue Collar Communities (Figure 5.24).
Overall, when we examine expenditure by OAC super group, we do find some significant changes in household expenditure comparing 2007 with 2010. This is consistent with evidence reported elsewhere that although the recession had little impact on disposable income for the average household, this impact is disproportionate. The impact upon a particular household will depend upon a combination of many factors, including working status, tenure, number of children and preferences for products. Therefore, when we disaggregate COICOP items, we find within-category differences by group. Although households’ overall expenditure on particular items may have remained unchanged, this analysis suggests households reallocate expenditure within some COICOP categories, presumably to gain the most value in the face of changing economic conditions. Households’ ability to reallocate expenditure will very much depend upon circumstances. For instance Countryside are limited in their ability to move from private to public transport, which is why we observe differences when we disaggregate transport expenditure by OAC super group.
COICOP expenditure by OAC group
Overall COICOP Expenditure Our analysis so far has illustrated that our ability to assess the impact of the recession upon households appears to depend upon how specifically households are defined, with examination at the average household level masking complex differences. We therefore disaggregate the OAC super groups further to see if more differences are observed. The groups in each super group and the percentage of each category in the sample are listed in Table 5.2. Mean weekly household expenditure for each COICOP item and OAC group are reported in Table 5.7 for 2010 and Table 5.8 for 2007 (in 2010 prices).
Office for National Statistics
115

Chapter 5: Impact of the recession on household expenditure Family Spending: 2011 Edition
Table 5.7 Mean COICOP weekly household expenditure (£) by OAC group 2010 United Kingdom
Terraced Blue Collar
Younger B
lue Collar
Older Blue C
ollar
Transient C
omm
unities
Settled in the City
Village Life
Agricultural
Accessible C
ountryside
Prospering Younger Fam
ilies
Prospering Older
Families
Prospering sem
is
Com m odity or service
Food & non-alcoholic drinks 47.60 50.00 50.80 44.70 49.70 58.70 59.50 60.80 65.60 61.60 56.80
Alcoholic drinks , tobacco & narcotics 13.10 15.50 11.20 8.70 11.70 14.40 14.50 12.80 10.80 11.00 10.20
Clothing & footwear 21.50 18.10 20.90 26.30 25.40 20.50 17.50 23.80 31.00 29.00 23.00
Hous ing(net)1, fuel & power 52.70 59.70 49.70 149.80 97.20 59.00 62.90 62.00 47.90 50.50 45.20
Household goods & services 27.70 16.60 24.10 18.40 50.40 38.50 34.60 43.60 41.70 41.30 33.60
Health 2.10 3.40 3.90 5.50 6.30 4.50 5.30 6.50 5.10 7.20 5.30
Transport 46.20 39.60 64.70 58.20 63.20 83.80 79.60 85.20 89.10 85.60 70.70
Com m unication 12.40 13.10 11.50 15.00 13.10 14.60 11.00 14.20 14.50 12.90 13.10
Recreation & culture 43.40 41.90 60.60 39.30 53.10 81.10 73.40 84.50 79.80 81.00 61.50
Education 2.60 0.90 1.50 36.30 30.10 10.20 20.30 19.40 5.50 4.20 7.00
Res taurants & hotels 26.30 26.80 34.80 51.80 51.20 37.40 38.80 44.00 48.00 49.80 40.70
Miscellaneous goods & services 20.80 22.90 31.50 40.50 42.90 46.30 40.30 48.80 50.50 46.80 34.50
Thriving suburbs
Senior Com
munities
Older W
orkers
Public Housing
Settled
Households
Least Divergent
Young Families in
Terraced Homes
Aspiring
Households
Asian Com
munities
Afro-Caribbean
Comm
unities
Com m odity or service
Food & non-alcoholic drinks 61.90 32.40 42.70 39.90 53.00 54.80 45.10 54.70 60.80 47.90
Alcoholic drinks , tobacco & narcotics 12.30 11.30 10.50 14.50 10.40 13.30 10.90 11.00 10.30 8.90
Clothing & footwear 24.20 11.00 17.10 13.70 25.50 26.20 19.30 27.20 26.30 23.20
Hous ing(net)1, fuel & power 53.40 55.30 51.70 47.80 46.10 56.50 60.30 66.00 78.00 91.10
Household goods & services 52.80 16.20 21.10 15.30 39.70 24.50 33.10 24.10 24.90 26.60
Health 8.50 2.70 2.90 1.20 6.50 7.10 3.30 4.20 6.10 6.50
Transport 102.70 19.30 37.30 31.60 63.60 74.90 48.20 73.20 69.90 51.80
Com m unication 13.80 8.20 9.50 11.70 13.20 12.90 12.70 14.90 15.00 17.50
Recreation & culture 77.50 20.80 40.10 39.40 64.10 56.20 39.20 57.20 48.50 52.00
Education 17.30 0.90 2.30 0.40 6.60 7.20 1.30 34.40 11.20 14.70
Res taurants & hotels 55.70 17.30 26.70 22.40 39.90 38.50 30.50 50.10 38.20 50.10
Miscellaneous goods & services 51.70 12.50 21.30 24.50 46.10 35.60 26.70 39.90 33.70 31.30
1 Excluding m ortgage interes t paym ents , council tax and Northern Ireland rates
Average weekly household expenditure
Average weekly household expenditure
Office for National Statistics
116

Chapter 5: Impact of the recession on household expenditure Family Spending: 2011 Edition
Table 5.8 Mean COICOP weekly household expenditure (£) by OAC group 2007 2010 prices United Kingdom
Terraced Blue Collar
Younger Blue Collar
Older Blue Collar
Transient Com
munities
Settled in the C
ity
Village Life
Agricultural
Accessible
Countryside
Prospering Younger Fam
ilies
Prospering O
lder Fam
ilies
Prospering semis
Com m odity or service
Food & non-alcoholic drinks 50.50 48.80 49.80 38.30 49.00 54.80 59.70 60.00 62.50 59.60 55.30
Alcoholic drinks , tobacco & narcotics 13.80 14.90 12.70 11.00 11.50 14.30 15.80 13.40 13.60 11.30 9.70
Clothing & footwear 19.50 17.60 23.10 15.40 30.40 22.10 23.10 22.30 31.20 27.20 23.60
Hous ing(net)1, fuel & power 48.80 47.40 48.00 106.30 99.80 57.20 61.00 52.90 47.70 45.70 40.10
Household goods & services 30.90 19.30 39.90 22.10 34.50 46.20 42.90 39.70 39.60 39.30 29.60
Health 2.40 2.40 4.70 5.00 11.10 6.50 14.30 8.70 13.70 6.90 6.70
Transport 42.20 48.30 57.10 57.60 64.80 78.10 97.80 94.00 98.40 91.60 70.60
Com m unication 13.20 11.70 11.50 11.90 14.20 12.90 13.10 13.50 15.80 12.80 11.90
Recreation & culture 53.10 45.80 53.50 43.20 66.30 73.50 102.60 71.70 85.50 88.10 74.00
Education 2.00 5.10 1.60 7.80 14.20 6.30 10.80 22.40 8.60 4.00 6.10
Restaurants & hotels 25.80 32.30 32.40 47.70 48.50 42.60 39.80 52.40 59.60 46.10 41.10
Miscellaneous goods & services 27.20 25.40 32.00 40.00 40.10 43.80 48.10 51.40 53.20 52.50 40.60
Thriving suburbs
Senior Com
munities
Older W
orkers
Public Housing
Settled Households
Least Divergent
Young Fam
ilies in Terraced H
omes
Aspiring Households
Asian Com
munities
Afro-C
aribbean Com
munities
Com m odity or service
Food & non-alcoholic drinks 60.70 34.40 40.80 45.40 53.40 52.90 45.20 56.00 50.70 48.50
Alcoholic drinks , tobacco & narcotics 11.90 9.00 13.00 15.90 11.20 10.30 12.20 13.40 9.50 7.60
Clothing & footwear 30.20 13.00 14.40 16.90 30.60 21.50 19.50 28.10 30.30 20.50
Hous ing(net)1, fuel & power 62.90 41.50 47.50 48.90 44.50 52.60 56.80 57.20 65.00 88.60
Household goods & services 45.10 19.90 19.40 25.20 37.50 41.20 26.40 37.50 30.50 24.00
Health 12.10 8.60 3.30 2.00 4.30 4.60 4.60 6.30 4.20 5.50
Transport 110.90 23.10 36.90 41.20 70.30 67.60 54.90 92.90 52.40 40.10
Com m unication 13.40 8.20 10.60 9.40 13.90 12.40 11.90 14.70 15.00 13.50
Recreation & culture 75.40 31.20 38.40 47.00 70.40 66.80 51.60 71.80 46.90 37.00
Education 16.90 0.80 2.20 0.00 7.00 3.20 2.00 8.90 11.90 14.50
Restaurants & hotels 49.10 20.40 24.70 25.70 44.30 39.50 41.00 51.60 38.60 33.00
Miscellaneous goods & services 52.50 14.70 23.20 25.10 40.10 43.40 30.80 39.50 38.80 26.50
1 Excluding mortgage interes t paym ents , council tax and Northern Ireland rates
Average weekly household expenditure (£)
Average weekly household expenditure (£)
Office for National Statistics
117

Chapter 5: Impact of the recession on household expenditure Family Spending: 2011 Edition
COICOP items with no significant OAC super group change We first consider the expenditure items where no significant change was observed by OAC super group. This was the case with food and non-alcoholic drinks expenditure. When we examine changes by OAC group, we find only a small but significant increase for Asian Communities. There are also no significant differences in clothing expenditure. This is consistent with expectations: substitution within these essential broad-based COICOP items is difficult for all households, regardless of their circumstances. We may observe substitution between brands during recession, but we are unable to examine this using the LCF Survey data.
When we consider traditionally non-essential COICOP items however, we do begin to see differences. For instance, alcohol and tobacco expenditure did not change significantly at the super group level, but when we disaggregate, there is a significant fall for Prospering Younger Families and a significant increase for Older Workers. For less essential items, we do begin to see changes in expenditure when we define household characteristics more closely. No significant changes in communication expenditure were observed for the average household, or at the super group level. However, when we examine at group level as illustrated by Figure 5.25, we observe significant increases in 2010 expenditure for Transient Communities and Afro-Caribbean Communities. Conversely, there is a significant fall in communication expenditure for Older Workers. The increases are likely to be as a result of technological change, with certain groups keen to increase their expenditure following communication innovations. However, this is not the case for all households, as illustrated by the fall in expenditure for Older Workers
Figure 5.25 Communication weekly household expenditure (£) by OAC group 2010 prices United Kingdom
02468
101214161820
Terraced Blue C
ollar
Younger B
lue Collar
Older B
lue Collar
Transient Com
munities
Settled in the C
ity
Village Life
Agricultural
Accessible C
ountryside
Prospering Y
ounger Families
Prospering O
lder Families
Prospering S
emis
Thriving Suburbs
Senior C
omm
unities
Older W
orkers
Public H
ousing
Settled H
ouseholds
Least Divergent
Young Fam
ilies in TerracedH
omes
Aspiring H
ouseholds
Asian C
omm
unities
Afro-C
aribbean Com
munities
£ per week
20072010
Office for National Statistics
118

Chapter 5: Impact of the recession on household expenditure Family Spending: 2011 Edition
We also examine if there are differences by OAC group for recreation expenditure. Although we observed some significant falls in 2010 for some super groups, there were not as many as may have been expected for these traditionally non-essential items. Figure 5.26 illustrates there are lots of differences in 2010 expenditure, with significant falls for Prospering Semis and Young Families in Terraced Homes, and significant increase for Afro-Caribbean Communities. Many of the differences observed are insignificant, possibly due to the reduced sample size we have for each OAC group following this more detailed disaggregation. The fact that many more differences in recreation expenditure are observed when we define household characteristics more specifically however, illustrates how important it is to consider these to appreciate the full impact of the recession on household expenditure.
Figure 5.26 Recreation and culture weekly household expenditure (£) by OAC group 2010 prices United Kingdom
0
20
40
60
80
100
120
Terraced Blue C
ollar
Younger B
lue Collar
Older B
lue Collar
Transient Com
munities
Settled in the C
ity
Village Life
Agricultural
Accessible Countryside
Prospering Y
ounger Families
Prospering O
lder Families
Prospering S
emis
Thriving Suburbs
Senior C
omm
unities
Older W
orkers
Public H
ousing
Settled H
ouseholds
Least Divergent
Young Fam
ilies in Terraced
Hom
es
Aspiring H
ouseholds
Asian C
omm
unities
Afro-C
aribbean Com
munities
£ per week
20072010
Similarly for restaurant and hotel expenditure, there are lots of differences at group level, but only a few are significant, again possibly due to the reduced sample size at this level of OAC disaggregation. Figure 5.27 illustrates there are significant falls for Accessible Countryside, Prospering Younger Families, and Younger Families in Terraced Homes. We also observe a significant increase for Afro-Caribbean Communities.
Office for National Statistics
119

Chapter 5: Impact of the recession on household expenditure Family Spending: 2011 Edition
Figure 5.27 Restaurant and hotel weekly household expenditure (£) by OAC group 2010 prices United Kingdom
0
10
20
30
40
50
60
70
Terraced Blue C
ollar
Younger B
lue Collar
Older B
lue Collar
Transient Com
munities
Settled in the C
ity
Village Life
Agricultural
Accessible C
ountryside
Prospering Y
ounger Families
Prospering O
lder Families
Prospering S
emis
Thriving Suburbs
Senior C
omm
unities
Older W
orkers
Public H
ousing
Settled H
ouseholds
Least Divergent
Young Fam
ilies in TerracedH
omes
Aspiring H
ouseholds
Asian C
omm
unities
Afro-C
aribbean Com
munities
£ per week20072010
At the super group level, we observed a significant fall in 2010 furnishings, household equipment and carpets expenditure for Blue Collar Communities. When we disaggregate this, we find further significant differences, as illustrated by Figure 5.28. Significant falls are found for Older Blue Collar, Public Housing, Least Divergent, and Aspiring Households. This supports the idea that the average impact does not present us with the full effect upon expenditure for many households.
Office for National Statistics
120

Chapter 5: Impact of the recession on household expenditure Family Spending: 2011 Edition
Figure 5.28 Household goods and services weekly household expenditure (£) by OAC group 2010 prices United Kingdom
0
10
20
30
40
50
60
Terraced Blue C
ollar
Younger B
lue Collar
Older B
lue Collar
Transient Com
munities
Settled in the C
ity
Village Life
Agricultural
Accessible C
ountryside
Prospering Y
ounger Families
Prospering O
lder Families
Prospering S
emis
Thriving Suburbs
Senior C
omm
unities
Older W
orkers
Public H
ousing
Settled H
ouseholds
Least Divergent
Young Fam
ilies in Terraced
Hom
es
Aspiring H
ouseholds
Asian C
omm
unities
Afro-C
aribbean Com
munities
£ per week
20072010
COICOP items with significant OAC super group changes We also examine whether or not there are any changes at the super group level for those COICOP items where we observe the most differences comparing 2007 and 2010 expenditure at the group level. For instance we observed many differences in transport expenditure between groups. Figure 5.29 presents mean weekly household expenditure at the group level. This illustrates the large variation in transport expenditure between groups. In addition, significant increases in 2010 expenditure were observed for Asian and Afro-Caribbean Communities. This is consistent with earlier findings, where we reported a significant rise in transport expenditure for the Multicultural super group, mostly attributable to an increase in air fare expenditure. This further examination illustrates this rise was consistent across both Multicultural groups. In addition, a significant fall in 2010 transport expenditure was reported for Prospering Younger Families. Although falls are also observed for other Prospering Suburbs super groups, namely Prospering Older Families and Thriving Suburbs, they are not significant. Transport expenditure for the remaining Prospering Suburbs super group, Prospering Semis is relatively unchanged in 2010. Examining at the group level therefore, allows us to define more closely the type of household that reduced their transport expenditure over this period.
Office for National Statistics
121

Chapter 5: Impact of the recession on household expenditure Family Spending: 2011 Edition
Figure 5.29 Transport weekly household expenditure (£) by OAC group 2010 prices United Kingdom
0.00
20.00
40.00
60.00
80.00
100.00
120.00
Terraced Blue C
ollar
Younger B
lue Collar
Older B
lue Collar
Transient Com
munities
Settled in the C
ity
Village Life
Agricultural
Accessible Countryside
Prospering Y
ounger Families
Prospering O
lder Families
Prospering S
emis
Thriving Suburbs
Senior C
omm
unities
Older W
orkers
Public H
ousing
Settled H
ouseholds
Least Divergent
Young Fam
ilies in TerracedH
omes
Aspiring H
ouseholds
Asian C
omm
unities
Afro-C
aribbean Com
munities
£ per week20072010
We also examine housing, fuel and power expenditure at the group level. We observed significant expenditure increases for this COICOP item for the Blue Collar Communities and Typical Traits super groups comparing 2007 with 2010 expenditure. Figure 5.30 illustrates changes at the OAC group level. Significant increases in 2010 expenditure are observed for Younger Blue Collar Workers but not for the other Blue Collar Communities super groups where small insignificant increases in expenditure are reported. For the groups within the Typical Traits super group category, small increases are observed but none are significant. We do, however, observe significant increases for groups where no overall super group significant change was observed. Within the City Living category, a significant increase is reported for the Transient Communities group. Significant increases are also observed for Accessible Countryside (within the Countryside super group) and Senior Communities (within the Constrained by Circumstances super group). Analysis at the group level was therefore masking these impacts.
Office for National Statistics
122
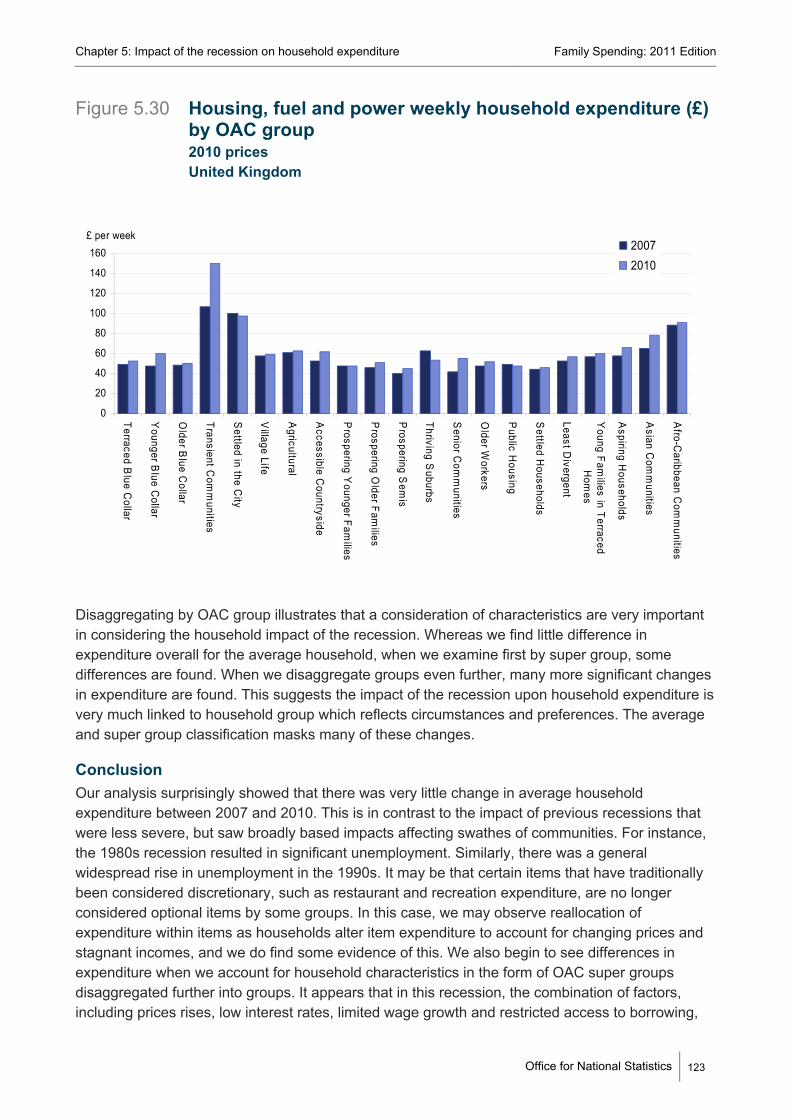
Chapter 5: Impact of the recession on household expenditure Family Spending: 2011 Edition
Figure 5.30 Housing, fuel and power weekly household expenditure (£) by OAC group 2010 prices United Kingdom
0
20
40
60
80
100
120
140
160
Terraced Blue C
ollar
Younger B
lue Collar
Older B
lue Collar
Transient Com
munities
Settled in the C
ity
Village Life
Agricultural
Accessible C
ountryside
Prospering Y
ounger Families
Prospering O
lder Families
Prospering S
emis
Thriving Suburbs
Senior C
omm
unities
Older W
orkers
Public H
ousing
Settled H
ouseholds
Least Divergent
Young Fam
ilies in TerracedH
omes
Aspiring H
ouseholds
Asian C
omm
unities
Afro-C
aribbean Com
munities
£ per week 20072010
Disaggregating by OAC group illustrates that a consideration of characteristics are very important in considering the household impact of the recession. Whereas we find little difference in expenditure overall for the average household, when we examine first by super group, some differences are found. When we disaggregate groups even further, many more significant changes in expenditure are found. This suggests the impact of the recession upon household expenditure is very much linked to household group which reflects circumstances and preferences. The average and super group classification masks many of these changes.
Conclusion Our analysis surprisingly showed that there was very little change in average household expenditure between 2007 and 2010. This is in contrast to the impact of previous recessions that were less severe, but saw broadly based impacts affecting swathes of communities. For instance, the 1980s recession resulted in significant unemployment. Similarly, there was a general widespread rise in unemployment in the 1990s. It may be that certain items that have traditionally been considered discretionary, such as restaurant and recreation expenditure, are no longer considered optional items by some groups. In this case, we may observe reallocation of expenditure within items as households alter item expenditure to account for changing prices and stagnant incomes, and we do find some evidence of this. We also begin to see differences in expenditure when we account for household characteristics in the form of OAC super groups disaggregated further into groups. It appears that in this recession, the combination of factors, including prices rises, low interest rates, limited wage growth and restricted access to borrowing,
Office for National Statistics
123

Chapter 5: Impact of the recession on household expenditure Family Spending: 2011 Edition
Office for National Statistics
means that it is almost impossible to say what the impact of the recession is on a ‘typical’ household. The effect will depend very much upon household circumstances and consumption preferences. The finer our household classification, the more significant differences in expenditure we observe. Overall therefore, focus on one or other macroeconomic statistic is unlikely to tell us the household impact. To gain a fuller understanding, we need to take account of the complex combination of household circumstances and preferences. 1 Quarterly National Accounts q2 2011 (www.ons.gov.uk/ons/rel/naa2/quarterly-national-accounts/q2-2011/sbd-quarterly-national-accounts-q2-2011.pdf) 2 Chamberlain (2010) ‘Economic Review’, Economic and Labour Market Review, August 2010, pp. 6 3 ONS (2011) GDP Preliminary Estimates, q2 2011, (www.ons.gov.uk/ons/rel/gva/gross-domestic-product--preliminary-estimate/q2-2011/gross-domestic-product---preliminary-estimate-q2-2011.pdf) 4 ONS (2009), The Impact of the Recession on the Labour Market, chapter 2 (www.ons.gov.uk/ons/rel/lmac/impact-of-the-recession-on-the-labour-market/impact-of-the-recession-on-the-labour-market/impact-of-the-recession-on-the-labour-market---impact-of-the-recession-on-the-labour-market.pdf) 5 Jenkins (2010) ‘The Labour Market in the 1980s, 1990s and 2008/09 Recessions’, Economic and Labour Market Review, August 2010, pp.33 6 ‘Household Expenditure by Output Area Classification’, Family Spending: A Report on the 2009 Living Costs and Food Survey, 2010, pp. 99-105 7 Gregg and Wadsworth (2010) ‘Unemployment and Inactivity in the 2008/09 Recession’, Economic and Labour Market Review, August 2010, pp.44 8 Howell, Leaker and Barrett (2010) ‘Impact of the Recession in Households’, Economic and Labour Market Review, August 2010, pp.18 9 All statistics reported in this article have been deflated to reflect 2010 prices using All Items Retail Price Index data. We should be aware that the price of some goods will have increased at a greater rate relative to others, but this is not accounted for through the use of an All Items deflator. 10 ONS (2010) Impact of the Recession on Household Income, Expenditure and Saving (www.ons.gov.uk/ons/rel/naa2/quarterly-national-acounts/impact-of-the-recession/the-impact-of-the-recession-on-household-income-and-expenditure.pdf) 11 Significant throughout this article means statistically significant above the 10 per cent significance level. This has been calculated following the calculation of t statistics in Stata. 12 Jenkins, S et al. (2011) ‘The Great Recession and the Distribution of Household Income’ Report for Fondazione Rodoldo Debenedetti ( www.frdb.org/upload/file/report_1_palermo.pdf)
124