Impact of Solar Array Position on ISS Vehicle … pointed to the ram direction – however, the...
16
- 1 - Impact of Solar Array Position on ISS Vehicle Charging John Alred and Ronald Mikatarian The Boeing Company, Houston, Texas, United States of America and Steve Koontz NASA Johnson Space Center, Houston, Texas, United States of America I. Introduction The International Space Station (ISS), because of its large structure and high voltage solar arrays, has a complex plasma interaction with the ionosphere in low Earth orbit (LEO). This interaction of the ISS US Segment photovoltaic (PV) power system with the LEO ionospheric plasma produces floating potentials on conducting elements of the ISS structure relative to the local plasma environment. To control the ISS floating potentials, two Plasma Contactor Units (PCUs) are installed on the Z1 truss. Each PCU discharges accumulated electrons from the Space Station structure, thus reducing the potential difference between the ISS structure and the surrounding charged plasma environment. Operations of the PCUs were intended to keep the ISS floating potential to ±40 Volts (Reference 1). Exposed dielectric surfaces overlying conducting structure on the Space Station will collect an opposite charge from the ionosphere as the ISS charges. In theory, when an Extravehicular Activity (EVA) crewmember is tethered to structure via the crew safety tether or when metallic surfaces of the Extravehicular Mobility Unit (EMU) come in contact with conducting metallic surfaces of the ISS, the EMU conducting components, including the perspiration-soaked crewmember inside, can become charged to the Space Station floating potential. The concern is the potential dielectric breakdown of anodized aluminum surfaces on the EMU producing an arc from the EMU to the ambient plasma, or nearby ISS structure. If the EMU arcs, an electrical current of an unknown magnitude and duration may conduct through the EVA crewmember, producing an unacceptable condition. This electrical current may be sufficient to startle or fatally shock the EVA crewmember (Reference 2). Hence, as currently defined by the EVA community, the ISS floating potential for all nominal and contingency EVA worksites and translation paths must have a magnitude less than 40 volts relative to the local ionosphere at all times during EVA. Arcing from the EMU is classified as a catastrophic hazard, which requires two-failure tolerant controls, i.e., three hazard controls. Each PCU is capable of maintaining the ISS floating potential below the requirement during EVA. The two PCUs provide a single failure tolerant control of ISS floating potential. In the event of the failure of one or two PCUs, a combination of solar array shunting and turning the solar arrays into their own wakes will be used to supply control of the plasma hazard (Reference 3). The purpose of this paper is to present on-orbit information that shows that ISS solar array placement with respect to the ISS velocity vector can control solar array plasma charging, and hence, provide an operational control for the plasma hazard. Also, this paper will present on-orbit information that shows that shunting of the ISS solar arrays can control solar array plasma charging, and hence, provide an additional operational control for the plasma hazard. II. 2. Background The ISS becomes electrically charged due to electron collection by the exposed positive edges of the solar cells in its photovoltaic (PV) arrays. The electron current collected depends on the temperature and density of the ionospheric plasma. Electrical charging on the International Space Station (ISS) occurs due to three main mechanisms: https://ntrs.nasa.gov/search.jsp?R=20080026346 2018-07-12T19:59:21+00:00Z
Transcript of Impact of Solar Array Position on ISS Vehicle … pointed to the ram direction – however, the...

- 1 -
Impact of Solar Array Position on ISS Vehicle Charging John Alred and Ronald Mikatarian
The Boeing Company, Houston, Texas, United States of America
and
Steve Koontz NASA Johnson Space Center, Houston, Texas, United States of America
I. Introduction
The International Space Station (ISS), because of its large structure and high voltage solar arrays, has a complex plasma interaction with the ionosphere in low Earth orbit (LEO). This interaction of the ISS US Segment photovoltaic (PV) power system with the LEO ionospheric plasma produces floating potentials on conducting elements of the ISS structure relative to the local plasma environment. To control the ISS floating potentials, two Plasma Contactor Units (PCUs) are installed on the Z1 truss. Each PCU discharges accumulated electrons from the Space Station structure, thus reducing the potential difference between the ISS structure and the surrounding charged plasma environment. Operations of the PCUs were intended to keep the ISS floating potential to ±40 Volts (Reference 1). Exposed dielectric surfaces overlying conducting structure on the Space Station will collect an opposite charge from the ionosphere as the ISS charges. In theory, when an Extravehicular Activity (EVA) crewmember is tethered to structure via the crew safety tether or when metallic surfaces of the Extravehicular Mobility Unit (EMU) come in contact with conducting metallic surfaces of the ISS, the EMU conducting components, including the perspiration-soaked crewmember inside, can become charged to the Space Station floating potential. The concern is the potential dielectric breakdown of anodized aluminum surfaces on the EMU producing an arc from the EMU to the ambient plasma, or nearby ISS structure. If the EMU arcs, an electrical current of an unknown magnitude and duration may conduct through the EVA crewmember, producing an unacceptable condition. This electrical current may be sufficient to startle or fatally shock the EVA crewmember (Reference 2). Hence, as currently defined by the EVA community, the ISS floating potential for all nominal and contingency EVA worksites and translation paths must have a magnitude less than 40 volts relative to the local ionosphere at all times during EVA. Arcing from the EMU is classified as a catastrophic hazard, which requires two-failure tolerant controls, i.e., three hazard controls. Each PCU is capable of maintaining the ISS floating potential below the requirement during EVA. The two PCUs provide a single failure tolerant control of ISS floating potential. In the event of the failure of one or two PCUs, a combination of solar array shunting and turning the solar arrays into their own wakes will be used to supply control of the plasma hazard (Reference 3). The purpose of this paper is to present on-orbit information that shows that ISS solar array placement with respect to the ISS velocity vector can control solar array plasma charging, and hence, provide an operational control for the plasma hazard. Also, this paper will present on-orbit information that shows that shunting of the ISS solar arrays can control solar array plasma charging, and hence, provide an additional operational control for the plasma hazard.
II. 2. Background
The ISS becomes electrically charged due to electron collection by the exposed positive edges of the solar cells in its photovoltaic (PV) arrays. The electron current collected depends on the temperature and density of the ionospheric plasma. Electrical charging on the International Space Station (ISS) occurs due to three main mechanisms:
https://ntrs.nasa.gov/search.jsp?R=20080026346 2018-07-12T19:59:21+00:00Z

- 2 -
• Induction electric potentials (v×B·L) due to the motion of the spacecraft relative to the ambient
plasma in the earth’s magnetic field. • Electron collection on the positively charged edges of photovoltaic (PV) cells in the solar
arrays. • Electron loss to the ambient plasma due to recombination with plasma ions on electrically
conducting surfaces of the spacecraft. The ISS utilizes the two PCUs to help balance the ISS as it becomes electrically charged. Each PCU discharges accumulated electrons (using a hollow cathode assembly) from the ISS structure to reduce the potential difference between the Station structure and the surrounding charged plasma environment. This reduction in potential eliminates arcing, thus preserving the exterior material properties of the space station structure. Converting xenon gas to plasma using thermionic electron emission and expelling the xenon plasma from the PCU facilitates the electron discharge emission. Each PCU holds enough xenon to operate continually for two years minimum. The two PCUs are mounted on the port side of the Z1 truss to provide active control to maintain the ISS structure potential to within ±40 Volts of the ambient plasma. Maximum solar array charging occurs when i) the ionospheric conditions for high electron density (i.e., > 1011 electrons/m3) and low electron temperature (i.e., < 0.1 eV) exist; ii) the active side of the solar arrays are oriented toward the Sun, with little or no solar array regulation, and iii) the active side of the solar arrays have some ram exposure. These ionospheric conditions for maximum charging happen at three locations in the orbit: eclipse exit, pre-orbital noon, and eclipse entrance (reference 4). At eclipse entrance, the active sides of the solar arrays are nominally pointed away from the ram direction so that no solar array charging is observed. For pre-orbital noon locations, in the nominal ISS solar array operations, the solar arrays are regulated to produce minimal power. Hence, solar array charging is not typically a factor at the pre-orbital noon orbit locations. Eclipse exit, then, is the principal orbit location where the maximum ISS plasma-induced charging occurs.
Y
XVV Z Nadir : X Axis Near Velocity Vector, Z Axis Nadir/Down
XVV Flight Attitude
Velocity Vector(Flight Direction)
Nadir(Down)
X
Z
Valin Thorn / VIPeR TeamISSPO Mission Integration Of fice
281.244.7097
XVV Z Nadir Flight Attitude Shown With 0,0,0 Deg Yaw, Pitch, Roll LVLH Att itudeXVV TEA Is Nearest Torque Equilibrium Attitude (TEA) To This Orientation
Figure 1 – ISS XVV Flight Attitude

- 3 -
III. 3. PCU Discharge Currents when ISS in the XVV Flight Attitude
When the ISS operates in the XVV flight attitude, the Station’s X-axis is aligned with the velocity vector, as shown in Figure 1. In this flight mode, the solar arrays nominally track the Sun as the ISS orbits the Earth in order to keep the solar arrays positioned to maximum solar illumination and, hence, maximum power generation. To control the amount of power generated, the Sequential Shunt Unit (SSU) provides the capability to regulate the number of solar cells in each solar array providing power to the ISS Electrical Power System (EPS). The effects of the flight attitude and the operations associated with a flight attitude on ISS plasma charging can be summarized as orbit position, solar array angle, and solar array regulation. The orbit position dictates the amount of solar array charging (at eclipse exit, orbital noon, and eclipse entrance) as well as the magnitude of Earth’s magnetic field. The solar array angle determines whether the solar array is normal to the Sun or not. Plasma charging of solar arrays is highest when solar arrays are pointed to the ram direction – however, the solar arrays will charge almost until the arrays are parallel to the ram direction. The amount of solar array regulation determines the amount of solar array electron collection into the ISS structure. When solar arrays are mostly regulated, that is, when most solar cell in the solar array are not generating power into the ISS EPS, solar array electron collection is minimized due to lower collection potentials on the solar arrays. Observations of the discharge current of the PCUs show the PCU current peaks coincide with periods when the ISS experiences eclipse exit charging as well as the magnetic induction charging at latitudes of the orbit corresponding to maximum magnetic field. The first strip chart of Figure 2 shows an example of the PCU currents for the different charging regimes. Note that the second strip chart in Figure 2 shows the Beta Gimbal Assembly (BGA) angle for the solar arrays while the third strip chart shows the amount of regulation of the solar array strings. For Flight 11A (and earlier configurations), the BGA provides the solar array tracking capability. In the third chart of Figure 2, the solar array regulation is shown. In that chart, a value of “26” represents all strings collecting current while a value of “8” and below represents all strings regulated for no power collection.
April 11, 2001Eclipse Exit Charging
Southern Latitude v x B
Northern Latitude v x B
Figure 2 – PCU and Other Data from April 11, 2001
Note: Pre-orbital noon charging does not occur because the solar arrays are regulated.

- 4 -
IV. Pre-Orbital Noon PCU Discharge Currents when ISS is in the XVV Flight Attitude
The solar arrays during the April 11, 2001 data collection period (shown above) were in full auto-track, meaning that the arrays completed rotation throughout the orbit, as shown by the second strip chart of Figure 2 where each array goes from –180° to 180°. During 2003 and later years, the ISS also used a number of solar array management techniques (such as ‘Nightglider’, ‘Sunslicer’ and ‘Dual Angle Mode’) to reduce atmospheric drag and yet produce power. Figure 3 shows PCU currents, BGA angles, and Solar Array Regulation for November 4, 2003, a day in which the ‘Dual Angle Mode’ was used. Note in Figure 3 that the second strip chart shows the BGA angles followed a restrictive rotation regimen throughout the orbit (‘Dual Angle Mode’). The angles are allowed to remain fixed until the angle from the surface of the solar array to the Sun aligns at which time the solar array begins to track the Sun. The peaks of the BGA graph correspond to orbital noon. Note the PCU currents show that a solar array charging peak can occur just before orbital noon. The solar array regulation shown in Figure 3 is also different from that shown in Figure 2 in that solar arrays are less regulated during November 4, 2003 as compared to April 11, 2001 (note: fully regulated arrays would eliminate the pre-orbital noon charging).
v x B @ -51.6v x B @ +51.6 Pre-Orbital Noon Charging
+XVV Flight Attitude
Figure 3 – PCU and Other Data from November 4, 2003 The data in Figure 3 indicates that the charging peak for the pre-orbital noon charging decreases at orbital noon. At orbital noon, notice in Figure 3 that the solar array is tracking. An examination of pre-orbital noon PCU discharge currents shows a charging peak, as shown in Figure 4. The top curve in that figure is the PCU discharge currents. The charging peak is at GMT 21:40 on March 30, 2004. Once again, the ISS is flying in the XVV attitude, meaning the truss axis is aligned along the velocity vector. The middle graph shows the BGA angle for the two ISS solar arrays. The bottom graph shows that the solar array shunting is constant at that time of peak charging. As the solar arrays begin to track the Sun at the charging peak, the charging rapidly decreases after solar array movement. This more detailed study of pre-orbital noon PCU currents shows that the solar arrays are charging until orbital noon when the charging ceases as the solar arrays become parallel to the velocity vector (i.e., going into wake).
Orbital Noon

- 5 -
Figure 4 – PCU Data from March 30, 2004
Figure 5 – IRI Model Data for March 30, 2004
Pre-Orbital Noon
Charging
Orbital Noon

- 6 -
V. Plasma Properties and PCU Discharge Currents around Orbital Noon when ISS in the XVV Flight Attitude
The International Reference Ionosphere (IRI 2001) gives predictions for average electron density (ne) and electron temperature (Te) of the ionosphere for a given date and location. Figure 5 shows the IRI-2001 predictions for the March 30, 2004 pre-orbital noon charging peak discussed in the previous paragraph. The data in Figure 5 shows a rising electron density and a dropping electron temperature as the ISS approaches orbital noon. The enhanced density peaks at orbital noon are related to well-known mid-latitude electrodynamics known as the Appleton Anomaly peaks. High electron density and low electron temperature are known to be necessary for solar array charging (Reference 4). It is noted again, that for solar array charging to occur, some degree of ram exposure of the active side of the solar array is required. At orbital noon with sun tracking, the solar array surface normal vector is perpendicular to the flight vector. Consequently, no solar array charging will occur at orbital noon. This is observed in Figure 6, which shows that solar array charging decays from its pre-orbital noon peak to zero at orbital noon. In addition, Figure 6 shows a detailed look at the electron density and temperature information from the IRI-2001 predictions.
PCU Current and Plasma Properties
0
0.05
0.1
0.15
0.2
0.25
0.3
21:00 21:10 21:20 21:30 21:40 21:50 22:00Time (GMT)
IRI T
e (e
V)
1.E+10
1.E+11
1.E+12
1.E+13
IRI n
e (#
/m^3
)
TeSun/Shade PCU 1 PCU 2ne
March 30, 2004
Figure 6 – PCU and IRI Data for March 30, 2004 Charging Peak
VI. Solar Array Regulation and PCU Discharge Currents around Orbital Noon when ISS in the XVV Flight Attitude
In Figure 6, one can see that the electron density and the electron temperature at GMT 21:40 represent conditions where solar array charging can occur. Nominally, solar array regulation at the orbital noon location will prevent solar array charging. However, as shown in Figure 7, the solar array regulation (i.e., the ‘shutting off’ of strings of solar cells) is constant at GMT 21:40. Also, the value of the solar array regulation during charging peak is 22, signifying that the majority of solar array strings are not fully regulated (a solar array shunting value of 8 or less specifies full regulation).
Orbital Noon

- 7 -
B us Error
0
5
10
15
20
25
30
21:00 21 :10 21 :20 21 :30 21:40 21:50 22 :00
T im e (G M T)
Bus
Err
or (V
)
2B 4B
Figure 7 – Solar Array Regulation for March 30, 2004 Charging Peak
To better view this effect of the solar arrays angles, the difference between the ISS velocity vector and the normal to the solar array must be examined. The ISS equilibrium attitude for ISS Configuration 11A (the current configuration and the one during the data take) in the XVV flight mode is pitched down by 5-11 degrees (Reference 5). So, the angle of the normal to the solar array with respect to velocity vector of the ISS can be calculated and plotted against the PCU current. This is shown in Figure 8. The examination of this pre-orbital noon PCU discharge currents shows the solar array movement is concurrent with the decrease of the charging peak. Further examination of other pre-orbital noon charging peaks during March 30, 2004 as well as other days show the same effect of the solar array charging peaking and then decreasing as the solar arrays become edge on to ram and then go to wake (References 6 and 7). Hence, when the normal to the solar array is perpendicular to the velocity vector (i.e., the solar array in “edge on” to ram at orbital noon), solar array charging ceases. The angular dependence of the solar array charging on the position of the active side of the solar array is also shown in Figure 8. As the solar array starts to move below 20° with respect to the ram, the charging decreases and is back to the magnetic induction background by the orbital noon point (which has an electron density and electron temperature conducive to solar array charging when the solar array is not fully regulated). The inference from this examination is that the positioning of the solar array to wake (or at least edge on to ram) will prevent solar array charging.
Solar Array Regulation
Orbital Noon
Charging Peak

- 8 -
PCU Current vs. BGA
0
0.01
0.02
0.03
0.04
0.05
0.06
21:00 21:10 21:20 21:30 21:40 21:50 22:00
Time (GMT)
Cur
rent
(A)
-60
-40
-20
0
20
40
60
BG
A A
ngle (deg)
PCU 1
PCU 2
Ram 2B
Ram 4B
Orbital NoonMarch 30, 2004
Array A
ngle to RA
M (deg)
Figure 8 – Array Angle with respect to Wake during Charging Peak
Figure 9 – ISS Flight Configuration 11A
10
-10
-30
-50
30
50
70
PCU Current vs. Solar Array Angle to Ram
- 9 -
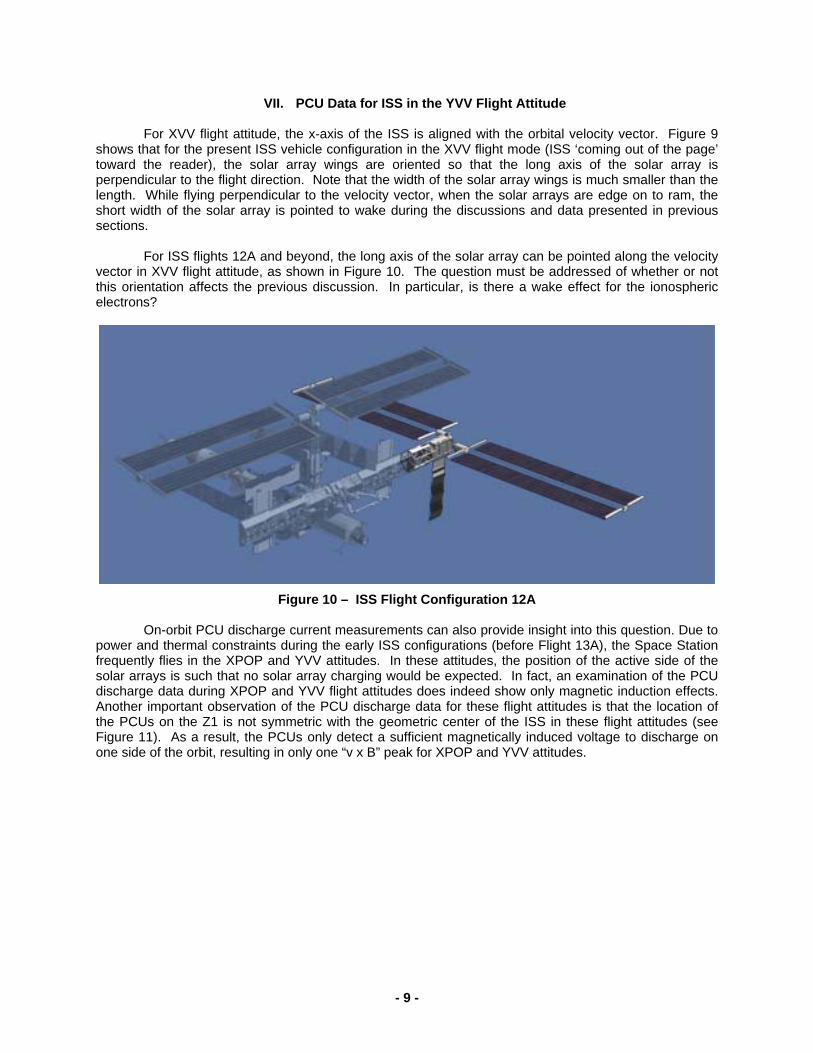
VII. PCU Data for ISS in the YVV Flight Attitude For XVV flight attitude, the x-axis of the ISS is aligned with the orbital velocity vector. Figure 9 shows that for the present ISS vehicle configuration in the XVV flight mode (ISS ‘coming out of the page’ toward the reader), the solar array wings are oriented so that the long axis of the solar array is perpendicular to the flight direction. Note that the width of the solar array wings is much smaller than the length. While flying perpendicular to the velocity vector, when the solar arrays are edge on to ram, the short width of the solar array is pointed to wake during the discussions and data presented in previous sections. For ISS flights 12A and beyond, the long axis of the solar array can be pointed along the velocity vector in XVV flight attitude, as shown in Figure 10. The question must be addressed of whether or not this orientation affects the previous discussion. In particular, is there a wake effect for the ionospheric electrons?
Figure 10 – ISS Flight Configuration 12A
On-orbit PCU discharge current measurements can also provide insight into this question. Due to power and thermal constraints during the early ISS configurations (before Flight 13A), the Space Station frequently flies in the XPOP and YVV attitudes. In these attitudes, the position of the active side of the solar arrays is such that no solar array charging would be expected. In fact, an examination of the PCU discharge data during XPOP and YVV flight attitudes does indeed show only magnetic induction effects. Another important observation of the PCU discharge data for these flight attitudes is that the location of the PCUs on the Z1 is not symmetric with the geometric center of the ISS in these flight attitudes (see Figure 11). As a result, the PCUs only detect a sufficient magnetically induced voltage to discharge on one side of the orbit, resulting in only one “v x B” peak for XPOP and YVV attitudes.

- 10 -
PCU #1 and PCU #2 on port side of Z1 truss element
Figure 11 – PCU Location on ISS During the YVV flight attitude for Flight 11A, the long axis of the solar array also points along the flight direction (Figure 10). PCU current measurements during YVV flight show that no solar array charging is observed, only magnetic induction, as shown in Figure 12 (Reference 6). The lack of
+ Y V V F lig h t A ttitu d e
Figure 12 – PCU Current Measurements during YVV Flight Attitude
Eclipse Exit

- 11 -
of solar array charging as shown by the PCU currents during flight periods when the solar array long-axis is in the velocity vector indicates there is no electron wake effect.
VIII. PCU Discharge Current Data during Solar Array Shunting
Several solar array shunting tests have been performed involving the ISS PCUs since the first set of solar array panels were added on Flight 4A in December 2000. The present build configuration of ISS, designated Stage 11A, has two complete solar array panels in operation, channels 2B and 4B. This configuration for the ISS stage 11A is shown in Figure 9.
Shunting of the two solar arrays was performed during the Russian Segment EVA-11 in September of 2004. During this test, PCU currents were measured at eclipse exit charging locations when both solar arrays were on, with 2B shunted (4B on), and with 4B shunted (2B on), i.e. all possible solar array/charging configurations during ISS stage 11A. Figure 13 displays PCU currents for each of these configurations at eclipse exit. As seen in this graph, the background PCU discharge current, due to magnetic induction (v×B•l ) is approximately 15 mA. When both solar arrays are charging, the average PCU discharge current is 30 mA. When either 2B is shunted or 4B is shunted, the average PCU discharge current decreases to approximately 22mA. The drop of about 7-8 mA for both 2B and 4B when shunted is exactly ½ the total discharge current, thereby demonstrating that solar array shunting does control ISS charging.
0.010
0.015
0.020
0.025
0.030
0.035
-180 -150 -120 -90 -60 -30 0 30 60 90 120 150 180
Longitude (degrees)
PCU
Dis
char
ge C
urre
nt (A
)
No Shunt
4B Shunted
2B Shunted
Both Shunted
Figure 13 – PCU Discharge Currents During Shunting Tests (September 2004) CHIT ISS-002009 was performed between June 24, 2004 and July 1, 2004, in conjunction with ISS EVA #9. This activity also provided an opportunity to evaluate the performance of the two individual solar arrays and PCU activity. As stated in the introduction, placing a solar array to wake effectively shunts that solar array and provides opportunity to study the remaining operational solar arrays.

- 12 -
For the first day of the CHIT (1800GMT June 25 to 1800GMT June26) the 11A 2B and 4B solar arrays were both operating under nominal operations. On the second day (1800GMT June 26 to 1800GMT June 27) solar array 4B was commanded to wake, leaving 2B the only solar array operating. The following day (1800 June 27 to 1800 June 28), both solar arrays were placed under nominal operations. The fourth day (1800GMT June 28 to 1800GMT June 29), the 4B solar array was shunted, leaving the 2B solar array in a normal operational mode. And finally, the last day of the CHIT (1800GMT June 29 to 1800GMT June 30), solar array 4B was commanded to wake again. Figure 14 displays the summary of PCU discharge currents for the various solar array configurations during CHIT ISS-002009. Although there is scatter in the data, there is a large difference between the PCU discharge current when both solar arrays are operational and when the one (e.g. 4B) is not. The background PCU current due to magnetic induction is approximately 20 mA. When both solar arrays are operating, the average PCU discharge current is 43 mA, and when only one solar array is charging, the PCU discharge current averages 32 mA. Like the shunting test discussed previously, the PCU discharge currents tend to drop by one half when only one solar array is active. This CHIT further demonstrates that shunting a solar array is an effective means for charging control. Additionally, shunting a solar array is just as effective as placing a solar array to wake.
0 .01 5
0 .02 0
0 .02 5
0 .03 0
0 .03 5
0 .04 0
0 .04 5
0 .05 0
-1 8 0 -1 5 0 -1 2 0 -9 0 -60 -3 0 0 3 0 6 0 9 0 1 20 1 50 1 80
L ong itu d e (d egrees )
PCU
Dis
char
ge C
urre
nt (A
)
D ay 1 - 2B /4B O p era tin g D ay 2 - 2B O n ly O p era tin g D ay 3 - 2B /4B O p era tin g D ay 4 - 4B S h u n ted D ay 5 - 2B /4B O p era tin g
Full Shunt 2B & 4B
Figure 14 – Eclipse Exit PCU Currents During CHIT ISS-002009
IX. ISS Solar Array Manufacturing Variability ISS solar array collection exists because of the solar array gap geometry. Figure 15 depicts the solar array gap geometry. The gap is a boundary that includes the effects of the gap itself and the coverglass (Reference 8). The surface of the coverglass is at a small negative voltage because of the net balance of electron and ion current. This negative potential of the coverglass repels electrons, while the potential inside the gap attracts electrons. Together, the overall geometry produces a barrier for which

- 13 -
electrons must have enough energy to overcome in order to be collected inside the gap. The barrier is a function of the geometry of the components depicted in Figure 15. For wider gap dimensions, the resulting barrier is reduced, allowing for more electrons (of lower energy) to be collected. The larger the gap overhang, the stronger the barrier becomes, and only the most enegetic electrons will be able to be collected. In general, the collected electron current will increase for wider gaps and decrease for larger overhangs. A survey of photovoltaic panel gaps was performed at MSFC in 1991 (Reference 9). Three panels from a single solar array were studied. Specifically, a statistical study was performed on the gaps between solar cell coverglass, the gap between the Silicon based solar cell, and the coverglass overhang. A schematic of the areas studied is shown in Figure 15. In Figure 15, the cover glass gap is labeled as nominally 32 mils and the solar cell gap is 39 mils. The distance the cover glass extends beyond the solar cell is the overhang width. Each panel contains 40 individual solar cells. For each solar cell, two measurements of the cover glass overhang were made on each side of the solar cell (8 total measurements per solar cell). For the cover glass width and solar cell gap width, two measurements were made at all boundaries where solar cell gaps meet. See Reference 8 for more details regarding these measurement locations.
Figure 15 – ISS Solar Cell Gap Cross Section
Table 1 shows the results of the statistical survey. For each panel 320 measurements were made for the cover glass overhang and 132 measurements were made for each of the cover class gap width and the solar cell gap width. The precision of the manufacturing process can be measured by the statistical variations of these measurements. The results from table one show that three panel average errors are 9%, 4%, and 6% for the cover glass overhang, cover glass gap width, and solar cell gap width respectively. The standard deviations for the cover glass gap with and solar cell gap with are comparable to each other while the standard deviations for the cover glass overhangs are 4-5 times higher. In the ISS solar array collection model study performed by SAIC, insulating surfaces are set to the potential allowed by a simple ion current-electron current balance (Reference 8). Solar array charging is dictated by the solar cell gap potential. It is explained in that document that it is a reasonable assumption that the mean gap potential is a simple linear function of the cell edge potential and the insulator surface (coverglass) potential. This potential is allowed to vary depending on if the surface is

- 14 -
ram-exposed or not. The conclusion is that variations in the surface potentials for this cover glass are negligible compared to the overall results (Reference 8). Given this analysis, it is reasonable to assume that small variations in the gap dimensions will also be negligible to the overall charging results. The results of ISS tests discussed in Section 8 showed that when either the 2B solar array or the 4B solar array is shunted, PCU currents show a drop in value of approximately half the amount of the difference between the current level before the shunt command and the vxB background current. Additionally, small levels of variability can be seen in the current values of Figures 13 and 14 when the 2B solar array or the 4B solar array is shunted. During the days of these tests, the plasma properties were assumed to be similar and constant. No geomagnetic storms were present during either test as shown in Figure 16. The day-to-day changes in the plasma properties are reflected in the fact that the PCU discharge current data is consistent with a similar number of solar arrays collecting. The statistical difference shown in Table 1, the fact that the 2B and 4B solar array panels act identically on-orbit, and the above discussion are good indications that the remaining solar arrays panels will behave in a similar manner. Final confirmation will be obtained with flight 12A.1, where the P4 solar array is attached to the vehicle.
Figure 16 – Geomagnetic Indices for June and September 2004 Data Periods
Average* Standard Deviation* Panel # Overall Horizontal Vertical Overall Horizontal Vertical
Cover Glass Overhang
1 0.0045 0.0047 0.0044 0.0015 0.0016 0.0013
Cover Glass Gap
1 0.0297 0.0284 0.0309 0.0026 0.0019 0.0027
Solar Cell Gap
1 0.0384 0.0375 0.0391 0.0034 0.0033 0.0032
Cover Glass Overhang
2 0.0044 0.0045 0.0042 0.0011 0.0011 0.0011
Cover Glass Gap
2 0.0295 0.0300 0.0291 0.0017 0.0017 0.0021
Solar Cell 2 0.0376 0.0381 0.0372 0.0023 0.0018 0.0027

- 15 -
Gap Cover Glass
Overhang 3 0.0048 0.0048 0.0047 0.0014 0.0012 0.0015
Cover Glass Gap
3 0.0308 0.0311 0.0306 0.0024 0.0014 0.0029
Solar Cell Gap
3 0.0398 0.399 0.0396 0.0027 0.0022 0.0030
* all units in inches
Table 1 - Results of ISS Solar Cell Statistical Survey
X. Conclusions
An examination of the pre-orbital noon solar array charging peak during periods of off-nominal solar array regulation, as measured by PCU discharge currents and other on-orbit data, shows that solar array charging will be prevented when the active side of the solar array is pointed to wake. The use of solar arrays to wake can be used as a method to prevent ISS vehicle charging – mitigating the plasma hazard of EVA-suit arcing. For engineering margin, to insure that there is no solar array charging, it is recommended that solar arrays be pointed at least 10° to wake. The results of two ISS shunting tests are discussed. In these tests, ISS stage 11A solar arrays are turned off and on and PCU discharge currents are available to monitor the simultaneous response of vehicle charging due to the solar array configuration change. In both tests, all observations are that when either the 2B solar array or the 4B solar array is turned off, the PCU discharge current drops approximately half the amount of the difference between the current level before the shunt/wake command and the vxB background current. The results of the MSFC ISS solar array panel statistical survey are presented and show that the variations the solar cells for three ISS panels are small. The results of the survey in combination with observational evidence from ISS shunting experiments show that small statistical variations in the manufacturing of solar cells have no effect on the charging levels observed to date. Furthermore, it can be assumed that because the solar array panels were all made by the same vendor with the same manufacturing processes that all ISS solar array panels will exhibit similar solar cell statistical variations. Hence, for on-orbit operations, the following can be assumed. 1) Solar array shunting will control plasma-induced solar array charging and can be used as a plasma hazard control in the case of a PCU failure. 2) All ISS solar array panels will exhibit similar charging characteristics.
XI. References
1) Chaky, R. C., and Lambert, J. C.; The ISS Plasma Contactor; Paper AIAA-96-0627; AIAA 34th Aerospace Sciences Meeting and Exhibit, 1996, Reno, Nevada
2) D. R. Hamilton MD, PhD, MSc EE, What is a “SAFE CURRENT” that can be conducted through an Astronaut? ; ISS Plasma Technical Interchange Meeting, NASA Marshall Space Flight Center, Nov. 2-4, 2004, Huntsville, Alabama.
3) Boeing Hazard Report ISS-EVA-312-13A : Electric Shock to EVA Crew from EMU Arcing to Plasma.
4) Brandon Reddell, Plasma Interaction Modeling and Ionosphere Plasma Property Variability, Boeing ISS Environments Team Memorandum 2004-016, December 9, 2004.

- 16 -
5) http://mod.jsc.nasa.gov/df/df64/ADCO-Flight-Info/MCS-flt-info.html 6) John Alred, Ron Mikatarian, and Hagop Barsamian, Review of PCU Discharge Current :
December 2000 to August 2003, ISS Plasma Technical Interchange Meeting, NASA Marshall Space Flight Center, September 3-5, 2003, Huntsville, Alabama.
7) John Alred, Ron Mikatarian, and Hagop Barsamian, Arrays to Wake Criteria based on Orbital Noon Charging, ISS Plasma Technical Interchange Meeting, NASA Marshall Space Flight Center, June 14-17, 2004, Huntsville, Alabama.
8) Myron J. Mandell, Victoria A. Davis, Gary A. Jongeward, and Barbara M. Gardner, Documentation of the ISS Solar Array Electron Current Collection Model and Mast Current Collection Model, Report No. SAIC 02/2014, May 23, 2002.
9) DiCicco, M. F., Internal Letter to Marian Felder, “Survey of Photovoltaic Panel Gaps”, June 26, 1991.