Impact of Non-Freeway Rumble Strips Phase 1€¦ · Impact of Non-Freeway Rumble Strips Phase 1...
91
Impact of Non-Freeway Rumble Strips Phase 1 Prepared for: Michigan Department of Transportation Office of Research and Best Practices 425 West Ottawa Lansing, MI 48933 Prepared by: Wayne State University Transportation Research Group 5050 Anthony Wayne Drive Detroit, MI 48202 Authors: Tapan K. Datta, Ph.D., P.E. Timothy J. Gates, Ph.D., P.E., P.T.O.E. Peter T. Savolainen, Ph.D., P.E. June 26, 2012 ORBP Reference Number: OR09084A Final Report
Transcript of Impact of Non-Freeway Rumble Strips Phase 1€¦ · Impact of Non-Freeway Rumble Strips Phase 1...

Impact of Non-Freeway Rumble Strips Phase 1
Prepared for:Michigan Department of Transportation
Office of Research and Best Practices
425 West Ottawa
Lansing, MI 48933
Prepared by:Wayne State University
Transportation Research Group
5050 Anthony Wayne Drive
Detroit, MI 48202
Authors:Tapan K. Datta, Ph.D., P.E.
Timothy J. Gates, Ph.D., P.E., P.T.O.E.
Peter T. Savolainen, Ph.D., P.E.
June 26, 2012
ORBP Reference Number: OR09084A
Final Report


1. Report No. RC-1575
2. Government Accession No. N/A
3. MDOT Project Manager Jill Morena
4. Title and Subtitle Impact of Non-Freeway Rumble Strips - Phase 1
5. Report Date June 26, 2012 6. Performing Organization Code N/A
7. Author(s) Tapan K. Datta, Timothy J. Gates, and Peter T. Savolainen
8. Performing Org. Report No. N/A
9. Performing Organization Name and Address Wayne State University-Transportation Research Group Department of Civil and Environmental Engineering 5050 Anthony Wayne Drive, Room #0504 Detroit, MI 48202
10. Work Unit No. (TRAIS) N/A
11. Contract No. 2009-0748 11(a). Authorization No. Z3
12. Sponsoring Agency Name and Address Michigan Department of Transportation Research Administration 425 West Ottawa Street Lansing MI 48933
13. Type of Report & Period Covered Final Report 6/1/2010 to 6/30/2012 14. Sponsoring Agency Code N/A
15. Supplementary Notes None 16. Abstract In an effort to reduce lane-departure crashes, in 2008 the Michigan Department of Transportation (MDOT) began a three-year statewide non-freeway rumble strip installation initiative. This initiative called for the installation of milled centerline rumble strips on all rural non-freeway highways with a posted speed limit of 55 mph and a paved roadway width greater than 20 ft and shoulder rumble strips on roadways with paved shoulders that were at least 6 ft wide. Approximately 5,400 miles of non-freeway roadways were ultimately included in this rumble strip installation initiative. As this initiative was believed to be the largest of its kind in the United States at the time, it was important for MDOT to evaluate the impacts associated with the rumble strip installations to provide guidance for future implementation both within Michigan and other states. The objectives of this study included:
Identification and analysis of “Before” traffic crashes Assessment of impact of rumble strips on driver behavior, bicyclist safety, roadside noise, and short-
term pavement performance. Several field data collection efforts were undertaken in order to accomplish the objectives. Based on the results of the evaluation, it is concluded that rumble strips on high-speed non-freeway highways improves driver performance on most highways and traffic scenarios. Vehicles produced higher levels of roadside noise when traveling over the rumble strips compared to normal passbys. The rumble strip noise typically did not exceed the roadside noise level produced by tractor trailer trucks traveling on normal highways. Finally, centerline rumble strips did not contribute to short-term transverse cracking are in asphalt pavements. Three years of “Before” crash data were analyzed to identify the target crashes that is expected to be alleviated by the installation of centerline rumble strips on MDOT’s high-speed trunkline (non-freeway) system. 17. Key Words Rumble Strips, Non-Freeways, Centerline, Lane-Departure, Crashes, Driver Behavior, Noise
18. Distribution Statement No restrictions. This document is available to the public through the Michigan Department of Transportation
19. Security Classification - report Unclassified
20. Security Classification - page Unclassified
21. No. of Pages 169
22. Price N/A
The opinions, findings, and conclusions expressed in this publication are those of the authors and
not necessarily those of the Michigan State Transportation Commission, the Michigan
Department of Transportation, or the Federal Highway Administration.
i
TABLE OF CONTENTS
PAGE I. INTRODUCTION AND STUDY OBJECTIVES ..................................................................... 1 Study Objectives .................................................................................................................. 2 II. BACKGROUND AND PAST RESEARCH STUDIES ........................................................... 3 Past Research Studies ........................................................................................................... 5 Measures of Effectiveness Used in Prior Research .............................................................. 5 Crash Reductions ...................................................................................................................6 Driver Behavior and Performance ........................................................................................ 7 Bicyclist Impacts ....................................................................................................................7 Noise Impacts........................................................................................................................ 8 Conclusions ........................................................................................................................... 8 III. IMPACT OF RUMBLE STRIPS ON NON-FREEWAY HIGHWAYS IN MICHIGAN .....10 GIS Map .............................................................................................................................. 10 VI. DRIVER BEHAVIOR AND PERFORMANCE STUDY .....................................................12 Field Study ...........................................................................................................................13 Data Collection ....................................................................................................................14 Extraction of Driver Behavioral Performance Data .............................................................15 Results of Drive Behavioral Study .............................................................................20 Passing Maneuvers...............................................................................................................20 Lateral Lane Position ...........................................................................................................21 Encroachments .....................................................................................................................23 V. STUDY OF VEHICLE LATERAL PLACEMENT CHARACTERISTICS IN PRESENCE OF BICYCLISTS ...............................................................................................25 Driver Behavior in the Presence of Bicyclists .....................................................................26 Field Study ...........................................................................................................................26 Field Data .............................................................................................................................28 Statistical Analysis for Impacts of CLRS on Vehicular Lateral Positioning When Passing a Bicyclist .........................................................................................................32 Bicyclist Opinion Survey .....................................................................................................35

ii
TABLE OF CONTENTS (Continued)
PAGE V. IMPACT OF SHORT-TERM PAVEMENT PERFORMANCE DUE TO INSTALLATION OF CLRS ...................................................................................................37 Review of Pavement Imagery Data .....................................................................................38 Factors Affecting Crack Propagation ...................................................................................40 Sampling Strategy for Pavement Condition Data ................................................................41 Procedure for Pavement Imagery Review ...........................................................................45 Results ..................................................................................................................................47
VII. ROADSIDE NOISE STUDY ................................................................................................49 Sound Fundamentals ............................................................................................................49 Roadside Noise Measurement..............................................................................................49 Field Study ...........................................................................................................................51 Equipment Setup and Preparation ........................................................................................52 Controlled Roadside Noise Measurement with Test Vehicle ..............................................53 Ambient Roadside Noise Measurement...............................................................................54 Results ..................................................................................................................................55 Conclusions ..........................................................................................................................59 VIII. SAMPLE SPEED STUDY ..................................................................................................61 IX. ANALYSIS OF “BEFORE” CRASH DATA ........................................................................63 Data Collection ....................................................................................................................63 Manual Review ....................................................................................................................64 X. CONCLUSIONS AND RECOMMENDATIONS ..................................................................71 Recommendations ................................................................................................................76 Acknowledgements ..............................................................................................................77 XI. REFERENCES .......................................................................................................................78
APPENDIX I – DRIVER BEHAVIOR DATA FOR CURVE LOCATIONS ............................. I-1 APPENDIX II – DRIVER BEHAVIOR DATA FOR PASSING ZONE LOCATIONS ............II-1
APPENDIX III – BICYCLIST SURVEY FOR NON-FREEWAY RUMBLE STRIPS – QUESTIONS AND RESPONSES .............................................................. III-1 APPENDIX IV – SAMPLES OF “TARGET” CRASH REPORTS (UD-10s) BY TYPE ....... IV-1 APPENDIX V – TRAFFIC CRASH DATA .............................................................................. V-1

iii
LIST OF FIGURES
PAGE Figure 1. MDOT Rumble Strip Standards for Rural Non-Freeway Roadways (2) ....................... 4 Figure 2. Non-Freeway Rumble Strip Installations Reported by MDOT for 2008–2010 ............11 Figure 3. Typical Elevated Video Camera Setup ..........................................................................15 Figure 4. Example Driver Behavior Assessment ..........................................................................17 Figure 5. Study Segments .............................................................................................................27 Figure 6. Field Setup for Elevated Video Recording of Road User Behavioral Data ..................29 Figure 7. Schematic Diagram of Data Collection Plan .................................................................30 Figure 8. Example Screenshot of Video Review ..........................................................................31 Figure 9. Map of Rumble Strip and Control Sections ..................................................................40 Figure 10. Map of Michigan Geographic Regions .......................................................................41 Figure 11. Pathview II Software – Display Windows ..................................................................46 Figure 12. Example Pavement Imagery from Before and After Rumble Strip Installation ........ 46 Figure 13. Example Sound Meter Setup and Test Vehicle Pass ...................................................53 Figure 14. Test Vehicle Noise Data Summary .............................................................................56 Figure 15. Impacts of CLRS Depth Using Test Vehicle ..............................................................58

iv
LIST OF TABLES PAGE Table 1. Roadway Site Characteristics .........................................................................................14 Table 2. Descriptive Statistics for Passing Maneuvers .................................................................20 Table 3. Statistical Analysis Results for Passing-Related MOEs .................................................21 Table 4. Vehicular Lateral Lane Position Results by Geometry and Type of Vehicle – Locations with CLRS Only .............................................................................................22 Table 5. Vehicular Lateral Lane Position Results by Geometry and Type of Vehicle – Locations with CLRS and SRS .......................................................................................22 Table 6. Encroachment Results by Geometry and Type of Vehicle .............................................24 Table 7. Vehicular and Bicycle Volumes – Without Signs – 7/16/11 ..........................................31 Table 8. Vehicular and Bicycle Volumes – With Signs – 8/20/11 ...............................................32 Table 9. Statistical Results for Impacts of CLRS on Vehicular Lateral Positioning When Passing a Bicyclist ................................................................................................33 Table 10. Results of the Impacts of Share the Road Sign on Vehicle Lateral Placement ............34 Table 11. Descriptive Statistics for Sample Centerline Surface Cracking Data ...........................43 Table 12. Target Sample Sizes for Analysis of Pavement Distress Data by Zone and Statewide .......................................................................................................43 Table 13. Data Summary ..............................................................................................................44 Table 14. Cracking Results for the Rumble Strip Sections ..........................................................47 Table 15. Cracking Results for the Control Sections ....................................................................48 Table 16. Comparison of Increase in Cracks Between Rumble Strip and Control Sections ........48 Table 17. Site Characteristics .......................................................................................................52 Table 18. Results of Noise Measurements Using Test Vehicle ....................................................55 Table 19. Ambient Noise Results .................................................................................................59

v
LIST OF TABLES (Continued) PAGE
Table 20. Before-and-After Speed Results by Site (Radar Gun) ..................................................61 Table 21. Aggregated Before-and-After Speed Results by Time of Day (Automated Counters) ...................................................................................................62 Table 22. Summary of “Before” Crash Data ................................................................................63 Table 23. Type of Target “Before” Crashes (3 Year Period) and Rates .......................................67 Table 24. Summary of “Before” Period Crash Data – By Year ...................................................67 Table 25. 2008 Installations – “Before” and “After” Crash Comparison – By Severity ..............69 Table 26. “Before” and “After” Crash Data – Annual Averages – By CLRS Installation Year ..............................................................................................................................70


1
I. INTRODUCTION AND STUDY OBJECTIVES Traffic crashes on high-speed undivided highways often present safety challenges involving lane
departure-related crashes and injuries. The use of continuous rumble strips along such highways
on the edges of travelways provide a warning to drivers resulting in either appropriate corrective
action or a reduction in speed, which are often associated with crash avoidance or severity
reduction.
A search of traffic crashes on state [Michigan Department of Transportation (MDOT)]
maintained non-freeway high-speed (55 mph) roadways, excluding intersection crashes,
indicated that in 2007, approximately 23,751 crashes occurred in Michigan, including 122 fatal
crashes (1). In 2008, total crashes and fatal crashes on non-freeway state maintained roads were
24,288 and 111, respectively. Among the most severe of these types of crashes are those
involving lane departure where vehicles cross over either the centerline or edge line, resulting in
head-on, opposite direction sideswipe, or run-off-the-road collisions. Lane departure crashes
totaled 20.7 percent (4,910) of all crashes that occurred on these types of roads and comprised
69 percent (84) of fatal crashes in 2007 and in 2008; they were 23 percent (5,565) of all crashes
and 77 percent (86) of fatal crashes (1). Historically, crashes involving lane departure are often
over-represented in severity since these crashes are generally associated with higher vehicle
speeds. Some of the primary causes of lane departure crashes also include distracted or drowsy
driving.
Continuous longitudinal rumble strips placed along the roadway edge or centerline are
used by transportation agencies as a means of reducing lane departure crashes and injuries.
When encountered by distracted or drowsy drivers, they provide both a tactile and audible
warning to the driver. In 2008, MDOT began a major rumble strip installation program to help
prevent lane departure crashes on rural non-freeway state trunklines in Michigan. This initiative
continued through 2010. This program includes the installation of both shoulder rumble strips
(SRS) and centerline rumble strips (CLRS) on MDOT rural non-freeway highways with posted
speed limits of 55 mph. CLRS were installed at all such highways, except at the intersections
and through urbanized areas. SRS however, were installed only on highway segments where the
shoulder width was six feet or greater. This program is the largest of its kind in the United
States. As such, it is important for MDOT to carefully evaluate the impacts of the program on

2
both traffic safety operations and pavement durability. If significant crash reduction and
improvement in driver behavior due to the presence of continuous rumble strips are confirmed,
this evaluation will set the standard for future implementation within Michigan and nationwide.
Also under consideration are impacts on non-motorized users (i.e., bicycles) and the adjacent
community (e.g., noise). In conjunction with the noted evaluations, impacts on pavement
condition due to CLRS installations will be examined. Specifically, if pavement deterioration is
caused or accelerated by the installation of rumble strips, alternate installation methods or
specific preventive maintenance treatments need to be considered. All these elements must be
critically examined in order to provide MDOT with a comprehensive assessment of the rumble
strip program.
Study Objectives
The objectives of this research included:
1. Preparation of a Geographic Information System (GIS) database and map that
identifies the locations of MDOT’s non-freeway rumble strip installations.
2. Development of a comprehensive crash database for the “Before” period (for use in
Phase 2 “Before-and-After” crash analysis).
3. Collection of “Before” and “After” field data for driver behavior, including: lateral
placement within the lane, centerline and edgeline encroachments, speed, relevant
passing maneuvers characteristics, and others at roadway segments where rumble
strips have been installed.
4. Evaluation of sample “Before” and “After” driver behavior in the presence of
bicyclists and bicyclist behavior, including: vehicular lateral placement when passing
a bicyclist riding on the shoulder; edgeline encroachments, centerline encroachments,
and others.
5. Identification of rumble strip related safety and mobility issues for bicyclists.
6. Use of MDOT’s pavement management system video logs to evaluate short-term
pavement performance impacts due to CLRS installations (“Before” and “After”
condition data).
7. Perform a comparison of sample speeds before and after the CLRS installations.

3
II. BACKGROUND AND PAST RESEARCH STUDIES The centerline rumble strips (CLRS) were installed on approximately 5,400 miles of non-
freeway high-speed rural highways in Michigan. The shoulder rumble strips (SRS) were also
installed on roadways where there were at least 6 ft wide shoulders. The rumble strips
corrugations were ground (i.e., milled) into the pavement per MDOT specifications. MDOT
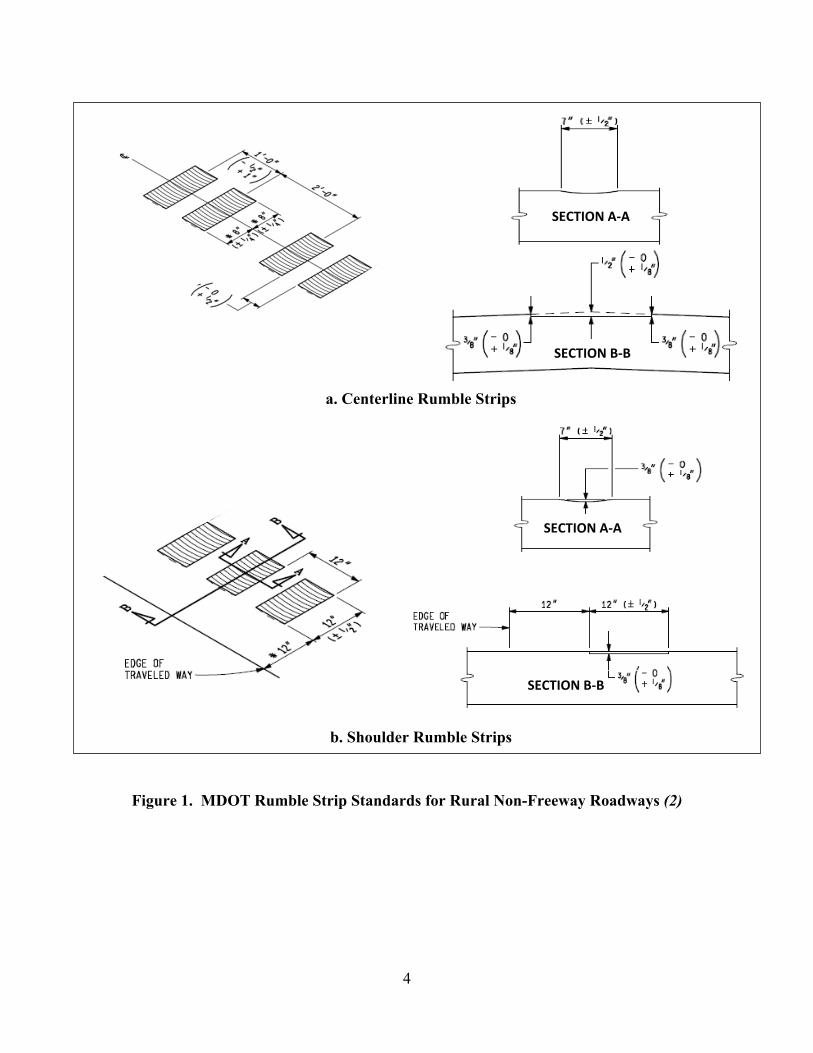
standard installation details (2) for both CLRS and SRS installations are shown in Figure 1, and
are summarized as follows:
Centerline Rumble Strips
- Transverse dimension of corrugation (tolerance): 16 in (± ½ in),
- Longitudinal dimension of corrugation: 7 in (±½ in)
- Spacing between corrugations: 5 in (- ½ in, +1 in)
- Longitudinal gap between corrugation pairs: 17 in
- Depth of corrugation at outer edges: 3/8 in (-0, +1/8 in); at centerline:
½ in (-0, +1/8 in)
Shoulder Rumble Strips
- Transverse dimension of corrugation (tolerance): 12 in (± ½ in),
- Longitudinal dimension of corrugation: 7 in (±½ in)
- Spacing between corrugations: 5 in (±½ in)
- Offset from edge of traveled way to near edge of corrugation: 12 in
- Longitudinal installation cycle: 48 ft of rumble strips followed by a 12 ft gap
- Depth of corrugation: 3/8 in (-0, +1/8 in)
The rumble strip dimensions at each field study location were verified with field measurements
at sample locations to determine compliance with the implementation tolerances as per the
MDOT specification.
The installation of CLRS and SRS was performed during the construction seasons of
years 2008, 2009 and 2010. This provided an opportunity to build a traffic crash database for
three years of “Before” data for each segment of highways, and allowed a “Before” and “After”
evaluation of driver operational characteristics at sample of locations where the rumble strips
were not installed at the time this study began.
4
a. Centerline Rumble Strips
b. Shoulder Rumble Strips
Figure 1. MDOT Rumble Strip Standards for Rural Non-Freeway Roadways (2)
SECTION A‐A
SECTION B‐B
SECTION A‐A
SECTION B‐B

5
Past Research Studies
Rumble strips have been used by transportation agencies along the edge/shoulder of the roadway
for many years as a means of reducing single vehicle run-off-the-road crashes involving drowsy
or distracted drivers. Shoulder rumble strip installations were first utilized along rural freeways
many years ago. Evaluations of the safety and/or driver behavioral effectiveness of these
installations showed favorable results and prompted their use along the edge/shoulder of non-
freeway high-speed rural roadways, including undivided two-lane and four-lane roadways. More
recently, several transportation agencies have installed rumble strips along the centerline of two-
lane and multilane undivided roadways. Centerline rumble strips are designed to reduce cross-
centerline crashes, including head-on, sideswipe, and run-off-the-road (left-side) crashes. A
wide variety of design and installation specifications are utilized across the United States for
centerline and shoulder rumble strips installations on non-freeways, particularly regarding the
size and spacing of the rumble strips, the offset from the centerline/edgeline markings, the types
of roadways where CLRS and/or SRS are installed, and whether CLRS are terminated through
passing zones.
Measures of Effectiveness Used in Prior Research
Although direct measurement of the reduction in target crashes or crash severity would
ultimately provide the most valuable evidence of the effectiveness of a safety countermeasure
such as rumble strips, these evaluations are often difficult to perform due to time and/or cost
constraints. Consequently, evaluations of targeted surrogate measures of effectiveness (MOEs)
are often used as a proxy for crash evaluations (3). Surrogate MOEs are selected based on driver
behavior or performance measures that are associated with specific crash types that the
countermeasure is targeted to reduce (4). As rumble strips are designed to reduce run-off-the-
road, head-on, and sideswipe type of crashes, appropriate surrogate MOEs include those related
to lateral placement within the travel lane, encroachment onto the centerline or edgeline, and
vehicular speeds. In addition to their use in rumble strip related research (5,6,7,8), these MOEs
have also been previously utilized to evaluate the effects of other lane departure
countermeasures, such as post-mounted delineators, chevrons, wider and/or brighter pavement
markings, and retroreflective raised pavement markers (9,10,11,12). In addition to safety-related
measures of effectiveness, previous research has also evaluated potentially negative impacts
produced by the use of rumble strips on non-freeways, including the impacts on bicyclists
(13,14,15,16), roadside noise (17,18), and passing maneuvers (5).

6
Crash Reductions
Shoulder Rumble Strips
As shoulder rumble strips exist on both divided and undivided roadways, several effectiveness
evaluations of the safety effectiveness of SRS have been completed in the US. The research
literature provides conclusive evidence that shoulder rumble strips significantly reduce single
vehicle run-off-the-road crashes (19,20,21,22,23). A recent synthesis of Illinois and California
data estimated shoulder rumble strips to reduce run-off-the-road crashes on rural freeways by
21 percent (22). Similar results were found on rural freeways in Montana, as a 14 percent
reduction run-off-the-road crashes was observed after the installation of shoulder rumble strips
(21). The greatest crash reductions have been observed on roadways with higher traffic volumes,
wider shoulders, and higher speeds (19) and the benefit/cost ratio for shoulder rumble strips has
been estimated to be at approximately 20 (21). Few evaluations have focused specifically on the
effectiveness of non-freeway installations of shoulder rumble strips. A Minnesota study of
shoulder rumble strips on two-lane roadways found results that were similar to those found on
freeways as single vehicle run-off-road crashes were reduced by 13 percent for all crashes and
18 percent for injury crashes (52). A recent NCHRP study estimated existence of shoulder
rumble strips to reduce run-off-road crashes on two-lane roadways by 15 percent and run-off-
road fatal crashes by 29 percent (24).
Centerline Rumble Strips
Centerline rumble strips have not experienced the level of implementation as shoulder rumble
strips. Many pilot installations and subsequent evaluations have been performed showing
various degrees of crash reductions for cross-centerline crashes (25,26,27,28,29,30,31). Two
larger evaluations have shown a reduction in cross-centerline crashes, such as head-on and
sideswipe collisions after the installation of centerline rumble strips (24,32). Analysis of crash
data from 210 miles of roadway with centerline rumble strips installed in seven states found a
14 percent reduction in all crashes, a 15 percent reduction in injury crashes, a 21 percent
reduction in head-on and sideswipe opposite crashes, and a 25 percent reduction of injury
crashes that involved head-on and sideswipe opposite crashes (32). A recent NCHRP study
estimated a reduction in head-on and sideswipe opposite direction crashes due to the installation
of CLRS on two-lane roadways at 30 percent and 44 percent for total and fatal crashes,
respectively (24).

7
Driver Behavior and Performance
Behavioral changes associated with rumble strip installations on non-freeways have been
assessed in a limited number of evaluations. An evaluation in Texas investigated the effects of
CLRS and SRS on undivided rural roadways (5). The driver behavior/performance MOEs
included: vehicular lateral placement within the lane, percent of vehicles completing a passing
maneuver, percent of vehicles encroaching onto the centerline or shoulder, and percent of
vehicles committing erratic maneuvers. Vehicles were found to shift away from the centerline
after the CLRS were installed and fewer centerline encroachments were observed, indicating a
reduced risk of cross-centerline events. Shoulder encroachments were also reduced at locations
where shoulder rumble strips were installed. An investigation of 479 vehicle passing maneuvers
(forced by a test vehicle), showed little change in the percent of vehicles attempting a pass when
rumble strips were present. In addition, no vehicles were observed making a wrong-way
correction (i.e., shifting farther left when initially encountering a CLRS) nor were any vehicles
observed avoiding CLRS by straddling them.
A Pennsylvania study by Mahoney, et al, (6) investigated the effects of CLRS on lateral
placement with respect to the centerline of the roadway. Vehicles were found to shift away from
the centerline when they were present. A decrease in the lateral placement variance was also
observed, suggesting that vehicles are more uniformly positioned in the presence of CLRS.
Vehicular speeds were not impacted.
Bicyclist Impacts
Although there is no evidence of increases in bicycle-involved crashes associated with centerline
and/or shoulder rumbles strips, a review of the several literature sources have found some
concerns from the bicyclist community. They include:
Vehicles crowd along the right side of the roadway while trying to avoid contact with
the CLRS (14).
Safety concerns when traversing over rumble strips, particularly along the shoulder
(13,14,15).
Reduction of the rideable width of the shoulder due to improper placement of SRS
(16).

8
Attempts have been made to develop rumble strip configurations that are more bicycle-
friendly (13,14,15). Continuous sections of 40 to 60 ft have been recommended (13,14) with a
gap spacing of 12 ft (13) and a corrugation depth of 0.375 – 0.4 inches (14,15) with 6-inch
spacings between corrugations (15). A usable paved shoulder width of 4 ft has also been
recommended (33).
Noise Impacts
Although rumble strips provide benefits to roadway safety, the noise produced by vehicles
contacting the rumble strips may be undesirable for local residents. Previous research has
investigated the exterior roadside noise produced by rumble strips utilizing the controlled pass-
by method (17,18). The controlled pass-by method measures the A-weighted decibels (dBA)
generated by passes of a test vehicle traveling at a known speed past a noise meter located 5 feet
above the roadway, and within a distance of 100 feet of the roadway, based on the Federal
Highway Administrations (FHWA) guidelines for measuring highway related noise (34). Past
research using the controlled pass-by method has consistently shown a marked increase in
decibels when vehicles make contact with rumble strips. Collectively, previous research found
increases in roadside noise ranging from 3 to 12 dBA when a vehicle travels over the rumble
strip compared to instances where no rumble strip contact is made. Higher vehicle speeds result
in larger increases in exterior noise. It was also shown that vehicle type has an effect on exterior
noise level; heavier vehicles produce higher level of noise.
Conclusions
Collectively, results from previous research have allowed for the following conclusions
pertaining to the effectiveness of shoulder and centerline rumble strips:
Shoulder rumble strip effectiveness
- Single vehicle run-off-the-road crashes are reduced
- Drivers are less likely to encroach onto the shoulder
- Drivers are more likely to position themselves away from the shoulder in the
presence of SRS
- Much of the research has been conducted on freeways, with some research on
non-freeway locations.

9
Centerline rumble strip effectiveness
- Evaluation of several pilot installation in many states have shown evidence of a
reduction in cross-centerline crashes, including head-on and sideswipe opposite
type of crashes
- Drivers are less likely to encroach onto the centerline in the presence of CRS
- Drivers are more likely to position themselves away from the centerline
- An evaluation of a limited sample of forced passing maneuvers in Texas showed
negligible impact on passing maneuvers
- Behavioral impacts associated with centerline and shoulder rumble strips used in
combination on non-freeways require further study
- Crash effectiveness requires a comprehensive evaluation as only pilot installations
have been evaluated.
Impact on bicyclists
- No evidence exists of increases in bicycle-involved crashes associated with
centerline and/or shoulder rumbles strips
- Prior research suggests the following rumble strip dimensions allow for safe
maneuverability for bicyclists:
Rumble strip sections of 40 to 60 ft followed by a gap spacing of 12 ft
Corrugation depths of 0.375 – 0.4 in, spaced 6-inches on center
A minimum usable paved shoulder width of 4 ft
- Concerns from bicyclists have suggested the need for further study on behavior of
motorists while passing bicyclists positioned along on the edge of the roadway or
within the shoulder.
Roadside noise impacts
- Prior research using controlled pass-by test vehicles have consistently shown an
increase ranging from 3 to 12 decibels of noise when the vehicle travels over the
rumble strip, compared to instances where no contact is made rumble strips
- High speeds yield larger increases in roadside noise when contact occurs with
rumble strips
- Additional research is needed to investigate roadside noise impacts associated
with varying depths of rumble strip corrugations.

10
III. IMPACT OF RUMBLE STRIPS ON NON-FREEWAY HIGHWAYS IN MICHIGAN This research consists of a number of independent studies, which collectively are part of the
comprehensive effectiveness evaluation of the MDOT non-freeway rumble strip installation
program. Each study tests a different aspect of safety and operational consequences related to
their installation on high-speed non-freeways.
The following sections present a number of studies that address the study objectives
presented earlier. Each of these studies includes background information such as a review of
prior research, field study where applicable, description and methods used in data collection,
analysis, statistical testing, and conclusions.
GIS Map
A GIS map was developed using ArcGIS based on non-freeway rumble strip installation
information provided by MDOT that included installations occurring between 2008 and 2010 as
a part of the annual restriping contracts in addition to installations associated with new
construction or repaving projects. The rumble strip installation segments were mapped in
ArcGIS based on Physical Road (PR) codes along with the approximate begin and end
milepoints that were provided by various MDOT Transportation Service Centers (TSC) or
regional offices. The rumble strip installations were color-coded based on the rumble strips
installation year, and were overlaid onto the geocoded MDOT roadway base map. The map
depicting MDOT’s non-freeway rumble strip installations performed between 2008 and 2010 is
shown in Figure 2. Note that the map only includes installation information that was provided to
the research team by MDOT and was not verified through field inspection by the research team.
It is important to note that a small number of offices did not report their CLRS and SRS
installation mileages and route descriptions, or provided inconsistent or inaccurate information.
Nevertheless, a geocoded database was established for a total of 5,326 miles of non-freeway
highway segments, which is only slightly less than the approximately 5,400 miles of high-speed
non-freeway highway segments that are typically reported by MDOT as possessing CLRS. The
GIS database is included through a link (https://docs.wayne.edu/4fad86f4e3191/) for further use and
updating, as additional data became available.

11
Figure 2. Non-Freeway Rumble Strip Installations Reported by MDOT for 2008–2010

12
IV. DRIVER BEHAVIOR AND PERFORMANCE STUDY While past research has provided substantial evidence that shoulder rumble strips
(19,20,21,22,24) and centerline rumble strips (24,32,25) provide significant reductions in
targeted lane departure crashes on two-lane roadways by as much as 15 percent and 30 percent,
respectively (24), work has been limited with respect to the relative difference in safety
performance between roadways with both as compared to CLRS-only. More broadly, there is
limited literature focused on the impacts of rumble strips on driver behavior characteristics that
contribute to the relevant target crash reductions on two-lane roadways.
This research aims to gain important insight into these issues by assessing the impacts of
centerline rumble strips on driver behavior characteristics related to lane departure crashes,
including vehicular lateral placement within the travel lane, edgeline encroachments, and
centerline encroachments (3). Such MOEs have been utilized in past research to evaluate the
driver behavior impacts of rumble strips installed on rural undivided highways (5,6). These
MOEs have also been previously utilized to evaluate other lane departure treatments, such as
post-mounted delineators, chevrons, wider and/or brighter pavement markings, and retro
reflective raised pavement markers (35,9,10,11). Indication of any behavioral improvements
generally provide preliminary evidence to potential safety impacts, in addition to providing
insight into changes in driver behavior that often contribute to the targeted safety improvements.
Also of interest is the determination of potential impacts that may be caused by the existence of
rumble strips, such as a reduction in passing attempts, which often lowers the risk associated
with passing-related crashes.
A “Before” and “After” evaluation study was initiated in June 2010, prior to completion
of the rumble strip installations included in the MDOT program. The specific objectives of this
study were to assess the impact of centerline and shoulder rumble strips on:
Vehicular lateral placement within the travel lane,
Vehicular encroachment onto or over the centerline or edgeline, and
Attempted passing maneuvers.

13
Field Study
A “Before” and “After” (B&A) field study was performed to assess the impacts of CLRS and
SRS on driver behavior along a rural two-lane highways in Michigan. The study segments
included both horizontal curves and tangent sections, with and without passing zones. The
following driver performance characteristics were captured during the field study:
Vehicular lateral placement in the travel lane,
Encroachments onto or across the centerline,
Encroachments onto or across the edgeline,
Passing attempts, and
Aborted passing attempts.
Ten roadway segments were selected for use. The segments were selected from the statewide
population of two-lane rural highways with 55 mph speed limits where rumble strips were
scheduled for installation during late summer 2010. The segments were evenly split between
locations where both centerline and shoulder rumble strips were to be installed and sites where
only centerline rumble strips were to be installed. The average daily traffic volumes at the
10 study segments ranged from 1,500 to 6,000 vehicles per day.
Prior to data collection, a preliminary investigation was performed along each roadway
segment to identify at least one location where passing was permitted in both directions of travel,
and one horizontal curve location that was suitable for field data collection. A total of 18 passing
zone locations and 12 horizontal curve locations were selected for data collection from the
segments. The characteristics of the roadways and the number of specific data collection
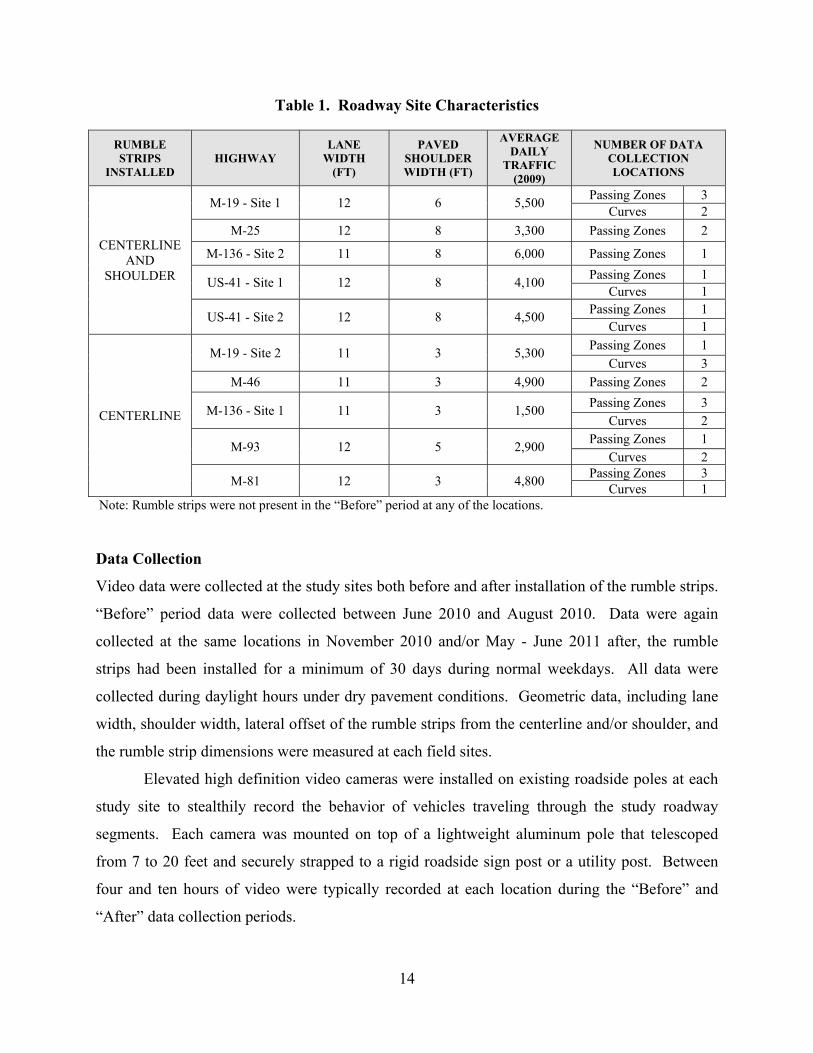
locations are presented in Table 1.
14
Table 1. Roadway Site Characteristics
RUMBLE STRIPS
INSTALLED HIGHWAY
LANE WIDTH
(FT)
PAVED SHOULDER WIDTH (FT)
AVERAGE DAILY
TRAFFIC (2009)
NUMBER OF DATA COLLECTION LOCATIONS
CENTERLINE AND
SHOULDER
M-19 - Site 1 12 6 5,500 Passing Zones 3
Curves 2
M-25 12 8 3,300 Passing Zones 2
M-136 - Site 2 11 8 6,000 Passing Zones 1
US-41 - Site 1 12 8 4,100 Passing Zones 1
Curves 1
US-41 - Site 2 12 8 4,500 Passing Zones 1
Curves 1
CENTERLINE
M-19 - Site 2 11 3 5,300 Passing Zones 1
Curves 3 M-46 11 3 4,900 Passing Zones 2
M-136 - Site 1 11 3 1,500 Passing Zones 3
Curves 2
M-93 12 5 2,900 Passing Zones 1
Curves 2
M-81 12 3 4,800 Passing Zones 3
Curves 1 Note: Rumble strips were not present in the “Before” period at any of the locations. Data Collection
Video data were collected at the study sites both before and after installation of the rumble strips.
“Before” period data were collected between June 2010 and August 2010. Data were again
collected at the same locations in November 2010 and/or May - June 2011 after, the rumble
strips had been installed for a minimum of 30 days during normal weekdays. All data were
collected during daylight hours under dry pavement conditions. Geometric data, including lane
width, shoulder width, lateral offset of the rumble strips from the centerline and/or shoulder, and
the rumble strip dimensions were measured at each field sites.
Elevated high definition video cameras were installed on existing roadside poles at each
study site to stealthily record the behavior of vehicles traveling through the study roadway
segments. Each camera was mounted on top of a lightweight aluminum pole that telescoped
from 7 to 20 feet and securely strapped to a rigid roadside sign post or a utility post. Between
four and ten hours of video were typically recorded at each location during the “Before” and
“After” data collection periods.

15
A single camera setup was utilized at the curve locations and was mounted in a position
that maximized the field-of-view of vehicles traveling through the curve and the adjacent tangent
segment of the highway. The maximum clear viewing distance along a roadway for a single
camera location was approximately 1,000 feet. The passing zone locations utilized two cameras
mounted at the same telescopic pole location, but the cameras were aimed in the opposite
directions. The two-camera setup doubled the effective viewing distance and greatly increased
the likelihood of capturing all passing events. Examples of the video camera setups for both
passing zones and curve locations are shown in Figure 3. These camera setups on existing
roadside posts created a concealed environment to capture driver behavioral data and retrieve
quality data for verification.
a. Passing Zone (two cameras in opposing directions) b. Curve (single camera aimed towards curve)
Figure 3. Typical Elevated Video Camera Setup Extraction of Driver Behavioral Performance Data
After completion of the field data collection, videos were manually reviewed using Quicktime
video players by a team of trained researchers to assess various characteristics of driver behavior.
Each vehicle was monitored through the entire field-of-view of the camera(s). Behavioral
characteristics that were collected for each observed vehicle depending on whether the location
was a passing zone or a horizontal curve location.

16
Passing Zones
Videos recorded 18 passing zone sites and were reviewed to capture various driver behavioral
characteristics related to passing maneuvers by vehicles traveling through each study site.
Synchronization of the time clocks between the two cameras used in each passing zone setup
simplified the review process by allowing vehicles to be continuously tracked between the two.
During a review of the dual-camera passing zone videos, several important characteristics were
assessed, that included:
Type of vehicle (passenger vehicle, truck/RV/bus, motorcycle)
Direction of travel
Was the vehicle within 150 ft of the previous vehicle (i.e., in passing position)?
Was a pass attempted?
Was the pass aborted?
Vehicles were considered to be in a position to pass if they were within 150 ft of the
previous vehicle. For vehicles traveling at 55 mph, a 150 ft following distance represents an
approximately two second headway between the leading vehicle and the following vehicle. The
distance between successive vehicles was estimated based on the number of centerline skip
pavement markings, which were installed at 50 ft intervals per MDOT standard.
A passing attempt was defined as a vehicle that crossed the centerline and began to
overtake another vehicle that was traveling within the same lane and same direction. Aborted
passing attempts were defined as cases where a vehicle initially touched or crossed over the
centerline while attempting to overtake another vehicle, but moved back into the original lane
without completing the passing maneuver. It was not possible to distinguish and subsequently
exclude unintentional shifts that resulted in contact with the centerline. Figures 4 a-b, page 17,
show an example of the vehicular assessments performed during the data extraction of the
passing zone videos.
Curves and Adjacent Tangent Sections
The videos recorded at the 12 horizontal curve locations were reviewed to assess the lateral lane
position and encroachments onto or over the centerline and edgeline for each vehicle. The type
and travel direction for each vehicle was recorded, as well as whether the vehicle was traveling
through a curve to the left or curve to the right. Figures 4 c-d, page 18, show an example
encroachment and lateral position assessment.

17
The lateral position of each vehicle was assessed at the apex of the curve and at the
tangent section adjacent to the curve. Each vehicle was assessed at the same location for curve
or tangent section in the “Before” and “After” periods. It was occasionally not possible to assess
the lateral position of a given vehicle in both the curve and adjacent tangent, resulting in a slight
imbalance between the number of vehicular observations for the curve and tangent data sets.
The lateral placement position was assessed based on the center of the vehicle with
respect to the center of the travel lane. A vehicle was considered centered unless the vehicle had
shifted to the left or right of the center of the lane by more than approximately 6-inches. The
vehicle’s license plate was often used as a reference point to assess lateral placement position.
This data extraction procedure was used in a vehicular lateral placement evaluation for work
zones (36) and other similar research.
Each vehicle was monitored to determine if a centerline or edgeline encroachment
occurred at any point along the visible portion of the tangent section or curve section.
Encroachments were categorized based on whether the vehicle’s near tire either touched or
completely crossed over the centerline or edgeline at the most extreme point. Tangent
encroachments and curve encroachments were counted separately for each vehicle traveling
through the study section.
a. Passing Position b. Passing Attempt
Figure 4. Example Driver Behavior Assessment
Vehicle in Passing Position (within 150 ft)

18
c. Centerline Encroachment (Curve) d. Lateral Lane Placement Assessment (Tangent)
Figure 4. Example Driver Behavior Assessment (Continued)
Measures of Effectiveness and Statistical Analysis
Several MOEs were utilized to quantify driver behavioral characteristics in the presence and
absence of rumble strips, which included:
Passing Maneuvers
- Percent of vehicles that attempted a passing maneuver;
- Percent of vehicles that were in a position to pass and attempted a passing
maneuver;
- Percent of vehicles that aborted a passing maneuver after an initial attempt;
Lateral Position within Travel Lane
- Percent of vehicles centered in the lane;
- Percent of vehicles in the right lane position;
- Percent of vehicles in the left lane position;
Encroachments
- Percent of vehicles encroaching onto or across the centerline; and
- Percent of vehicles encroaching onto or across the edgeline.
Centerline Encroachment (minor)
Center of Vehicle
L C R

19
Each of the MOEs were expressed as dichotomous rates of occurrence, and as such, two
sample z-tests of proportions were utilized to determine the statistical significance of change in
the MOEs between the “Before” and “After” rumble strip installation periods. Two-tailed tests
were utilized for all statistical testing and the null hypothesis for all tests was that the rumble
strips produced no change in the MOE. The lateral position and encroachment MOEs were
analyzed both separately by vehicle type and overall for curves to the left, curves to the right,
and tangent sections. MOEs related to passing maneuvers were analyzed independently by site
and overall.
Since several hypothesis tests were performed simultaneously on the same family of data
for each MOE, it was necessary to apply a multiple comparison correction to correct for errors in
inference that may occur (37). The Bonferroni Multiple Comparison Correction was utilized in
the analyses for this study as it is a conservative method of correcting erroneous rejection of the
null hypothesis based on chance alone that is typically encountered during individual testing of
several hypotheses from the same family of data. The Bonferroni Correction assumes the
selected significance level, 100-α (percent), to relate to inference on the family of data, where α
is the selected probability of Type 1 error for the entire family of data. The corresponding
significance level used for each individual hypothesis test is equal to “(100-α)/n” (percent),
where “n” is the number of simultaneous tests being performed per MOE (e.g., one test for each
of the individual study locations plus one overall test). Critical z-values (or t-values) for
rejection of the null hypothesis were determined accordingly from the standard normal
probability table.

20
Results of Driver Behavioral Study
Passing Maneuvers
Review of the passing zone videos yielded a total of 39,664 and 38,094 vehicles in the “Before”
and “After” periods, respectively. A total of 1,188 passing attempts were observed, which
included 620 during the “Before” period and 568 during the “After” period. Twenty-seven (27)
of these passing attempts were aborted that included 14 in the “Before” period and 13 in the
“After” period. The descriptive statistics resulting from review of the passing zone videos are
shown in Table 2.
Table 2. Descriptive Statistics for Passing Maneuvers
DATA COLLECTION
LOCATION
TOTAL OBSERVATI
ON TIME (HRS)
TOTAL NO. OF VEHICLES
OBSERVED
NO. OF VEHICLES
IN PASSING POSITION
TOTAL PASSING
ATTEMPTS
ABORTED PASSING
ATTEMPTS
Before After Before After Before After Before After Before After
M-136 - Site 1, PZ 1 5.0 9.3 588 1,103 56 79 19 21 0 0 M-136 - Site 1, PZ 2 6.4 5.5 2,657 1,581 392 158 23 18 0 2 M-136 - Site 1, PZ 3 5.9 8.6 767 1,193 52 71 10 15 0 0 M-136 - Site 2, PZ 1 5.1 7.6 2,403 3,527 460 565 22 18 2 0 M-19 - Site 1, PZ 1 4.7 8.6 1,926 2,684 375 456 19 30 0 1 M-19 - Site 1, PZ 2 4.6 7.8 1,811 2,513 299 419 25 38 1 2 M-19 - Site 1, PZ 3 8.4 8.6 3,037 2,636 542 438 57 57 4 2 M-19 - Site 2, PZ 1 6.2 8.8 1,920 3,016 373 427 42 34 1 2 US-41 - Site 1, PZ 1 6.5 10.0 1,661 2,508 197 318 7 21 0 1 US-41 - Site 2, PZ 1 3.9 7.9 1,011 2,498 138 393 13 36 0 1 M-93 - PZ 1 8.2 9.3 1,935 1,835 162 133 15 21 0 1 M-46 - PZ 1 9.4 2.2 3,258 608 545 91 67 13 0 0 M-46 - PZ 2 9.0 7.1 3,166 2,352 445 297 20 15 0 0 M-25 - PZ 1 6.4 8.3 2,436 2,150 408 321 41 60 1 0 M-25 - PZ 2 5.3 8.6 2,730 2,530 553 356 34 43 0 1 M-81 - PZ 1 8.7 7.4 2,728 1,915 457 331 113 46 2 0 M-81 - PZ 2 8.4 2.1 3,151 653 484 65 48 6 2 0
M-81 - PZ 3 7.3 8.4 2,479 2,782 353 464 45 76 1 0
TOTAL 119.4 136.0 39,664 38,084 6,291 5,382 620 568 14 13
A summary of the results of the statistical analyses for the MOEs related to passing
maneuvers is presented in Table 3. The overall percent of vehicles attempting a passing

21
maneuver decreased slightly from 1.56 percent to 1.49 percent after the rumble strips had been
installed.
Table 3. Statistical Analysis Results for Passing-Related MOEs
DATA COLLECTION LOCATION
TOTAL PASSING ATTEMPTS AS % OF TOTAL VEHICLES
TOTAL PASSING ATTEMPTS AS % OF VEHICLES IN
PASSING POSITION
ABORTED PASSING ATTEMPTS AS % OF
TOTAL PASSING ATTEMPTS
Before After Significant Difference? Before After
Significant Difference?
Before After Significant Difference?
M-136 - Site 1, PZ 1 3.23% 1.90% No 33.93% 26.58% No 0.00% 0.00% No M-136 - Site 1, PZ 2 0.87% 1.14% No 5.87% 11.39% No 0.00% 11.11% No M-136 - Site 1, PZ 3 1.30% 1.26% No 19.23% 21.13% No 0.00% 0.00% No M-136 - Site 2, PZ 1 0.92% 0.51% No 4.78% 3.19% No 9.09% 0.00% No M-19 - Site 1, PZ 1 0.99% 1.12% No 5.07% 6.58% No 0.00% 3.33% No M-19 - Site 1, PZ 2 1.38% 1.51% No 8.36% 9.07% No 4.00% 5.26% No M-19 - Site 1, PZ 3 1.88% 2.16% No 10.52% 13.01% No 7.02% 3.51% No M-19 - Site 2, PZ 1 2.19% 1.13% No 11.26% 7.96% No 2.38% 5.88% No US-41 - Site 1, PZ 1 0.42% 0.84% No 3.55% 6.60% No 0.00% 4.76% No US-41 - Site 2, PZ 1 1.29% 1.44% No 9.42% 9.16% No 0.00% 2.78% No M-93 - PZ 1 0.78% 1.14% No 9.26% 15.79% No 0.00% 4.76% No M-46 - PZ 1 2.06% 2.14% No 12.29% 14.29% No 0.00% 0.00% No M-46 - PZ 2 0.63% 0.64% No 4.49% 5.05% No 0.00% 0.00% No M-25 - PZ 1 1.68% 2.79% No 10.05% 18.69% Yes 2.44% 0.00% No M-25 - PZ 2 1.25% 1.70% No 6.15% 12.08% Yes 0.00% 2.33% No M-81 - PZ 1 4.14% 2.40% Yes 24.73% 13.90% Yes 1.77% 0.00% No M-81 - PZ 2 1.52% 0.92% No 9.92% 9.23% No 4.17% 0.00% No
M-81 - PZ 3 1.82% 2.73% No 12.75% 16.38% No 2.22% 0.00% No
TOTAL 1.56% 1.49% No 9.86% 10.55% No 2.26% 2.29% No Note: Statistical significance was assessed based on a 95 percent confidence level using a Bonferroni corrected critical z-score of ± 3.00.
As shown in Table 3, the total passing attempts were also not found to change
significantly when analyzed as a percent of vehicles in a position to pass. Similarly, no
statistically significant changes were found in the rate of aborted passing attempts. Overall,
passing maneuvers were aborted in 2.26 percent of all passing attempts before rumble strip
installation and 2.29 percent of all passing attempts after rumble strip installation.
Lateral Lane Position
Review of the videos from the curve locations yielded a total of 30,202 and 20,673 vehicles in
the “Before” and “After” periods, respectively. The lateral lane position data were aggregated
based on the types of rumble strips installed, geometry, and vehicle type. The results of the

22
vehicular lateral lane position analysis are shown in Tables 4 and 5 for locations with CLRS-only
and CLRS and SRS, respectively.
Table 4. Vehicular Lateral Lane Position Results by Geometry and Type of Vehicle – Locations with CLRS Only
VEHICLE TYPE
TOTAL NO. OF VEHICLES
OBSERVED % LEFT OF CENTER % CENTERED IN LANE % RIGHT OF CENTER
Before After Before After %
Change Before After
% Change
Before After %
Change
TA
NG
EN
TS
Passenger 19,499 11,749 22.1% 18.5% -16.3%* 36.5% 48.8% 33.8%* 41.4% 32.7% -21.0%*
Truck/Bus/RV 996 603 17.0% 15.4% -9.1% 33.6% 44.1% 31.2%* 49.4% 40.5% -18.1%*
Motorcycle 384 143 42.7% 41.3% -3.4% 34.1% 32.2% -5.7% 23.2% 26.6% 14.7%
ALL 20,879 12,495 22.3% 18.6% -16.3%* 36.3% 48.4% 33.3%* 41.4% 33.0% -20.4%*
LE
FT
C
UR
VE
S Passenger 11,327 6,489 41.1% 19.0% -53.7%* 33.0% 55.7% 68.5%* 25.8% 25.3% -2.2%
Truck/Bus/RV 560 348 31.3% 21.3% -32.0%* 33.8% 47.1% 39.6%* 35.0% 31.6% -9.7%
Motorcycle 219 82 51.1% 41.5% -18.9% 35.2% 28.0% -20.2% 13.7% 30.5% 122.6%*
ALL 12,106 6,919 40.8% 19.4% -52.5%* 33.1% 54.9% 65.9%* 26.1% 25.7% -1.5%
RIG
HT
C
UR
VE
S Passenger 8,175 5,230 6.1% 6.7% 9.3% 24.5% 45.4% 85.1%* 69.4% 47.9% -30.9%*
Truck/Bus/RV 434 259 5.3% 11.2% 111.3% 23.0% 45.6% 97.7%* 71.7% 43.2% -39.7%*
Motorcycle 165 57 18.2% 26.3% 44.7% 37.0% 40.4% 9.1% 44.8% 33.3% -25.7%
ALL 8,774 5,546 6.3% 7.1% 12.6% 24.7% 45.3% 83.7%* 69.0% 47.6% -31.1%* * Statistically significant at 95 percent confidence level based on a Bonferroni corrected critical z-score of ± 2.86 Note: The before-and-after percent change was computed as follows: (A-B)/B X 100%
Table 5. Vehicular Lateral Lane Position Results by Geometry and Type of Vehicle –
Locations with CLRS and SRS
VEHICLE
TYPE
TOTAL NO. OF VEHICLES
OBSERVED % LEFT OF CENTER % CENTERED IN LANE % RIGHT OF CENTER
Before After Before After %
Change Before After
% Change
Before After %
Change
TA
NG
EN
TS
Passenger 8,567 7,560 32.8% 9.7% -70.3%* 34.9% 68.5% 96.6%* 32.4% 21.7% -32.9%*
Truck/Bus/RV 603 559 30.2% 7.0% -76.9%* 35.7% 71.0% 99.2%* 34.2% 22.0% -35.6%*
Motorcycle 145 59 49.0% 20.3% -58.5%* 35.9% 72.9% 103.2%* 15.2% 6.8% -55.3%
ALL 9,315 8,178 32.9% 9.6% -70.7%* 34.9% 68.7% 96.8%* 32.2% 21.6% -32.9%*
LE
FT
C
UR
VE
S Passenger 5,516 4,644 19.9% 4.4% -78.0%* 33.9% 72.5% 113.7%* 46.1% 23.1% -49.9%*
Truck/Bus/RV 375 337 14.1% 3.6% -74.8%* 32.0% 73.9% 130.9%* 53.9% 22.6% -58.1%*
Motorcycle 110 38 42.7% 28.9% -32.3% 30.9% 63.2% 104.3%* 26.4% 7.9% -70.1%
ALL 6,001 5,019 20.0% 4.5% -77.4%* 33.8% 72.5% 114.9%* 46.2% 22.9% -50.4%*
RIG
HT
C
UR
VE
S Passenger 3,055 2,915 20.3% 1.9% -90.7%* 35.1% 66.8% 90.3%* 44.6% 31.3% -29.7%*
Truck/Bus/RV 227 208 37.4% 0.5% -98.7%* 26.4% 75.0% 183.8%* 36.1% 24.5% -32.1%
Motorcycle 39 21 17.9% 4.8% -73.5% 46.2% 85.7% 85.7%* 35.9% 9.5% -73.5%
ALL 3,321 3,144 21.5% 1.8% -91.6%* 34.6% 67.5% 94.8%* 43.9% 30.7% -30.0%* * Statistically significant at 95 percent confidence level based on a Bonferroni corrected critical z-score of ± 2.86 Note: The before-and-after percent change was computed as follows: (A-B)/B X 100%

23
It can be observed from Tables 4 and 5 (page 22) that the presence of rumble strips had a
statistically significant impact on the lateral lane position of vehicles in both curve and tangent
sections. In general, vehicles tended to be more centrally positioned within the lane when
rumble strips were present as drivers tended to shy away from both the centerline and the
edgeline. This was especially evident for locations with both as the percent of vehicles
positioned in the center of the lane approximately doubled in both curve and tangent sections
after rumble strip installation. Although central lane positioning was found to increase after
rumble strip installation for locations with centerline rumble strips only, the increases were of a
lower magnitude and less consistent compared to locations with both centerline and shoulder
rumble strips.
The results were found to vary somewhat based on vehicle type. Both passenger vehicles
and large vehicles such as trucks, buses, and RVs showed significant increases in center lane
positioning when rumble strips were present – particularly at locations where both centerline and
shoulder rumble strips were present. Large vehicles showed the greatest changes in lateral
position when rumble strips were present, particularly on curves to the right as the percent of
vehicles positioned in the center doubled at locations where only centerline rumble strips were
installed and nearly tripled where both were installed. The central lane positioning tendencies of
motorcyclists were improved by the presence of rumble strips only at locations where both
centerline and shoulder rumble strips were installed. The presence of centerline rumble strips
alone did not significantly impact the lane position of motorcyclists.
Encroachments
Centerline and edgeline encroachments were assessed within the curve and along the adjacent
tangent section for each vehicle observed during review of the curve videos. Only locations
where both SRS were installed between the “Before” and “After” periods were included in the
assessment of edgeline encroachments. Similar to the lateral lane position data, the
encroachment data were aggregated based on geometry and vehicle type. The results of the
encroachment analysis are shown in Table 6.

24
Table 6. Encroachment Results by Geometry and Type of Vehicle
VEHICLE
TYPE
% ENCROACHING ONTO OR ACROSS EDGELINE
% ENCROACHING ONTO OR ACROSS CENTERLINE
Before After % Change Before After % Change
TANGENTS
Passenger 9.1% 5.4% -41.2%* 1.5% 0.6% -63.7%* Truck/Bus/RV 27.7% 31.0% 11.8% 2.0% 1.4% -31.2% Motorcycle 0.0% 0.0% 0.0% 0.8% 1.0% 30.9% ALL VEHICLES 10.5% 6.6% -37.1%* 1.5% 0.6% -60.7%*
LEFT CURVES
Passenger 11.2% 3.7% -67.2%* 12.0% 1.3% -88.8%* Truck/Bus/RV 36.7% 26.5% -27.9% 13.6% 4.1% -69.9%* Motorcycle 0.0% 0.0% 0.0% 3.3% 0.0% -100.0% ALL VEHICLES 13.2% 4.5% -65.7%* 11.9% 1.5% -87.5%*
RIGHT CURVES
Passenger 10.3% 5.4% -47.5%* 0.5% 0.4% -28.6% Truck/Bus/RV 28.8% 27.1% -6.0% 1.8% 1.1% -41.0% Motorcycle 0.0% 0.0% 0.0% 0.5% 0.0% -100.0% ALL VEHICLES 11.6% 6.6% -43.7%* 0.6% 0.4% -31.4%
* Statistically significant at 95 percent confidence level based on a Bonferroni corrected critical z-score of ± 2.86 Note: Only locations where SRS were installed between the “Before” and “After” periods were included in the assessment of edgeline encroachments. The before-and-after percent change was computed as follows: (A-B)/B X 100%
It can be observed from Table 6 that the presence of rumble strips had a statistically
significant reduction in both centerline and edgeline encroachments in curve and tangent
sections. The greatest reduction in centerline encroachments were observed within curves to the
left as encroachments reduced from 11.9 percent to 1.5 percent. Similarly, the greatest
reduction in edgeline encroachments were observed within curves to the right as encroachments
were reduced from 11.6 percent to 6.6 percent. These findings suggest that rumble strips tend to
reduce the tendencies for drivers to laterally shift to the inside (i.e., “corner cutting”) while
maneuvering through curves. Both centerline and edgeline encroachments were also reduced in
tangent sections.
The encroachment results were found to vary based on vehicle type. Passenger vehicles
showed consistent and significant reductions in both centerline and edgeline encroachments after
the installation of rumble strips for nearly all geometric conditions. Large vehicles showed
mostly marginal decreases in encroachments after the rumble strips were installed, although
centerline encroachments were significantly reduced on curves to the left. Encroachments by
motorcyclists onto the centerline and particularly the edgeline were rare and were not
significantly impacted by the presence of rumble strips.
Major encroachments across the centerline decreased significantly after installation of
rumble strips for both tangent sections and curves to the left. Major centerline encroachments
were not impacted by rumble strips for curves to the right. Summaries of all data related to this
study are included in Appendices I and II.

25
V. STUDY OF VEHICLE LATERAL PLACEMENT CHARACTERISTICS
IN PRESENCE OF BICYCLISTS Rumble strips have been installed in many states, including Michigan, as a countermeasure on
the shoulders of high-speed roads and highways for reducing run-off-the-road crashes. Several
studies have shown that continuous shoulder rumble strips can significantly reduce such crashes
(19,20,21,22), with a recent National Cooperative Highway Research Program (NCHRP) Report
estimating a 21 percent reduction in run-off-the-road crashes on rural freeways (38). In more
recent years, rumble strips have been installed along the centerline of two-lane highways, where
they have been shown to reduce cross-centerline crashes (32,25). Other research has
demonstrated positive impacts of rumble strips with respect to driver behavioral measures, such
as motor vehicle lateral placement (5,6,39).
While crash and driver behavioral metrics generally support use of both shoulder and
centerline rumble strips, there are several potential concerns associated with their use. Recent
technical advisories issued by the Federal Highway Administration (40,41) list three potential
adverse impacts of rumble strips: (1) noise to adjacent residents, (2) bicycle compatibility, and
(3) maintenance issues. While some research has been conducted with respect to safety issues
associated with bicycle traffic on highways with shoulder rumble strips (42,13,14,15), research
related to the effects of centerline rumble strips on bicycle safety is minimal.
Bicyclists tend to ride on paved shoulders rather than in the travel lane when possible as
this provides a safety buffer and allows for convenient overtaking by faster-moving motor
vehicles. However, the rideable area can sometimes be reduced due to debris that has collected
on the edge of the pavement. It is further limited when shoulder rumble strips are installed,
sometimes forcing bicyclists to travel over the rumble strips. While contact with rumble strips
may not cause the bicyclist to lose control, vibrations produced can be uncomfortable to the rider
(42). This effect may cause some bicyclists to ride in the travel lane, potentially increasing their
safety risk.
Several past studies have attempted to develop rumble strip configurations that are
tolerable for the bicyclists (13,14,15). An Arizona study sought to identify the optimum spacing
of gaps in continuous shoulder rumble strips that would allow bicyclists to cross between the
shoulder and travel lane without riding over the rumble strips (13). The study recommended
26
gap spacing of 12 ft, with gaps located after continuous rumble strip sections of 40 or 60 ft. A
Colorado study evaluated three different rumble strip installation configurations using rideability
ratings provided by a group of bicyclists who each individually traversed the rumble strips (14).
The study concluded that the typical milled application, with a depth of 0.375 inches and a 60-ft
continuous section length, was the optimal design for both bicycle and motor vehicle safety. A
Pennsylvania study utilized a simulation model to evaluate rumble strip configurations for their
potential to be bicycle-tolerable (15). Configurations with the greatest potential were then
installed on a test track for field evaluation to rank bicycle ride quality and the ability to alert
motorists. The study resulted in recommended configurations for use on non-freeway segments.
For segments with operating speeds of 55 mph and above, this configuration included a groove
width of 5 inches and a depth of approximately 0.4 inches, with a 6-inch flat portion between the
cuts.
Driver Behavior in the Presence of Bicyclists
Several studies have examined interactions between motor vehicles and bicycles on shared use
facilities (43,33). One such study investigated the effects of bicycle lanes on motor vehicle and
bicycle lateral placement, concluding that the separation distance between bicycles and motor
vehicles was related to the amount of total travel space available and was not a function of the
presence of a bike lane (43). A Florida Department of Transportation study (33) determined that
average motorists attempt to keep their vehicles 5.9 ft to 6.4 ft lateral separation distance from
the bicyclists as they perform a passing maneuver.
In the case of rumble strips, NCHRP Synthesis 339 reported that bicyclists in Colorado,
Pennsylvania, and Wyoming complained of being crowded to the right side of the roadway by
motor vehicles trying to avoid contact with the centerline rumble strips (25).
Field Study
In order to evaluate the driver behavior in the presence of bicyclists, a field study was conducted
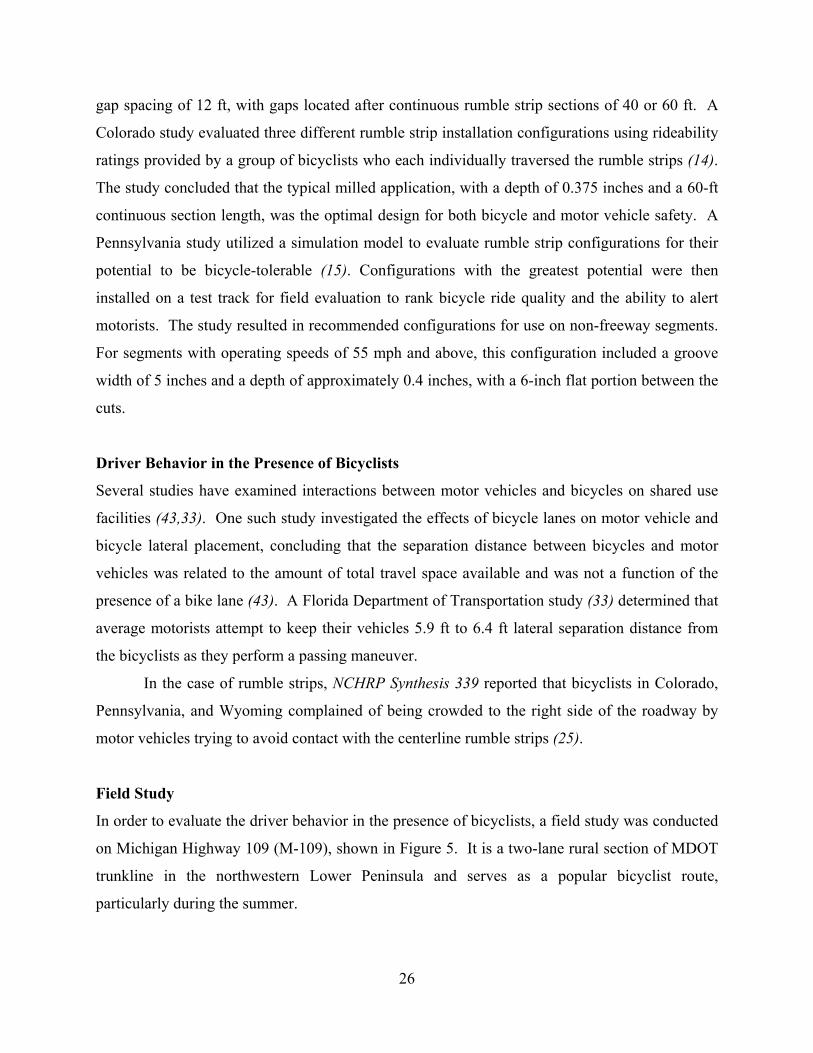
on Michigan Highway 109 (M-109), shown in Figure 5. It is a two-lane rural section of MDOT
trunkline in the northwestern Lower Peninsula and serves as a popular bicyclist route,
particularly during the summer.
27
Figure 5. Study Segments
M-109 is unique in that it includes one stretch where there are consecutive segments that
are identical, with the exception of centerline rumble strips. This feature creates an appropriate
setting for a controlled comparison of driver behavior when passing bicyclists with respect to the
presence of centerline rumble strips. Two 0.5-mile long segments of M-109 were selected for
the purposes of this field study. These segments were separated by a distance of approximately
1.1 mile distance and were selected to control for two factors: (1) roadway geometry and (2)
individual driver behavioral characteristics. Selecting two locations in close proximity to one
another, along the same route, allowed for both of these concerns to be addressed in this study.
Each segment consisted of a relatively straight, level alignment, with identical posted speed
limits (55 mph), lane widths (11 ft), and shoulder widths (4 ft). Neither of the two segments
included shoulder rumble strips. Furthermore, given their close proximity, most of the drivers
that were observed, passed over both study segments during the analysis period. Centerline
rumble strips were installed on the southernmost of these two segments and their presence was
the only substantive difference between the two. The centerline rumble strip dimensions were as
follows:

28
Corrugation depth = 0.4375 in.
Transverse dimension of corrugation = 16.0 in.
Longitudinal dimension of corrugation = 7.0 in.
Gap between corrugations = 5 in.
Gap between corrugation pairs = 17 in.
Field Data
The principal focus of this study was to determine the impacts of centerline rumble strips on the
lateral placement of motor vehicles as they pass bicyclists along two-lane highways. However,
there are several key factors that affect lateral placement under such a setting besides the
presence or absence of rumble strips. They include the following:
Lateral placement of nearest bicyclist to travel lane – Bicyclists traveling nearer to, or
within, the travel lane are likely to lead to a greater lateral shift by a motor vehicle in
comparison to bicyclists traveling farther from the travel lane on the shoulder.
Number of bicyclists encountered by a passing vehicle – Bicyclists riding in a group
may be more conspicuous or elicit a different response from motorists than a bicyclist
riding alone.
Type of motor vehicle – Larger vehicles require greater lane widths and, as such, may
tend to shift over further in their lane when encountering a bicyclist.
Presence of opposing traffic – If traffic is present in the opposing lane, motor vehicles
are inhibited from shifting over into that lane and may be forced to crowd an adjacent
bicyclist.
As these factors are a function of the bicyclist and driver population interactions, it is
difficult to evaluate their impacts solely based upon observations under a natural setting. To
address this issue, as a part of this field study, research team members participated as bicyclists,
and were assigned one of three specific lateral positions (in the center of the shoulder, on the left
edge of the shoulder, on the right edge of the travel lane) for a predetermined amount of time

29
through each study segment. The design allowed for an assessment of the effects of bicyclist
lateral position on driver behavior. Additional data were also collected for all other bicyclists
who traveled the study segments during this observation period.
In order to assess the lateral placement of each motor vehicle observed, a series of four
pole-mounted, high-definition cameras were setup on each side of the roadway throughout each
0.5-mile study segment. These cameras were mounted on top of 20-ft tall poles that were
secured to roadside signposts. An example of this elevated camera installation, which has been
used previously in a series of field studies of road user behavior (39,36,44), is shown in Figure 6.
This data collection method was completely unobtrusive, involved no interaction with road users,
and allowed for data collection without influencing driver or bicyclist behavior.
Figure 6. Field Setup for Elevated Video Recording of Road User Behavioral Data
Data were collected during a typical Saturday in summer 2011, as traffic volumes are
generally higher in the summer; tend to increase during this time given the scenic nature and
attraction of this roadway segment. The weather was comfortable and clear with temperatures in
the mid-80’s. Pairs of bicyclists from the research team rode continuous loops around each of
the study segments. The bicyclists were staggered such that a bicyclist was on each side of the
roadway at all times. The ends of each loop were clearly marked on the shoulder in order to
provide visual cues for bicyclists during data collection. All bicyclists rode in the prescribed
20-ft

30
lateral position for approximately one hour before taking a break and continuing in a different
lateral position during the subsequent loop. The loops were evenly distributed among three
predetermined lateral positions, which included: (1) within the center of the shoulder; (2) on the
left edge of the shoulder; and (3) on the right edge of the travel lane. A schematic of the data
collection plan is shown in Figure 7.
Figure 7. Schematic Diagram of Data Collection Plan

31
After completion of the field data collection, the videos were transferred to a computer
for review and data extraction. During the video review, data were randomly checked to ensure
continued consistency and precision among observers, as well as compliance with the review
protocol. Figure 8 shows an example screenshot from a video review.
Figure 8. Example Screenshot of Video Review
Field data collection was performed under two separate conditions. The first condition of
data was collected at both of the segments, one segment with CLRS and the similar segment that
did not have CLRS. This was performed with all existing traffic control devices along both of
the study segments. Table 7 shows the raw data of the field study without the “Share the Road”
sign.
Table 7. Vehicular and Bicycle Volumes – Without Signs – 7/16/11
PERIOD WITH RUMBLE STRIPS WITHOUT RUMBLE STRIPS
MINUTES VEHICLES BICYCLES MINUTES VEHICLES BICYCLES
1 64 196 35 61 160 35
2 64 227 39 65 225 52
3 65 269 47 65 253 59
4 65 276 19 65 249 30
5 65 248 38 65 249 44 TOTAL 323 1216 178 321 1136 220
AVERAGE HOURLY
VOLUMES - 226 33 - 212 41

32
The second wave of data collection was performed at the same highway locations,
however with a “Share the Road” sign installed for both directions of flow in the study segment.
Table 8 displays this summary of field data.
Table 8. Vehicular and Bicycle Volumes – With Signs – 8/20/11
PERIOD WITH RUMBLE STRIPS WITHOUT RUMBLE STRIPS
MINUTES VEHICLES BICYCLES MINUTES VEHICLES BICYCLES
1 20 60 4 18 68 1
2 65 302 47 68 257 65
3 66 368 44 68 328 66
4 65 159 41 65 313 41
5 36 218 16 12 58 6
TOTAL 252 1107 152 231 1024 179 AVERAGE HOURLY
VOLUMES - 264 36 - 266 46
Statistical Analysis for Impacts of CLRS on Vehicular Lateral Positioning When Passing a
Bicyclist
A statistical analysis was performed to investigate the impacts on CLRS on the rate at
which motor vehicles rode onto or over the centerline while passing a bicyclist. Two measures
of effectiveness were considered:
Percent of vehicles that contacted the centerline when passing a bicyclist
Percent of vehicles that crossed at least halfway into the opposing lane when passing
a bicyclist
Because each of the MOEs were expressed as a dichotomous rate of occurrence (e.g.,
crossed the centerline vs. did not cross the centerline), a two sample z-test of proportions was
utilized to determine the statistical significance of any differences in the MOEs between the two
study locations (i.e., segment with CLRS vs. segment without CLRS). The calculated z-statistic
for the difference in the two proportions is computed as follows:
21
12
111
nnpp
ppz

33
Where:
z = calculated z-statistic from standard normal distribution
p1 = sample MOE for location with CLRS
p2 = sample MOE for location without CLRS
p = combined sample rate across both locations = 21
2211
nn
pnpn
n1 = sample size (i.e., number of vehicle/bicycle passing events) for location with CLRS
n2 = sample size (i.e., number of vehicle/bicycle passing events) for location without
CLRS
The null hypothesis (h0) was that the CLRS produced no change in the MOE (i.e., p1 =
p2). The alternative hypothesis was that the CLRS produced a change in the MOEs. As such,
two-tailed tests were utilized. The z-test of proportions assumes a normal sampling distribution
for the proportion, pi, for each ith population. The assumption of normality is generally valid as
long as pi is not too close to either 0 or 1 and the sample, ni, is relatively large. The normality
assumption is typically valid if nipi and ni(1-pi) are both greater than or equal to 5. This
condition is met for the data reported herein and the assumption of normality is valid for the
sampling distributions of pi. The results of the z-test of proportions are shown in Table 9.
Table 9. Statistical Results for Impacts of CLRS on Vehicular Lateral Positioning When Passing a Bicyclist
MOE W/O
CLRS W/
CLRS ARITHMETIC DIFFERENCE
Z-SCORE STATISTICALLY
SIGNIFICANT DIFFERENCE?
Percent of Vehicles Contacted the Centerline when Passing a Bicyclist
79.0% 71.1% -7.9 -3.16 Yes
Percent of Vehicles Crossed at Least Halfway into Opposing Lane when Passing a Bicyclist
17.9% 14.9% -3.0 -1.40 No
Note: Total vehicle/bicycle passing events = 626 w/o CLRS and 571 w/ CLRS. The critical z-score for the two-tailed test of proportions was ±1.96, representing a 95 percent confidence level.

34
The presence of centerline rumble strips was found to decrease the percentage of motor
vehicles making contact with the centerline from 79.0 percent to 71.1 percent, which was
statistically significant at 95 percent confidence. Motor vehicles were also less likely to cross at
least halfway over the centerline when bicyclists were present, though this effect was not
significant at 95 percent level of confidence. Overall, these findings show that while drivers
generally tended to ride onto or across the centerline when passing bicyclists, they did so less
frequently when centerline rumble strips were present.
Table 10 shows the results of a comparison of driver performances with and without the
“Share the Road” sign. There was a slight decrease in the MOE “vehicle contacted the
centerline” (75.4 percent without sign to 74.1 percent with sign); however this change was not
statistically significant. The percent of vehicles that crossed at least halfway into the opposing
lane was also insignificant with the “Share the Road” sign, as compared to the condition without
it. However, this static sign can be used in such locations, even if it has only limited effect, since
it is a relatively inexpensive device.
Table 10. Results of the Impacts of Share the Road Sign on Vehicle Lateral Placement
MOE WITHOUT
“SHARE THE ROAD” SIGN
WITH “SHARE THE ROAD” SIGN
ARITHMETIC DIFFERENCE
PERCENT DIFFERENCE
Percent of Vehicles Contacted the Centerline
75.4% 74.1% -1.3 -1.7%
Percent of Vehicles Crossed at Least Halfway Into Opposing Lane
16.4% 15.9% -0.5 -3.0%
Note: Differences were not statistically significant.
35
Bicyclist Opinion Survey
An online survey pertaining to non-freeway rumble strips was developed by the WSU-TRG and
distributed to members of the Michigan bicycling community in May 2011. The purpose of the
survey was to obtain feedback from bicyclists regarding their perceptions and experiences related
to centerline and shoulder rumble strips on high-speed, non-freeways in Michigan. Of particular
interest were their perceptions of the impact of centerline and shoulder rumble strips on safety
and comfort of bicyclists. The survey was distributed through the League of Michigan Bicyclists
(LMB), which is a non-profit group that serves to promote bicycling and bicyclist safety in
Michigan.
A total of 213 completed survey responses were received. In terms of exposure to non-
freeway rumble strips, a majority of responding bicyclists had encountered rumble strips in
Michigan. Greater than 80 percent of these respondents claimed to ride differently on roadways
with rumble strips installed, and approximately one-half of respondents avoid roadways with
rumble strips completely. Approximately one-quarter of respondents felt less safe on roadways
with only centerline rumble strips, while nearly half of respondents felt less safe on roadways
with both centerline and shoulder rumble strips.
In terms of suggestions for improving safety on non-freeway roadways with rumble
strips, approximately two-thirds of respondents agreed that a special sign or pavement markings
in advance of rumble strips sections would be helpful to bicyclists. Approximately 60 percent of
all respondents believed that MDOT’s current shoulder width standard of 6 feet for shoulder
rumble strip installation was appropriate, while approximately 40 percent suggested that this
minimum shoulder width be increased beyond 6 feet. The responses also indicated that the
current MDOT standard 12 foot gap between continuous shoulder rumble strip installation cycles
was not long enough to allow for safe navigation – particularly on steep downgrades. The
responses to the primary safety and/or comfort issues for bicyclists were summarized as follows,
with complete responses listed in Appendix III.
- 88% ride differently on roadways with rumble strips
- 52% avoid roadways with rumble strips
- 60% believe 6-ft is appropriate minimum shoulder width for SRS
36
- 23% believe 12-ft is appropriate gap length on normal section for bicyclist
maneuverability
- 6% believe 12-ft is appropriate gap length on steep downgrade for bicyclist
maneuverability
- 27% feel less safe on roadways with centerline rumble strips only
- 47% feel less safe on roadways with centerline and shoulder rumble strips
- 67% believe that special signs or pavement markings in advance of rumble strip
sections would be helpful to bicyclists
It is important to note that this “Bicyclist Opinion Survey” was not intended to capture opinion
about alternative design standards.

37
VI. IMPACT OF SHORT-TERM PAVEMENT PERFORMANCE DUE TO
INSTALLATION OF CLRS If left untreated or not maintained, all pavements will deteriorate over time. The rate of
deterioration is often affected by several factors, including the applied load cycle due to
automobile traffic volume, temperature, moisture, and age (45). Pavement performance is often
quantified by roadway agencies using direct measurement of distress in the pavement surface.
These measures may include quantity (i.e., frequency), extent (i.e., length), or severity (width or
size). Cracking specifically is one of the most common distresses that affect performance (46).
Past research has examined the effects of various factors on crack propagation, including the
pavement structure, materials, traffic volumes, environmental factors, and age (46).
In Michigan, the non-freeway rumble strip installations have generally been milled into
the existing pavement surface. This milling process causes the effective pavement surface
thickness to be reduced in the milled areas that may allow moisture to infiltrate to the bottom of
the pavement surface on a thinner asphalt layer. Limited research exists pertaining to
quantitative assessment of pavement deterioration caused or accelerated by the installation of
rumble strips.
In 2001, the Colorado Department of Transportation performed an in-house evaluation of
a pilot implementation of centerline rumble strips (26). This evaluation involved subjective
visual field assessments conducted on an annual basis, to identify whether any distress had
developed in the rumble strip grooves. After monitoring for a period of five years, it was
determined that the rumble strips did not have any significant detrimental effect on pavement
life.
In 2004, Russell, et al. conducted a nationwide survey of issues related to centerline
rumble strips, which solicited information regarding pavement deterioration problems or
maintenance concerns (25). Of 24 responding states, 15 indicated that there was no effect on
pavement deterioration or problems for drivers because of water accumulation in the rumble
strips. Two states indicated that they had experienced problems and seven states were unsure.
The two states that had experienced issues were Alaska and Oregon. Alaska noted pavement

38
deterioration only when rumble strips were installed in chip seals or otherwise compromised
pavements. They also commented that snow or ice could become compacted into the rumble
strips and persist for a short time after a storm, although this problem typically resolved itself as
the compaction was cleared by passing traffic. The State of Oregon noted that water
accumulation could also lead to premature pavement deterioration.
In 2008, the Minnesota Department of Transportation released a report on the long-term
maintenance effects of rumble strips on asphalt concrete pavements (47). This research involved
the implementation of a state-of-the-practice survey among all Minnesota counties and state
DOT district offices. Respondents were asked about the type and quantity (length) of rumble
strips installed in their jurisdiction, as well as whether they observed the presence of any
pavement distresses in the rumble strips and what kind of treatments were being used to address
pavement issues. A similar survey was sent to all state DOT’s to collect data on a national level.
The results showed that all Minnesota counties and 67 percent of the state DOT district offices
observed the development of distress in the rumble strips while only 10 of the 24 State DOT’s
who replied to the survey reported a similar finding. The study concluded there is a general
concern that pavement damage can be caused by grinding in rumble strips on an HMA pavement
surface. However, a 2003 study in Texas contradicts some of these claims as rumble strips were
found to have minimal effect on pavement deterioration (7). This study reports that field tests
showed the vibration created by wheels passing over the rumble strips were strong enough to
remove debris, ice, and water.
Overall, there is a gap in the knowledge pertaining to the impacts of rumble strips on
pavement condition. In order to address this need, this study involved a visual review of
pavement imagery data from high-speed, two-lane rural highways throughout the State of
Michigan. The effects of centerline rumble strips were assessed by comparing the rate of crack
propagation between road segments where rumble strips were installed, and similar control
segments where rumble strips were not installed.
Review of Pavement Imagery Data
As a part of the pavement management program, MDOT conducts an annual inventory of the
pavement condition (video of the pavement surface) on all state-maintained roads. Data are
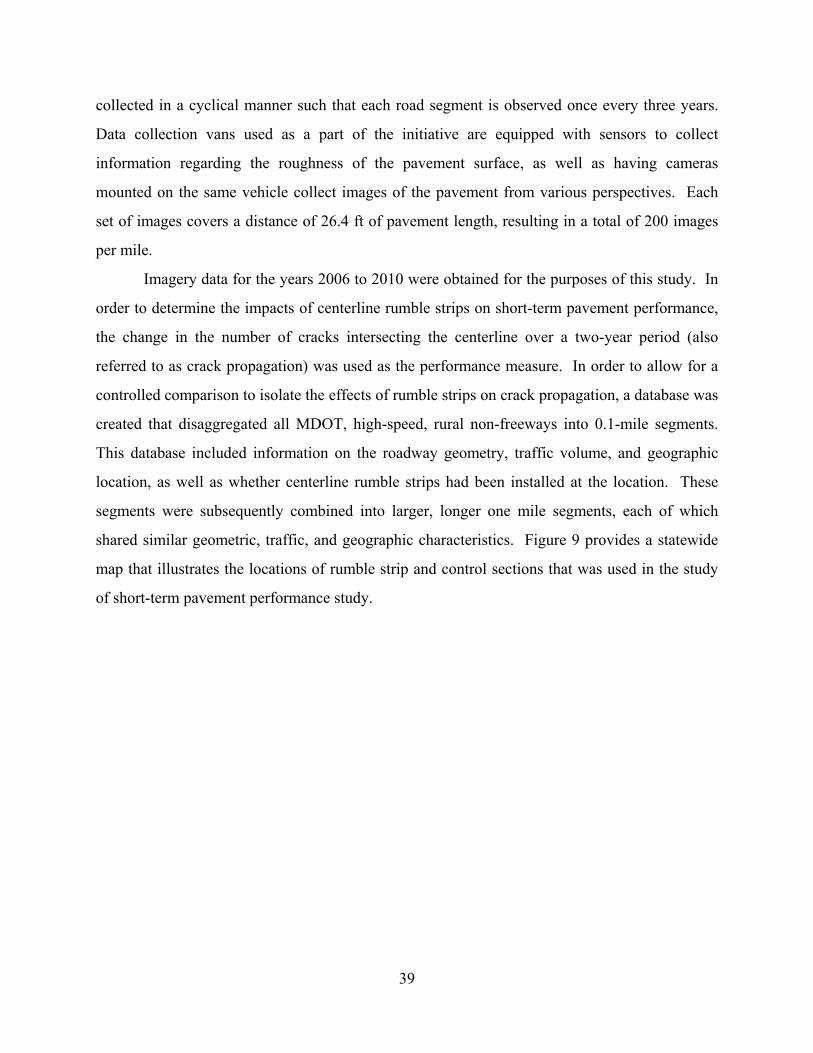
39
collected in a cyclical manner such that each road segment is observed once every three years.
Data collection vans used as a part of the initiative are equipped with sensors to collect
information regarding the roughness of the pavement surface, as well as having cameras
mounted on the same vehicle collect images of the pavement from various perspectives. Each
set of images covers a distance of 26.4 ft of pavement length, resulting in a total of 200 images
per mile.
Imagery data for the years 2006 to 2010 were obtained for the purposes of this study. In
order to determine the impacts of centerline rumble strips on short-term pavement performance,
the change in the number of cracks intersecting the centerline over a two-year period (also
referred to as crack propagation) was used as the performance measure. In order to allow for a
controlled comparison to isolate the effects of rumble strips on crack propagation, a database was
created that disaggregated all MDOT, high-speed, rural non-freeways into 0.1-mile segments.
This database included information on the roadway geometry, traffic volume, and geographic
location, as well as whether centerline rumble strips had been installed at the location. These
segments were subsequently combined into larger, longer one mile segments, each of which
shared similar geometric, traffic, and geographic characteristics. Figure 9 provides a statewide
map that illustrates the locations of rumble strip and control sections that was used in the study
of short-term pavement performance study.
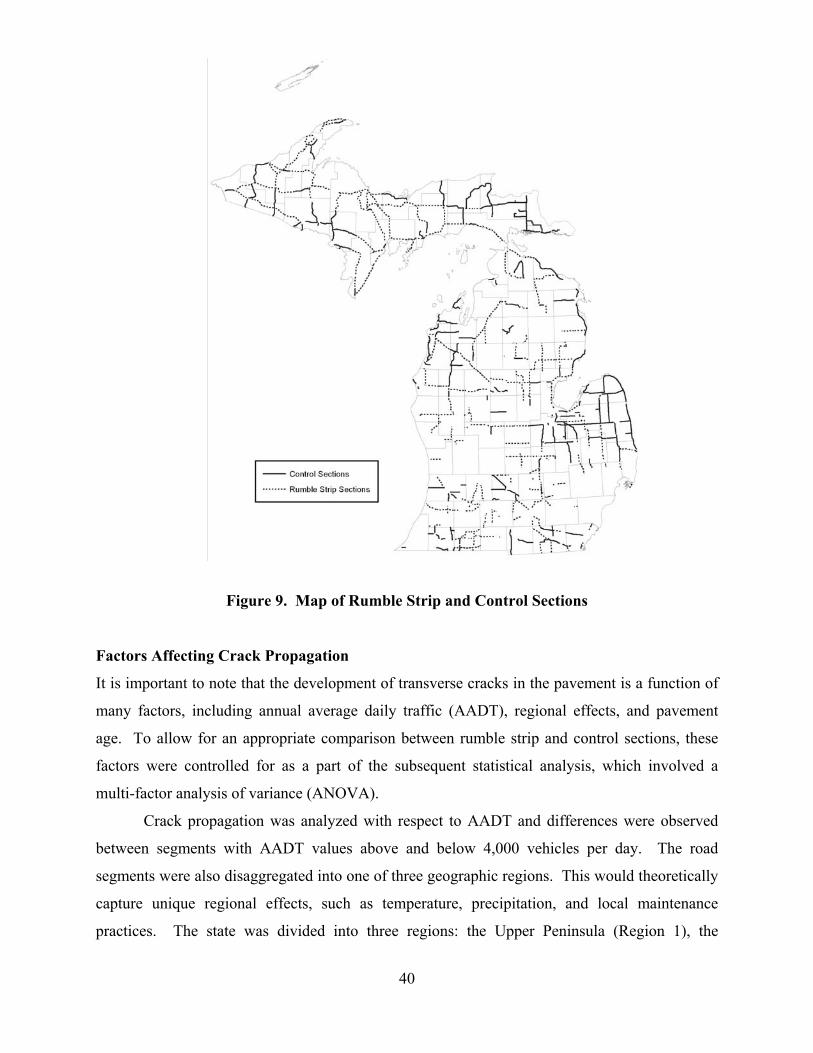
40
Figure 9. Map of Rumble Strip and Control Sections
Factors Affecting Crack Propagation
It is important to note that the development of transverse cracks in the pavement is a function of
many factors, including annual average daily traffic (AADT), regional effects, and pavement
age. To allow for an appropriate comparison between rumble strip and control sections, these
factors were controlled for as a part of the subsequent statistical analysis, which involved a
multi-factor analysis of variance (ANOVA).
Crack propagation was analyzed with respect to AADT and differences were observed
between segments with AADT values above and below 4,000 vehicles per day. The road
segments were also disaggregated into one of three geographic regions. This would theoretically
capture unique regional effects, such as temperature, precipitation, and local maintenance
practices. The state was divided into three regions: the Upper Peninsula (Region 1), the

41
Northern Lower Peninsula (Region 2), and the Southern Lower Peninsula (Region 3) as shown in
Figure 10. These regions were selected largely based upon similarities in weather, as differences
in Michigan’s freeze-thaw cycles are likely to impact pavement performances.
Figure 10. Map of Michigan Geographic Regions
Sampling Strategy for Pavement Condition Data
A representative sample of roadway segments was used to collect data. Random
sampling provided an adequate sample of data to assess differences in pavement condition before
and after, CLRS installation with a high degree of confidence in results that can be used to make
generalized statewide conclusions.

42
As a part of this process, it was first necessary to estimate an appropriate number of
0.1-mile roadway segments to allow for determination of whether the rumble strips have a
significant impact on pavement surface cracking. The target number of 0.1-mile roadway
segments was determined based on the following equation:
2
22
21
2
ZZn ,
where n is the minimum sample size of 0.1-mile pavement segments, zα and zβ are probability-
based factors that represent the confidence level (95% for a one-tailed test) and power (80%) of
subsequent statistical tests, σ12 and σ2
2 are estimates of the variances of cracks per 0.1-mile
segment with and without rumble strips (i.e., “Before” and “After”), and Δ is difference in the
number of cracks per 0.1-mile segment after rumble strips are installed.
In order to estimate the target sample size, preliminary pavement condition data were
collected from the pavement surface imagery for 56 randomly selected roadway segments, each
of which was 1.0 mile in length. To help control for externally biasing environmental factors,
the segments were separated into three zones prior to sampling: Upper Peninsula (MDOT
Region 6), Northern Lower Peninsula (MDOT Region 4), and Southern Lower Peninsula (all
other MDOT regions).
These preliminary segments were randomly selected from the list of non-freeway high-
speed roadway segments for which 2007 imagery was available. Between 17 and 21 miles of
roadway segments were selected from each of the three zones. The 2007 pavement surface
imagery was reviewed for approximately 56 miles of roadway segments. Similar centerline
rumble strips were not installed on these roadways until 2008, the reviewed sample pavement
imagery represented the “Before” condition. Each pavement surface image was visually
reviewed to provide a numerical count of visible cracks that intersected the roadway centerline.
The cracking data were summarized for each 0.1 mile segment. The basic descriptive statistics
for pavement surface cracking is summarized in Table 11.

43
Table 11. Descriptive Statistics for Sample Centerline Surface Cracking Data
ZONE
NO. OF 0.1-MILE SAMPLE
SEGMENTS REVIEWED
AVERAGE SURFACE CRACKS
STANDARD DEVIATION (Σ) PER SEGMENT
Upper Peninsula 180 8.26 10.29
Northern Lower 207 6.13 9.01
Southern Lower 171 9.57 9.34
STATEWIDE 558 7.87 9.63
The standard deviation of the sample data were then utilized to compute the estimated
target sample sizes required in order to detect specific increases (Δ) in the mean number of
cracks, per 0.1 mile between the “Before” and “After” periods. These sample size estimates,
computed for each zone and overall, are shown in Table 12.
Table 12. Target Sample Sizes for Analysis of Pavement Distress Data by Zone and Statewide
INCREASE IN THE NUMBER OF CRACKS (Δ)
BETWEEN "BEFORE" AND "AFTER" PERIOD
(PER 0.1 MILE)
MINIMUM SAMPLE SIZE OF 0.1 MILE HIGHWAY SEGMENTS
UPPER PENINSULA
NORTHERN LOWER
SOUTHERN LOWER
STATEWIDE
NUMBER OF CRACKS
PERCENT OF
OVERALL MEAN*
Σ = 10.29 CRACKS/
SEGMENT
Σ = 9.01 CRACKS/
SEGMENT
Σ = 9.34 CRACKS/
SEGMENT
Σ = 9.63 CRACKS/
SEGMENT
0.98 12.5% 1,357 1,040 1,118 1,188
0.79 10.0% 2,120 1,625 1,747 1,857
0.59 7.5% 3,769 2,889 3,105 3,301
0.39 5.0% 8,479 6,501 6,986 7,427
0.20 2.5% 33,918 26,005 27,944 29,707
*Overall Sample Mean = 7.87 cracks per 0.1 mile

44
This analysis indicates larger sample sizes are necessary to detect smaller differences
between the “Before” and “After” periods. It is also evident that relatively little difference exists
in the sample standard deviations for comparing cracking between each of the three zones.
Ultimately, a sample of 457 miles of pavement sections was selected for analysis. This
included 275 miles of highways where rumble strips had been installed, and 182 miles of control
sections where there were none, and in both cases, two sets of imagery were available that
allowed the assessment for deterioration. The number of miles reviewed in each group was
increased in some cases to provide more thorough coverage with respect to each of the factors
previously described (geographic region, AADT, and pavement age). Table 13 provides
summary statistics detailing the number of miles of pavement imagery that were reviewed within
the various categories of the aforementioned factors with respect to whether the segment was
from a road segment with rumble strip or control section. Two-sample Kolmogorov-Smirnov
tests (48) were conducted and showed that there were not any significant differences between the
roads with rumble strip and control section distributions with respect to these key factors.
Table 13. Data Summary
FACTOR CLASSIFICATION RS INSTALLED
(MILES)
NO RS INSTALLED
(MILES)
ALL (MILES)
REGION
Region 1 131 58 189
Region 2 85 69 154
Region 3 59 55 114
Total 275 182 457
AADT
Under 4,000 165 109 274
Over 4,000 110 73 183
Total 275 182 457
PAVEMENT AGE
(SECOND YEAR)
2 yrs old 28 26 54
3 yrs old 43 36 79
4 to 5 yrs old 105 64 169
6+ yrs old 99 56 155
Total 275 182 457

45
Procedure for Pavement Imagery Review
Imagery data were reviewed through a proprietary software program (Pathview II) used by
MDOT as a part of the pavement management system. All personnel who reviewed the
pavement imagery were trained on the use of this software. As a part of the training, a series of
sample segments were independently reviewed by all participants. Each staff member was
required to match the actual number of cracks intersecting the centerline on these segments,
determined prior to the training. In addition, select pavement sections were randomly checked
by a second observer during the course of this study to ensure consistency and precision of
results. Figure 11 provides a screenshot of the software, which allows users to view multiple
windows that include pavement images, and identifying information for each set of images.
When reviewing the imagery, the first step was to verify the information in the database,
specifically whether the site had rumble strips installed or not, and whether the segment was a
high-speed, two-lane, non-freeway. The numbers of transverse cracks intersecting the centerline
of the roadway were counted for each analysis segment. For the sections where rumble strips
were installed, pavement imagery was reviewed one year prior to installation and one year after
installation. For the control sections, one set of imagery was reviewed for a baseline year and
another set of images that were taken two years later. Examining the increase in the number of
cracks over this two-year period allowed for a direct comparison of crack propagation between
the rumble strip and the control sections.
For the purposes of this study, only transverse cracks that intersected the centerline were
counted, as these are the types of cracks most directly related to the rumble strips. Longitudinal
cracks or transverse cracks that did not intersect the centerline were assumed to be due to other
factors. Figure 12 shows example imagery from a specific segment before and after rumble strip
installation. It can be observed from this image that one new transverse crack had developed.

46
Figure 11. Pathview II Software – Display Windows
Figure 12. Example Pavement Imagery from Before and After Rumble Strip Installation
Before (No cracks) After (One crack)
New crack developed
after two years

47
Results
Tables 14 and 15 present summary statistics detailing the number of transverse cracks that were
found to intersect the centerline of the roadway for the rumble strip and control sections,
respectively. In each table, these data were aggregated by geographic region and AADT as
described previously. Within each region/AADT category, the number of 0.1-mile segments that
were observed is presented, along with the mean number of cracks per segment observed during
the “before” and “after” periods. Lastly, the increase in cracks per 0.1-mile segments is also
presented.
The results show that crack propagation tended to be greater in the more urbanized
southern regions of the state and less rapid in the Upper Peninsula. The increase also tended to
be greater at higher traffic volume areas. These trends were observed in both the rumble strip
and control sections.
Table 14. Cracking Results for the Rumble Strip Sections
REGION AADT
CATEGORY
SAMPLE SIZE
(0.1 MILE SEGMENTS)
RUMBLE STRIP SECTIONS TRANSVERSE CRACKING DATA
NO. OF CRACKS BEFORE
INSTALLATION
NO. OF CRACKS AFTER
INSTALLATION
INCREASE IN CRACKSDURING
TWO-YEAR PERIOD
MEAN STANDARD DEVIATION
MEAN STANDARD DEVIATION
MEAN STANDARD DEVIATION
I
TOTAL 1,320 6.10 8.52 9.14 9.79 3.04 4.32
AADT 4,000 1,080 5.69 8.48 8.62 9.63 2.93 4.42
AADT 4,000 240 7.92 8.47 11.49 10.14 3.57 3.83
II
TOTAL 870 8.68 10.82 11.98 11.70 3.30 5.07 AADT 4,000 350 8.74 11.18 11.19 12.18 2.45 4.69
AADT 4,000 520 8.64 10.58 12.51 11.35 3.87 5.24
III
TOTAL 600 11.78 13.13 16.35 14.85 4.57 5.14 AADT 4,000 240 14.33 14.53 19.20 15.68 4.87 5.48
AADT 4,000 360 10.08 11.83 14.45 13.98 4.38 4.90
STATEWIDE
SAMPLE
TOTAL 2,790 8.12 10.62 11.58 11.96 3.45 4.78 AADT 4,000 1,670 7.57 10.58 10.68 11.81 3.11 4.70
AADT 4,000 1,120 8.95 10.62 12.91 12.07 3.97 4.87

48
Table 15. Cracking Results for the Control Sections
REGION AADT
CATEGORY
SAMPLE SIZE
( 0.1 MILE SEGMENTS)
CONTROL SECTIONS TRANSVERSE CRACKING DATA
NO. OF CRACKS INITIAL YEAR
NO. OF CRACKS AFTER TWO YEARS
INCREASE IN CRACKS DURING
TWO-YEAR PERIOD
MEAN STANDARD DEVIATION
MEAN STANDARD DEVIATION
MEAN STANDARD DEVIATION
I
TOTAL 580 6.19 9.08 9.45 10.78 3.26 5.77
AADT 4,000
440 4.12 6.73 6.35 8.19 2.23 3.81
AADT 4,000
140 12.70 12.01 19.21 12.09 6.51 8.88
II
TOTAL 670 7.14 12.05 10.65 15.26 3.51 5.40
AADT 4,000
400 6.23 12.34 9.09 15.46 2.86 4.80
AADT 4,000
270 8.50 11.48 12.96 14.68 4.46 6.07
III
TOTAL 550 6.03 8.41 10.73 10.20 4.70 4.92
AADT 4,000
230 4.50 7.43 9.76 9.95 5.25 5.56
AADT 4,000
320 7.13 8.89 11.43 10.33 4.30 4.36
STATEWIDE SAMPLE
TOTAL 1,800 6.50 10.12 10.29 12.49 3.79 5.41
AADT 4,000
1,070 4.99 9.39 8.10 11.84 3.11 4.74
AADT 4,000
730 8.70 10.72 13.49 12.74 4.78 6.14
Table 16 presents a comparison of the increases in crack propagation between the test (i.e.,
rumble strip) and control sections by region. In each case, the increase in cracks during the two-
year analysis period was marginally higher in the control sections in comparison to rumble strip
sections. While these differences were not statistically significant, these data suggest that rumble
strips did not create adverse impacts on pavement performance in the short-term.
Table 16. Comparison of Increase in Cracks Between Rumble Strip and Control Sections
REGION
INCREASE IN CRACKS PER 0.1 MILE DURING A TWO-YEAR PERIOD
T-TEST STATISTIC
P-VALUE SIGNIFICANTDIFFERENCE?
RUMBLE STRIP SECTIONS
CONTROL SECTIONS
MEAN STANDARD DEVIATION
MEAN STANDARDDEVIATION
I 3.04 4.32 3.26 5.77 -0.82 0.41 No
II 3.30 5.07 3.51 5.40 -0.78 0.44 No
III 4.57 5.14 4.70 4.92 -0.44 0.66 No

49
VII. ROADSIDE NOISE STUDY While the installation of rumble strips may provide a safety benefit, the noise produced by
vehicles traveling over the rumble strips may create an undesirable level of noise for local
residents (49,50,51,52). A number of transportation agencies including MDOT, have received
complaints about such noise after rumble strips were installed. In order to provide a quantitative
assessment of noise levels produced by rumble strips when in contact by vehicles, research was
performed to evaluate roadside noise produced by them on rural two-lane highways in Michigan.
Sound Fundamentals
The intensity of sound is measured using either Pascals (Pa) or decibels (dB), which is a
logarithmic measure of the effective sound pressure level compared to a standard reference level.
Not all frequencies of sound are detected by the human ear. Consequently, sound measurement
is typically performed using the “A”-weighted decibel scale (denoted as dBA), which provides
the closest approximation to the response of the human ear (53). Conversion from Pascals to
decibels is based on the following equation:
oP
PL log20 (2)
Where:
L = sound pressure level in decibels
P = sound pressure level in Pascals
Po = reference sound pressure level in Pascals = 0.00002 (typical threshold of human
hearing)
Roadside Noise Measurement
Transportation agencies are often confronted with noise issues related to traffic. The FHWA
maintains guidelines for the assessment of roadside traffic noise levels (34). These guidelines
recommend collection of ambient roadside noise data during a typical 60-minute period using a
calibrated A-weighted sound meter. The sound meter is to be positioned 5 ft above the roadway
50
and at the specific point of interest along the roadside, typically less than 100 ft from the center
of the nearest travel lane. Ambient roadside noise data is commonly summarized using:
Leq, which is the average sound pressure level and/or
L10, which is the sound pressure level that is exceeded 10 percent of the time (90th
percentile sound pressure level).
In order to assess the impact of ambient traffic sound levels on the surrounding environment, the
FHWA has established threshold levels for Leq and L10 for various land-use categories (53).
These categories and the respective sound thresholds include the following:
Category A: Lands where serenity and quiet are of extraordinary significance and serve
an important public need: Leq=57 dBA, L10=60 dBA
Category B: Picnic areas, recreation areas, playgrounds, sports areas, parks, residences,
motels/hotels, schools, churches, libraries, and hospitals: Leq=67 dBA, L10=70 dBA
Category C: Developed lands, properties, or activities not included in Categories A or B:
Leq=72 dBA, L10=75 dBA
Category D: Undeveloped lands. No maximum sound pressure level.
The roadside noise produced by rumble strips has been investigated in past research.
Higgins and Barbel (52) determined that transverse in-lane rumble strips produce a low
frequency noise that increased the noise produced by a vehicle traveling through the site by 7 dB.
The noise levels produced by an automobile traveling over the rumble strips were slightly less
than those produced by the pass of a large truck. Gupta (49) measured external noise at a
distance of 10 ft from the edge of pavement. The measured roadside noise for vehicles traveling
over the rumble strips was 74-80 dB for passenger cars and 82-90 dB for trucks, representing up
to a 7 dB increase over baseline conditions when no contact with the rumble strips was made.
Chen (54) found that SRS increased exterior noise by 11 dB for vehicles traveling at 65 mph.
Sutton and Way (55) found that the rumble strips increased noise by 10 to 12 dB at the edge of

51
pavement, compared to noise increases of 8 dB and 7 dB when measured at 25 ft and 50 ft,
respectively. Rumble strip noise levels were approximately at baseline traffic noise levels at a
distance of approximately 200 ft from the edge of pavement.
Finley and Miles (17) measured roadside noise produced by a car and commercial vehicle
traveling over five types of rumble strips at 55 and 70 mph, at an offset of 50 ft from the edge of
the rumble strips. The car traveling over a hot-mix asphalt (HMA) pavement surface at 55 mph
produced an average baseline noise level of 71 dB and the commercial vehicle yielded a baseline
noise of 82 dB. Milled rumble strip noise over the same pavement type was 84 dB for the car
and 93 dB for the commercial vehicle. The chipseal pavement yielded a smaller increase in
noise due to rumble strips with a baseline of 77 dB for the car, and 85 dB for the commercial
vehicle with an average rumble strip noise of 81 dB and 87 dB, respectively.
Karkle, et.al (56,18) conducted a study in Kansas on the roadside noise generated by a car
and a van passing over rumble strips at 40 mph and 60 mph. Sound meters were placed at lateral
offsets of 50 ft, 100 ft, and 150 ft from the centerline of the highway. The highest sound level
measured was at 50 ft from centerline and was 82.36dB, while the lowest was recorded at 150 ft
and was 55.77 dB. It was also shown that commercial vehicles produced a higher level of noise
when compared to the rumble strip noise produced by the van and car.
Field Study
A controlled field study was performed to evaluate increases in roadside noise produced by
rumble strips on rural two-lane highways in Michigan as a function of rumble strip depth,
location (centerline vs. edgeline), and pavement surface type.
Twelve study sites were selected from the statewide list of MDOT-maintained two-lane
rural highways where rumble strips were installed in 2010. The study locations were selected to
provide a representative balance between various roadway and rumble strip characteristics. All
study locations had posted speed limits of 55 mph. The characteristics of the study sites are
shown in Table 17.
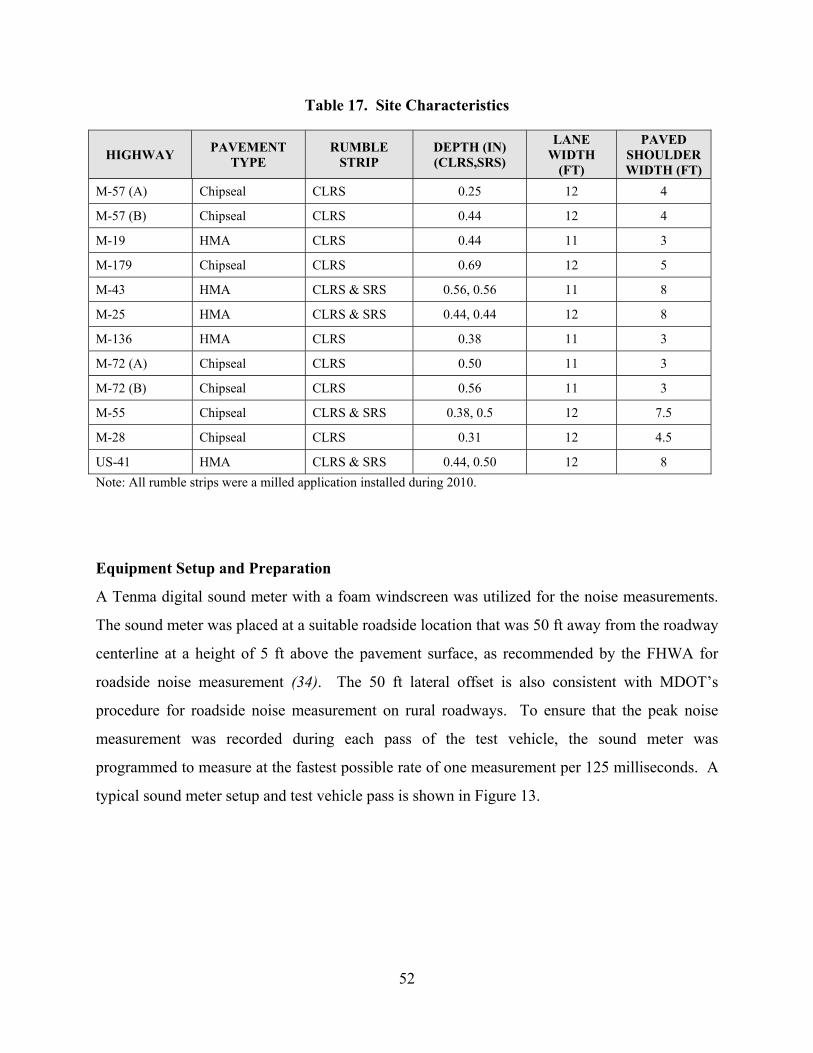
52
Table 17. Site Characteristics
HIGHWAY PAVEMENT
TYPE RUMBLE
STRIP DEPTH (IN) (CLRS,SRS)
LANE WIDTH
(FT)
PAVED SHOULDER WIDTH (FT)
M-57 (A) Chipseal CLRS 0.25 12 4
M-57 (B) Chipseal CLRS 0.44 12 4
M-19 HMA CLRS 0.44 11 3
M-179 Chipseal CLRS 0.69 12 5
M-43 HMA CLRS & SRS 0.56, 0.56 11 8
M-25 HMA CLRS & SRS 0.44, 0.44 12 8
M-136 HMA CLRS 0.38 11 3
M-72 (A) Chipseal CLRS 0.50 11 3
M-72 (B) Chipseal CLRS 0.56 11 3
M-55 Chipseal CLRS & SRS 0.38, 0.5 12 7.5
M-28 Chipseal CLRS 0.31 12 4.5
US-41 HMA CLRS & SRS 0.44, 0.50 12 8
Note: All rumble strips were a milled application installed during 2010.
Equipment Setup and Preparation
A Tenma digital sound meter with a foam windscreen was utilized for the noise measurements.
The sound meter was placed at a suitable roadside location that was 50 ft away from the roadway
centerline at a height of 5 ft above the pavement surface, as recommended by the FHWA for
roadside noise measurement (34). The 50 ft lateral offset is also consistent with MDOT’s
procedure for roadside noise measurement on rural roadways. To ensure that the peak noise
measurement was recorded during each pass of the test vehicle, the sound meter was
programmed to measure at the fastest possible rate of one measurement per 125 milliseconds. A
typical sound meter setup and test vehicle pass is shown in Figure 13.

53
Figure 13. Example Sound Meter Setup and Test Vehicle Pass
Relevant characteristics of the roadway and rumble strips were collected at each study
location. These data included the lane width, shoulder width, length and width of the
corrugations, spacing, and rumble strip depth. Depth measurements were taken for five
randomly selected rumble strip corrugations that were in close proximity of the sound meter. A
custom depth gauge was used to measure the depth to the bottom of the corrugation to the
nearest 0.0625 (1/16th) of an inch. The reported depth was then taken from the average of the
five readings. The depth measurements did not vary by more than ± 0.0625 of an inch within a
given study site.
Controlled Roadside Noise Measurement with Test Vehicle
A 2010 Chrysler Town and Country minivan was used as the test vehicle for all controlled noise
measurements. The test vehicle made 40 passes through each study site at the prescribed speed
of 55 mph. Twenty (20) passes were performed while making continuous contact with the
centerline rumble strips. The remaining 20 passes were performed while driving as close to the
centerline rumble strips as possible, without making contact, which was considered the
“baseline” noise produced by the test vehicle. An additional 20 passes were also performed
50 ft
5 ft

54
while driving on the shoulder rumble strips at the four locations. The groups of vehicle passes
were also equally subdivided between the vehicle traveling in the near side lane (closest to meter
set-up) and the far side lane.
In order to maintain maximum safety and measurement accuracy, a team of three
personnel were used during the field study. One person was stationed at the roadside to watch
for approaching traffic. Another person was stationed at the sound meter and recorded the peak
noise measurement for each pass of the test vehicle. The third individual drove the test vehicle.
They communicated using a two-way radio during each pass. To ensure safety of the data
collectors, data were only collected on tangent sections with ample sight distance.
The peak decibel level was measured during each pass of the test vehicle, which occurred
when the vehicle was approximately tangent to the meter. A typical vehicle pass over a
centerline rumble strip is shown in Figure 13 (page 53). The data collectors ensured that no
other vehicles were present in the study area during each pass of the test vehicle. In addition to
measurement of the test vehicle passes, the peak decibel readings of random passerby tractor
trailer trucks were also taken as they passed by the sound meter, although no speed assessment
could be made. Truck noise was only recorded if no additional traffic was present. Note that
none of the trucks were traveling over the rumble strips during the noise measurement. To
account for noise due to uncontrolled factors at study sites, background noise measurements
were also recorded periodically when no vehicles were present in the area.
Ambient Roadside Noise Measurement
A 60-minute ambient noise measurement was recorded immediately after the controlled
evaluation using the identical sound meter setup. The meter was programmed to record one
measurement per second to the internal memory. Thus, a total of 3600 sound measurements
were recorded per 60-minute data collection period. A pole mounted video camera was also set
up nearby to observe vehicles passing by the meter which allowed for the determination of the
traffic volume, composition, and the occurrence of vehicles in contact with the rumble strips.
The videos were later reviewed to extract relevant information for vehicles passing by the sound
meter during the ambient noise recording period that included:
Vehicle type
Lane
Whether vehicle contacted the rumble strips (visual or audible confirmation)

55
Results
Descriptive Statistics
The noise data collection using the test vehicle yielded a total of 240 peak noise measurements
recorded while the test vehicle was traveling over CLRS, 240 baseline peak noise measurements
were also recorded while the test vehicle was traveling off the rumble strips. The noise
measurements were equally split between the 12 study locations and between the near side and
far side of the travel lanes. An additional 80 peak noise measurements were recorded while the
test vehicle was traveling over the SRS at the four locations. Peak noise measurements were
obtained for a total of 93 random passerby tractor trailer trucks. Table 18 presents the site-by-
site summary statistics for the noise evaluation using a test vehicle along with the overall
aggregated values for all sites.
Table 18. Results of Noise Measurements Using Test Vehicle
[Mean Peak Noise Measurements by Site (dBA)]
HIGHWAY TEST VEHICLE –
IN LANE (OFF RS)
TEST VEHICLE – ON CLRS
TEST VEHICLE – ON SRS
TRUCKS – IN LANE (OFF RS)
M-57 (A) 73.3 77.5 - 83.6
M-57 (B) 71.1 79.7 - 80.9
M-19 73.1 77.7 - 84.0
M-179 72.5 85.4 - 82.9
M-43 69.9 84.4 87.9 84.8
M-25 71.0 78.6 80.4 83.5
M-136 69.0 76.4 - -
M-72 (A) 74.5 83.3 - 84.2
M-72 (B) 71.0 85.1 - 82.8
M-55 76.0 77.6 78.1 81.6
M-28 73.1 76.4 - 81.9
US-41 73.8 77.8 80.2 82.6
OVERALL 72.6 80.7 82.5 83.0

56
Impact of Rumble Strip Location
It can be observed from Table 18 (page 55) that the overall baseline mean peak noise produced
by the test vehicle traveling at 55 mph without contacting the rumble strip was 72.61 dBA.
Contact with the CLRS during the test vehicle passes produced an increase in overall mean peak
noise by 8.11 dBA to 80.72 dBA. Contact with the SRS produced an even greater mean noise
level of 82.57 dBA. The sample of random tractor trailers produced mean peak noise levels of
83.08 dBA. The aggregated mean peak noise results are displayed graphically in Figure 14
along with the 95 percent confidence intervals.
Figure 14. Test Vehicle Noise Data Summary
The one-way ANOVA found these differences in noise levels with respect to the
characteristics of the passing vehicle to be statistically significant at a 95 percent level of
confidence. A post-hoc analysis using Tukey HSD showed that the mean noise produced by the
test vehicle traveling over the SRS was not significantly different from that of either the CLRS or
tractor trailers. While the mean noise produced by the test vehicle in contact with the CLRS was
not significantly different from the SRS, it was significantly lower than what was produced by
the tractor trailers.

57
The multi-factor ANOVA for CLRS noise indicated that several of the main factor
effects and factor interactions were statistically significant at a 95 percent confidence level. The
detailed ANOVA results are summarized as follows: Statistically significant variables
- Rumble strip depth
- Pavement surface type
- Travel lane during the vehicle pass
- Pavement surface type x travel lane during the vehicle pass (Interaction)
Statistically insignificant variables
- Average background noise at the study site when no vehicles were present
- Baseline test vehicle noise
The depth of the CLRS had the greatest effect on noise produced by the test vehicle when it
made contact, as indicated by the relative magnitude of the F-statistic. Figure 15 provides a
graphical representation of peak CLRS noise measurement versus depth. As expected, CLRS
noise levels were positively correlated with the depth of the corrugations, although this
correlation was non-linear, as evidenced by the sharp increase in peak noise at depths of
0.5 inches. For CLRS with depths of less than 0.5 inches, the mean peak noise was 77.82 dBA.
For CLRS with depths of 0.5 inches and greater, the mean peak noise increased by 6.8 dBA to
84.62.

58
Figure 15. Impacts of CLRS Depth Using Test Vehicle
Ambient Noise
The 60-minute ambient noise measurement summary statistics are shown for each study site in
Table 19. Three of the study locations had L10 levels that exceeded the noise threshold for land-
use Category B, while none of the locations exceeded the Leq threshold. It is unlikely that the
rumble strips had an influence in the threshold levels being exceeded due to the small number of
vehicles in contact with the rumble strips, during the 60-minute measurement periods at the
locations. Overall, a total of 23 vehicles (1.2 percent of all vehicles) were visibly and/or audibly
observed to contact the rumble strips in the vicinity of the noise meter during the measurement
periods. This equated to one rumble strip contact for every 85.4 vehicles or one contact every
28.7 minutes.
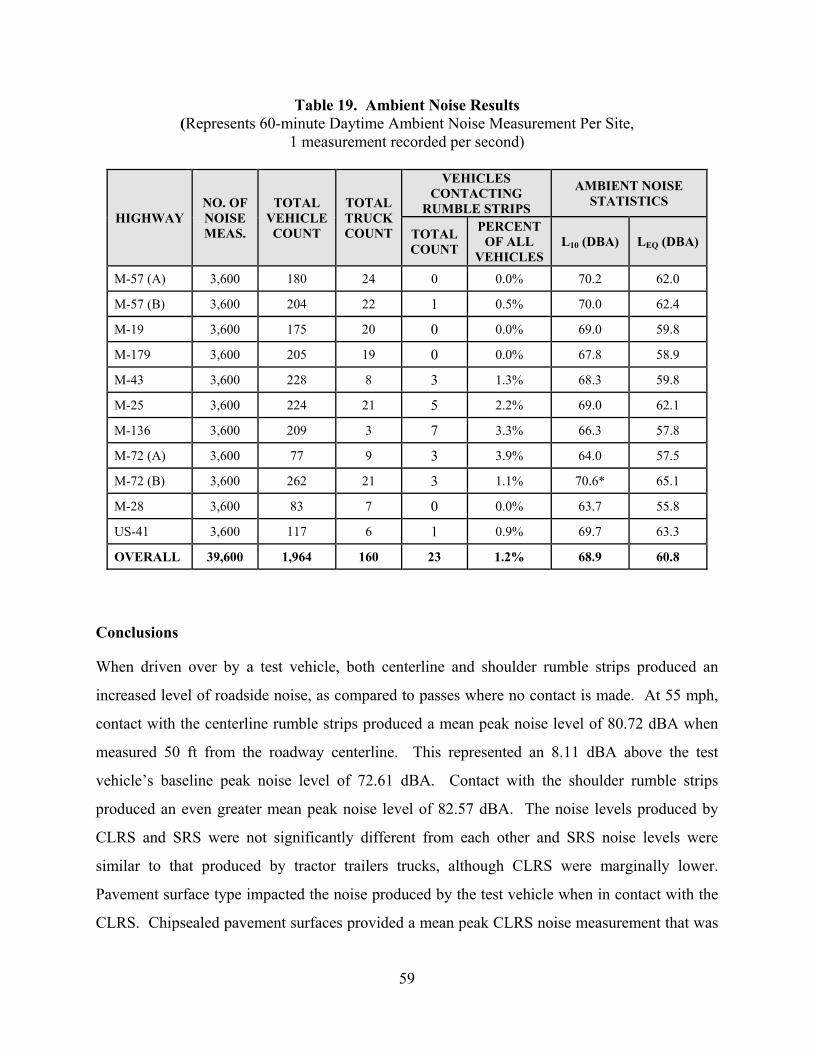
59
Table 19. Ambient Noise Results (Represents 60-minute Daytime Ambient Noise Measurement Per Site,
1 measurement recorded per second)
HIGHWAY NO. OF NOISE MEAS.
TOTAL VEHICLE COUNT
TOTAL TRUCK COUNT
VEHICLES CONTACTING
RUMBLE STRIPS
AMBIENT NOISE STATISTICS
TOTAL COUNT
PERCENT OF ALL
VEHICLES L10 (DBA) LEQ (DBA)
M-57 (A) 3,600 180 24 0 0.0% 70.2 62.0
M-57 (B) 3,600 204 22 1 0.5% 70.0 62.4
M-19 3,600 175 20 0 0.0% 69.0 59.8
M-179 3,600 205 19 0 0.0% 67.8 58.9
M-43 3,600 228 8 3 1.3% 68.3 59.8
M-25 3,600 224 21 5 2.2% 69.0 62.1
M-136 3,600 209 3 7 3.3% 66.3 57.8
M-72 (A) 3,600 77 9 3 3.9% 64.0 57.5
M-72 (B) 3,600 262 21 3 1.1% 70.6* 65.1
M-28 3,600 83 7 0 0.0% 63.7 55.8
US-41 3,600 117 6 1 0.9% 69.7 63.3
OVERALL 39,600 1,964 160 23 1.2% 68.9 60.8
Conclusions
When driven over by a test vehicle, both centerline and shoulder rumble strips produced an
increased level of roadside noise, as compared to passes where no contact is made. At 55 mph,
contact with the centerline rumble strips produced a mean peak noise level of 80.72 dBA when
measured 50 ft from the roadway centerline. This represented an 8.11 dBA above the test
vehicle’s baseline peak noise level of 72.61 dBA. Contact with the shoulder rumble strips
produced an even greater mean peak noise level of 82.57 dBA. The noise levels produced by
CLRS and SRS were not significantly different from each other and SRS noise levels were
similar to that produced by tractor trailers trucks, although CLRS were marginally lower.
Pavement surface type impacted the noise produced by the test vehicle when in contact with the
CLRS. Chipsealed pavement surfaces provided a mean peak CLRS noise measurement that was

60
1.92 dBA greater than that measured on HMA pavements. Ambient noise measurements at the
study sites showed a relatively low rate of vehicular contact with rumble strips, which
consequently did not impact ambient roadside noise levels. These findings were consistent with
those found in previous research.
The milled depth of the rumble strip corrugation had, by far, the greatest effect on the
noise produced by the test vehicle when contact was made with the rumble strips, although the
impact of depth was not linear, as evidenced by the sharp increase in peak noise at depths of
0.5 inches and above. The mean peak noise produced by CLRS with depths of at least 0.5 inches
was 84.62 dBA compared to 77.82 dBA for CLRS depths that were less than 0.5 inches,
representing a 6.8 dBA difference. CLRS with depths of at least 0.5 inches exceeded the noise
levels produced by tractor trailers by 1.54 dBA. Within the range of observed depth values
(0.25 inch to 0.69 inch), noise levels were found to increase by an average of 1.25 dBA per
0.0625 inch increase in rumble strip depth. To prevent unnecessarily high levels of unwanted
roadside noise, it is recommended that rumble strips be milled at depths between 0.25 and
0.50 inches.
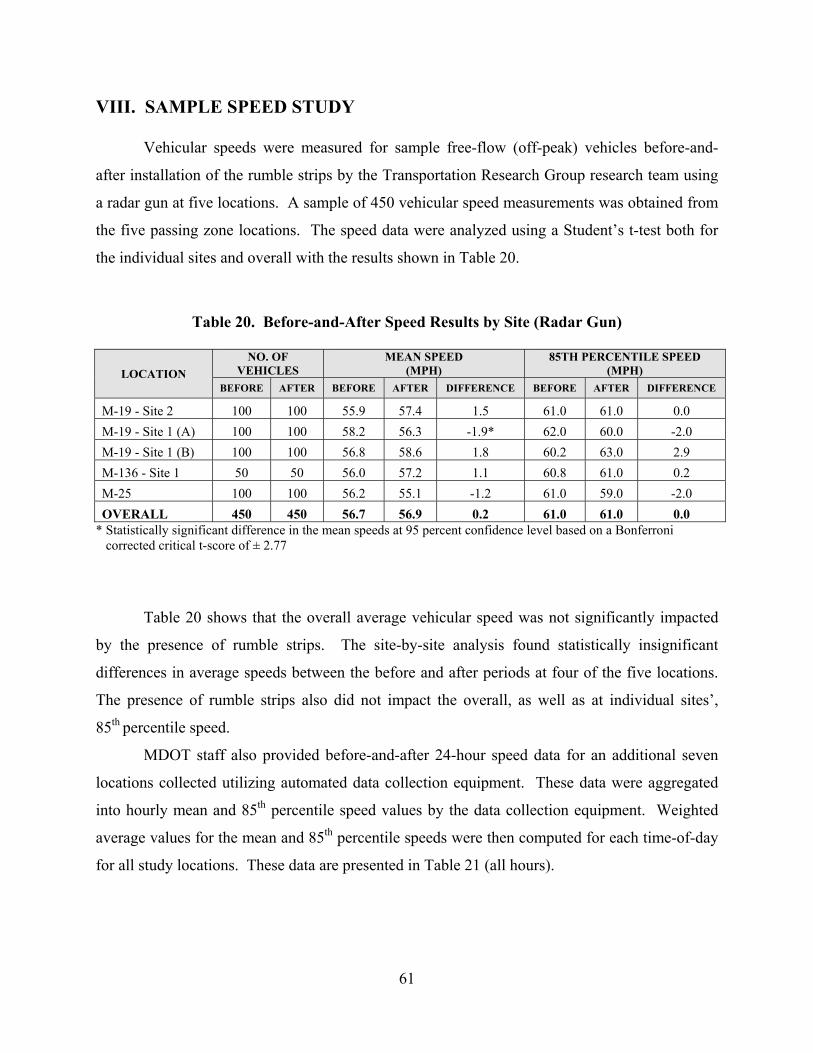
61
VIII. SAMPLE SPEED STUDY
Vehicular speeds were measured for sample free-flow (off-peak) vehicles before-and-
after installation of the rumble strips by the Transportation Research Group research team using
a radar gun at five locations. A sample of 450 vehicular speed measurements was obtained from
the five passing zone locations. The speed data were analyzed using a Student’s t-test both for
the individual sites and overall with the results shown in Table 20.
Table 20. Before-and-After Speed Results by Site (Radar Gun)
LOCATION
NO. OF VEHICLES
MEAN SPEED (MPH)
85TH PERCENTILE SPEED (MPH)
BEFORE AFTER BEFORE AFTER DIFFERENCE BEFORE AFTER DIFFERENCE
M-19 - Site 2 100 100 55.9 57.4 1.5 61.0 61.0 0.0
M-19 - Site 1 (A) 100 100 58.2 56.3 -1.9* 62.0 60.0 -2.0
M-19 - Site 1 (B) 100 100 56.8 58.6 1.8 60.2 63.0 2.9
M-136 - Site 1 50 50 56.0 57.2 1.1 60.8 61.0 0.2
M-25 100 100 56.2 55.1 -1.2 61.0 59.0 -2.0
OVERALL 450 450 56.7 56.9 0.2 61.0 61.0 0.0 * Statistically significant difference in the mean speeds at 95 percent confidence level based on a Bonferroni corrected critical t-score of ± 2.77
Table 20 shows that the overall average vehicular speed was not significantly impacted
by the presence of rumble strips. The site-by-site analysis found statistically insignificant
differences in average speeds between the before and after periods at four of the five locations.
The presence of rumble strips also did not impact the overall, as well as at individual sites’,
85th percentile speed.
MDOT staff also provided before-and-after 24-hour speed data for an additional seven
locations collected utilizing automated data collection equipment. These data were aggregated
into hourly mean and 85th percentile speed values by the data collection equipment. Weighted
average values for the mean and 85th percentile speeds were then computed for each time-of-day
for all study locations. These data are presented in Table 21 (all hours).

62
Table 21. Aggregated Before-and-After Speed Results by Time of Day (Automated Counters)
TIME MEAN SPEEDS (MPH) 85TH PERCENTILE SPEEDS (MPH)
BEFORE AFTER DIFFERENCE BEFORE AFTER DIFFERENCE
12:00 AM 57.9 57.4 -0.5 62.4 62.0 -0.4
1:00 AM 58.8 57.4 -1.4 63.5 61.6 -1.9
2:00 AM 59.9 58.6 -1.3 61.1 62.7 1.6
3:00 AM 54.1 57.7 3.6 60.5 61.0 0.5
4:00 AM 56.4 56.4 0.0 61.4 61.7 0.3
5:00 AM 58.2 58.2 0.0 62.3 62.7 0.5
6:00 AM 58.1 58.3 0.2 62.3 62.5 0.2
7:00 AM 58.1 58.9 0.7 62.2 62.9 0.8
8:00 AM 58.2 59.0 0.8 62.2 63.0 0.7
9:00 AM 58.3 58.4 0.1 62.3 62.6 0.3
10:00 AM 57.8 57.8 0.1 62.2 62.2 0.0
11:00 AM 57.5 57.7 0.2 62.3 62.0 -0.3
12:00 PM 57.8 57.8 0.0 61.9 62.1 0.2
1:00 PM 57.0 58.0 1.0 61.5 62.2 0.7
2:00 PM 57.6 57.7 0.1 61.5 62.1 0.6
3:00 PM 57.4 57.5 0.1 61.6 61.9 0.3
4:00 PM 57.9 57.6 -0.3 62.3 62.1 -0.2
5:00 PM 57.9 57.8 -0.2 62.3 62.0 -0.2
6:00 PM 58.2 57.9 -0.3 62.2 62.3 0.1
7:00 PM 58.1 58.1 0.0 62.5 62.6 0.1
8:00 PM 58.3 58.4 0.0 62.8 62.7 -0.1
9:00 PM 58.3 58.0 -0.3 63.0 62.7 -0.3
10:00 PM 57.9 57.3 -0.6 62.5 61.9 -0.6
11:00 PM 57.7 57.3 -0.5 62.8 61.9 -0.8
OVERALL 57.9 58.0 0.1 62.4 62.4 0.0 Note: The data shown in the table represent the weighted average values for data collected at the following seven locations: M-179 near 4th St., M-79 near Devine Rd, M-66 near Lake City, M-66 near Butler, M-44 west of M-91, M-44 near M-66, and M-50 near Lewis.
The aggregated hourly speed data shown in Table 21 demonstrated only nominal
differences in before-and-after mean and 85th percentile speeds for each hour of the day. As
expected, the greatest before-and-after differences were observed during the nighttime hours
when volumes are typically very low and free flow speeds prevail. During daytime hours,
neither the mean nor 85th percentile speeds varied by greater than 1.0 mph between the before-
and-after periods. The impact of installation of rumble strips on the overall mean and 85th
percentile speeds was negligible and was not statistically significant.

63
IX. ANALYSIS OF “BEFORE” CRASH DATA
As a part of analyzing impacts of MDOT’s 2008-2010 centerline rumble strip installation
program, it will be necessary to determine the safety consequences on lane departure crashes. A
“Before” and “After” study should be performed to properly investigate these effects. This
report presents the results of a detailed analysis of police-reported crash data, for the three-year
period before rumble strip installation on state maintained high speed, two-lane highways.
Data Collection
The Michigan Department of Transportation provided details of where centerline rumble strips
were installed as part of this program in each of the three years (2008-2010). MDOT compiled
these data from the annual restriping and construction contracts that were provided. Duplicate or
overlapping road segments in the database and other issues were corrected, resulting in a final
sample of 4,540 miles of highway as the candidate segments for analysis. It is important to note
this differs from the 5,326 total miles of highways that MDOT reports have received CLRS in
the three-year installation program. This is due to some MDOT offices not providing contract
completion data.
From this installation database, each of the highway segments were identified and crash
data for the “Before” period were queried via the Michigan State Police crash database. This
dataset included all crashes that occurred during the three years preceding installation of rumble
strips for each segment provided by MDOT and included a total of 54,767 crashes (Table 22).
As centerline rumble strips are designed to improve safety along mid-block road segments, all
crashes that were coded as having occurred at an intersection, interchange, or non-traffic area
were removed, resulting in a crash database totaling 41,979 crashes. The UD-10 crash report
forms for these crashes were acquired via the Traffic Crash Reporting System (TCRS).
Table 22. Summary of “Before” Crash Data
YEAR OF CLRS INSTALLATIONS
NO. OF ROADWAY
MILES
3 YEARS OF “BEFORE” CRASHES
INTERSECTION AND OTHER CRASHES
IRRELEVANT TO CLRS
CRASHES FOR MANUAL REVIEW
TOTAL
2008 1,494 4,489 14,537 19,026
2009 1,310 4,116 12,527 16,643
2010 1,736 4,183 14,915 19,098
TOTAL 4,540 12,788 41,979 54,767

64
The “MTCF Data Query Tool” was used to identify candidate crashes for the study segments.
The part of the Query Builder gives the following options:
- Intersections
- Interchange
- Mid-Block, and
- Non-Traffic Area
The crashes were then separated according to the noted locations. The entire three-year “Before”
crash data for each of the noted categories of locations are as follows:
- Intersections - 12,433
- Interchange - 354
- Mid-Block, and - 41,979
- Non-Traffic Area - 1
Total - 54,767
Manual Review
From this database of 41,979 crashes, it was necessary to determine the number of target crashes
that are potentially correctable by installation of rumble strips. Crashes were classified as target
if it was determined that the presence of centerline rumble strips may have potentially prevented
the crash, or otherwise influenced the severity of the crashes and the outcome. In addition to
these crashes, other crashes that may be correctable, but involved other specific contributing
circumstances, were also included in the target group of crashes. All 41,979 UD-10 forms were
individually analyzed and categorized as target or non-target based on the written description and
diagram provided on the form. The crashes were categorized into one of four categories:
Typical Target Crash - This includes crashes where the driver crossed the centerline
due to inattention, tiredness, an aggressive passing maneuver, or some other cause which
may be potentially correctable by the presence of a centerline rumble strip. It is
important to note that this category does not include crashes that may have had another
contributing circumstance or a prior event that may have forced the driver to cross or
touch the center line.

65
Alcohol/Drugs/Other Involved Crash - This includes crashes where the crash report
noted that the driver was impaired. However, a critical review of the diagram and the
crash report (UD-10) indicated that the vehicle encroached into the centerline and the
drift-off action could be alleviated by the installation of CLRS. This qualified category
produced a very small number of target crashes.
Adverse Pavement Condition - This category includes crashes where the crash report
noted that the wet/icy/snowy road conditions may have partially contributed to the driver
crossing the centerline. Drift-off crashes under adverse weather/pavement condition
often occur due to drivers’ selection of inappropriate speed for the condition. The portion
of crashes that was included in this target crash group was a small percentage
(approximately 10% of all non-intersection adverse pavement condition-related crashes)
of all adverse weather-related crashes. The UD-10 reports in this group of crashes noted
adverse pavement conditions and also the driver crossed the centerline without being
forced by contact with another vehicle or object. It is expected that the presence of
CLRS may impact the outcome in terms of reduction in speed and/or path of the errant
vehicle, thus impacting the outcome. In most cases, the UD-10 narrative does not
indicate if the driver is sleepy, inattentive or distracted.
The presence of CLRS even on a wet/icy/snowy pavement often creates one or more of
the following consequences:
1. Creates somewhat slightly bumpy ride, thus assists the driver regaining improved
control.
2. Allows speed reduction.
3. If there is hydroplaning, probably nothing can mitigate such crashes. True
hydroplaning crashes are extremely rare.
4. There are anecdotal stories from the Michigan Department of Transportation
(MDOT) and other local agency engineering and enforcement officials in the
Upper Peninsula that rumble strips provide the necessary tactile guidance during
white-out conditions and/or when the road surface is covered with snow.
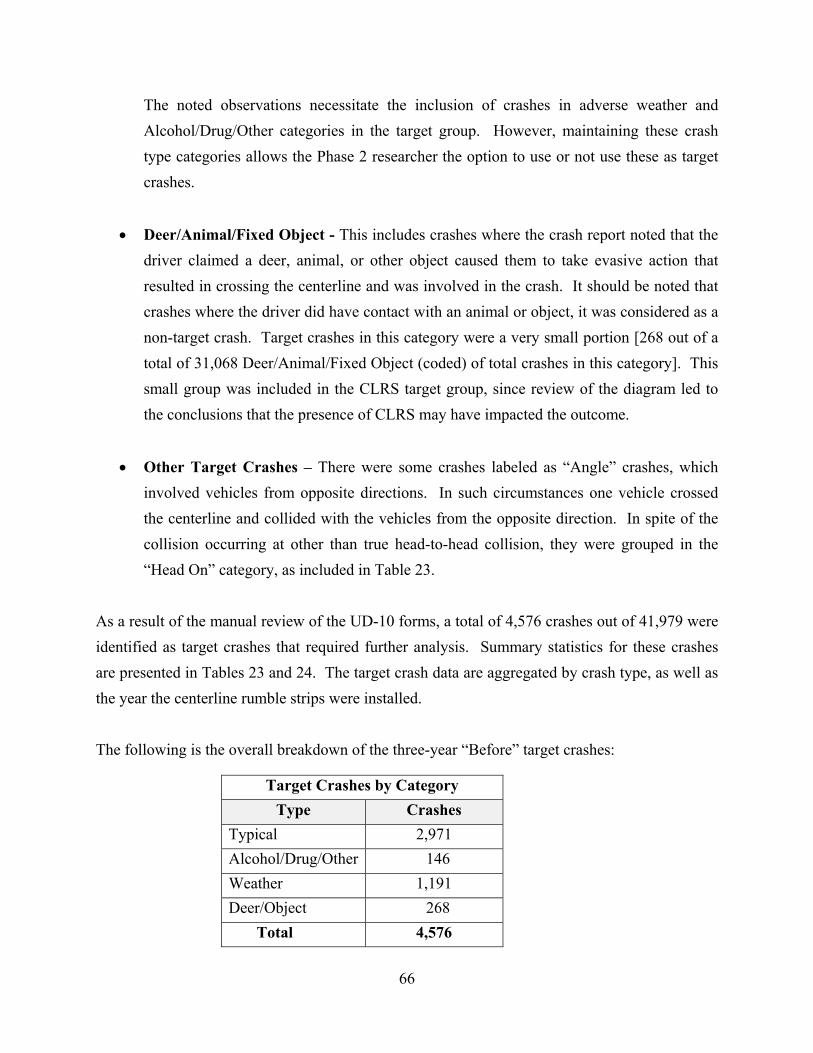
66
The noted observations necessitate the inclusion of crashes in adverse weather and
Alcohol/Drug/Other categories in the target group. However, maintaining these crash
type categories allows the Phase 2 researcher the option to use or not use these as target
crashes.
Deer/Animal/Fixed Object - This includes crashes where the crash report noted that the
driver claimed a deer, animal, or other object caused them to take evasive action that
resulted in crossing the centerline and was involved in the crash. It should be noted that
crashes where the driver did have contact with an animal or object, it was considered as a
non-target crash. Target crashes in this category were a very small portion [268 out of a
total of 31,068 Deer/Animal/Fixed Object (coded) of total crashes in this category]. This
small group was included in the CLRS target group, since review of the diagram led to
the conclusions that the presence of CLRS may have impacted the outcome.
Other Target Crashes – There were some crashes labeled as “Angle” crashes, which
involved vehicles from opposite directions. In such circumstances one vehicle crossed
the centerline and collided with the vehicles from the opposite direction. In spite of the
collision occurring at other than true head-to-head collision, they were grouped in the
“Head On” category, as included in Table 23.
As a result of the manual review of the UD-10 forms, a total of 4,576 crashes out of 41,979 were
identified as target crashes that required further analysis. Summary statistics for these crashes
are presented in Tables 23 and 24. The target crash data are aggregated by crash type, as well as
the year the centerline rumble strips were installed.
The following is the overall breakdown of the three-year “Before” target crashes:
Target Crashes by Category
Type Crashes
Typical 2,971
Alcohol/Drug/Other 146
Weather 1,191
Deer/Object 268
Total 4,576
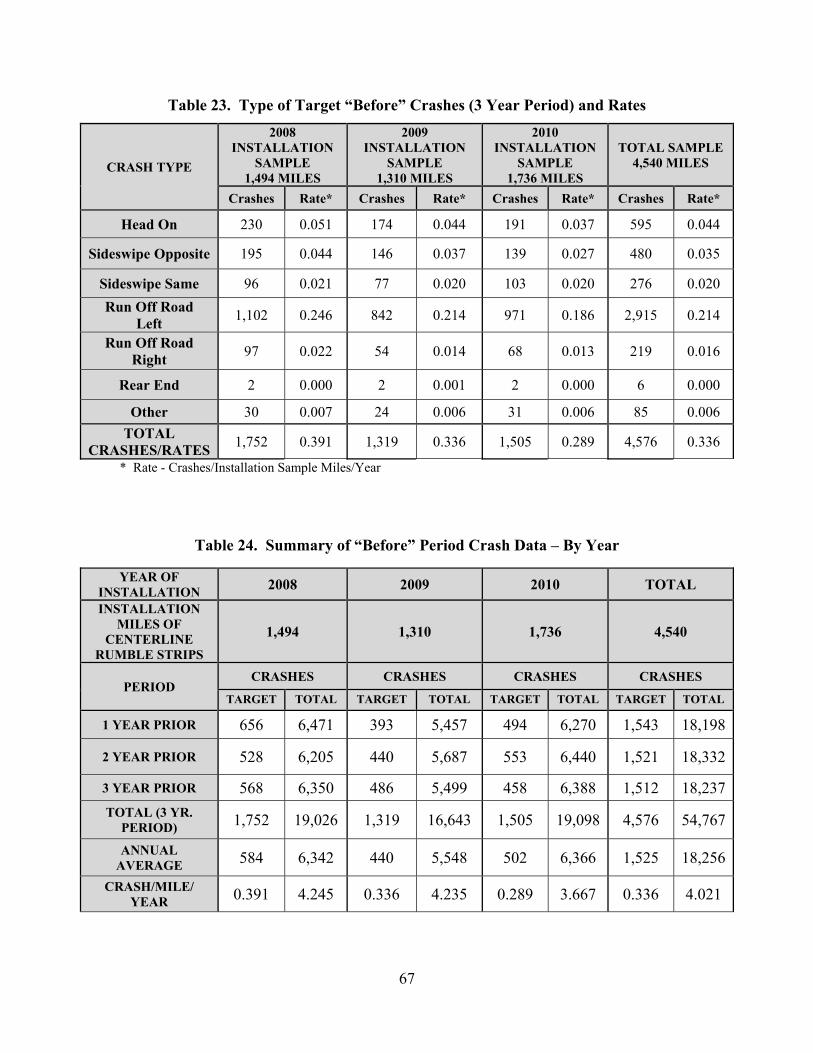
67
Table 23. Type of Target “Before” Crashes (3 Year Period) and Rates
CRASH TYPE
2008 INSTALLATION
SAMPLE 1,494 MILES
2009 INSTALLATION
SAMPLE 1,310 MILES
2010 INSTALLATION
SAMPLE 1,736 MILES
TOTAL SAMPLE4,540 MILES
Crashes Rate* Crashes Rate* Crashes Rate* Crashes Rate*
Head On 230 0.051 174 0.044 191 0.037 595 0.044
Sideswipe Opposite 195 0.044 146 0.037 139 0.027 480 0.035
Sideswipe Same 96 0.021 77 0.020 103 0.020 276 0.020
Run Off Road Left
1,102 0.246 842 0.214 971 0.186 2,915 0.214
Run Off Road Right
97 0.022 54 0.014 68 0.013 219 0.016
Rear End 2 0.000 2 0.001 2 0.000 6 0.000
Other 30 0.007 24 0.006 31 0.006 85 0.006
TOTAL CRASHES/RATES
1,752 0.391 1,319 0.336 1,505 0.289 4,576 0.336
* Rate - Crashes/Installation Sample Miles/Year
Table 24. Summary of “Before” Period Crash Data – By Year
YEAR OF INSTALLATION 2008 2009 2010 TOTAL
INSTALLATION MILES OF
CENTERLINE RUMBLE STRIPS
1,494 1,310 1,736 4,540
PERIOD CRASHES CRASHES CRASHES CRASHES
TARGET TOTAL TARGET TOTAL TARGET TOTAL TARGET TOTAL
1 YEAR PRIOR 656 6,471 393 5,457 494 6,270 1,543 18,198
2 YEAR PRIOR 528 6,205 440 5,687 553 6,440 1,521 18,332
3 YEAR PRIOR 568 6,350 486 5,499 458 6,388 1,512 18,237
TOTAL (3 YR. PERIOD) 1,752 19,026 1,319 16,643 1,505 19,098 4,576 54,767
ANNUAL AVERAGE 584 6,342 440 5,548 502 6,366 1,525 18,256
CRASH/MILE/ YEAR 0.391 4.245 0.336 4.235 0.289 3.667 0.336 4.021

68
The definition used in classifying the target crashes into various crash types, as included in
Table 23 (page 67), are:
Head On – Vehicles approaching from opposite directions and one vehicle crosses the
centerline and collides with another vehicle.
Sideswipe Opposite – Vehicles approaching from opposite directions when one vehicle
crosses the centerline and sideswipes the vehicle coming from the opposite direction.
Sideswipe Same – Both vehicles travelling in the same direction. One vehicle crosses the
centerline for passing or turning, and misestimates the other vehicle’s speed and/or path,
causing a sideswipe in the same direction. Such crash type was identified after reviewing
the crash descriptions and diagrams in the UD-10 reports.
Run Off Road Left – Vehicle crosses the centerline and leaves the roadway on the left.
Run Off Road Right – Vehicles encroach the centerline before travelling to the right.
Vehicles drifting off to the right without touching or crossing the centerline are not
included in this category since existence of CLRS will not impact such crashes.
Rear End – Both vehicles travel in the same direction. One vehicle crosses the centerline
and then collides into the back of the other vehicle.
Other – Crashes that involve a vehicle that crosses the centerline, but does not fall in the
crash categories described above.
Samples of UD-10s for each of these types of crashes are included in Appendix IV.

69
The details of the traffic crashes by each highway segment are included in Appendix V. This
data is separated by study segment for each of the three installation years (2008, 2009 and 2010).
It is important to note that the “Deer/Animal” involved crashes are the most predominant
type of crashes associated with high speed, non-freeway, highways in Michigan. This study is
the Phase 1 of a larger effectiveness evaluation study that involves identification and analysis of
the “Before” crash data at high speed, non-freeway roadways that received CLRS during the
years 2008, 2009 and 2010. A nominal comparison of one year of “After” crash data was
performed in order to establish a documented recommendation for the future Phase 2 study.
The highway segments where CLRS were installed in 2008 have experienced three years
of “After” crash data. Table 25 presents three-year average of “Before” crashes by severity for
the 1,494 miles of CRS installation locations. The “After” data is for the same highway
segments, but for one year of crash data only.
Table 25. 2008 Installations - "Before" and "After" Crash Comparison - By Severity
CRASHES “BEFORE” (ANNUAL AVERAGE*) “AFTER” (ONE YEAR)
FATAL INJURY PDO TOTAL FATAL INJURY PDO TOTAL
Target 13 214 357 584 8 127 257 392
Non-Target Coded as Non-Deer
22 647 1,587 2,256 23 589 1,491 2,103
Non-Target Coded as Deer
0 74 3,428 3,502 0 76 3,754 3,830
TOTAL 35 935 5,372 6,342 31 792 5,502 6,325
*Average of three year “Before” period
This comparison of “Before” and “After” crash data is included for providing a
supportable recommendation only. It is not intended for any conclusive statistical inference of
crash effectiveness.
A visual comparison shows the following:
Total frequency of “After” crashes (all) for the 2008 CLRS installation group is
virtually same as the annual average “Before” crashes (all).
Total target crash and injury frequency decreased considerably during the “After”
period.

70
Injury crashes are substantively lower in the “After” period as compared to annual
average “Before” crashes indicating potential positive impact.
Deer crashes increased during the “After” period.
Table 26 presents the “Before” crashes by each of the three CLRS installation years. The
“After” data presents one year of data. The data in the table also includes surrogate exposure
based rate factors in addition to the crash frequency data. Crash frequencies were converted to
“frequency per installation road miles.” It is not possible to obtain vehicle miles of travel data
for each highway segment. Therefore, comparing various crash categories per unit installation
miles, normalizes the data. The data clearly demonstrates a downward trend for the target
crashes.
Table 26. "Before" and "After" Crash Data - Annual Averages - By CLRS Installation Year
INSTALLA-TION YEAR
MILES OF CLRS
INSTALLED HIGHWAYS
“BEFORE” (ANNUAL AVERAGE*) “AFTER” (ONE YEAR)
DEER CRASHES
DEER CRASHES PER MILE
TARGET CRASHES
TARGET CRASHES PER MILE
TOTAL CRASHES
TOTAL CRASHES PER MILE
DEER CRASHES
DEER CRASHES PER MILE
TARGET CRASHES
TARGET CRASHES PER MILE
TOTAL CRASHES
TOTAL CRASHES PER MILE
2008 1,494 3,516 2.354 584 0.391 6,342 4.245 3,841 2.571 392 0.262 6,325 4.234
2009 1,310 3,167 2.418 440 0.336 5,547 4.234 N/A N/A N/A N/A N/A N/A
2010 1,736 3,853 2.219 502 0.289 6,366 3.667 N/A N/A N/A N/A N/A N/A
*After values are based on one year (2009) of crash data for 2008 installation segments only.

71
X. CONCLUSIONS AND RECOMMENDATIONS
The goal of determining the impact associated with the installation of rumble strips on high-
speed non-freeway highways in Michigan requires a comparison of “Before” and “After” data of
various driver performance-related parameters, speed characteristics, roadside noise, pavement
performance, and traffic crashes. This Phase 1 study goals included identification and analysis
of three years’ of “Before” crash data on 2008, 2009 and 2010 rumble strip installation sites.
The driver performance and other characteristics that may reveal quantitative impacts of rumble
strip installations were compared.
The various studies performed as a part of this research have been described earlier in
this report. These individual studies include detailed conclusions. The following presents the
summary of all such conclusions related to driver behavior which are important in making an
overall assessment of effectiveness of the CLRS installation program in Michigan.
A. Performance observations:
Drivers tend to move away from centerline and place themselves more centrally
in the lanes in the presence of rumble strips. This requires increased attention
towards driving and results in improved operation, and may alleviate traffic crash
and severity consequences.
Lane positioning improved significantly for all types of vehicles in the presence
of rumble strips.
Improvement in lane positioning occurred both at horizontal (curve section) and
tangent sections.
Vehicle encroachment frequency or rate on centerline and/or edgelines is often
considered as a surrogate measure of safety performances. Reduction of
encroachment was observed in the study and they were statistically significant.
High definition video camera-based technique provided a reliable and verifiable
method of driver performance data collection.
Data extraction from videos provided quality and reliable observational data ideal
for application of modern quality assurance/quality control (QA/QC) methods.

72
B. Bicyclist observations
Sharing the road between all users is critical to efficient use of highway facilities and
satisfying individual trip desires. While freeways are restricted to motorized
transportation modes, non-freeway state trunklines are often used by road users of
other modes, such as bicycles and pedestrians. The following represents conclusions
related to the above:
Use of post-mounted cameras provides a reliable method of tracking dynamic
events that may demonstrate driver behavior in the presence of bicyclists.
Study included a total of 1,197 events consisting of a motor vehicle passing a
moving bicyclist in the study area.
47.7% (571 out of 1,197) of these events occurred on segments with rumble
strips and 52.3% occurred on segments without rumble strips.
Study indicated decrease in likelihood of motor vehicles riding onto or across
the centerline in the presence of CLRS.
Lateral position of bicyclists impacted position/placement of the motor
vehicles in the travel lane.
Presence of oncoming traffic reduced the likelihood of centerline
contact/encroachment for the vehicular traffic.
C. Bicyclist opinion survey results
An online survey of the Michigan bicyclist community was performed. Two hundred
thirteen (213) completed surveys were received and analyzed. Observations from this
survey, related to the rumble strip program, include:
Majority of bicyclists drive differently on highways where rumble strips are
present.
Half of the respondents believe roads should have a minimum paved shoulder
width of 6 ft that can have rumble strips.

73
About one-quarter consider that 12 ft gap length adequate for their
maneuverability.
Approximately one-quarter believe they are less safe on roadways with CLRS.
Almost half felt less safe on roadways with both CLRS and SRS.
Two-thirds believe that special signs or markings in advance of the rumble
strip sections will be helpful.
D. Short-term pavement performance observations
A study of short-term pavement performance was conducted using MDOT’s
pavement imagery data for a random sample of 275 miles of highway with CLRS and
182 miles of highways where no CLRS was installed. Two sets of imagery data were
available for the test and control group. The following represents the conclusions:
The average number of transverse cracks per one-tenth of a mile segment
before and after installation of CLRS in a two-year period produced an
average increase of 3.45 cracks per tenth of a mile.
The increase in the average frequency of cracks for the control group (no
CLRS installed) in two years was observed to be 3.79 cracks per tenth of a
mile.
The historical crack propagation data demonstrated virtually the same rate of
increase in the frequency of cracks per tenth of a mile. The increase can be
attributal to pavement age rather than the influence of the installation.
The installation of CLRS did not create any adverse impact on the short-term
pavement performance.
A comparison of pavement performance between upper, northern lower and
southern lower peninsula did not demonstrate any discernable difference that
can be attributable to the installation.
74
E. Roadside noise observations
A test vehicle study with a stationary roadside noise meter was performed at a
number of rumble strip installation sites. This study was conducted on twelve
Michigan routes where CLRS were installed. Only four of these highways included
both CLRS and SRS. The following are the conclusions:
The mean increase in noise level at these sites when test vehicles were on the
CLRS was 8.1 dBA (72.6 dBA to 80.7 dBA), as compared to when the test
vehicle was not on the CLRS or SRS.
Depths of CLRS below 0.5 inches produced a mean peak noise of 77.82 dBA
and rumble strips with depths of 0.5 inches or greater produced a mean peak
noise of 84.62 dBA.
The test sites with 0.375 CLRS depth produced a mean peak noise of
77.5 dBA.
Rumble depth is the biggest factor that affects the amount of noise produced
by a rumble crossing. Therefore, adherence to MDOT recommended
standard depth of 0.5 inch at the center and 0.375 inch at the outer edges is
desirable and should be continued in the future for all CLRS installations.
The mean increase in noise with test vehicles on SRS, as compared to off all
rumble strips, was recorded as 9.9 dBA.
The noise levels of trucks not riding over the CLRS or SRS (83 dBA) was
greater than the noise level generated by the test vehicles driving over either
the CLRS or SRS.
F. Speed study
Sample speed studies were performed before and after installation of rumble strips.
Off-peak hour speed studies were performed on six Michigan routes in the eastern
part of the Lower Peninsula. MDOT also performed 24-hour speed studies using

75
automatic counters at seven additional locations. In both studies, there were no
discernable differences in the mean and 85th percentile speeds between before and
after the installation of rumble strips. Therefore, it can be concluded that installation
of CLRS did not impact the overall travel speed.
G. Analysis of “Before” crash data
A comprehensive study of the “Before” crash data for a three-year period was
performed as a part of this Phase 1 study. The conclusions of this study are:
4,540 miles of high-speed non-freeway roads were identified as the candidates
for this analysis. According to MDOT, there were approximately 5,400 miles
of CLRS installed on high-speed non-freeway locations. However, the start
date, starting point and ending point of several contracts were not received.
Elimination of these segments, as well as intersection areas, resulted in the
analysis of data for a total of 4,540 miles of highways where CLRS were
installed.
The three years of “Before” data analysis produced a total of 4,576 crashes
that can be considered as target crashes. It is expected that such target crashes
may be alleviated by installation of CLRS and are candidates for the “Before”
and “After” study that will be performed in the Phase 2 effectiveness
evaluation study.
The annual average “Before” crash frequency for 4,540 miles of candidate
highways are:
Fatal - 13
Injury - 214
PDO - 357
Total - 584
The “Before” crash data has been organized to allow a direct comparison of
“Before” and “After” crash and injury data in Phase 2 of the impact analysis.
A cursory review of one year of “After” crash data was analyzed for the highway
segments (1,494 miles) that received CLRS treatment in the year 2008. This function

76
was not part of the scope of the Phase 1 study. A comparison of annual average “Before”
crash data and only one year of “After” crash data for the 2008 CLRS installation sample
revealed the following:
Total frequency of “After” crashes (all) for the 2008 CLRS installation group
is virtually same as the annual average “Before” crashes (all).
Total target crash and injury frequency decreased considerably during the
“After” period.
Injury crashes are substantively lower in the “After” period as compared to
annual average “Before” crashes indicating potential positive impact.
Deer crashes increased during the “After” period.
This result indicates that a properly performed Phase 2 study may reveal many objective
safety-related findings that can be used to evaluate MDOT’s statewide CLRS program.
These findings would also provide a valuable resource for other states that are
considering design and implementation of such areawide safety and operational
improvement programs.
Recommendations
The following are the recommendations for future work related to CLRS impact analysis:
Conduct further driver behavior-related video-based studies to allow for a temporal
comparison of driver performances in the presence of CLRS. This study should be
performed at the same locations of the Phase 1 study.
The driver behavior in the presence of moving bicyclists should also be assessed in
the Phase 2 study. Conducting a study at the same locations will provide valuable
insight into the driver-bicyclist interaction characteristics over time.
The “After” crash data should be collected for the same highway segments as was
included in the Phase 1 study for a three-year “After” period.
77
The “Before” and “After” effectiveness evaluation study of the entire 4,540 miles of
highways should be included in the Phase 2 study.
A well designed effectiveness evaluation study may also be included that utilizes the
“Empirical Bayes (EB)” method.
The Phase 2 study performance period should be two-years, allowing for the
inclusion of three years of “After” crash data for the 2010 CLRS installation group.
The following “After” periods should be included for in “After” crash database in the
Phase 2 study:
- 2008 CLRS installation group: 2009, 2010, and 2011
- 2009 CLRS installation group: 2010, 2011, and 2012
- 2010 CLRS installation group: 2011, 2012, and 2013
Phase 2 study performance period should be from June 2013 to July 2015.
MDOT may also consider having an interim report that includes the analysis of two
out of three years of CLRS installations’ crash data analysis.
MDOT may develop technical note document that demonstrates the rumble strip
installation standards, expected consequences of CLRS and SRS, potential cost-
benefit data that can assist further implementation of CLRS and SRS on high-speed
county roadways.
Acknowledgements
The authors wish to thank the Michigan Department of Transportation (MDOT) for their
assistance and continued support during the conduct of this study. The authors would specifically
like to acknowledge the efforts of the Project Manager, Research Manager, and Research
Advisory Panel (RAP) for their assistance and provision of technical support. These efforts
resulted in important contributions with respect to the design, implementation, and evaluation of
the work presented herein.

78
XI. REFERENCES
1. Michigan Traffic Crash Facts. Michigan Office of Highway Safety Planning, Michigan
State Police. Data obtained from www.michigantrafficcrashfacts.org. Accessed September 2011.
2. Michigan Department of Transportation. Standard Specifications for Centerline and Shoulder Corrugations. September 2010.
3. ITE Manual of Transportation Engineering Studies. ITE, Washington, D.C., 2000.
4. Perkins, D. and B. Bowman. “Effectiveness Evaluation by Using Nonaccident Measures of Effectiveness.” In Transportation Research Record 905. TRB, Washington, D.C., 1983, pp. 138-142.
5. Miles, J., P. Carlson, M. Pratt, and T. Thompson. Traffic Operational Impacts of Transverse, Centerline, and Edgeline Rumble Strips. Texas Transportation Institute, TxDOT, College Station, TX, 2005.
6. Mahoney, K., R. Porter, E. Donnell, D. Lee, and M. Pietrucha. Evaluation of Centerline Rumble Strips on Lateral Vehicle Placement and Speed on Two-Lane Highways. FHWA, Washington, D.C., 2003.
7. Carlson, P.J., and J.D. Miles. Effectiveness of Rumble Strips on Texas Highways: First Year Report. Report 0-4472-1. Texas Transportation Institute, College Station, Texas, September 2003.
8. Finley, M.D. D.S. Funkhouser, and M.A. Brewer. Studies to Determine the Operational Effects of Shoulder and Centerline Rumble Strips on Two Lane Undivided Roadways. 0-5571-1. Texas Transportation Institute, Texas Department of Transportation, College Station, TX, August 2009.
9. Jennings, B., and M. Demetsky. “Evaluation of Curve Delineation Signs.” In Transportation Research Record 1010. TRB, Washington, D.C., 1985.
10. Zador, P., H. Stein, P. Wright, and J. Hall. “Effects of Chevrons, Post-Mounted Delineators, and Raised Pavement Markers on Driver Behavior at Roadway Curves.” In Transportation Research Record 1114. TRB, Washington, D.C., 1987.
11. Krammes, R., K. Tyer, D. Middleton, and S. Feldman. An Alternative to Post-Mounted Delineators at Horizontal Curves on Two-Lane Highways. Texas Transportation Institute, College Station, TX, 1990.
12. Gates, T., H. Hawkins, S. Chrysler, P. Carlson, A. Holick, and C. Spiegelman, Traffic Operational Impacts of Higher Conspicuity Sign Materials. 4271-1. Texas Transportation Institute, TxDOT, College Station, TX, 2004.
13. Moeur, R. “Analysis of Gap Patterns in Longitudinal Rumble Strips to Accommodate Bicycle Travel.” In Transportation Research Record 1705, TRB, Washington, D.C., 2000, pp.93-98.
14. Outcalt, W. Bicycle-Friendly Rumble Strips. Colorado Department of Transportation, Federal Highway Administration, Denver, CO, 2001.

79
15. Torbic, D., Elefteriadou, L., El-Gindy, M. “Development of Rumble Strip Configurations That Are More Bicycle Friendly.” In Transportation Research Record 1773. TRB, Washington, D.C., 2001, pp. 23-31.
16. Kirk, A.J. Evaluation of the Effectiveness of Pavement Rumble Strips. University of Kentucky, Kentucky Transportation Cabinet, Lexington, KY, 2008.
17. Finley, M. D., and Miles, J. D. “Exterior Noise Created by Vehicles Traveling Over Rumble Strips.” Transportation Research Board 86th Annual Meeting, TRB, National Research Council, Washington, DC, 2007.
18. Karkle, D.E., Rys, M.J., Russell, E.R. “Centerline Rumble Strips: Study of External Noise.” Journal of Transportation Engineering, Vol. 137(5), 2011, pp. 311-318.
19. Nambisan , S., V. Vanapalli, M. Dangeti, and S. Pulugurtha. Evaluating the Effectiveness of Continuous Shoulder Rumble Strips in Reducing “Ran-off-Roadway” Single-Vehicle Crashes. Nevada Department of Transportation, Carson City, NV, 2007.
20. Annino, J. Rumble Strips in Connecticut: A Before/After Analysis of Safety Benefits. Connecticut Department of Transportation, Federal Highway Administration, Hartford, CT, 2003.
21. Marvin, R. and D. Clark. An Evaluation of Shoulder Rumble Strips in Montana. Montana Department of Transportation, Federal Highway Administration, Helena, MT, 2003.
22. Griffith, M. “Safety Evaluation of Rolled-in Continuous Shoulder Rumble Strips Installed on Freeways”. In Transportation Research Record 1665. TRB, Washington, D.C., 1999, pp. 28-34.
23. Patel, R. B., Council, F. M., and Griffith, M. S. "Estimating Safety Benefits of Shoulder Rumble Strips on Two-Lane Rural Highways in Minnesota: Empirical Bayes Observational Before-and-After Study." Transportation Research Record 2019, TRB, 2007, pp. 205-211.
24. Torbic, D, et.al. Guidance for the Design and Application of Shoulder and Centerline
Rumble Strips. NCHRP Report 641. NCHRP, TRB, Washington, D.C., 2009.
25. Russell, E. and M. Rys. Centerline Rumble Strips. NCHRP Synthesis 339. National Cooperative Highway Research Program, Transportation Research Board of the National Academies, 2005.
26. Outcalt, W. Centerline Rumble Strips. Interim Report No. CDOT-DTD-R-2001-8. Research Branch, Colorado Department of Transportation, Denver, CO, August 2001.
27. Wilder, R. D. "Centerline Rumble Strips on Secondary Highways: A Systematic Crash Analysis." New York State Department of Transportation & the Office of Modal Safety and Security, July 2010.
28. "Centerline Rumble Strips: The Delaware Experience." Delaware Department of Transportation, Dover, Delaware, 2003.
29. Noyce, D. A., and Elango, V. V. "Safety Evaluation of Centerline Rumble Strips: Crash and Driver Behavior Analysis." Transportation Research Record 1982, TRB, 2004, 44-53.

80
30. Monsere, C. M. "Preliminary Evaluation of the Safety Effectiveness of Centerline (Median) Rumble Strips in Oregon." Institute of Transportation Engineers Quad Conference, Seattle, Washington., April 9, 2002.
31. McCully S and M. Briese. Safety Effects of Centerline Rumble Strips in Minnesota. Minnesota Department of Transportation, 2008.
32. Persaud, B., R. Retting, and C. Lyon. Crash Reduction Following Installation of Centerline Rumble Strips on Rural Two-Lane Roads. Insurance Institute for Highway Safety, 2003.
33. Harkey, D., Stewart, J. “Evaluation of Shared-Use Facilities for Bicycles and Motor Vehicles.” In Transportation Research Record 1578, TRB, Washington, D.C., 1997, pp.111-118.
34. Federal Highway Administration. Measurement of Highway-Related Noise. FHWA-PD-96-046. U.S. Department of Transportation, May 1996.
35. Gates, T.J., P.J. Carlson, and H.G. Hawkins. Field Evaluation of Warning and Regulatory Signs with Enhanced Conspicuity Properties. In Transportation Research Record 1862. TRB, Washington, D.C., 2004.
36. Gates, T.J., P.T. Savolainen, T.K. Datta, and P. Nannapaneni, “Impact of Driver Behavior of Steady Burn Warning Lights on Channelizing Drums in Work Zones,” Transportation Research Record 2258, TRB, 2011.
37. Montgomery, D.C. and G.C. Runger. Applied Statistics and Probability for Engineers, Second Edition. John Wiley and Sons, Inc., New York, 1999.
38. Harkey, D, et.al. Accident Modification Factors for Traffic Engineering and ITS Improvements. NCHRP Report 617. NCHRP, TRB, Washington, D.C., 2008.
39. Gates, T.J., P.T. Savolainen, T.K. Datta, R. Todd, and J.G. Morena, “Impacts of Centerline and Shoulder Rumble Strips on Vehicular Lateral Lane Position and Passing Maneuvers on High-Speed Two-Lane Rural Roadways,” Transportation Research Record, TRB, Washington, D.C., in press, 2012.
40. Federal Highway Administration, Shoulder and Edge Line Rumble Strips, Technical Advisory, T 5040.39, April 22, 2011.
41. Federal Highway Administration, Center Line Rumble Strips, Technical Advisory, T 5040.40, April 22, 2011.
42. Garder, Per and Alexander, John. Continued Research on Continuous Rumble Strips. Technical Report 94-4, December 1995.
43. Kroll, B., and M. R. Ramey. Effects of Bike Lanes on Driver and Bicyclist Behavior. Journal of Transportation Engineering, ASCE, Vol. 103, No. 2, March 1977.
44. Savolainen, P.T., T.J. Gates, and T.K. Datta, Implementation of Targeted Pedestrian Traffic Enforcement Programs in an Urban Environment, In Transportation Research Record 2258, TRB, Washington, D.C., 2011.
45. Techniques for Pavement Rehabilitation, Participants Notebook, Third Revision. National Highway Institute, U.S. Department of Transportation, October 1987.
81
46. Lou Z., J.J. Lu, M. Gunaratne, and B. Dietrich. “Forecasting of Pavement Crack Performance with Adaptive Filter Model.” In Transportation Research Record 1699, TRB, Washington, D.C., 2000.
47. Watson, M., R. Olson, J. Pantelis, E. Johnson, and T. Wood. Long Term Maintenance Effects on HMA Pavements Caused by Rumble Strips and Available Preventive Treatment Methods. MnDOT, St Paul, MN, 2008.
48. Smirnov, N.V. "Tables for estimating the goodness of fit of empirical distributions," Annals of Mathematical Statistic, Vol. 19, p. 279, 1948.
49. Gupta, J. “Development of Criteria for Design, Placement and Spacing of Rumble Strips.” Publication FHWA/OH-93/022, Ohio Dept. of Transportation, Columbus, OH, 1993.
50. Markala, R. “Evaluation of External Noise Produced by Vehicles crossing over Centerline Rumble Strips on Undivided Highways in Kansas.” M.S. Thesis, Kansas State University, Manhattan, KS, 2009.
51. Meyer, E., and Walton, S. “Preformed Rumble Strips.” Rep. for Midwest Smart Zone Deployment Initiative, http:www.intrans.iastate.edu/smartwz/details.cfm?projectID=32 , August 24, 2010.
52. Higgins, J. S., and Barbel, W. “Rumble strip noise.” Transportation Research Record 983, TRB, Washington, DC, 1984, pp. 27-36.
53. Federal Highway Administration. “Highway Traffic Noise Analysis and Abatement Policy and Guidance.” http://www.fhwa.dot.gov/environment/polguid.pdf> , 1995.
54. Chen, C. “A Study of the Effectiveness of Various Rumble Strips on Highway Safety.” Virginia Department of Transportation, Richmond, Virginia, November 1994.
55. Sutton, C. and W. Wray. “Guidelines for Use of Rumble Strips.” Publication 0-1466. Department of Civil Engineering, Texas Tech University, Lubbock, Texas, July 1996.