
Impact of New Supply and Industrial Projects on Infrastructure · McKinsey & Company 0| Impact of...
14
McKinsey & Company 0 | Impact of New Supply and Industrial Projects on Infrastructure CONFIDENTIAL AND PROPRIETARY Any use of this material without specific permission of McKinsey & Company is strictly prohibited Houston Texas – February 7, 2013 © McKinsey & Company Mike Juden, McKinsey & Company, Inc., Houston
Transcript of Impact of New Supply and Industrial Projects on Infrastructure · McKinsey & Company 0| Impact of...

McKinsey & Company 0|
Impact of New Supply and Industrial Projects on Infrastructure
CONFIDENTIAL AND PROPRIETARYAny use of this material without specific permission of McKinsey & Company is strictly prohibited
Houston Texas – February 7, 2013
© McKinsey & Company
Mike Juden, McKinsey & Company, Inc., Houston
McKinsey & Company 1|
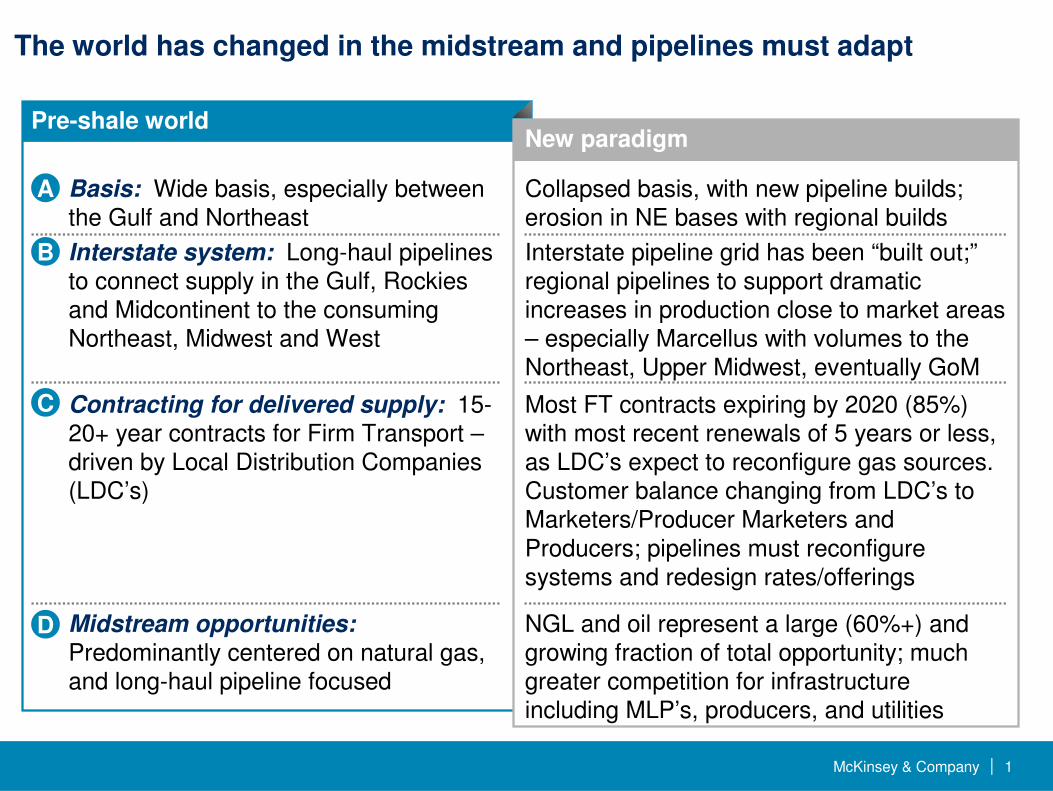
The world has changed in the midstream and pipelines must adapt
Pre-shale world
B Interstate system: Long-haul pipelines to connect supply in the Gulf, Rockies and Midcontinent to the consuming Northeast, Midwest and West
Interstate pipeline grid has been “built out;”regional pipelines to support dramatic increases in production close to market areas – especially Marcellus with volumes to the Northeast, Upper Midwest, eventually GoM
C Contracting for delivered supply: 15-20+ year contracts for Firm Transport –driven by Local Distribution Companies (LDC’s)
Most FT contracts expiring by 2020 (85%) with most recent renewals of 5 years or less, as LDC’s expect to reconfigure gas sources.Customer balance changing from LDC’s to Marketers/Producer Marketers and Producers; pipelines must reconfigure systems and redesign rates/offerings
A Basis: Wide basis, especially between the Gulf and Northeast
Collapsed basis, with new pipeline builds; erosion in NE bases with regional builds
New paradigm
D Midstream opportunities:Predominantly centered on natural gas, and long-haul pipeline focused
NGL and oil represent a large (60%+) and growing fraction of total opportunity; much greater competition for infrastructure including MLP’s, producers, and utilities
McKinsey & Company 2|
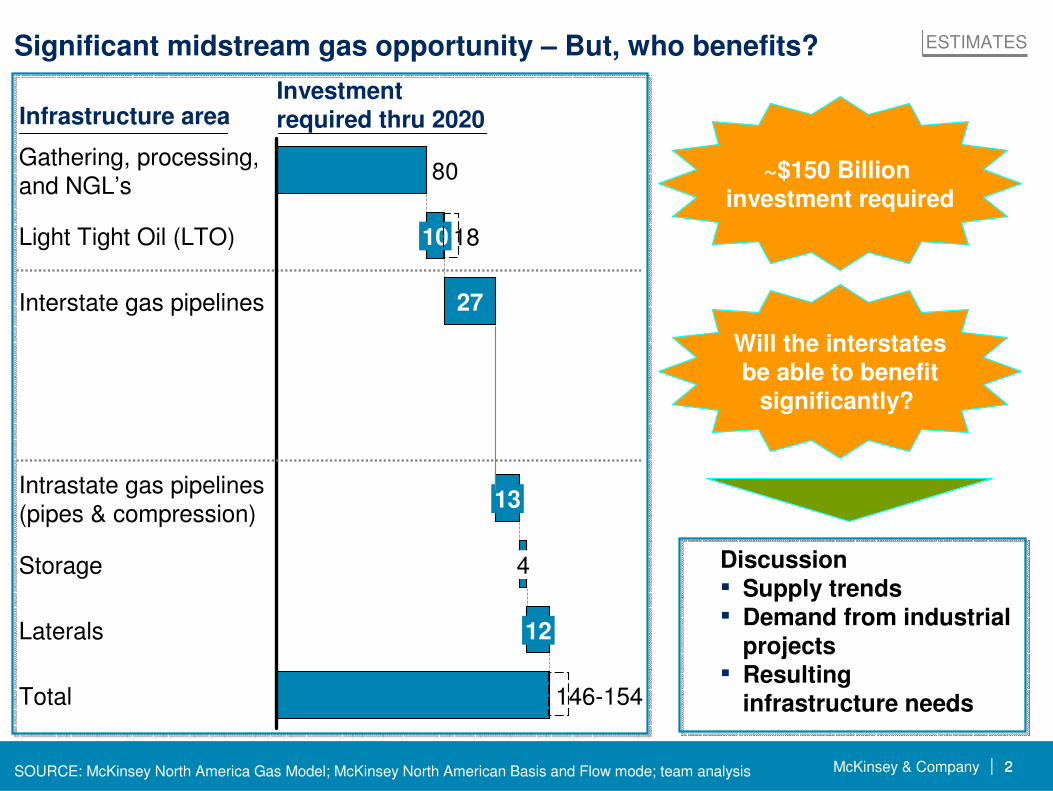
Significant midstream gas opportunity – But, who benefits?
2SOURCE: McKinsey North America Gas Model; McKinsey North American Basis and Flow mode; team analysis
ESTIMATES
~$150 Billion investment required
Will the interstatesbe able to benefit
significantly?
Discussion▪ Supply trends▪ Demand from industrial
projects▪ Resulting
infrastructure needs
Infrastructure area
80
10
Gathering, processing,and NGL’s
Laterals
27
Total
13
Interstate gas pipelines
146-154
Storage
Light Tight Oil (LTO)
4
Intrastate gas pipelines(pipes & compression)
12
Investment required thru 2020
18
McKinsey & Company 3|1 Excludes finding and land costs2 Associated gas plays and predominantly oil basins excluded from this chart
2000 1,800400 1,000
0
1,400
2
1,200 1,600
16
14
12
10
8
6
800600
4
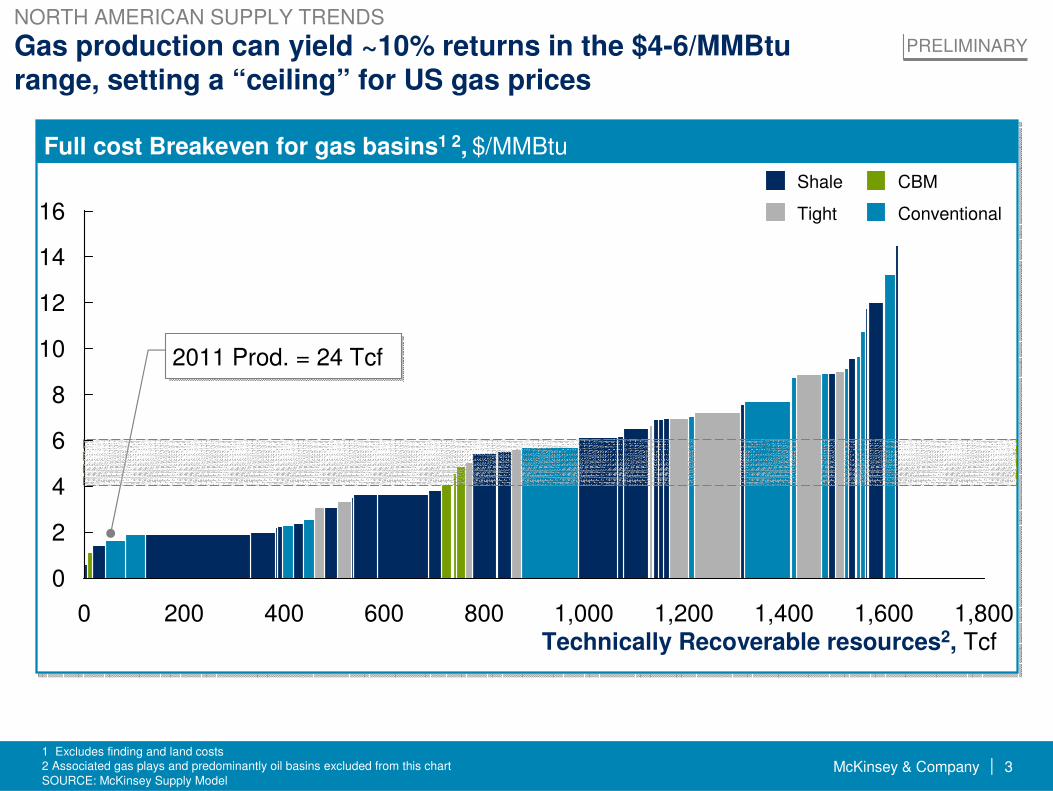
NORTH AMERICAN SUPPLY TRENDS
Tight
Shale
Conventional
CBM
Gas production can yield ~10% returns in the $4-6/MMBturange, setting a “ceiling” for US gas prices
Technically Recoverable resources2, Tcf
Full cost Breakeven for gas basins1 2, $/MMBtu
2011 Prod. = 24 Tcf
SOURCE: McKinsey Supply Model
PRELIMINARY
McKinsey & Company 4|
Niobrara
Cody
Mowry
Gammon
Excello-Mulky
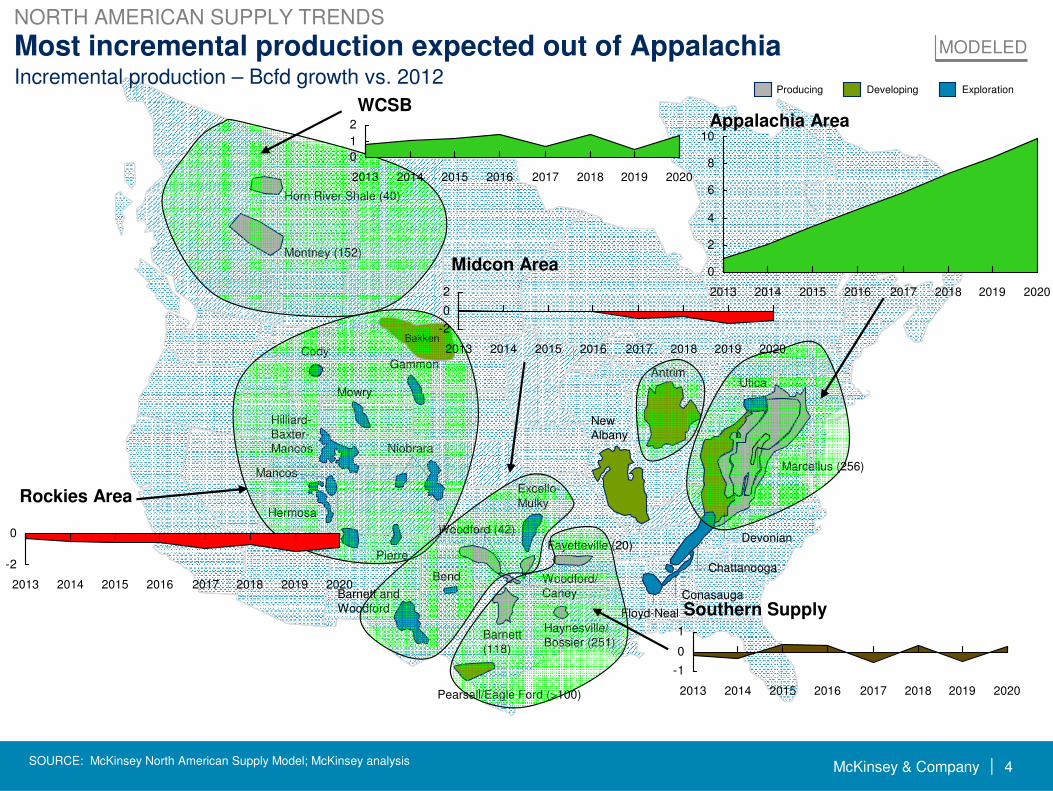
Marcellus (256)
Devonian
Chattanooga
Conasauga
Floyd-Neal
Fayetteville (20)
Haynesville/Bossier (251)
Woodford/Caney
Barnett (118)
Pearsall/Eagle Ford (>100)
Woodford (42)
Barnett and Woodford
Bend
PierreLewis
Hermosa
Mancos
Hilliard-Baxter-Mancos
Antrim
New Albany
Utica
Horn River Shale (40)
Montney (152)
ExplorationDevelopingProducing
Bakken
Incremental production – Bcfd growth vs. 2012
0
1
2
20172016201520142013 20202018 2019
Southern Supply
Appalachia Area
Rockies Area
Midcon Area
WCSB
MODELED
-2
0
20202017 2018 20192016201520142013
0
2
4
6
8
10
2018 2019 202020172016201520142013
-1
0
1
20192018 202020172016201520142013
-2
0
2
2018 2019 202020172016201520142013
SOURCE: McKinsey North American Supply Model; McKinsey analysis
NORTH AMERICAN SUPPLY TRENDS
Most incremental production expected out of Appalachia

McKinsey & Company 5|SOURCE: EIA AEO 2010 & 2008; EIA STEO; Baker Hughes; McKinsey analysis
Even the with high case demand response, growth is not likely to exceed 3-4 Bcfd per year (including LTO associated gas of ~1 Bcfd per year)
▪ Full suite of pending regulation passed1
▪ $4/MMBtu gas pricing
▪ $10/ton
▪ No renewable projects beyond FID
▪ Backfilled by gas
▪ 10-30% penetration for HD/MD trucks, buses, rail
▪ Sabine – all phasesKitimat, Douglas Channel
▪ 1 more (8 mtpa)
Annualized demand to 2020 Bcfd, Annualized Key assumptions
0.7
1.8
0.4
Postponed RPS
CO2 regulations 0.3
Coal retirements 0.70.3
0.20.1
0.1
Ammonia andmethanol
0.1
NG vehicles 0.30.1
0.2
Base High
Total 2.60.8
LNG export 0.40.3
Even optimistic demand scenarios cannot keep pace with supply growthDEMAND FROM INDUSTRIAL PROJECTS
Dry Onshore L48 gas production growth, Bcfd
US has demonstrated adding 2.3 - 3.1 Bcfd of incremental supply per year
2.3
1.0
2.7
3.1
0.2
08072006 201009
▪ 6-8 Ammonia plants, 1.4-2.3 mmtpa; 2-5 methanol plants, 2-5 mmtpa
Does not include ~1 Bcfd per year
from light tight oil (LTO)
Does not include ~1 Bcfd per year
from light tight oil (LTO)
1 Rig count updated until March 17, 2011; 2 Based on STEO (monthly); 3 Based on AEO (Annual)
With this much excess supply, prices will likely remain low
With this much excess supply, prices will likely remain low
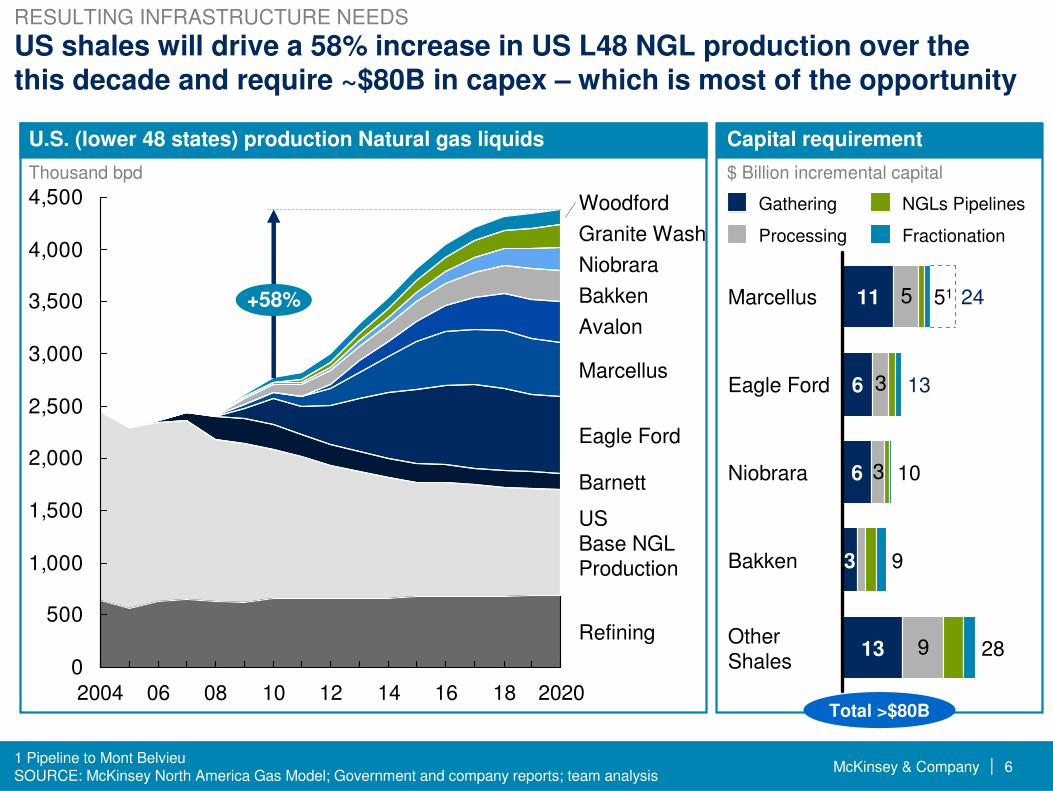
McKinsey & Company 6|1 Pipeline to Mont Belvieu
U.S. (lower 48 states) production Natural gas liquids
US shales will drive a 58% increase in US L48 NGL production over the this decade and require ~$80B in capex – which is most of the opportunity
0
500
1,000
1,500
2,000
2,500
3,000
3,500
4,000
4,500
+58%
Refining
US Base NGLProduction
Barnett
Eagle Ford
Marcellus
Avalon
Bakken
Niobrara
Granite Wash
Woodford
2020181614121008062004
SOURCE: McKinsey North America Gas Model; Government and company reports; team analysis
Thousand bpd
Capital requirement
$ Billion incremental capital
5
3
3
9OtherShales
2813
Bakken 93
Niobrara 106
Eagle Ford 136
Marcellus 2411 51
NGLs Pipelines
Fractionation
Gathering
Processing
Total >$80B
RESULTING INFRASTRUCTURE NEEDS
McKinsey & Company 7|
Southwest to Southeastern
Southwest toNortheastern
Southwest toMidwestern
Southwest Panhandleto Midwestern
Southwest to Western
Western Canada toMidwestern
Rocky MountainArea to Midwest Rocky Mountain
Area to West
Canada to West
Eastern CanadaNortheast
Western Canada to Northeast
1
3
2
9
8
7
10 11
4
6
5
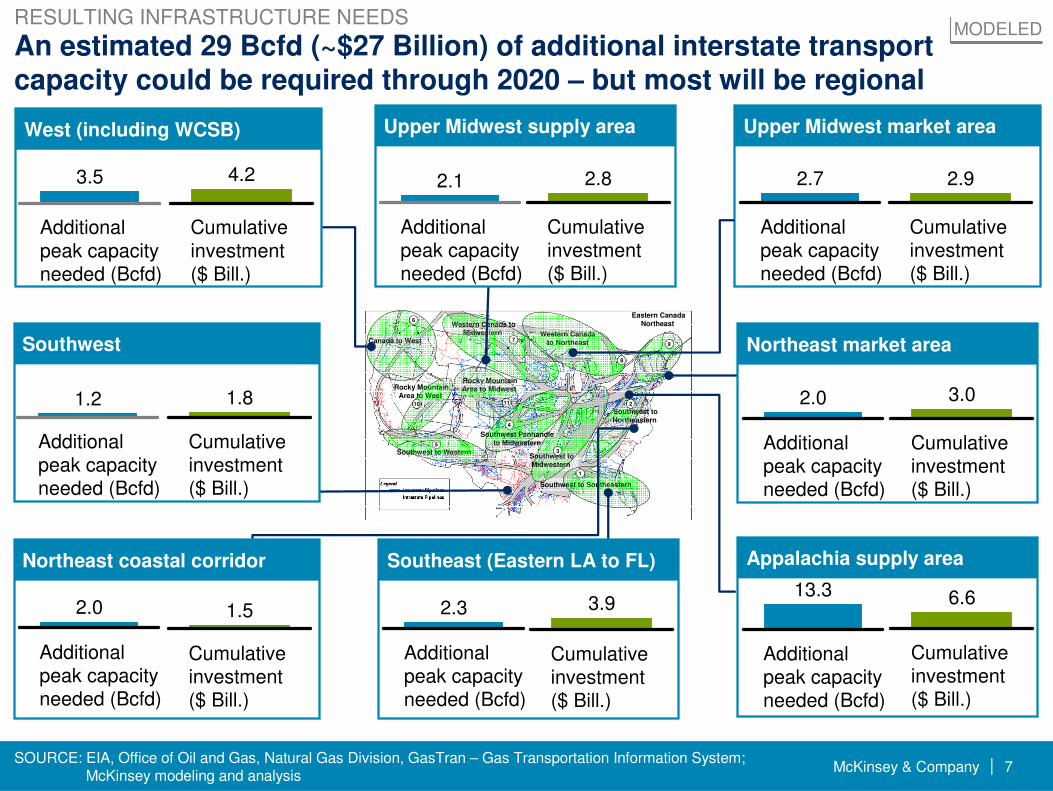
SOURCE: EIA, Office of Oil and Gas, Natural Gas Division, GasTran – Gas Transportation Information System; McKinsey modeling and analysis
Additional peak capacity needed (Bcfd)
2.7
Upper Midwest market areaUpper Midwest supply area
Southwest Northeast market area
Northeast coastal corridor Southeast (Eastern LA to FL) Appalachia supply area
Cumulative investment ($ Bill.)
2.9
Additional peak capacity needed (Bcfd)
1.2
Cumulative investment ($ Bill.)
1.8
Additional peak capacity needed (Bcfd)
2.1
Cumulative investment ($ Bill.)
2.8
Additional peak capacity needed (Bcfd)
2.0
Additional peak capacity needed (Bcfd)
2.3
Cumulative investment ($ Bill.)
3.9
Additional peak capacity needed (Bcfd)
13.3
Cumulative investment ($ Bill.)
6.6
Additional peak capacity needed (Bcfd)
2.0
Cumulative investment ($ Bill.)
3.0
Cumulative investment ($ Bill.)
1.5
MODELEDAn estimated 29 Bcfd (~$27 Billion) of additional interstate transport capacity could be required through 2020 – but most will be regional
RESULTING INFRASTRUCTURE NEEDS
West (including WCSB)
Additional peak capacity needed (Bcfd)
3.5
Cumulative investment ($ Bill.)
4.2
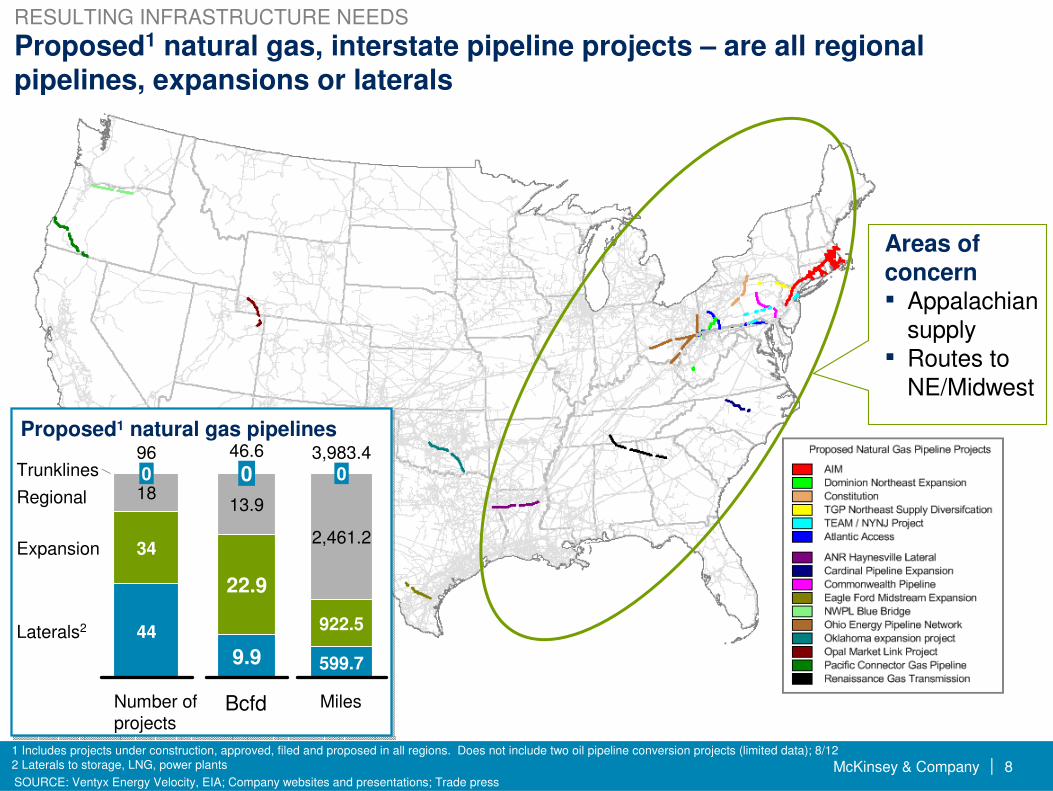
McKinsey & Company 8|
Proposed1 natural gas, interstate pipeline projects – are all regional pipelines, expansions or laterals
SOURCE: Ventyx Energy Velocity, EIA; Company websites and presentations; Trade press
1 Includes projects under construction, approved, filed and proposed in all regions. Does not include two oil pipeline conversion projects (limited data); 8/122 Laterals to storage, LNG, power plants
RESULTING INFRASTRUCTURE NEEDS
Areas of concern▪ Appalachian
supply▪ Routes to
NE/Midwest
44
34
180
Laterals2
Expansion
Regional
Trunklines
Number of projects
96
Proposed1 natural gas pipelines
Miles
3,983.4
599.7
922.5
2,461.2
0
Bcfd
46.6
9.9
22.9
13.9
0
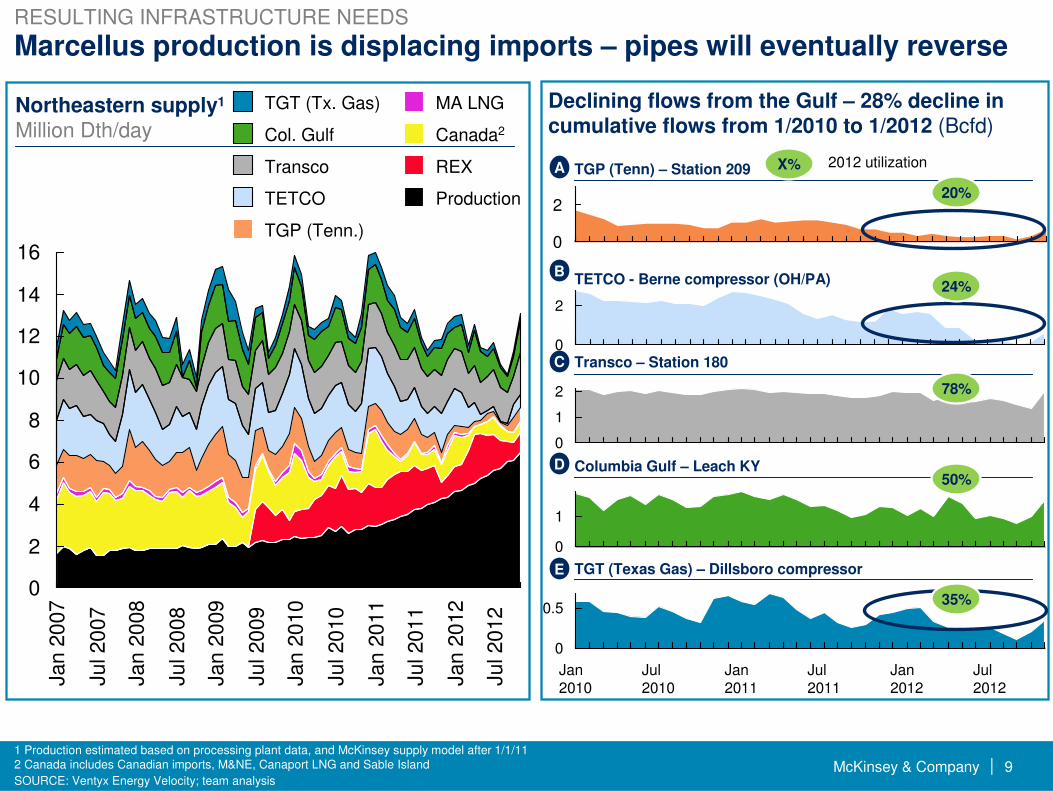
McKinsey & Company 9|
Marcellus production is displacing imports – pipes will eventually reverse
SOURCE: Ventyx Energy Velocity; team analysis
16
14
12
10
8
6
4
2
0
Ju
l 20
12
Jan
20
12
Ju
l 20
11
Jan
20
11
Ju
l 20
10
Jan
20
10
Ju
l 20
09
Jan
20
09
Ju
l 20
08
Jan
20
08
Ju
l 20
07
Jan
20
07
Production
REX
Canada2
MA LNG
TGP (Tenn.)
Transco
TETCO
Col. Gulf
TGT (Tx. Gas)
1 Production estimated based on processing plant data, and McKinsey supply model after 1/1/112 Canada includes Canadian imports, M&NE, Canaport LNG and Sable Island
Northeastern supply1
Million Dth/day
A
C
B
D
E
Declining flows from the Gulf – 28% decline in cumulative flows from 1/2010 to 1/2012 (Bcfd)
0
2
0.5
0
Jul 2012
Jan 2012
Jul 2011
Jan 2011
Jul 2010
Jan 2010
1
0
2
0
2
1
0
TGP (Tenn) – Station 209
TETCO - Berne compressor (OH/PA)
Transco – Station 180
Columbia Gulf – Leach KY
TGT (Texas Gas) – Dillsboro compressor
20%
24%
78%
50%
35%
X% 2012 utilization
RESULTING INFRASTRUCTURE NEEDS
McKinsey & Company 10|
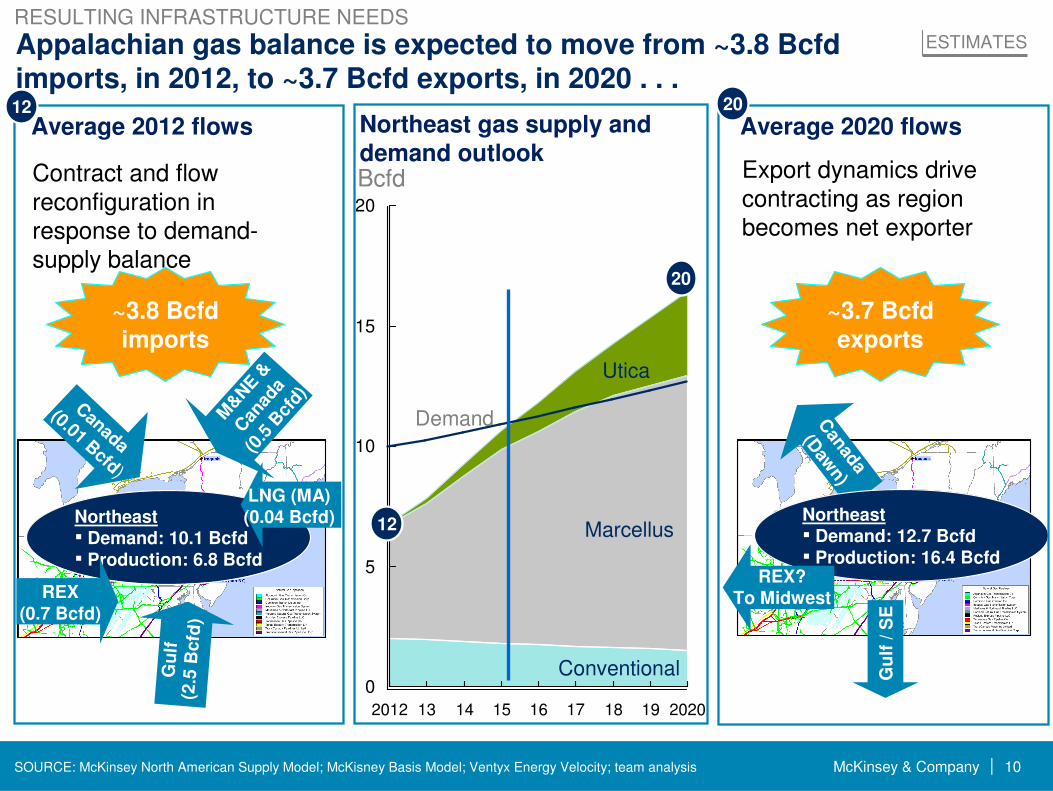
Northeast▪ Demand: 10.1 Bcfd▪ Production: 6.8 Bcfd
SOURCE: McKinsey North American Supply Model; McKisney Basis Model; Ventyx Energy Velocity; team analysis
Appalachian gas balance is expected to move from ~3.8 Bcfdimports, in 2012, to ~3.7 Bcfd exports, in 2020 . . .
Canada
(0.01 Bcfd)
REX (0.7 Bcfd)
Gu
lf
(2.5
Bcfd
)
M&NE
&
Can
ada
(0.5
Bcf
d)
LNG (MA)(0.04 Bcfd)
Gu
lf /
SE
Canada
(Daw
n)
Average 2012 flows Average 2020 flows
Northeast▪ Demand: 12.7 Bcfd▪ Production: 16.4 Bcfd
0
5
10
15
20
2020191817161514132012
BcfdContract and flow reconfiguration in response to demand-supply balance
Export dynamics drive contracting as region becomes net exporter
Northeast gas supply and demand outlook
Demand
Marcellus
Utica
Conventional
REX?To Midwest
~3.7 Bcfdexports
12 20
12
20
~3.8 Bcfdimports
ESTIMATES
RESULTING INFRASTRUCTURE NEEDS
McKinsey & Company 11| 111 Assumed rollover contracts expire at the next time they are due to expire, rather than rollover again;
cumulative expirations by end of year
SOURCE: Ventyx Energy Velocity; Pipeline bulletin boards; team analysis
0
10
20
30
40
50
60
70
80
Post 2022
20222021202020192018201720162015201420132012
REX
Alliance
Vector
Northern Border
Great Lakes
CenterPoint MRT
Midwestern
Panhandle
Trunkline
ANR
NGPL
Northern Natural
Texas Gas
Transco
Columbia Gulf
Texas Eastern
Tennessee Gas
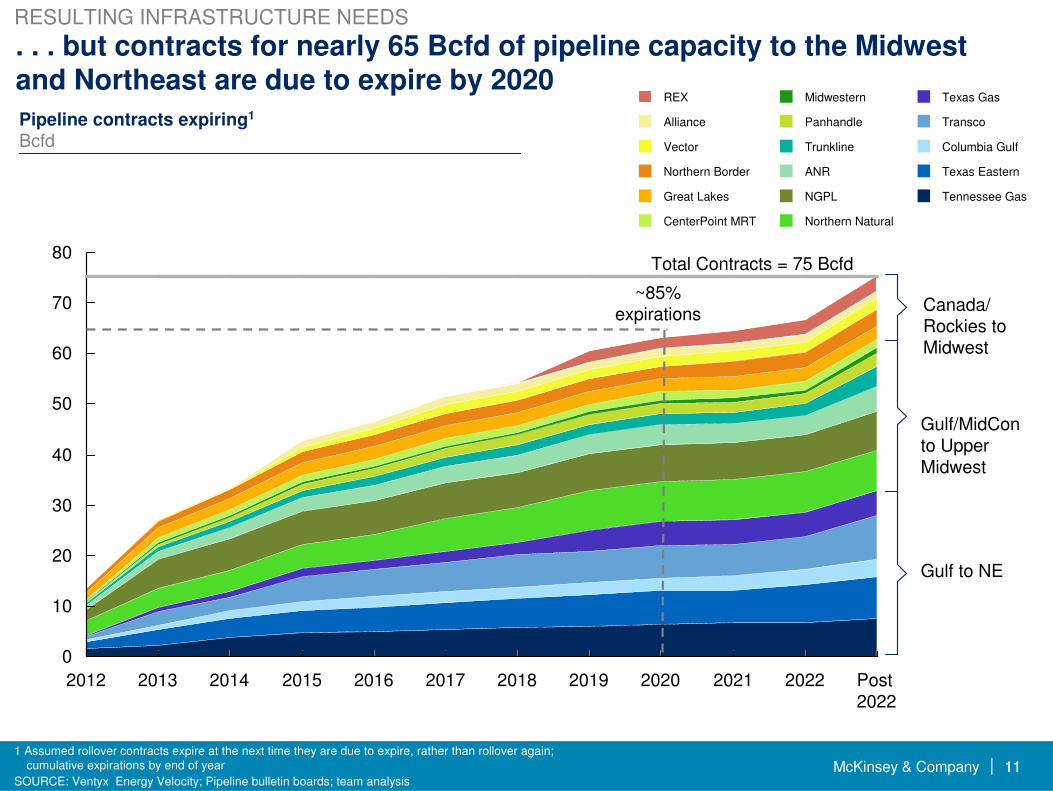
. . . but contracts for nearly 65 Bcfd of pipeline capacity to the Midwest and Northeast are due to expire by 2020
Pipeline contracts expiring1
Bcfd
Gulf to NE
Canada/ Rockies to Midwest
~85% expirations
Total Contracts = 75 Bcfd
Gulf/MidConto Upper Midwest
RESULTING INFRASTRUCTURE NEEDS

McKinsey & Company 12|
Opportunities and challenges for the interstates – How to respond?
12
Opportunities to 2020
ESTIMATES
Challenges to 2020
▪ Growth in infrastructure needs downstream of the plant– Interstate pipelines and storage -
$25-30 Billion– Intrastate compression and pipeline
expansions - $10-15 Billion– Laterals - $10-15 billion
▪ Growth in gas and NGL gathering needs of ~$80 Billion
▪ Dramatic change in flows to/from Northeast– Elimination of long-haul to Northeast– Dramatic change in how storage is used
▪ ~85% of interstate FT contracts expiring in Eastern and Midwestern corridors
▪ Most recent renewals have been for terms of 5 years or less– Customers positioning for turnbacks
or reductions to regional hauls?
▪ Increase in competition for regional pipeline growth
▪ New services – now – rather than later – why wait?▪ Begin to think about system reconfiguration/rate design
– Back hauls and reversals (some are implementing)– New uses/new customers for market area storage
▪ How to better compete for regional pipelines, laterals, and even gathering
Implications – How to respond?
RESULTING INFRASTRUCTURE NEEDS

McKinsey & Company 13|
Impact of New Supply and Industrial Projects on Infrastructure
CONFIDENTIAL AND PROPRIETARYAny use of this material without specific permission of McKinsey & Company is strictly prohibited
Houston Texas – February 7, 2013
© McKinsey & Company
Mike Juden, McKinsey & Company, Inc., Houston