Impact of MD Minimum Wage Final Final
30
The Impact of Raising the Minimum Wage on the Maryland Economy by Stephen S. Fuller, PhD Dwight Schar Faculty Chair and University Professor Director, Center for Regional Analysis George Mason University Arlington, Virginia with Parker Bedsole Associate Economist and Scott Nystrom Senior Economic Associate Regional Economic Models, Inc. Washington, DC Prepared for The Maryland Foundation for Research & Economic Education Annapolis, Maryland January 2014
Transcript of Impact of MD Minimum Wage Final Final

The Impact of Raising the Minimum Wage on the Maryland Economy
by
Stephen S. Fuller, PhD Dwight Schar Faculty Chair and University Professor
Director, Center for Regional Analysis George Mason University
Arlington, Virginia
with
Parker Bedsole Associate Economist
and
Scott Nystrom Senior Economic Associate
Regional Economic Models, Inc. Washington, DC
Prepared for
The Maryland Foundation for Research & Economic Education Annapolis, Maryland
January 2014

1
The Impact of Raising the Minimum Wage on the Maryland Economy
Executive Summary
Raising the minimum wage rate has gained popularity at the local and state level over the past year with the effective hourly wage rate rising in 13 states on January 1, 2014. The President called for a higher minimum wage rate in his State of the Union message last year and recently has been speaking in support of an increase in the minimum hourly wage to $10.10. The District of Columbia, and Prince George’s and Montgomery Counties in Maryland each raised its minimum wage rate to $11.50 (over several years) at the end of 2013. These increases in minimum wages have been largely predicated on issues relating to increasing poverty or a growing income gap between rich and poor, or just because it is the “right thing to do” or “we can afford it” without actually understanding what the economies of higher minimum wages are or who will actually benefit. This report presents the economic consequences of raising the minimum wage rate in the State of Maryland from $7.25, the current national rate, to $9.00, to $10.00 and to $12.00. Who are the State’s minimum wage workers? There were 1,329,486 hourly workers in the State of Maryland in 2012 accounting for 44.6 percent of the state’s employment base (excluding self-‐employed workers). In 2012, it is estimated that 66,118 or 5.0 percent of these hourly workers were paid $7.25 per hour or less. Of these workers, 35.4 percent were 16 to 19 year of age, suggesting that most of them were students and working part time. Twenty-‐four percent (24.4%) of these wage earners were in the 20-‐24 year old age cohort, an age group including large numbers of workers also likely to be still in school and part-‐time workers. Combined, these two age cohorts represented 60 percent of the workers currently paid the minimum age in Maryland or less. At higher wage rates, this concentration of younger workers at the minimum wage thresholds continues. Workers under the age of 25 years old would account for 58.3 percent of the hourly workers benefiting from an increase in the minimum wage base from $7.25 to $9.00 and workers under the age of 25 years old would account for 43.4 percent of the workers in the $9.00 to $10.00 increment. Age of the worker clearly impacts hourly wage rates as a worker’s age correlates with part-‐time/full-‐time employment status, educational attainment and skills level, industry or sector of employment, and status in a household. There is a general consensus in the research literature at the national level that raising the minimum wage has economic consequences: it reduces employment particularly among low-‐skilled workers; increases wages of affected workers but at the expense of low-‐wage workers losing their jobs; has no net effect on low-‐income families or on reducing poverty rates; produces negative effects on skills and school completion rates; raises prices particularly for goods and services in retail,
2
hospitality, construction and health care sectors; weakens the local economies’ competitive position in regional markets; and, over the long term, may lower the earnings of workers later in their work life who were the beneficiaries of increases in minimum wage rates as teenager workers. The economic impacts of raising the minimum wage rates at the national level as reported in the recent literature and based on analyses of national and international labor market research were confirmed to be the outcomes of proposals to raise the minimum wage rate in the State of Maryland. The three scenarios were analyzed ($9.00, $10.00 and $12.00). This research found that raising the minimum wage in Maryland would: (1) increase the price of consumer goods; (2) reduce employment and personal income; (3) weaken the state’s competitive position relative to adjacent states having lower labor costs; (4) slow the growth of gross state product; and (5) slow population growth and weaken real estate values. Specifically, raising the minimum wage in Maryland from $7.25 per hour to $9.00, $10.00 or $12.00 beginning in 2014 would result in a loss of 9,514, 11,502, or 16,387 jobs, respectively and generate losses in real personal income totaling $630 million, $760 million and $1.07 billion, respectively by 2020. This loss of jobs and personal income will be reflected in slower economic growth costing the State’s Gross State product between $684 million and $1.2 billion by 2020 for a minimum wage increase ranging between $9.00 and $12.00. This loss of competitive advantage will reduce exports to economies having lower labor costs. Higher labor costs may also increase in-‐commuting of labor from adjacent lower-‐wage states with the resultant loss of these earnings from the Maryland’s economy as well from its tax base. Higher consumer costs for goods and services sold within the State of Maryland may also result in losses of consumer sales to adjacent states as Maryland residents seek lower prices from beyond the state’s economy. These impacts will affect the broad base of the Maryland economy and the state’s residents with several sectors disproportionally experiencing these negative effects. The hospitality sector, particularly food services, appears to be the most vulnerable to this loss of competitive advantage to adjacent states due to higher labor costs. Retail trade and consumer services also would be significantly impacted. While there may be strong public appeal to raising the minimum wage, this approval is not based on an understanding of the economic effects of higher minimum wage rates and that these increased costs would impact the general public. Understanding the associated economic costs resulting from legislatively raising minimum wage rates in an open market economy is essential to achieving a policy outcome that is in the interest of the state’s businesses and citizens as they will be the ones who will have to absorb the costs of raising the minimum wage rates of the state’s hourly workers.

3
The Impact of Raising the Minimum Wage on the Maryland Economy
Introduction
The debate concerning raising the minimum wage from its current national rate of $7.25 per hour to a range of higher hourly levels has gained momentum this year. At the national level, the President has called for an increase in the minimum wage to $10.10 by 2015 with future increases beyond that level tied to changes in the cost of living; that is, indexing the minimum wage rate. Nineteen states already have minimum wage rates that exceed the national rate; thirteen states raised their minimum wage rate as of January 1, 2014. Montgomery County and Prince George’s County recently adopted hourly rates that increase to $11.50 per hour by 2017. And in late December, the District of Columbia followed along with Montgomery and Prince George’s County’s and raised its already higher minimum wage rate of $9.00 to $11.50 by 2016. In a “no consequences” phrased question included in its December 18, 2013 the Washington Post/ABC News Poll found that 66 percent of the U.S. population approved of a higher minimum wage. It appears clear that raising the minimum wage has widespread public support although there has been the absence of any informed debate. Such a debate must include the economic costs and benefits of raising the minimum wage. These must be identified and measured to fully understand who benefits from such a policy change and who is harmed. Knowing the magnitudes of effects and how these will impact the economy may also provide the basis for mitigating or minimizing the negative impacts of increasing the minimum wage rate. The analyses reported in this paper are designed to: (1) identify which workers in the State of Maryland are currently subject to the minimum wage and how many additional workers would benefit from raising the State’s minimum wage from $7.25 per hour to $9.00, $10.00 and $12.00; (2) to calculate the economic effects of increasing the minimum wage in Maryland on the state’s economy—its employment base by sector of impact, consumer prices, and its gross state product; and (3) to measure other collateral impacts that raising the minimum wage in Maryland may have over a period extending beyond the dates the minimum wage increase becomes effective. The economic impacts identified here extend to the state’s economy and its residents as consumers and participants in the state’s workforce and therefore should be considered along with the benefits that would accrue to the specific workers affected by any increase in the minimum wage.
What the Current Research Concludes
Much has been written about the impacts of raising the minimum wage at the national level. David Neumark and William L. Wascher in Minimum Wages (MIT

4
Press, 2008, 2010) provide an excellent review of the history and research into the effects of minimum wages on employment, wages and wage distribution, skills and school completion, prices, and profits. Their review of the literature and their own research and analyses resulted in four principal conclusions. Quoting from page 6 of their book:
1. minimum wages reduce employment opportunities for less-‐skilled workers, especially those who are most directly affected by the minimum wage;
2. because employment and hours decline among those whose wages are most
affected by minimum wage increases, a higher minimum wage tends to reduce rather than to increase the earnings of the lower-‐skills individuals;
3. minimum wages do not, on net, reduce poverty or otherwise help low-‐
income families, but primarily redistribute income among low-‐income families and may increase poverty; and
4. minimum wages appear to have adverse longer-‐term effects on wages and
earnings, in part because they hinder the acquisition of human capital. Neumark and Wascher found agreement in the research regarding the effects of raising the minimum wage on employment. “…the preponderance of evidence supports the view that minimum wages reduce the employment of low-‐wage workers.” (p. 104). The research found that in the short-‐term there were either zero or positive effects of the minimum wage on low-‐skilled workers but longer term the findings were statistically significant showing negative employment effects from minimum wage increases. Regarding the income effects on low-‐income families, Neumark and Wascher found “an increase in the minimum wage largely results in a redistribution of income among low-‐income families, with some gaining as a result of the higher minimum wage and other losing as a result of diminished employment opportunities or reduced hours.” (p. 189). With 51 percent of minimum wage workers in the U.S. under the age of 25 and almost one-‐third of these workers in the 16-‐19 age cohort, it is likely that many of these younger minimum wage workers are part-‐time workers and still in school. This concentration of younger workers in jobs likely to be impacted by the increases to the minimum wage raises concerns regarding what higher wages would do to high school completion rates and the long-‐run effects of these higher wage rates at younger ages on the subsequent wages and earnings of these workers later on as adults. The research critiqued by Neumark and Wascher found there is some evidence that higher minimum wages rates reduce high school or technical training completion rates; that there is a negative skills effect. Recent research focusing on wages rates and earnings of workers in their late twenties who as teenagers had been exposed to higher minimum wage rates found them to have lower earnings as well as reduced skills acquisition (p. 223).

5
Regarding the impact of a higher minimum wage rate on prices and profits, the research concludes that the higher wage rates do increase the prices of goods and services produced with lower wage labor and that higher prices will have inflationary impacts when these wage increases are geographically confined. While, for a national minimum wage increase the competitive effect is small (internationally it might be measured), at the local or state level where pricing differences define market boundaries there are likely to be impacts on price and investment decisions and these can be measured and modeled. A recent report authored by James Sherk, entitled “Who Earns the Minimum Wage? Suburban Teenagers, Not Single Parents,” (March 2013) focused on the teenage cohort, the 16-‐19 year olds. He makes the case that the primary beneficiaries of increasing the minimum wage are workers who are only temporarily associated with the workforce and not heads of households and that the expectation that increasing the minimum wage would have any impact on reducing the growing household income gap in the U.S. or reducing poverty is misplaced. Sherk lists the characteristics of teenagers and young adults who earn the minimum wage (or less) as follows: 79 percent work part-‐time; 62 percent are enrolled in school during non-‐summer months; their average family income is $65,900 per year; only 22 percent live at or below the poverty line; and most have not finished their education (one-‐third have not yet finished high school, almost 25 percent have only a high school degree, 40 percent have taken college courses but not yet graduated, and only 3 percent have graduated from college). Of all of these younger hourly wage workers, only five percent were married. These facts, as presented by Sherk, underscore the correlation between the age and educational and skills training of workers and their personal income, both determinants of life-‐long earnings that cannot be directly affected by mandated wage rates.
The Research Approach
The economic impact analysis for potential changes in the minimum wage levels from $7.25 to $9.00, to $10.00 and to $12.00 commencing in 2014 on the State of Maryland’s economy utilizes a model constructed by REMI—REMI PI+. PI+ is a dynamic economic and demographic simulation model consisting of twenty-‐three sectors (2-‐digit NAICS codes). The region of analysis is the State of Maryland. This model builds from historic data for the State of Maryland that estimate its position in the national and international economies as well as reflect the emerging structure of employment and relative productivity across the state’s economy. Changes to the model (e.g., changes in the cost of labor) create a disequilibrium in the state’s existing economic relationships and, as the economy moves to regaining its general equilibrium, the model measures the resultant changes that have taken place to re-‐establish its equilibrium (increases or decreases in employment, changes in personal consumption, changes in prices, changes in productivity). As these changes will also impact the state’s workforce requirements, these changes in labor demand will affect the rate of the state’s population growth due to increases or decreases in

6
domestic or international migration to the state. These dynamics may impact real estate values, market shares and other measures of economic vitality. These dynamic interdependencies are illustrated in Figure 1.
Figure 1
Minimum Wage Workers in Maryland Who are the workers in Maryland that would be affected by an increase in the minimum wage? The hourly wage workers in Maryland who would be impacted by an increase from the current minimum of $7.25 per hour and to increases at other increments of possible future raises have been estimated from survey data developed by the Bureau of Labor Statistics of the U.S. Department of Labor, the Current Population Survey of the U.S. Census, the National Bureau of Economic Research, and the Employment and Payrolls Industrial Series for the State of Maryland. Wage Rate Distribution Maryland Hourly Wage Workers There were 1,329,486 hourly workers in the State of Maryland in 2012 accounting for 44.6 percent of the state’s employment base (excluding self-‐employed workers). The distribution of these hourly wage workers by wage rates is shown in Table 1
what%does%REMI%say?%sm!
Model&Structure&

7
along with their industry sector of employment. In 2012, it is estimated that 66,118 or 5.0 percent of the state’s hourly workers were paid $7.25 per hour or less. The wage range immediately above this minimum with an upper value of $9.00 included 169,254 workers and accounted for 12.7 percent of the state’s hourly workers.
Table 1
Workers by Wage Rate and Industry in the State of Maryland, 2012 _________________________________________________________________________________ $7.26-‐ $9.01-‐ $10.01-‐
Industry $7.25* $9.00 $10.00 $12.00 $12.00+ _________________________________________________________________________________ Hospitality 20,027 33,149 17,955 20,027 51,104 Retail Trade 15,233 53,317 25,620 24,927 79,629 Other Services 6,578 9,866 7,893 11,182 29,600 Public Adm. 1,904 2,538 2,538 6,980 102,803 Manufacturing 3,849 3,208 5,774 7,057 51,963 Information Serv. 2,603 -‐ 1,302 1,302 18,224 Education Services 5,184 7,777 5,832 6,480 54,435 Entertainment 2,090 6,969 2,090 3,484 8,361 Health & Social Ser. 2,010 14,741 18,762 25,462 140,712 P & BS** 633 3,798 3,798 5,064 71,535 Wholesale Trade 604 1,208 1,208 2,416 15,705 Transportation 1,307 3,268 4,575 2,614 37,255 Construction 628 5,023 6,906 6,279 83,504 Admin Support 3,466 18,718 7,626 6,239 38,129 Real Estate -‐ 1,964 1,310 2,619 16,369 Agriculture -‐ 2,383 1,589 1,561 1,589 Finance and Ins. -‐ 1,327 2,654 3,318 26,542 Utilities -‐ -‐ 631 -‐ 7,576 Totals 66,118 169,254 118,064 141,013 835,037 ________________________________________________________________________________ Source: estimated from public data, GMU Center for Regional Analysis *reported as equal to or below $7.25. **professional & business services Note: due to the small of some sectors, the survey data do not fully dis-‐ Aggregate their wage distributions; in those cases the workers in Maryland have been distributed according to the national wage profile. The next two hourly categories shown in Table 1, $9 to $10 and $10 to $12, included 118,064 workers and 141,013 workers respectively and accounted for 8.9 percent and 10.6 percent respectively of the state’s hourly workers. An increase of the current minimum wage from $7.25 to $9.00 would affect a total of 235,372 workers directly or 17.7 percent of the state’s hourly workers. An increase of the minimum wage to $10.00 per hour would affect a total of 353,436 workers including those at

8
all hourly rates currently less than $10.00 and account for 26.6 percent of the state’s hourly workers. Raising the minimum wage to $12.00 per hour would add another 141,013 eligible workers to the number of workers covered by the minimum wage bringing the total to 494,449 or 37.2 percent of the state’s current hourly workers. These hourly workers, whose current hourly wage is $12.00 per hour or less, account for 16.6 percent of all jobs in the state (payroll plus hourly but excluding self-‐employment). Demographic Profile of Minimum Wage Workers The distribution of hourly workers in the State of Maryland by wage rates and age are presented in Table 2. Of the 66,118 hourly workers paid at the national minimum wage of $7.25 (or less) in the State of Maryland, 35.4 percent were 16 to 19 year of age, suggesting that most of these workers were students and working part time. Twenty-‐four percent (24.4%) of these wage earners were in the 20-‐24 year old age cohort, many also likely to be still in school and part-‐time workers. Combined, these two age cohorts represented 60 percent of the workers currently paid the minimum age in Maryland or less.
Table 2
Workers by Wage Rate and Age Cohort in the State of Maryland, 2012 _________________________________________________________________________________ $7.26-‐ $9.01-‐ $10.01-‐
Age Cohort $7.25* $9.00 $10.00 $12.00 $12.00+ _________________________________________________________________________________
16-‐19 years 23,406 48,068 13,932 6,205 5,010 20-‐24 years 16,133 50,606 37,308 35,112 48,432 25-‐34 years 15,670 26,065 23,967 30,600 187,048 35 and More 10,909 44,515 75,207 71,916 594,547 Total Wage Earners 66,118 169,254 118,064 141,013 835,037 ________________________________________________________________________________ Sources: CPS Annual Earnings File, 2012; National Bureau of Economic Research; GMU Center for Regional Analysis At higher wage rates, this concentration of younger workers at the minimum wage thresholds continues. At $9.00 per hour, workers under the age of 25 years old would account for 58.3 percent of the hourly workers benefiting from an increase in the minimum wage base from its current level. Workers under the age of 25 years old would account for 43.4 percent of the workers in the $9.00 to $10.00 increment. At higher wages rates, where education and skills training and years of experience begin to impact the qualification for high wage rates, the age profile of the qualifying workers increases. For the age group of workers in the $10.00 to $12.00 category of

9
wages, 70 percent would be over the age of 25 years but only 49 percent were over the age of 35 years. Age of the worker clearly impacts hourly wage rates as a worker’s age correlates with part-‐time/full-‐time employment status, educational attainment and skills level, industry or sector of employment, and status in a household (head or household member). Industry Profile of Minimum Wage Workers Which types of businesses are most affected by Minimum Wages? The results of these analyses are presented in Table 1. This tabulation of workers by wage level and industry are for workers in the State of Maryland who are classified as hourly wage earners. Excluded from these totals are salaried and self-‐employed workers. The distribution of hourly workers by wage rates varies widely across industries with retail trade and hospitality (accommodations and food services) accounting for 53.3 percent of the workers currently being paid the minimum wage or less. At higher levels for the minimum wage, this pattern shifts slightly reflecting the different wage profiles of these different industries. The relative effects of these different distributions of workers at different minimum wage thresholds are shown in Figure 2. Which industries employ hourly workers and at what rates these workers are paid will impact how proposed changes in the current minimum wage rate would impact the state’s economy. The distribution of workers across industries eligible to receive hourly wage increases under any of these proposed higher rates affects the prices of goods and services consumed by the state’s residents and businesses. In effect, these wage increases that are benefits to their recipients are transferred to the costs of production in these respective industries to be borne by their intermediate and final consumers. To the extent that these consumers—individuals and businesses—are part of the Maryland economy these price changes will have a greater impact on the state’s economy than if these consumers are located in other states or countries. Still, any increase in the cost of labor that is not supported by changes in other operating costs or market adjustment to compensate for this change in wage cost will potentially reduce the product’s or service’s competitive market positions in the economies external to the state. Beyond the individual business, within the state’s economy these wage increases will have price and labor effects that will impact Maryland’s gross state product, its total personal income, and its employment base as well as having other potential collateral effects. These will be identified and quantified in the following section. Figure 2 shows the estimated annual increase in wage costs by industry resulting from an increase in the minimum wage. For example, increasing the minimum wage to $10.00 per hour would increase the wage cost for accommodation and food services in the state by approximately $125,000,000 per year.

10
Figure 2
The Economic Impacts of Raising the Minimum Wage
An increase in the existing minimum wage in Maryland from $7.25 to $9.00, $10.00 or $12.00 will increase the earnings of the workers receiving the higher hourly rates, assuming that there is no loss of hours being worked due to the higher cost of the labor. With 169,259 hourly workers currently earning between $7.25 and $9.00 per hour plus the 66,118 workers at the current minimum wage threshold, the new personal earnings reflecting a $1.75 per hour increase (or for workers in between the minimum and $9.00 this increase would be $0.875 assuming an even distribution of wages between $7.25 and $9.00) would total $263,803.75 per hour worked. If all of these workers receive annual earnings based on 1,750 hours (35 hours per week and unpaid vacation time of 80 hours per year), raising the minimum wage to $9.00 would increase total personal income in the state by $461.6 million for these hourly workers, assuming they all remained in the workforce. Using the same assumptions, an increase of the minimum wage to $10.00 from a minimum wage of $9.00 would yield $515.2 million in new personal income (this $1 hourly increase would accrue to workers earning less than $10 per hour) and an increase from a minimum wage of $10 to $12.00 from yield $811 million in new personal income for all hourly workers working in the State of Maryland (this is a statewide annual increase).
what%does%REMI%say?%sm!
Changes(by(Industry(
$0! $50,000,000! $100,000,000! $150,000,000! $200,000,000! $250,000,000!
Forestry,!Fishing,!and!Related!Ac9vi9es!Mining!U9li9es!
Construc9on!Manufacturing!
Wholesale!Trade!Retail!Trade!
Transporta9on!and!Warehousing!Informa9on!
Finance!and!Insurance!Real!Estate!and!Rental!and!Leasing!
Professional,!Scien9fic,!and!Technical!Services!Management!of!Companies!and!Enterprises!
Administra9ve!and!Waste!Management!Services!Educa9onal!Services!
Health!Care!and!Social!Assistance!Arts,!Entertainment,!and!Recrea9on!Accommoda9on!and!Food!Services!
Other!Services,!except!Public!Administra9on!
$9!!
$10!!
$12!!

11
It is clear from these calculations that raising the minimum wage would increase the personal income of the eligible workers working in the State of Maryland. However, the economic benefits realized by these hourly wage earners will not be all captured within the state’s economy. What goods and services this new income is spent on and where the suppliers of these goods and services are located will determine the local economic impact of this spending. The market basket of goods and services purchased by minimum wage workers and their households is disproportionally spent on items that are imported into the state from other locations thereby minimizing the direct positive economic impact on the state’s economy of these higher hourly wage rates that are largely being paid for by state residents and businesses. The overall economic impact of raising the minimum wage on the Maryland economy is captured in the resulting change in the state’s gross state product (GSP), the value of goods and services produced in the state, as shown in Figure 3.
Figure 3
Higher labor costs, higher costs for goods and services sold to state residents and businesses, a decrease in competitive position regionally and nationally, with resultant decreases in exports, and the resulting decline in business investment and
what%does%REMI%say?%sm!
Annual&GSP&
2014! 2015! 2016! 2017! 2018! 2019! 2020!$9!! ,$198! ,$333! ,$442! ,$529! ,$597! ,$647! ,$684!$10!! ,$243! ,$409! ,$542! ,$648! ,$731! ,$792! ,$837!$12!! ,$348! ,$586! ,$778! ,$929! ,$1,048! ,$1,134! ,$1,200!
,$1,400!
,$1,200!
,$1,000!
,$800!
,$600!
,$400!
,$200!
$0!
Millions'of'2
013'do
llars'

12
loss of employment and personal earnings combine to reduce the state’s GSP. These GSP losses are net of the increases in personal consumption expenditures of hourly wage earners benefiting from increases in the minimum wage as shown in Figure 3. While the magnitudes and percentages (see Figure 4) of these decreases are small, they confirm that raising labor costs will translate into higher costs for the goods and services produced and consumed in the state and, with higher prices, the state’s exports will be less competitive and the consumption patterns of the state’s residents will be negatively impacted.
Figure 4
Higher minimum wages will result in the loss of employment in the state. An increase in wages means businesses are receiving “less for more.” When the minimum wage is raised by legislative action and not linked to changes in technology, skills levels or some other market factor including a reduction on the size of workforce to directly compensate for the increase in labor costs, the result will be a higher total wage bill to producers. Unless these higher costs can be passed on to consumers, producers will strive to reduce their total labor costs by reducing employment rather than raising prices or accepting lower profits.
what%does%REMI%say?%sm!
Percent'Change'
"0.35%!
"0.30%!
"0.25%!
"0.20%!
"0.15%!
"0.10%!
"0.05%!
0.00%!
2013! 2014! 2015! 2016! 2017! 2018! 2019! 2020!
$9!!
$10!!
$12!!

13
When the higher minimum hourly wage rates are modeled for the Maryland economy, reflecting the industries employing the eligible hourly workers, they show decreased demand for labor, as presented in Figure 5. For example, a one-‐year increase in the minimum wage from $7.25 to $9.00 commencing in 2014 would cost the Maryland economy 3,091 jobs. A $10 minimum wage in 2015 would result in the state’s employment base decreasing by 5,979 jobs. Some of these employment decreases would come from among the hourly wage workers whose hourly wages were increased due to the higher minimum wage rates while other jobs might be lost as a result of decreased business income due to lost export sales to consumers or sales lost to businesses in other states were labor costs are lower.
Figure 5
The distribution of these job losses by industry on an average annual basis for the 2014-‐2022 period, reflecting an increase in the minimum wage to $12, are presented in Figure 6. This figure identifies the sectors that would experience the greatest impacts on an average basis for the 2014-‐2022 period. Of the average annual statewide loss of jobs totaling 10,146 jobs over the 2014-‐2022 period, as a result of having raised its minimum wage to $12, two sectors—retail trade and accommodations and food services—would account for 4,568 of these job losses or 45 percent. Health services and construction would combine for the loss of 2,338
what%does%REMI%say?%sm!
Employment*
2013! 2014! 2015! 2016! 2017! 2018! 2019! 2020!$9!! 0! -3,091! -4,937! -6,403! -7,549! -8,434! -9,056! -9,514!$10!! 0! -3,745! -5,979! -7,751! -9,134! -10,201! -10,950! -11,502!$12!! 0! -5,336! -8,533! -11,059! -13,029! -14,543! -15,605! -16,387!
-18,000!-16,000!-14,000!-12,000!-10,000!-8,000!-6,000!-4,000!-2,000!
0!
Jobs%

14
jobs or 23 percent. Together, these four sectors would account for 68 percent of the state’s total job losses although all sectors would experience some impact.
Figure 6
These job losses can also be arrayed by occupation as shown in Figure 7. The occupations most affected by this increase of the state’s minimum wage to $12 include sales and related services and food preparation and serving with projected job losses accounting for more than one-‐half (53.7%) of the total average annual decrease. Four other occupations—building and grounds, cleaning and maintenance; management, business and financial services; healthcare and related services; and construction—each accounts of about 8 percent of the losses (34.3% combined). As shown in Figure 7, all major occupational categories would experience some job losses, although the principal losses are in occupations characterized by below average wages and salaries.
what%does%REMI%say?%sm!
Employment*by*Industry*Forestry,!Fishing,!and!Related!Ac4vi4es,!6502!
Mining,!62!
U4li4es,!611!
Construc4on,!61,151!
Manufacturing,!691!
Wholesale!Trade,!6173!
Retail!Trade,!62,011!
Transporta4on!and!Warehousing,!6102!
Informa4on,!666!
Finance!and!Insurance,!684!
Real!Estate!and!Rental!and!Leasing,!6320!
Professional,!Scien4fic,!and!Technical!Services,!6508!
Management!of!Companies!and!Enterprises,!6121!
Administra4ve!and!Waste!Management!Services,!6799!
Educa4onal!Services,!6275!
Health!Care!and!Social!Assistance,!61,187!
Arts,!Entertainment,!and!Recrea4on,!6333!
Accommoda4on!and!Food!Services,!62,557!
Other!Services,!except!Public!Administra4on,!
61,004!
Individual)jobs,)annual)average,)201462022,)$12)minimum)wage)

15
Figure 7
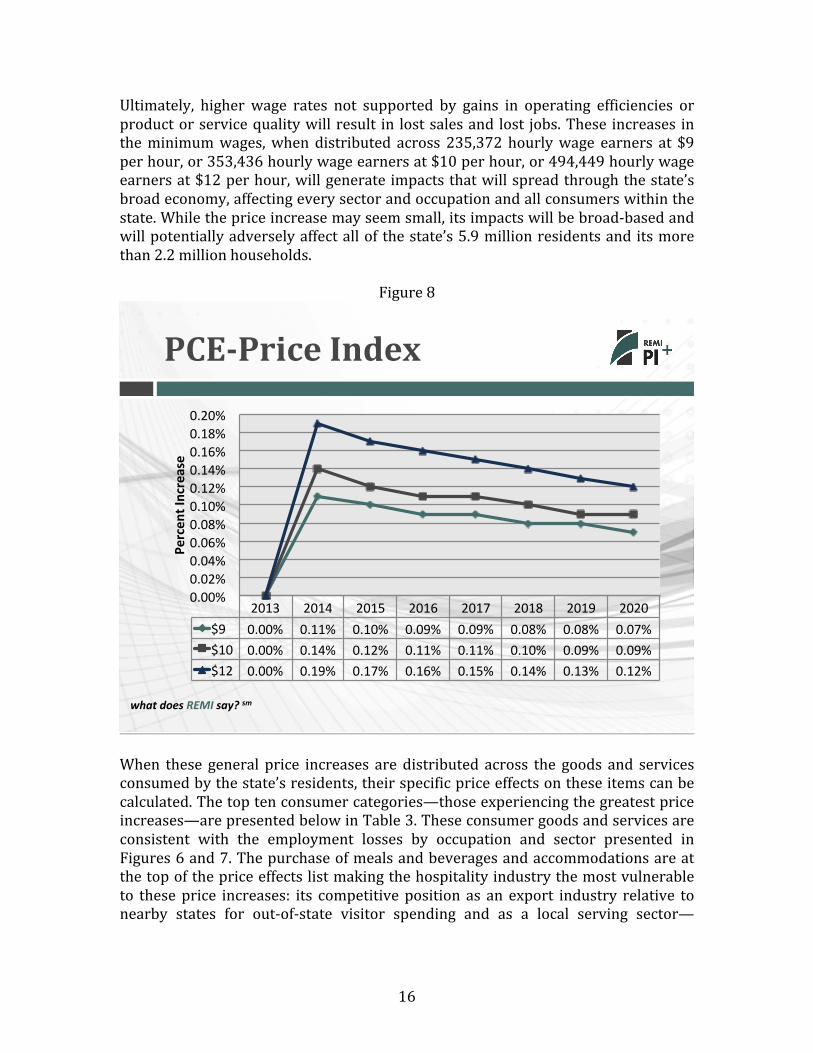
The economic consequences of a minimum wage increase that raises wages without achieving compensating operating efficiencies or increases in product or service quality commensurate to the wage increase has been shown to subtract value from the state’s gross state product (GSP), its value of goods and services produced over a year. These losses in GSP resulting from hourly wage increases will make products and services produced and distributed in Maryland more expensive to the consumer than similar products and services in other states with a lower minimum wage. This price effect can be measured as presented in Figure 8. And, even though it may appear to be a small price increase, it will reduce the state’s competitive position relative to other states while also increasing prices to in-‐state consumers. The results of these differential price levels will include: Maryland exports will decline, Maryland residents will decrease their in-‐state purchases either because basic goods and services cost more so their consumer budget buys less and/or they increase their consumption of out-‐of-‐state goods and services. Also, with relatively higher wages than in adjacent states, out-‐of-‐state residents will be more likely to commute into the state on a daily basis to benefit from these higher wage rates and return to their home states to spend these earnings thereby reducing the potential consumption benefit to the State of Maryland from having the higher minimum wage rates.
what%does%REMI%say?%sm!
Jobs%by%Occupation%
"3,500!"3,000!"2,500!"2,000!"1,500!"1,000!"500!
0!Legal&
Life,&physical,&and&social&science&occupa3ns&
Comm
unity&and&social&service&
Arts,&design,&entertainment,&sports,&and&media&
Protec3ve&service&
Farming,&fishing,&and&forestry&
Computer,&m
athema3cal,&architecture,&and&
Produc3on&
Educa3on,&training,&and&library&
Installa3on,&maintenance,&and&repair&
Transporta3on&and&material&moving&
Construc3on&and&extrac3on&
Healthcare&
Management,&business,&and&financial&
Building&and&grounds&cleaning&and&
Food&prepara3on&and&serving&related&
Sales&and&related,&office&and&administra3ve&support&
16
Ultimately, higher wage rates not supported by gains in operating efficiencies or product or service quality will result in lost sales and lost jobs. These increases in the minimum wages, when distributed across 235,372 hourly wage earners at $9 per hour, or 353,436 hourly wage earners at $10 per hour, or 494,449 hourly wage earners at $12 per hour, will generate impacts that will spread through the state’s broad economy, affecting every sector and occupation and all consumers within the state. While the price increase may seem small, its impacts will be broad-‐based and will potentially adversely affect all of the state’s 5.9 million residents and its more than 2.2 million households.
Figure 8
When these general price increases are distributed across the goods and services consumed by the state’s residents, their specific price effects on these items can be calculated. The top ten consumer categories—those experiencing the greatest price increases—are presented below in Table 3. These consumer goods and services are consistent with the employment losses by occupation and sector presented in Figures 6 and 7. The purchase of meals and beverages and accommodations are at the top of the price effects list making the hospitality industry the most vulnerable to these price increases: its competitive position as an export industry relative to nearby states for out-‐of-‐state visitor spending and as a local serving sector—
what%does%REMI%say?%sm!
PCE$Price)Index)
2013! 2014! 2015! 2016! 2017! 2018! 2019! 2020!$9!! 0.00%! 0.11%! 0.10%! 0.09%! 0.09%! 0.08%! 0.08%! 0.07%!$10!! 0.00%! 0.14%! 0.12%! 0.11%! 0.11%! 0.10%! 0.09%! 0.09%!$12!! 0.00%! 0.19%! 0.17%! 0.16%! 0.15%! 0.14%! 0.13%! 0.12%!
0.00%!0.02%!0.04%!0.06%!0.08%!0.10%!0.12%!0.14%!0.16%!0.18%!0.20%!
Percen
t'Increase'

17
restaurants and recreation—that helps to retain state consumer spending within the state’s economy, both dimensions of this industry are at risk.
Table 3
The loss of employment and higher prices reported above will have overlapping impacts on the state’s employment base that will reduce the state’s total personal income. Not only will personal earning be lost with the loss of jobs, as described above, but personal income will decline as lower paying jobs are substituted for higher paying jobs. This wage compression is a natural phenomenon in the labor market as technology and production efficiencies have enabled employers to shift work assignments to lower skilled or less educated workers in an effort to lower production costs and achieve competitive pricing. Raising the minimum wage would reinforce this natural economic tendency. Beyond these sources of personal income decreases—job losses and downward shifting of work to less skilled and educated workers—as mentioned above, higher hourly wages in Maryland will attract non-‐resident workers from other states to these jobs, workers who will return home to spend their earnings and pay their taxes. This loss of personal income from the state has multiple consequences. In summary, a weaker, less competitive, higher price economy will experience decreases in economic activity overall, as reported in Figure 2, and experience
what%does%REMI%say?%sm!
Consumption*Categories*2014% 2015% 2016% 2017% 2018% 2019% 2020%
Purchased%meals%and%beverages% 0.76%! 0.72%! 0.68%! 0.64%! 0.61%! 0.59%! 0.57%!
Accommoda<ons% 0.74%! 0.70%! 0.66%! 0.63%! 0.59%! 0.57%! 0.55%!
Group%housing% 0.74%! 0.70%! 0.66%! 0.63%! 0.59%! 0.57%! 0.55%!
Membership%clubs,%sports%centers,%parks,%theaters,%and%museums% 0.43%! 0.40%! 0.38%! 0.36%! 0.34%! 0.33%! 0.32%!
Motor%vehicle%maintenance%and%repair% 0.40%! 0.37%! 0.35%! 0.33%! 0.31%! 0.30%! 0.29%!
Gambling% 0.38%! 0.35%! 0.33%! 0.32%! 0.30%! 0.29%! 0.28%!
Personal%care%and%clothing%services% 0.33%! 0.31%! 0.29%! 0.27%! 0.25%! 0.24%! 0.23%!
Commercial%and%voca<onal%schools% 0.26%! 0.25%! 0.24%! 0.23%! 0.22%! 0.21%! 0.21%!
Women's%and%girls'%clothing% 0.28%! 0.26%! 0.24%! 0.23%! 0.22%! 0.21%! 0.20%!
Men’s%and%boys’%clothing% 0.28%! 0.26%! 0.24%! 0.23%! 0.21%! 0.21%! 0.20%!
Top%10%(of%75),%Average%change%in%consumer%prices,%by%category,%$12%minimum%

18
reductions in total personal income in spite of having raised the personal earnings of minimum wage workers. These net personal income losses are presented in Figure 9, ranging from $204 million in 2014 for an increase in the minimum wage to $9 to nearly $1.1 billion in lost personal income in 2020 with a minimum wage level of $12 compared to the current baseline wage rate of $7.25 per hour.
Figure 9
Collateral Impacts
Changes to the minimum wage rate in Maryland can have impacts over a longer period that are not immediate and may be difficult to measure before the passage of five or ten years but are important to recognize and are real. With higher labor costs reducing the state’s economic competitiveness and increasing the prices of locally provided goods and services to the residents of the state, Maryland will become less attractive for business investment and to movers considering relocation from other states to Maryland. Slower economic growth and a weaker labor market, combined with higher costs-‐of-‐living, will slow in-‐migration to the state and may accelerate out-‐migration from the state. Combined, these dynamics will reduce the population growth rate for Maryland.
what%does%REMI%say?%sm!
Real%Personal%Income%
2014! 2015! 2016! 2017! 2018! 2019! 2020!$9!! ,$204! ,$301! ,$388! ,$463! ,$529! ,$583! ,$630!$10!! ,$245! ,$363! ,$467! ,$559! ,$638! ,$704! ,$760!$12!! ,$334! ,$503! ,$653! ,$783! ,$896! ,$989! ,$1,070!
,$1,200!
,$1,000!
,$800!
,$600!
,$400!
,$200!
$0!
Millions'of'2
013'do
llars'

19
Population forecasts for Maryland from the present to 2020, reflecting the current minimum wage rate of $7.50 and alternative higher rates ($9.00, $10.00 and $12.00), are presented in Figure 10. Under current wage rate conditions, the state’s population is projected to increase 5.3 percent or by 310,856 persons between 2013 and 2020. If the minimum wage was increased to $9.00 per hour, the forecasted population growth rate for this period would be 5.0 percent for an increase of 294,919 net new residents. The population cost of this change in the minimum wage rate would be 15,937 residents. At a $10.00 minimum wage rate over this same period, the state’s population growth rate would be 4.95 percent with a gain of 291,617 net new residents or 19,239 fewer residents than if the minimum wage rate was held steady at $7.25 between 2013 and 2020. And, with a $12.00 minimum wage rate, the forecasted population growth for Maryland between 2013 and 2020 would be 4.8 percent, for a gain of 283,818 or 27,038 fewer residents than the baseline forecast reflecting the current minimum wage of $7.25 per hour.
Figure 10
While these slower population growth rates may not appear to be significant, they do confirm the connection between labor costs and the state’s economic growth rate (GSP), changes in employment, personal income, and consumer prices.
what%does%REMI%say?%sm!
Population*
2013! 2014! 2015! 2016! 2017! 2018! 2019! 2020!$9.00!! 5,889,413! 5,916,362! 5,949,917! 5,988,529! 6,032,152! 6,080,900! 6,131,531! 6,184,332!$10.00!! 5,889,413! 5,915,775! 5,948,780! 5,986,877! 6,030,025! 6,078,344! 6,128,584! 6,181,030!$12.00!! 5,889,413! 5,914,407! 5,946,118! 5,983,002! 6,025,028! 6,072,326! 6,121,633! 6,173,231!$7.25!! 5,889,413! 5,919,164! 5,955,360! 5,996,447! 6,042,357! 6,093,193! 6,145,732! 6,200,269!
5,875,000!
5,925,000!
5,975,000!
6,025,000!
6,075,000!
6,125,000!
6,175,000!
6,225,000!
Individu
als*

20
Slower population growth will also impact the state’s housing market. With slower population growth and a slower growing economy, the demand for housing in the state will be reduced. Slower growth in housing demand will impact housing prices. These impacts are presented in Figure 11. These costs or lower values for real estate accelerate over the analyses period (2014-‐2020) as the impacts of higher minimum wages in Maryland roll through the economy reducing job growth, lowering personal income, raising consumer prices and slowing population growth.
Figure 11
Research Conclusions
Raising the cost of labor by increasing the minimum wage will have economic consequences unless these wage increases are compensated for by increased operational efficiencies and/or increased product and service quality that offset the associated price increase from higher labor costs. Otherwise these wage cost increases will raise prices and/or lower the returns on capital. Higher labor costs will increase the price of consumer goods, cost the economy employment and personal income, reduce the state’s competitive position relative to adjacent states having lower labor costs, reduce gross state product, slow
what%does%REMI%say?%sm!
Value&of&Residential&Real&Estate&
2014! 2015! 2016! 2017! 2018! 2019! 2020!$9!! ,$18! ,$52! ,$102! ,$164! ,$237! ,$317! ,$402!$10!! ,$21! ,$63! ,$122! ,$198! ,$286! ,$382! ,$484!$12!! ,$29! ,$86! ,$169! ,$275! ,$399! ,$534! ,$678!
,$800!,$700!,$600!,$500!,$400!,$300!,$200!,$100!
$0!
Millions'of'2
013'do
llars'
21
population growth and weaken real estate values. This loss of competitive advantage will reduce exports. Higher labor costs may also increase in-‐commuting of labor from lower-‐wage states with the resultant loss of these earnings from the state’s economy as well from its tax base. Higher consumer costs for goods and services sold within the State of Maryland may also result in losses of consumer sales to adjacent states as Maryland residents seek lower prices from beyond the state’s economy. These impacts will affect the broad base of the economy and the state’s residents and several sectors will disproportionally experience these negative effects. The hospitality sector, particularly food services, would appear to be the most vulnerable to this loss of competitive advantage with adjacent states due to higher labor costs. Retail trade and consumer services would also be disproportionally negatively impacted. While there may be strong public support to raising the minimum wage this approval is not based on a factual understanding the resulting economic effects of higher wage rates and what these costs would be to the general public. Understanding the associated economic costs resulting from legislatively raising wage rates in an open market economy is essential to achieving a policy outcome that is in the interest of the state’s businesses and citizens as they will be the ones who will have to absorb the costs of raising the minimum wage rates of the state’s hourly workers.

22
Appendices
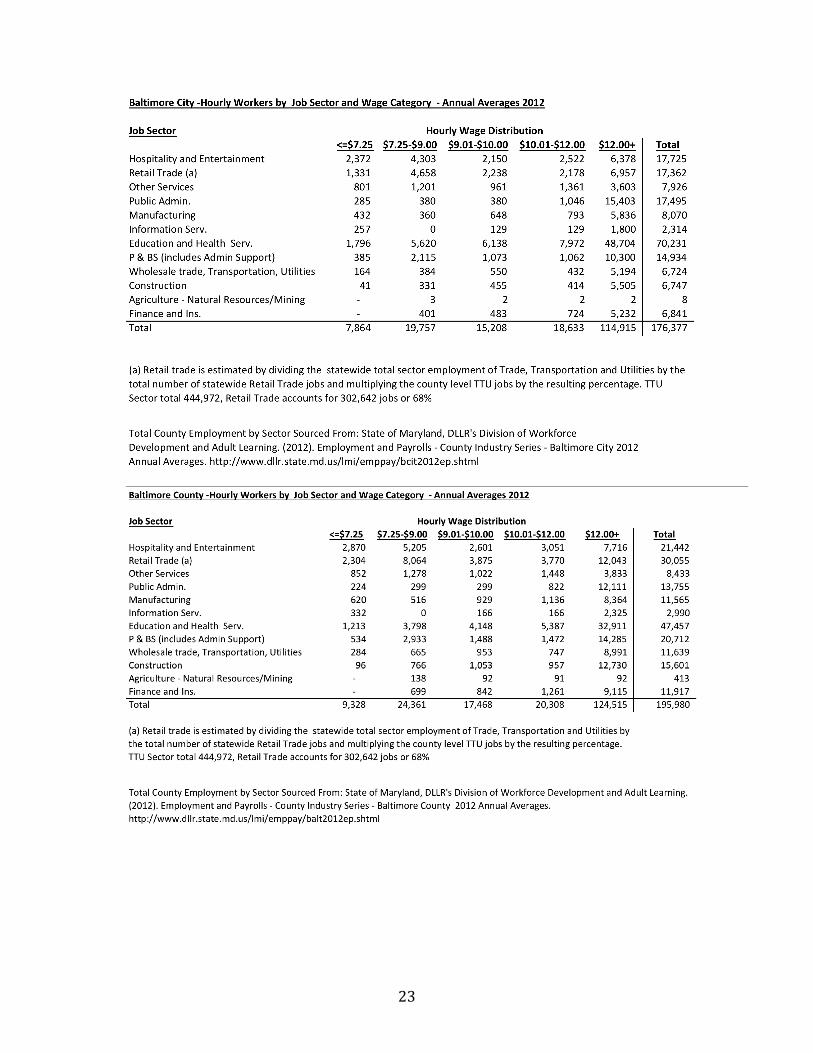
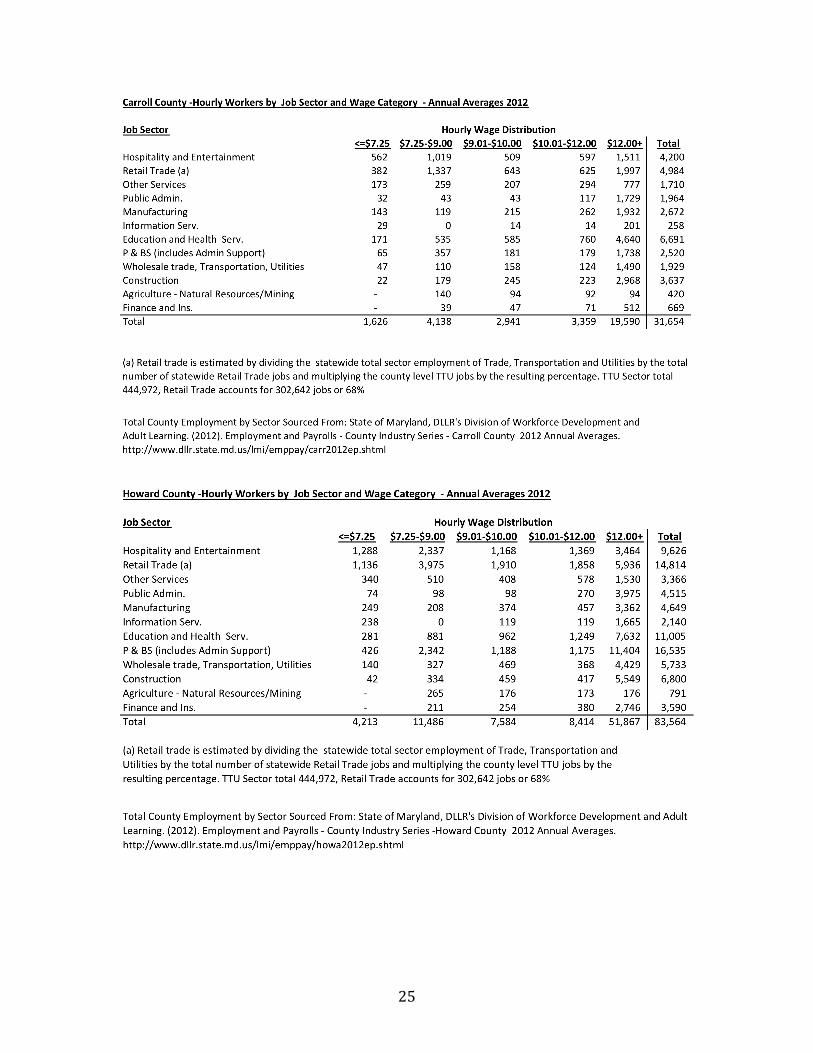
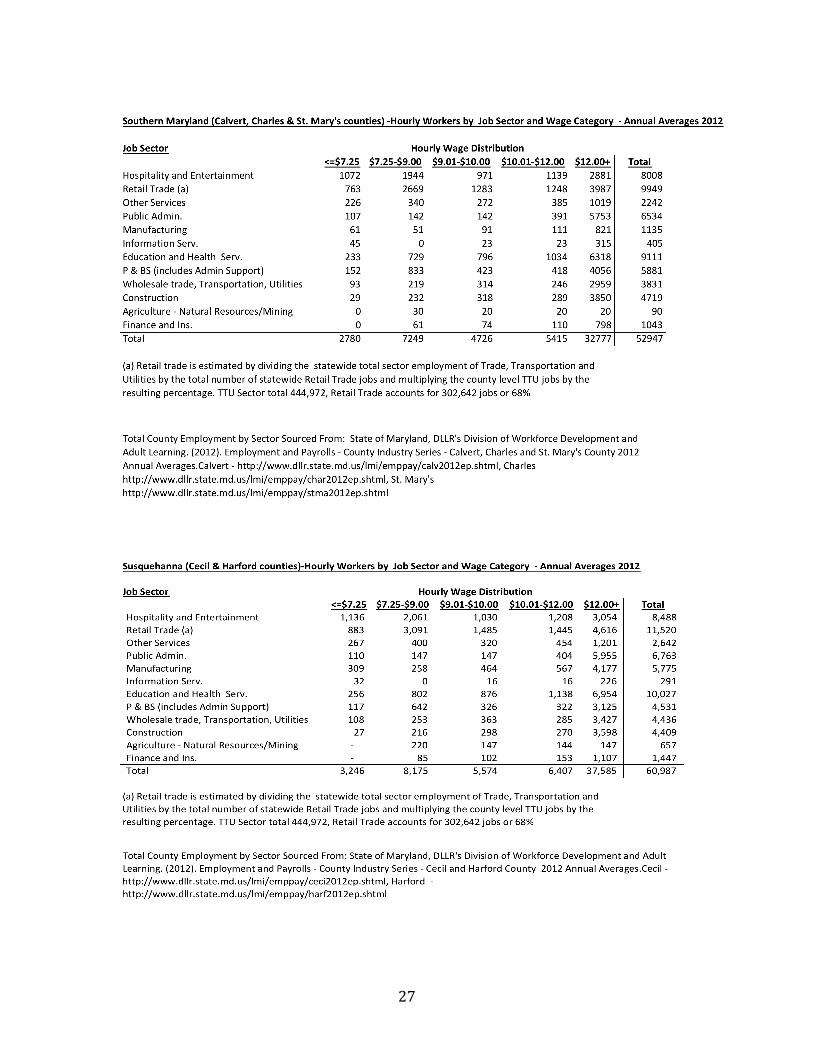
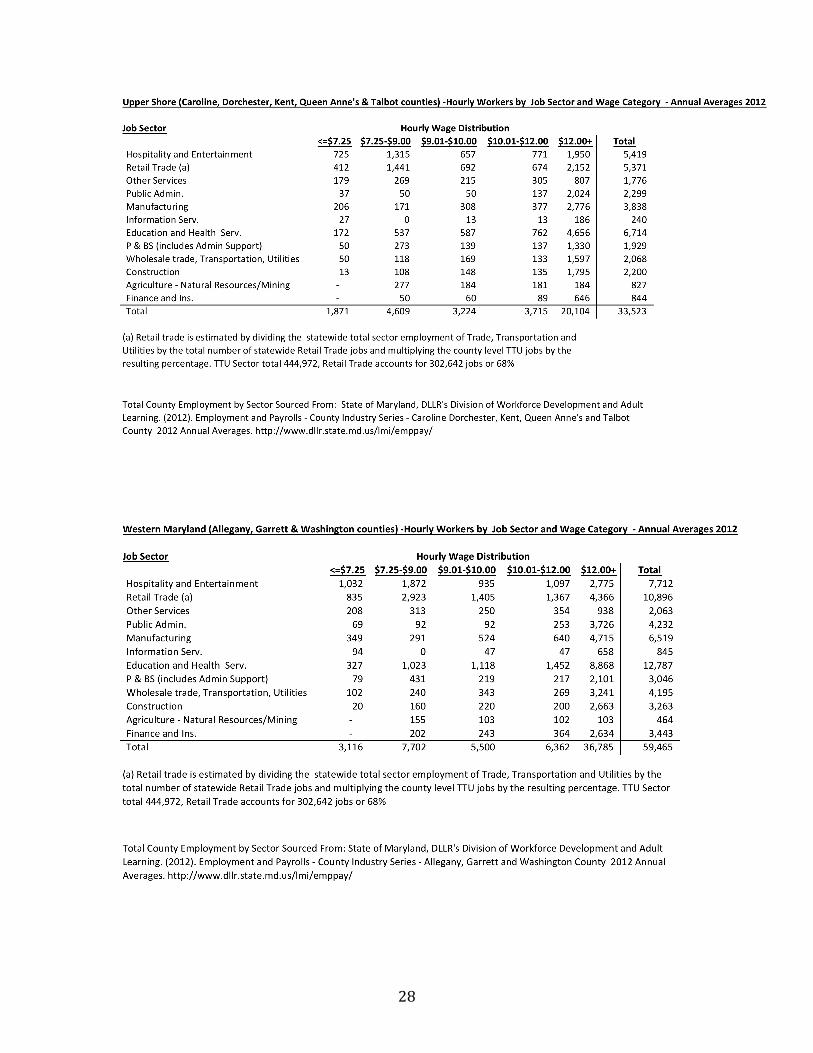
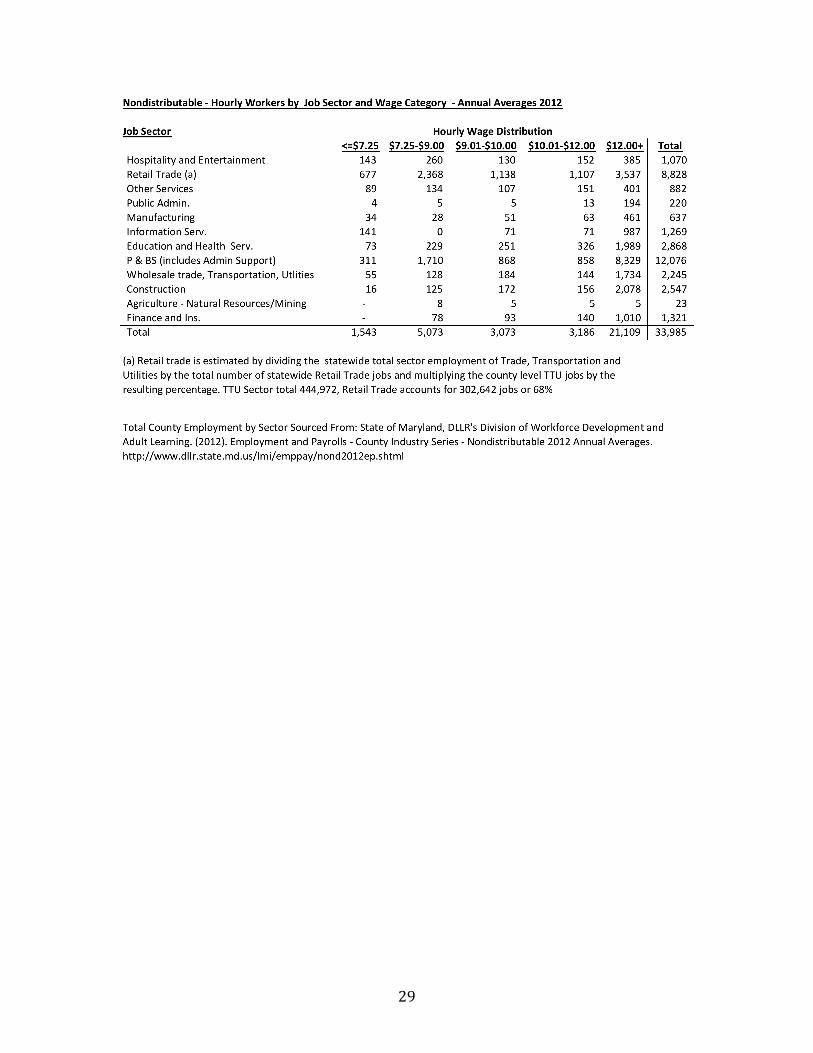
Hourly Wage Workers By County
23

24
25

26
27
28
29