Microclimate land surface temperatures across urban land ...

CHEMICAL ENGINEERING TRANSACTIONS
VOL. 63, 2018
A publication of
The Italian Association
of Chemical Engineering Online at www.aidic.it/cet
Guest Editors: Jeng Shiun Lim, Wai Shin Ho, Jiří J. KlemešCopyright © 2018, AIDIC Servizi S.r.l. ISBN 978-88-95608-61-7; ISSN 2283-9216
Impact of Land Cover Change on Urban Surface Temperature in Iskandar Malaysia
Afsaneh Sheikhia, Kasturi Devi Kanniaha,b* aFaculty of Geoinformation and Real Estate, Universiti Teknologi Malaysia, 81310 UTM Skudai, Johor, Malaysia bCentre for Environmental Sustainability and Water Security (IPASA), Research Institute for Sustainable Environment (RISE), Universiti Teknologi Malaysia, 81310 UTM Skudai, Johor, Malaysia [email protected]
Iskandar Malaysia is one of the most ambitious and impressive development projects ever undertaken in Malaysia that has been experiencing rapid rate of land use change since 2006. Land use change is due to the urban expansion and reduction in natural green areas resulted from enhanced economic growth. The objectives of this study were to investigate the effect of land use and land cover changes (LULCC) on land surface temperature changes in Iskandar Malaysia and to predict the land surface temperature (LST) based on the LULCC by 2025. Remote sensing data such as Landsat (Landsat 5, 7 and 8) were used to calculate the LST and to determine the contribution of urban greenery as a possible remedy to Urban Heat Island (UHI). Weighted Average statistical technique was further used to calculate the effect of changes (increase and decrease) in each land use/cover (LULC) types on LST and predict the LST of entire Iskandar Malaysia by 2025. It was found that build up areas are the warmest land use during the days while forest and mangrove areas have the lowest day time LST. An increase in LST of 3.28 °C was found for urban surface from 1989 to 2013. A similar pattern was also seen in LST for other land cover classes and the increase was 1.96 °C for forest, 2.05 °C (Rubber), 2.47 °C (mangrove), 2.6 °C (oil palm) and 2.86 °C for water. Mean LST for entire Iskandar Malaysia rose from 21.88 °C to 24.78 °C (2.85 °C) by the year of 1989 and 2013. It is predicted that it will increase to 25.3 ○C by the year of 2025.
1. Introduction
It is widely recognised that land-use/cover change (LULCC) at local, regional, and global scales is one of the crucial driving factors of global climate change (Avila, 2012). According to the fourth assessment report of Intergovernmental Panel on Climate Change (IPCC) in 2007, human activities, such as urbanisation and agriculture, accounted for 90 % of global warming (Team et al., 2007). This has been of great concern because innumerable consequent changes were produced on the earth. Some important researches showed that human-induced LULCC including urbanisation was one of the key factors which influence the regional climate (Bounoua et al., 2009). Urbanisation is beneficial to economic welfare of people and the whole society; on the other hand, it intimidates the city's biophysical health. This phenomenon causes damage to environmental qualities such as, biodiversity (McKinney, 2006), soil fertility (Rikimaru and Miyatake, 1997), water quality (Kaushal et al., 2008) and it has effects on other natural resources (Huang et al., 2010) along with ecosystem services (Bolund and Hunhammar, 1999). One of the most investigated phenomena is urban land transformation that is most multifaceted and dramatically irreparable land use change (Camilloni and Barros, 1997). Urban land use changes, e.g., loss of vegetation, enlarged built-up and open areas, as well as increased expanse of urban fabrics like asphalt and concrete can change a city's local climate through the modification of a variety of physical and biological characteristics of the environment (Bounoua et al., 2009). These involve vegetation cover, presence of moisture, impervious built-up covers, soil properties, air and surface temperature, etc., which are influenced in turn by the characteristics of land use (Voogt and Oke, 1998). Iskandar Malaysia (IM), as one of the fastest economic development region in Malaysia. It is predicted that the region will be transformed into a great metropolis by 2025 with 3 million populations (it was reported as high as 1.4 million in 2008). This rapid growth has potential to change considerably the land use in this
DOI: 10.3303/CET1863005
Please cite this article as: Afsaneh Sheikhi, Kasturi Devi Kanniah, 2018, Impact of land cover change on urban surface temperature in iskandar malaysia, Chemical Engineering Transactions, 63, 25-30 DOI:10.3303/CET1863005
25
region, which can lead to huge land cover changes. This continuing land change causes significant ecological consequences yet to be completely investigated. Furthermore, inadequate research has been carried out to assess the impact of future LULC changes upon LST. The objectives of this study were to determine the relationship between different LULC types on Urban Heat Island (UHI) and also to predict the effect of LULC changes on LST by 2025.
2. Study area
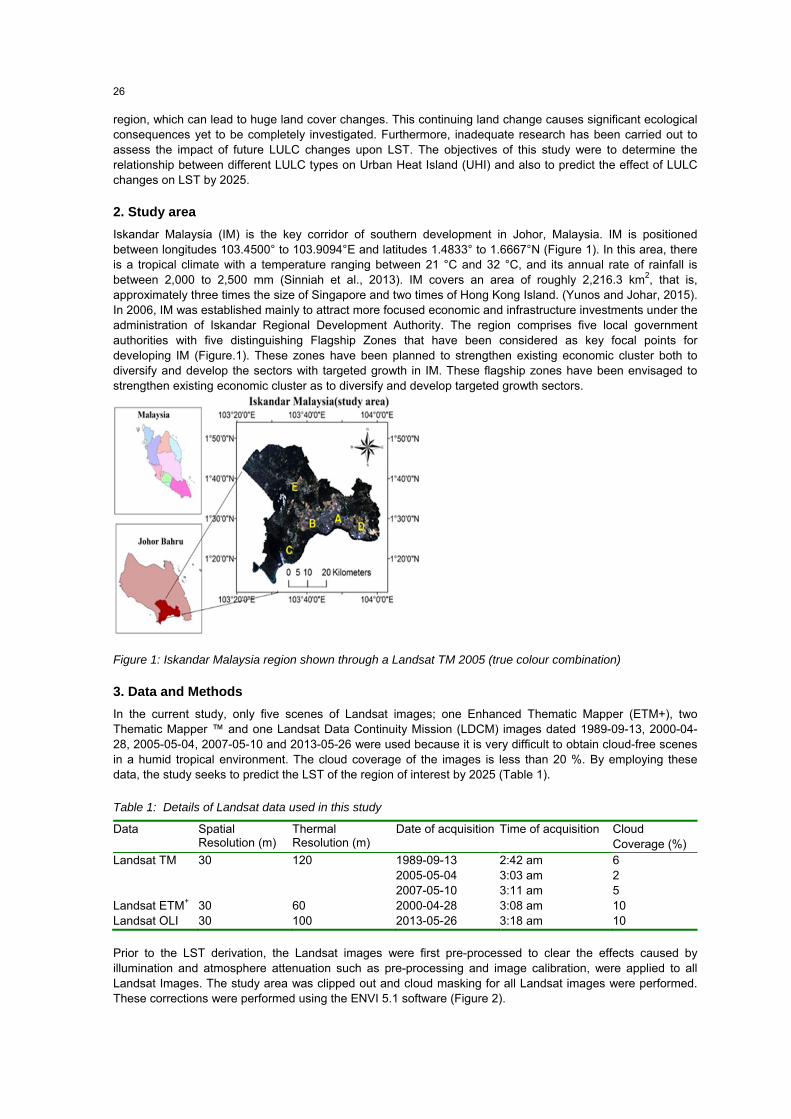
Iskandar Malaysia (IM) is the key corridor of southern development in Johor, Malaysia. IM is positioned between longitudes 103.4500° to 103.9094°E and latitudes 1.4833° to 1.6667°N (Figure 1). In this area, there is a tropical climate with a temperature ranging between 21 °C and 32 °C, and its annual rate of rainfall is between 2,000 to 2,500 mm (Sinniah et al., 2013). IM covers an area of roughly 2,216.3 km2, that is, approximately three times the size of Singapore and two times of Hong Kong Island. (Yunos and Johar, 2015). In 2006, IM was established mainly to attract more focused economic and infrastructure investments under the administration of Iskandar Regional Development Authority. The region comprises five local government authorities with five distinguishing Flagship Zones that have been considered as key focal points for developing IM (Figure.1). These zones have been planned to strengthen existing economic cluster both to diversify and develop the sectors with targeted growth in IM. These flagship zones have been envisaged to strengthen existing economic cluster as to diversify and develop targeted growth sectors.
Figure 1: Iskandar Malaysia region shown through a Landsat TM 2005 (true colour combination)
3. Data and Methods
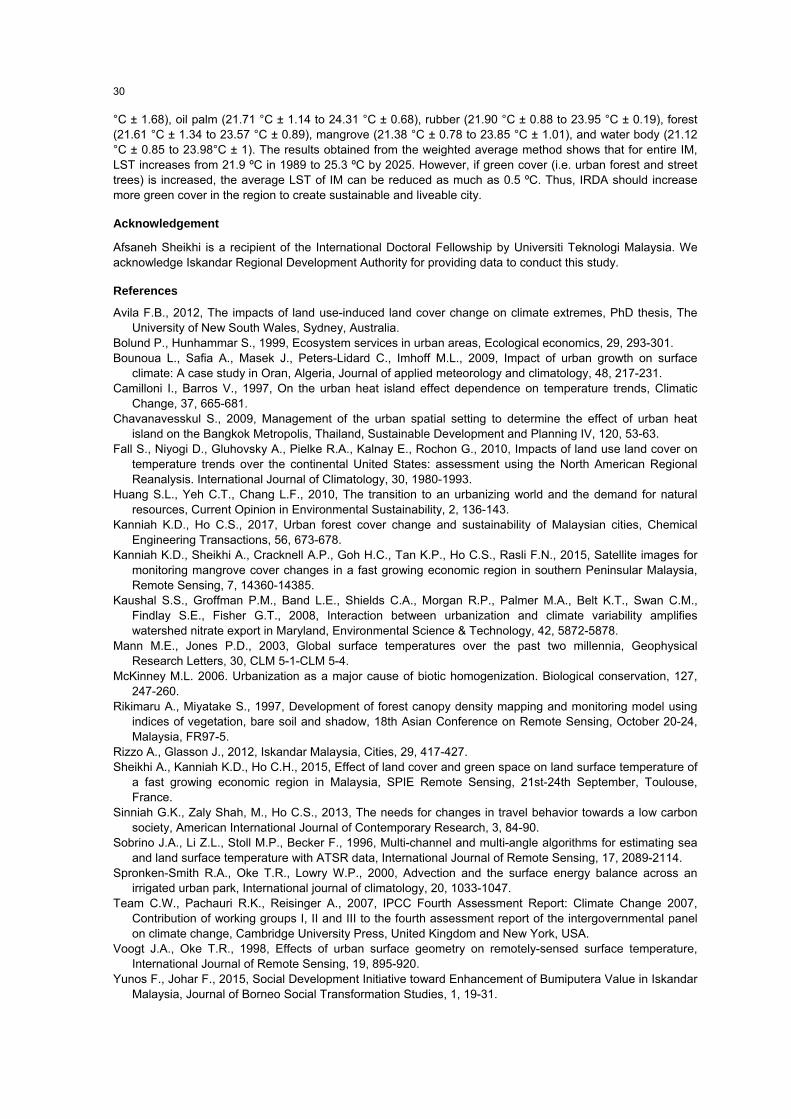
In the current study, only five scenes of Landsat images; one Enhanced Thematic Mapper (ETM+), two Thematic Mapper ™ and one Landsat Data Continuity Mission (LDCM) images dated 1989-09-13, 2000-04-28, 2005-05-04, 2007-05-10 and 2013-05-26 were used because it is very difficult to obtain cloud-free scenes in a humid tropical environment. The cloud coverage of the images is less than 20 %. By employing these data, the study seeks to predict the LST of the region of interest by 2025 (Table 1).
Table 1: Details of Landsat data used in this study
Data Spatial Resolution (m)
Thermal Resolution (m)
Date of acquisition Time of acquisition Cloud Coverage (%)
Landsat TM 30 120 1989-09-13 2:42 am 6 2005-05-04 3:03 am 2 2007-05-10 3:11 am 5 Landsat ETM+ 30 60 2000-04-28 3:08 am 10 Landsat OLI 30 100 2013-05-26 3:18 am 10
Prior to the LST derivation, the Landsat images were first pre-processed to clear the effects caused by illumination and atmosphere attenuation such as pre-processing and image calibration, were applied to all Landsat Images. The study area was clipped out and cloud masking for all Landsat images were performed. These corrections were performed using the ENVI 5.1 software (Figure 2).
26

3.1 Land Surface Temperature derivation and predicting
The thermal infrared spectral bands of the Landsat data were used to calculate LST using techniques proposed by Sobrino et al. (1996). The details of the methodology used to calculate LST is provided in Sheikhi et al., (2015). Land use/cover data obtained using Landsat satellite data from Kanniah et al. (2015) were used in this study to study the relationship between different land cover and their changes on LST. Zonal statistics tool available under Spatial Analyst extension in ArcGIS 10.2 software was used to process LULC and LST data within each LULC types in the Iskandar Malaysia region. For this aim, mean LST was used to analyse the LST value readings corresponding to the individual LULC types as shown in Figure 3.
Figure 2: Flow chart describing the methodology adopted in this study
Figure 3: Mean aggregation analysis (zonal statistic) for computing mean land surface temperature for each land cover types in Iskandar Malaysia
The LST readings associated with the individual land cover types is summarised by extracting the average LST reading of the respective types of land covers using the zonal statistic approach. This is followed by estimating the spatial minimum, mean, maximum and standard deviation of LST of the land cover types within Iskandar Malaysia (IM). The statistical technique of ANOVA was used to evaluate the impact of each LULC types on LST values. To estimate/predict future (2025) LST in IM the weighted average method Eq(1) was used (Mann and Jones, 2003). It is an averaging model which assigns weight to the individual quantities to be averaged. Here, the magnitude of the assigned weight to each quantity (LULC) determines the relative importance of that particular quantity to the whole average.
(1)
Where X denotes the mean temperature of the whole Iskandar Malaysia, x^1,… denotes the LST for individual land use types, w^1, … denotes the area of individual land use types. The weighted average method was used to predict future LST of IM in 2025 under two scenarios based on LULC types as reported by the Islander Regional Development Authority (IRDA). In the first scenario, the urban area is assumed to increase to 92,426 ha, and forest area will increase to 6,321 ha. In the second scenario, the urban area is expected to rise to 80,766.85 ha and a total forest area increase is 17,792 ha. In the second scenario, open space (6,133.15 ha) and intuitional/community areas (5,338.07 ha) are accounted as forest areas (IRDA) (Rizzo and Glasson 2012).
4. Results
As described earlier, LST was calculated for the entire IM region using Landsat images. The results of LST calculated for years 1989, 2000, 2005, 2007, and 2013 are shown in Figure 4. Results of this study show a significant variation in LST across IM. Statistically, the results of the zonal statistic show significant differences between the mean temperatures of the LULC types. For example, the mean temperatures of the urban areas are consistently higher ranging from 23.17 °C ± 1.76 to 26.45 °C ± 1.68 (mean ± standard deviation). In contrast, the mean temperatures for rubber, forest and mangrove were found to be ranging between 21.90 °C ± 0.88 and 23.95 °C ± 0.19, 21.61 °C ± 1.34 and 23.57 °C ± 0.8) and 21.38 °C ± 0.78 to 23.85 °C ± 1.01. For
x ∗ w x ∗ w …x ∗ w
w w ⋯w X =
27

water bodies the average temperature was 21.12 °C ± 0.85 to 23.98 °C ± 1. The temperature of water bodies is relatively lower compared to the urban surface and all other vegetation types.
Figure 4: Land Surface Temperature values computed for Iskandar Malaysia region. A, B, C, D, F are LST maps by the years of 1989, 2000, 2005, 2007 and 2013
The high evaporation from water bodies leads to obvious “oasis effects” of water bodies and plays an important role in reducing surrounding surface air temperature. The oil palm areas, on the other hand, were found to show higher LST values (21.71 °C ± 1.14 to 24.31°C ± 0.68) compared to forest, mangrove and rubber. The reason for this could possibly be related to its lower density. In summary, the listing of LULC types in descending order depicts commercial and residential/industrial (urban), oil palm, water body, rubber, mangrove, and forest as illustrated in Figure 5. The analysis of variance (ANOVA) shows that the mean temperatures of different LULC types is statistically significant at 99 % confidence level (p = 0.001).
4.1 Prediction of Land Surface Temperature
Iskandar Regional Development Authority (IRDA) identified the key objectives and goals concerning the various aspects of development across IM. Table 2, illustrates the projected LULC by the year 2025. In the first scenario which is characterised by rapid development, the LULC in IM is assumed to change rapidly by considering the growth rate of urbanisation as reported by IRDA for 2025. The second scenario is characterised by ecological and cultivated land protection.
28

Figure 5: Boxplots of the mean surface temperature by land use/ land cover type in Iskandar Malaysia
Table 2: Projected LULC in Iskandar Malaysia by the year 2025 by IRDA
LULC types Oil palm Mangrove Urban Rubber Water Forest 2014 Area in ha
114,744
12,733.00
60,354.00
2,043.00
11,467.00
6,828
2025 Area in ha (scenario1)
72,476.14 11,258.21 92,426.00 2,043.00 11,467.00 6,321.08
2025 Area in ha (scenario2)
72,476.14 11,258.21 80,766.85 2,043.00 11,467.00 17,792.3
Table 3 shows the result of the LST predicted using the weighted average method. In the first scenario the overall average LST of IM was found to increase from 21.9 ºC in 1989 to 25.3 ºC in 2025. Meanwhile, in the second scenario the increase was 0.5 ºC less than the first scenario. The decrease in LST in the second scenario is mainly due to increase in forests. Forest, particularly urban forest and street trees, can be used as a tool to reduce urban surface temperature in cities and industrialised locations (Kanniah and Ho, 2017).
Table 3: Mean land surface temperature for entire Iskandar Malaysia from 1989 - 2013
Year 1989 2000 2005 2007 2013 2025 Scenario 1 21.9 C 23.2 C 22.3 C 24.2 C 24.7 C 25.3 C Scenario 2 21.9 C 23.2 C 22.3 C 24.2 C 24.7 C 24.8 C
4.2 Discussion
The sustained changes in the LULC classes across IM over the past two decades and half showed major trends in the development of urban centres. As reported by Fall et al. (2010), every conversion from the green space class to all other classes generally results to rising temperatures. Relatively high temperatures are mostly associated with urban areas undergoing development or newly established areas. The reason for the high LST value for the urban area can be associated with the fact that some buildings block wind and reflect solar radiation amongst the buildings, wall, and ground. Dark coloured, rough, and matt materials, which absorb heat, are unable to reflect radiation compared to light coloured, smooth and shiny materials. Human activities, such as travelling and construction, generate dust and smog, which blocks ventilation. Lower temperature of rubber, forest and mangrove is because trees provide shading and cooling effects. Trees reduce albedo reflection through the canopy of leaves, cool the air through transpiration, and reduce surface temperatures by providing shade which directly lowers immediate and surrounding temperatures. The lower temperature of water body can be related to its influence on the transformation of sensible to latent heat fluxes. On the one hand, the high heat capacity produces the “thermostat effects” of water bodies in comparison to surrounding building materials (Spronken‐Smith et al., 2000). All these factors together contribute towards a phenomenon called “heat island” (Chavanavesskul, 2009).
5. Conclusion
In this research, LST was calculated using Landsat satellite data. The relationships between various types of land cover and changes in LST during day time (computed using the same Landsat images) were analysed. Results of the study show an increase in LST from 1989 and 2013. Average temperatures obtained in case of the commercial and urban land uses were shown correspondingly higher than the other types of land cover. From higher to lower temperatures, the land use types were: commercial and urban (23.17 °C ± 1.76 to 26.45
29
°C ± 1.68), oil palm (21.71 °C ± 1.14 to 24.31 °C ± 0.68), rubber (21.90 °C ± 0.88 to 23.95 °C ± 0.19), forest (21.61 °C ± 1.34 to 23.57 °C ± 0.89), mangrove (21.38 °C ± 0.78 to 23.85 °C ± 1.01), and water body (21.12 °C ± 0.85 to 23.98°C ± 1). The results obtained from the weighted average method shows that for entire IM, LST increases from 21.9 ºC in 1989 to 25.3 ºC by 2025. However, if green cover (i.e. urban forest and street trees) is increased, the average LST of IM can be reduced as much as 0.5 ºC. Thus, IRDA should increase more green cover in the region to create sustainable and liveable city.
Acknowledgement
Afsaneh Sheikhi is a recipient of the International Doctoral Fellowship by Universiti Teknologi Malaysia. We acknowledge Iskandar Regional Development Authority for providing data to conduct this study.
References
Avila F.B., 2012, The impacts of land use-induced land cover change on climate extremes, PhD thesis, The University of New South Wales, Sydney, Australia.
Bolund P., Hunhammar S., 1999, Ecosystem services in urban areas, Ecological economics, 29, 293-301. Bounoua L., Safia A., Masek J., Peters-Lidard C., Imhoff M.L., 2009, Impact of urban growth on surface
climate: A case study in Oran, Algeria, Journal of applied meteorology and climatology, 48, 217-231. Camilloni I., Barros V., 1997, On the urban heat island effect dependence on temperature trends, Climatic
Change, 37, 665-681. Chavanavesskul S., 2009, Management of the urban spatial setting to determine the effect of urban heat
island on the Bangkok Metropolis, Thailand, Sustainable Development and Planning IV, 120, 53-63. Fall S., Niyogi D., Gluhovsky A., Pielke R.A., Kalnay E., Rochon G., 2010, Impacts of land use land cover on
temperature trends over the continental United States: assessment using the North American Regional Reanalysis. International Journal of Climatology, 30, 1980-1993.
Huang S.L., Yeh C.T., Chang L.F., 2010, The transition to an urbanizing world and the demand for natural resources, Current Opinion in Environmental Sustainability, 2, 136-143.
Kanniah K.D., Ho C.S., 2017, Urban forest cover change and sustainability of Malaysian cities, Chemical Engineering Transactions, 56, 673-678.
Kanniah K.D., Sheikhi A., Cracknell A.P., Goh H.C., Tan K.P., Ho C.S., Rasli F.N., 2015, Satellite images for monitoring mangrove cover changes in a fast growing economic region in southern Peninsular Malaysia, Remote Sensing, 7, 14360-14385.
Kaushal S.S., Groffman P.M., Band L.E., Shields C.A., Morgan R.P., Palmer M.A., Belt K.T., Swan C.M., Findlay S.E., Fisher G.T., 2008, Interaction between urbanization and climate variability amplifies watershed nitrate export in Maryland, Environmental Science & Technology, 42, 5872-5878.
Mann M.E., Jones P.D., 2003, Global surface temperatures over the past two millennia, Geophysical Research Letters, 30, CLM 5-1-CLM 5-4.
McKinney M.L. 2006. Urbanization as a major cause of biotic homogenization. Biological conservation, 127, 247-260.
Rikimaru A., Miyatake S., 1997, Development of forest canopy density mapping and monitoring model using indices of vegetation, bare soil and shadow, 18th Asian Conference on Remote Sensing, October 20-24, Malaysia, FR97-5.
Rizzo A., Glasson J., 2012, Iskandar Malaysia, Cities, 29, 417-427. Sheikhi A., Kanniah K.D., Ho C.H., 2015, Effect of land cover and green space on land surface temperature of
a fast growing economic region in Malaysia, SPIE Remote Sensing, 21st-24th September, Toulouse, France.
Sinniah G.K., Zaly Shah, M., Ho C.S., 2013, The needs for changes in travel behavior towards a low carbon society, American International Journal of Contemporary Research, 3, 84-90.
Sobrino J.A., Li Z.L., Stoll M.P., Becker F., 1996, Multi-channel and multi-angle algorithms for estimating sea and land surface temperature with ATSR data, International Journal of Remote Sensing, 17, 2089-2114.
Spronken-Smith R.A., Oke T.R., Lowry W.P., 2000, Advection and the surface energy balance across an irrigated urban park, International journal of climatology, 20, 1033-1047.
Team C.W., Pachauri R.K., Reisinger A., 2007, IPCC Fourth Assessment Report: Climate Change 2007, Contribution of working groups I, II and III to the fourth assessment report of the intergovernmental panel on climate change, Cambridge University Press, United Kingdom and New York, USA.
Voogt J.A., Oke T.R., 1998, Effects of urban surface geometry on remotely-sensed surface temperature, International Journal of Remote Sensing, 19, 895-920.
Yunos F., Johar F., 2015, Social Development Initiative toward Enhancement of Bumiputera Value in Iskandar Malaysia, Journal of Borneo Social Transformation Studies, 1, 19-31.
30