Impact of International Accounting Standards on the of IFRS on... · Impact of International...
40
1 Impact of International Financial Reporting Standards on the Profit and Equity of AIM Listed Companies in the UK Abstract This study examines the extent to which the change from UK GAAP to IFRS has affected companies listed on the Alternative Investment Market (AIM) in the UK. The results suggest that, on average, profit reported under IFRS is higher than that reported under UK GAAP; however, the difference is much smaller for AIM listed companies as compared to what existing literature suggests for firms listed on main stock markets. The Gray’s partial analysis results indicate that despite the extensive programmes for improving convergence over time there is still a considerable discrepancy between IFRS and UK GAAP. Keywords: International Financial Reporting Standards, Accounting Harmonisation, Alternative Investment Market, Small and Growing Companies, Gray Conservatism Index, IFRS 1
Transcript of Impact of International Accounting Standards on the of IFRS on... · Impact of International...
1
Impact of International Financial Reporting Standards on the Profit and
Equity of AIM Listed Companies in the UK
Abstract
This study examines the extent to which the change from UK GAAP to IFRS has affected
companies listed on the Alternative Investment Market (AIM) in the UK. The results
suggest that, on average, profit reported under IFRS is higher than that reported under UK
GAAP; however, the difference is much smaller for AIM listed companies as compared
to what existing literature suggests for firms listed on main stock markets. The Gray’s
partial analysis results indicate that despite the extensive programmes for improving
convergence over time there is still a considerable discrepancy between IFRS and UK
GAAP.
Keywords: International Financial Reporting Standards, Accounting Harmonisation,
Alternative Investment Market, Small and Growing Companies, Gray Conservatism
Index, IFRS 1

2
1. Introduction
The introduction of International Financial Reporting Standards (IFRS) has received
significant attention in both academic and non-academic literature. At the global stage,
these standards have become the most common set of financial reporting regulations, as
more than 120 countries use, or have permitted the use of IFRS for public reporting
purposes (IASPlus, 2011). The move towards the worldwide recognition of IFRS led the
European Union (EU) to pass a regulation in 2002, which requires all companies with
securities listed on EU Stock Exchanges to comply with IFRS in preparing their
consolidated financial statements from January 2005. As a result, it became obligatory for
all UK companies, listed on the main London Stock Exchange (LSE), to follow IFRS
with effect from January 2005. At the same time while adopting IFRS, the UK
Accounting Standards Board (ASB) on the recommendation of LSE, delayed its
implementation for AIM listed companies to January 2007. However, AIM listed
companies were given the option of adopting IFRS on voluntary basis with effect from
January 2005.
Alternative Investment Market has been a vital source of capital for a wide range of
companies. Since its establishment in 1995, it has experienced continuous growth and has
attracted both domestic and foreign investors. By the end of 2014, over 3500 companies
have used this market for raising over £90 billion for inspiring their operations and
growth (LSE, 2015). Thus by considering the key characteristics of AIM companies, such
as size, listing requirements, governance structure, and investor base, we argue that a
change from UK GAAP to IFRS has implications for these companies. Furthermore, UK
has maintained sophisticated accounting standards for several decades, and as IFRS are
largely principle-based rules, where there is an element of flexibility and judgement in the
interpretation and application of certain standards, an impact on UK companies is
expected. We therefore explore whether and how the adoption of IFRS has influenced the
profit and equity of AIM listed companies.
In this regard, evidence in the existing literature indicates that professional judgement in
the interpretation of various principles of accounting are partly influenced by a number of
factors such as, culture, education, training, legal and governance systems (see e.g.,
Chesley 1986; Doupnil and Richer 2003; Doupnick and Ricco 2006; Chand, Cummings,
and Patel 2012). As a consequence, a number of studies apply the Hofstede (1980)
3
dimensions of culture and the subsequent application of these to accounting by Gray
(1988). Most of such studies, examine variation in the application of financial reporting
regulation across different countries and organizations suggesting that cultural differences
across nations would have a bearing on the interpretation of regulation and the financial
reporting practices of firms (see e.g., Radebaugh and Gray 2002; Nobes and Parker 2012).
Similarly, in the context of IFRS adoption and its consequences, Brown and Tarca (2005)
argue that variation in culture may affect the manner in which IFRS are used. In addition,
Chand et al. (2012) pinpoint the need for regulators to consider cultural factors and argue
that an absence of consensus about the numerical meaning of uncertainty expressions in
IFRS is likely to lead to inconsistency in the use of accounting standards across different
cultures.
It is therefore argued that before implementing a change in accounting system, regulators
and policy makers have to bear in mind the key elements of culture identified by Hofstede
(1980).1 This is because it is expected that those countries and cultures which are
characterised by collectivism and secrecy (such as China, India, Japan, and many other
developing countries) would exhibit higher degree of power distance and uncertainty
avoidance, as compared to other cultures (such as US, UK, and Australia) that would
largely demonstrate traits of individualism and masculinity. It has also been argued by
researchers that preparers of accounts from a jurisdiction depicting secrecy (more
conservative) will use higher probability threshold in recognising assets and other items
that result in higher income, and a lower probability limit for the recognition of
obligations and transactions that reduce profit (e.g., Doupnick and Ricco 2006; Chand et
al. 2012). As a consequence, we empirically test as to how the transition from UK GAAP
to IFRS has affected the profit and equity of AIM listed companies.
The first-time adoption of IFRS (IFRS 1) was issued in June 2003 for facilitating the
transparency of the impact of the IFRS adoption process. It requires disclosure of profit
1 Hofstede (1980) identifies four different dimensions of culture as; power distance, individualism, uncertainty avoidance,
and masculinity. Under this framework, power distance is interpreted as gauging the level of equality or the lack thereof
in power distribution across institutions and organizations. Similarly, uncertainly avoidance relates to whether people in
a society attempt to manage the future by planning minute details without any flexibility or go with the tide. According
to Hofstede, societies with high uncertainty avoidance have rules, standardized procedures, and formal organizational
structures with little flexibility and tolerance to accommodate behaviours and opinions that differ from their own. In
addition, individualism refers the extent to which individuals are integrated into groups. Individualistic societies
typically depict the attributes of people concerned with themselves rather than the groups to which they may belong.
Finally, the masculinity dimension of culture explores the extent to which there is a preference for success, heroism,
achievement, and assertiveness in society. Based on Hofstede’s framework, UK for instance, would typically be
characterized by a high index value for individuality and masculinity, while a lower value for power distance and
uncertainly avoidance dimensions.
4
and equity under both the new and old regulations. It also requires that ‘an entity shall
explain how the transition from previous GAAP to IFRS affects its reported financial
position, financial performance, and cash flows and should also include a statement
showing a reconciliation of the financial statements. Thus IFRS 1 adoption provides an
opportunity to measure the impact of the change, not just in one accounting standard, as
would normally be the case with regulatory change, but for the entire range of accounting
standards as it provides controlled and reliable data to evaluate the impact of the
introduction of IFRS on profit and equity of AIM listed companies in the year of
transition. In addition, EC Regulation No. 1606/2002 is considered as one of the most
significant changes in European financial reporting history and given that this regulation
is of much significance to the UK2, it will be appropriate to argue that until now few
studies have focused on the UK’s experiences with the new financial reporting standards.
This paper therefore examines the transition to IFRS of the UK based companies, listed
on AIM by analysing the reconciliation disclosures required under IFRS 1 and contributes
to the existing literature as follows.
First, we concentrate only on AIM listed companies which have never been investigated
before with respect to the implications of IFRS and given the importance of AIM as an
alternative market in the UK, we argue that this will be a useful contribution to the
literature. In addition, AIM listed companies are different from companies listed on the
main stock market due to their size, listing requirements, governance structure, and
investor base, and thus need a detailed investigation with respect to the adoption of IFRS.
Second, under the framework of positive accounting theory3, we assume that managers of
firms will adopt accounting policy choices to enhance their self-interest with respect to
the disclosure of profit and equity under IFRS 1. Additionally, most of the previously
published studies in this area have either focussed on individual companies’ accounting
policy choice or on companies in general, by responding to a change in a single
accounting standard with a relatively narrow focus on the change in reported profit and
equity of companies. Our study takes advantage of the IFRS adoption by many
companies, and for all accounting standards, simultaneously, and investigates accounting
policy implementation and choice across a broad spectrum. This investigation considers
both the compulsory and voluntary adopters of IFRS. In addition, IFRS 1 disclosures
2 Over the years UK has maintained sophisticated financial reporting standards with the largest capital market in the
European Union. 3 Under the assumptions of Positive Accounting Theory, managers of firms will adopt certain accounting methods for
self-interest (Watts and Zimmerman, 1978).

5
provide an opportunity for measuring the impact of change, for an entire range of
accounting standards at a common point in time and provide a unique opportunity for this
investigation within the framework of positive accounting theory.
Third, this study analyses the nature and extent of IFRS adjustments detailed in the
reconciliation statements required under IFRS 1. All individual adjustments in the
reconciliation statements, from IFRS 1, are grouped together according to the relevant
standards and are then expressed as a percentage of the total UK GAAP profit and equity.
This analysis would enable us to understand the nature of change in profit and equity of
the sample companies resulting from the implementation of IFRS. Fourth, we calculate
an index of conservatism for the sample companies through the application of Gray
(1980) index of conservatism techniques to the IFRS adjustments and identify whether
voluntary adopters experience a positive and material adjustment to reported profits
compared to mandatory adopters. This analysis would enable us to understand the motive
of voluntary adopters for the early adoption of IFRS and the implications of IFRS
mandatory adoption. Fifth, we evaluate the partial index results for individual standards
at the sub-sample level between voluntary and mandatory adopters and identify the
standards that create positive and material adjustment to the reported profits and equity of
our sample companies. This analysis would enable us to understand any material
differences between the full sample and sub-sample results caused by individual standards
and would thus help identify the theoretical reasons for the differences.
The results show that the effects of transition to IFRS by AIM companies are not as
significant as those reported in previously published studies for the firms listed on main
stock markets. In addition, voluntary adopters have shown more favourable adjustments
to their reported figures than forced adopters. We argue that the reported differences
could be due to the increased convergence or self-selection between the two standards,
because voluntary adopters could have used the differences between the two GAAPs
opportunistically for some potential gains (Watts and Zimmerman, 1978). The adoption
of IFRS has an average impact on UK GAAP based profit of about 6.66%, however, the
overall impact of IFRS on UK GAAP based equity figure is negative, insignificant and
less than 2 percent. The index of conservatism also shows that the impact of IFRS on
equity (compared to UK GAAP) is statistically insignificant for the sample companies.
6
The rest of this paper is organised as follows. Section 2 reviews prior literature. Section 3
presents information about the sample and research methodology. Section 4 provides
descriptive analysis of the percentage adjustments, arising from the IFRS adoption, to the
profit and equity of the sample companies. Section 5 and 6 presents the results of the
implications of IFRS adoption on the profit and equity derived from the application of the
Gray (1980) index of comparability. These two sections also highlight the outcome of
analysis resulted from the Gray’s partial index for exploring the impact of individual
standards on entities’ profit and equity. Finally, section 7 concludes this paper by
summarizing the main findings, pinpoints the main contributions, and provides
recommendations for policy making and future research.
2. Literature Review
After the European Union regulatory decision to adopt IFRS with effect from January
2005, all EU listed companies are required to produce reconciliation statements according
to IFRS1, (First time adoption of IFRS). This standard requires companies to explain the
differences from local UK GAAP to IFRS. As a result, a number of studies examine the
effects of IFRS on EU listed companies, explore the dissimilarities in financial reporting
following the adoption of IFRS and explain their reasons for the differences (see for
example, Ormrod and Taylor, 2006; Aisbitt, 2006; Christensen, Lee, and Walker, 2007;
Christensen, Lee, and Walker, 2009). In addition, different results have been reported for
the information produced under the mandatory transitional reconciliation statements
under IFRS 1, which indicate the inconsistency in the findings of previous literature in
this area.
In the UK, Aisbitt (2006) was one of the earlier attempts which investigated the potential
effects of IFRS on equity for a sample of listed firms. Using all FTSE 100 companies as
the study sample and considering their transition to IFRS4, the study finds little effects of
IFRS on equity. Similarly, Ormrod and Taylor (2006) examine the effects of IFRS on the
companies’ profit and equity for a sample of non-financial FTSE 100 companies. Their
analysis shows 39 percent increase in the overall profit and 23 percent decrease in equity
as compared to UK GAAP. Furthermore, Christensen et al. (2009) investigate the
4 Aisbitt (2006) notes that it is commonly believed that there would be insignificant adjustments to the reported figures
under the UK GAAP, as both IFRS and UK GAAP stemmed from the same Anglo-Saxon reporting mode. She
invalidates this presumption and argues that all these adjustments are dependent on individual cases and could vary
from company to company.

7
reconciliation statement produced by UK companies and argue that the reconciliation
statement contains price sensitive information which is likely to affect firms’ value, and
managers would therefore try to delay unfavourable reconciliations and adopt different
strategies for the disclosure of information on their transition to IFRS.
Similarly, Stenka, Ormrod and Chan (2008) investigate the impact of IFRS on the profit
and equity of UK companies. By analysing a sample of 50 non-financial FTSE 100
companies, they document a positive adjustment to reported profit (34 percent) with a
negative adjustment (9 percent) to equity reported under UK GAAP. Their results also
indicate that the largest single positive adjustment to profit was due to the change in the
treatment of goodwill under IFRS 3 (18 percent) whereas the largest negative adjustment
reported was due to employee benefits. Furthermore, while investigating the impact of
disclosure under IFRS 1, in the UK, Italy and Ireland, Dunne et al. (2008) show positive
and negative adjustments to profit and equity respectively and document that on average,
net equity decreased under IFRS as compared to the figures under local GAAP in the
three countries. Moreover, Horton and Serafeim (2009) show that data in the
reconciliation statements under IFRS 1 convey new, timely and value relevant
information about UK companies.
In line with the above studies, Fifield et al. (2011) examine the extent and nature of IFRS
adjustments to reported profit and equity for a sample of UK, Irish and Italian companies.
Their results reveal positive adjustments to the sample companies’ profits, however the
adjustment to the profit reported under UK GAAP was significantly higher than that in
Ireland and Italy. They argue that the increase in profit for the UK companies was mainly
associated with the approach to the reporting of goodwill under IFRS 3. Their findings
also suggest an average increase in equity for UK and Italian companies and negative
adjustment to the equity figures of Irish companies produced under the IFRS. Their
overall results are similar to the findings of previous literature (see for example, Aisbitt,
2006; Dunne et al., 2008).
Other studies have also examined the impact of International Accounting Standards (IAS)
on the financial statements of companies in different jurisdictions. For instance,
Jermakowtcz (2004) while investigating the transition to IFRS depicts a significant effect
on both equity and net income in the consolidated financial statements of Belgian listed
companies. Similarly, Cordazzo (2008) reports a significantly positive adjustment to
8
profit and negative adjustments to equity reported during the transition from Italian
GAAP to IFRS and argues that the reconciliation statement provides useful information.
In line with this, while examining the transition to IFRS for a sample of Portuguese listed
companies, Lopes and Viana (2008) reveal that majority of their sample companies had
positive adjustments to their reported profit. Furthermore, Tsalavoutas and Evans (2010)
report positive adjustments to profit and equity figures under IFRS and affirm that
accounting quality has improved, especially for firms audited by the big-4 audit firms.
Moreover, Hung and Subramanyam (2007) examine the implications of IFRS on the
financial statements of German firms. They reported significantly positive adjustments to
both equity and profit figures calculated under the German GAAP. Similarly, Barth et al.
(2008) while comparing accounting based equity matrices for 21 different countries
reported more volatility in the net income figures calculated under IFRS as compared to
local GAAPs. In addition, Gray, Linthicum, and Street (2009) investigate the impact of
first-time IFRS adoption on measures of net income and equity for those European
companies which are listed in the US markets and find significant differences between
measures of income calculated under IFRS and US GAAP.
In addition, Tsalavoutas, Andre, and Evans (2012) document that reconciliations of Greek
GAAP and IFRS, provide useful information to potential investors and are incrementally
value relevant. Furthermore, Stent et al. (2010) examine the financial statement impacts
following the adoption of IFRS in New Zealand and find that the new reporting regime
has brought significant changes to the financial statement for most of the sample
companies. They argue that income taxes and employee benefits increased total liabilities,
whereas financial instruments were the common reason for the net positive effect on total
assets and equity of the reporting entities. Moreover, their analysis demonstrates that the
effects of IFRS vary from one company to another and could therefore be significant for
some companies but not for others. They also report that small listed companies were less
affected by IFRS as compared to large entities.
Furthermore, Tendeloo and Vanstraelen (2005) note that adoption of IFRS send a positive
signal of improved transparency in financial reports. They also find that IFRS adoption
enhances accounting information in countries with weak investor protection rights and
argue that voluntary adoption of IFRS is not associated with lower earning management
in Germany. Moreover, Daske and Gebhardt (2006) show that firms which adopt IFRS
9
exhibit improved level of disclosure quality as compared to those which prepare reports
using national GAAPs. Likewise, Daske et al. (2008) report economically significant
benefits for their sample firms around the mandatory IFRS adoption in different countries.
In addition, while commenting on convergence to IFRS in BRIC countries, Ghioa, and
Verona (2015) argue that these countries believe that adoption of IFRS would improve
the effectiveness of their companies which would help in attracting foreign capital.
However, unlike the aforementioned studies, Schadewitz and Vieru (2008) argue that
reconciliation statements under IFRS do not provide value relevant information for small
listed entities, which used to prepare their reports under Finnish GAAP.
While investigating the implications of IFRS adoption in the UK this study supports the
argument that detailed financial statements under IFRS reduce information asymmetry.
However, it would be worth noting that some companies may wish to adopt IFRS
voluntarily for achieving certain motives. For example, managers of small and growing
companies may have an interest in the voluntary adoption of IFRS with the expectation
that it could help increase their reported profits. More specifically, we argue that it is
more likely that AIM listed companies would either be in need of additional funding or an
owner-manager may be interested in selling his/her shares. Therefore, due to self-interest
these firms would have stronger incentives towards the adoption of IFRS voluntarily for
reporting improved financial performance. On the basis of this argument, we predict that
voluntary adopters of IFRS would experience a larger increase in their profits than
mandatory adopters.
The above discussions on the implications of IFRS in different countries report that most
of the studies have shown either positive or negative adjustments in profit, equity and
other accounting measures during the transitional period. In addition, no previous
evidence exists on the implications of the adoption of IFRS on AIM listed companies in
the UK. This study therefore seeks to identify quantitatively whether significant
measurement differences in profit and equity have arisen following the adoption of IFRS
by AIM listed companies. We expect that due to differences in size, and ownership &
governance structure, the effects of IFRS on the profit and equity of AIM listed
companies may be smaller than those on companies listed on the main markets. In
addition, the increasing convergence between IFRS and UK GAAP would mean that the
impact of adoption at a later date for the small and growing companies may be reduced as
compared to large entities listed on LSE which adopted IFRS in 2005. If this is not the
10
case then the impact of IFRS adoption may be elsewhere in compliance cost and
improved disclosures rather than reporting measurement differences.5
3. Research Methodology and Data
As noted in section 2, under the EU regulation, all EU companies are required to produce
reconciliation statements as part of their transition to IASs (EC, 2002). In the
reconciliation statements, entities are required to explain how the transition from UK
GAAP to IFRS affects their financial position, financial performance, and cash flows.
Additionally, IFRS 1 emphasizes that companies should also provide sufficient details for
understanding any material adjustments to the financial statements due to the new set of
accounting rules. These detailed reconciliation statements, produced in accordance with
IFRS 1- First-time Adoption of IFRS, are utilised as a source of secondary data in this
research.
3.1 Sample Selection
In order to examine the nature and extent of IFRS adjustments detailed in the
reconciliation statements required under IFRS 1 on AIM listed companies, we use FAME
database for accounting and IFRS based data. Initially, all individual adjustments in the
reconciliation statements, from IFRS 1, are grouped together according to the relevant
standards and have been expressed as a percentage of the total UK GAAP profit and
equity. This analysis is followed by the calculation of an index of conservatism for the
sample companies through the application of the Gray index of conservatism to the IFRS
adjustments. Our initial investigations revealed that a total of 764 UK companies report
their financial statements in accordance with IFRS. All these 764 companies were
included in the initial sample. A double sampling approach was then used to obtain a
valid and manageable sample size. We applied two thresholds to the population of the
764 companies. Initially, only those companies were selected which employed at least
twenty employees on a permanent basis.6 In addition, keeping in mind the time frame and
5 Evidence in the existing literature shows differences between IFRS and UK GAAP along with effective dates (e.g,,
Ormrod and Taylor, 2004; PriceWaterhouseCoopers, 2005, 2010). 6 At the start of the data collection process telephonic enquiries were made from randomly selected firms where we asked
all those firms whether they prepare their accounts in house or outsource it to external parties. Through the outcome of
the enquiries it came to the authors’ knowledge that most of the enquired firms which employed less than 20 permanent
employees at the time hired third party services to prepare their transitional IFRS compliant financial statements. On
the basis of this finding we assumed that due to their size and limited resources small firms may not have the desired
11
resources available for this study, we randomly selected fifty percent of the total
population for further analysis. Application of the above criteria reduces the sample size
to 286 companies, out of which 14 companies have shown ‘No Change’ in profit or
equity in their transitional statements. We therefore adopted the following criteria for
managing our sample. First, we included all those companies in our sample which have
detailed reconciliation statements for income and equity with due narrative disclosures
explaining the transition to IFRS. Second, we included companies which had adequate
reconciliation statements for income and equity without any additional narrative
disclosures. We excluded all those companies where the reconciliation statements were
inadequate and it was difficult to evaluate the impact caused by individual standards.
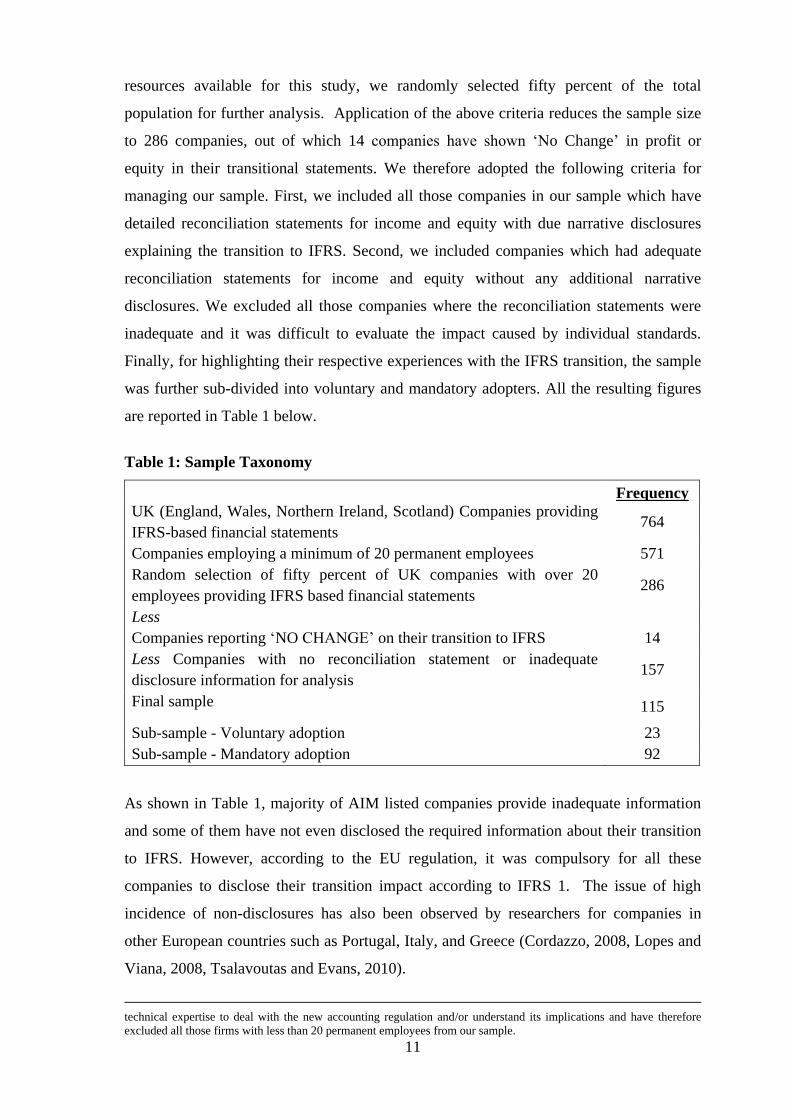
Finally, for highlighting their respective experiences with the IFRS transition, the sample
was further sub-divided into voluntary and mandatory adopters. All the resulting figures
are reported in Table 1 below.
Table 1: Sample Taxonomy
Frequency
UK (England, Wales, Northern Ireland, Scotland) Companies providing
IFRS-based financial statements 764
Companies employing a minimum of 20 permanent employees 571
Random selection of fifty percent of UK companies with over 20
employees providing IFRS based financial statements 286
Less
Companies reporting ‘NO CHANGE’ on their transition to IFRS 14
Less Companies with no reconciliation statement or inadequate
disclosure information for analysis 157
Final sample
115
Sub-sample - Voluntary adoption 23
Sub-sample - Mandatory adoption 92
As shown in Table 1, majority of AIM listed companies provide inadequate information
and some of them have not even disclosed the required information about their transition
to IFRS. However, according to the EU regulation, it was compulsory for all these
companies to disclose their transition impact according to IFRS 1. The issue of high
incidence of non-disclosures has also been observed by researchers for companies in
other European countries such as Portugal, Italy, and Greece (Cordazzo, 2008, Lopes and
Viana, 2008, Tsalavoutas and Evans, 2010).
technical expertise to deal with the new accounting regulation and/or understand its implications and have therefore
excluded all those firms with less than 20 permanent employees from our sample.

12
3.2 Gray Index of Conservatism
After extracting data from FAME database, we calculated an index of conservatism for
the sample companies through the application of the Gray Index of Conservatism to the
IFRS adjustments.7 Gray (1980) was the first who proposed a common yardstick for
evaluating and comparing the financial results of companies using different accounting
practices in different countries. Under this method, the index or ratio measure the extent
to which the financial results reported under different accounting practices would provide
an indication about the measurement behaviour. The ratio of disclosed profit to adjusted
profit, termed as ‘Conservatism Index’, is calculated as follows:
(1)
Where RA is adjusted profit and RD is disclosed profit, while | RA | is the yardstick for
making the comparison.
Since its introduction, several studies have used the Gray index in examining the
differences in reported figures produced under different accounting practices especially
by studies covering the 20F reconciliation statements for US GAAP8 (Adams et al., 1993;
Cooke, 1993; Hellman, 1993; Norton, 1995; Adams et al., 1999; Haverty, 2006; Beckman
et al., 2007). The index has also been used as the main tool for measuring the effects of
transitions from local GAAP to international GAAP (Gray et al., 2009, Haller et al.,
2009).
In line with the above discussions, we adopted the Gray (1980) comparability index for
quantifying the effects of transition from UK GAAP to IFRS on AIM listed companies in
this study. We thus analysed the reconciliations provided by the sample companies under
IFRS 1 and assessed the nature of reported differences in the profit and equity between
IFRS and UK GAAP. 9
Accordingly, the index for profit is calculated as:
7 The index was renamed by Weetman, Jones, Adams & Gray, (1998), as the “Comparability Index”. 8 The index has been used for measuring conservatism in equity (Adams et al., 1993) and for exploring differences in
return on equity (Hellman, 1993). 9 In those cases where material quantitative differences existed between IFRS and UK GAAP figures.

13
(2)
Similarly, the index for equity is calculated as:
(3)
While calculating the above indices, a value of greater than 1 implies that the profit (or
equity) reported under UK GAAP is higher than that calculated under IFRS/IAS and
would be regarded as less conservative than that reported under IFRS/IAS. Similarly, an
index value of less than 1 implies that profit (or equity) reported under UK GAAP is less
than the profit (or equity) reported under IFRS and is regarded as more conservative than
that reported under IFRS/IAS. Furthermore, an index value equal to 1 implies neutrality
and indicates that the transition to IFRS has no impact on profit and equity (Weetman and
Gray, 1991; Hellman, 1993).
In addition to the total index for profit and equity, Weetman and Gray (1991) developed a
partial index10
for exploring the effects or adjustments due to individual accounting
standard. Their partial indices or partial adjustments for profit and equity are calculated as
follows:
(4)
and
(5)
The interpretation of the partial index is similar to that of the overall index of
comparability, where, an index value which is greater than 1 implies that UK GAAP
10 According to IFRS-1, companies are required to provide sufficient details in their reconciliation statements. This also
provides an opportunity to examine distinctive standards adjustments. Partial index of materiality (Weetman and Gray,
1991) is therefore used to analyse the effect of individual IAS. Partial adjustments, individual standard’s
adjustments, were calculated from reconciliation statements.
14
based profit (or equity) is higher than IFRS based profit, an index value of less than 1
implies that UK GAAP based profit is less than IFRS based profit (or equity), whereas an
index value which is equal to 1 implies neutrality.
In order to identify the level of materiality, we again followed previous literature where a
change of 10% in the resulting figures is considered as material, a change of less than 5%
is considered as immaterial and a change between 5 and 10% is regarded as an area of
uncertainty (see for example, Adams et al., 1999; Weetman et al., 1998). In addition,
extreme index values of more than 1.5, have been removed because these values would
distort the outcome of our findings (see, Pallant, 2007, for details). Furthermore, for
assessing the normality of distribution of the scores across the sample, Kolmogorov-
Smirnov (K-S) and Anderson-Darling test of normality were undertaken. The outcome of
these diagnostic tests indicated that the distribution of scores across the sample is not
normally distributed. We therefore focus on the median impact (instead of mean impact)
of the IFRS measures through the index of materiality/comparability. One sample t-test
for median is thus used for determining whether the median index values are statistically
different from the neutral value of 1. In addition, Mann-Whitney test is used for exploring
the differences at sub-group level of voluntary and mandatory adopters.
We also considered limitations of the Gray index in our analyses. First, interpretation of
resulting figures from the index becomes extremely difficult when the index produces
extreme values, or when the denominator is close to zero or the numerator has a relatively
large value. We therefore carefully checked for extreme values, and the denominators and
numerators used in the calculation of the index, and assured that our results were not
affected by such limitations. Second, as reported in Robert et al. (2005), the index may
not be applicable to smaller and less global companies due to the non-availability of data.
However, we have collected data from an established database (FAME) which is well-
regarded and used by renowned academic scholars in the UK. In addition, under the EC
Regulation 1606/2002 and IFRS 1, AIM listed companies are required to prepare a set of
reconciliation statements on their transition to IFRS and as result, we argue that our data
is reliable and is worthy of such an investigation.
15
4. Results and Discussion
In order to examine the transitional disclosures of the sample companies, all adjustments
related to individual accounting standards were initially grouped together in a Microsoft
Excel worksheet. A few discrepancies were observed during the process of relocating
individual standard’s adjustments. For instance, the adjustments related to IAS 32
(Financial Instruments: Presentation), and IAS 39 (Financial Instruments: Recognition
and Measurement) were grouped together. In some other cases, individual adjustments
have been reported separately for financial instruments (IAS 39). In order to avoid any
arbitrary or subjective adjustments in separating the joint effect of reported standards, two
separate categories for financial instruments have been reported.
Similarly, the adjustments relating to IFRS 3 have been reported in two categories (IFRS
3: Goodwill, and IFRS 3: Business Combinations). Accordingly, both groups have been
reported separately in the tables. Additionally, in some cases, adjustments relating to
goodwill and other intangibles have been reported without any reference to the relevant
standards (e.g. IAS 38: Intangible Assets; IFRS 3: Business Combinations) and therefore
reported under the heading IFRS: Goodwill. Moreover, it was also observed that some
adjustments were not associated with a particular standard or sometimes were associated
with multiple standards. Such narrations were added in the ‘others’ adjustments category
for further analysis. Once accumulated, all these adjustments were then expressed as a
percentage of the total UK GAAP profit and equity. This information was further
analysed and descriptive statistics were produced, as reported in Table 2, which describes
adjustments related to income statement, and Table 3, which shows adjustments related to
balance sheet11
.
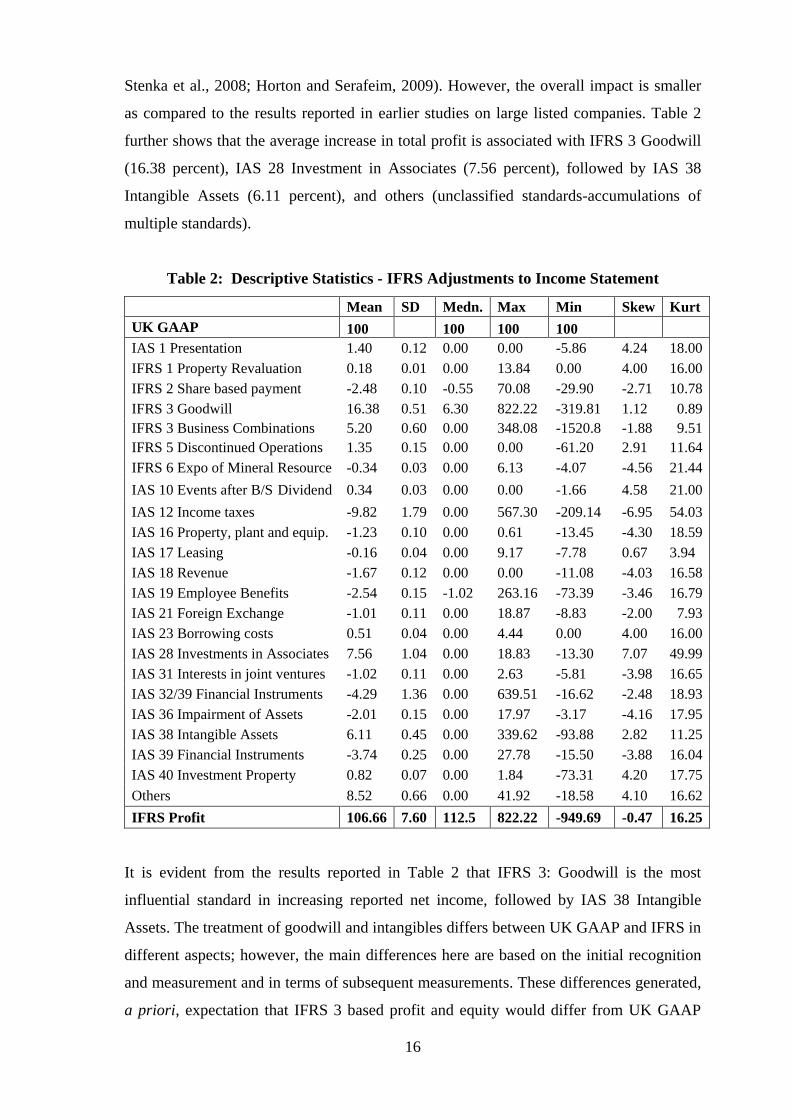
Table 2 reveals the overall impact of IFRS adjustments as a percentage change of the total
profit reported under UK GAAP with relevant IFRS. It shows that the reconciliation from
UK GAAP to IFRS has positively affected the profit of sample companies, with an
average increase of 6.66 percent. This observation is consistent with earlier studies which
have reported positive impact on the reported profit following the adoption of IFRS in the
UK (Ormrod and Taylor, 2006; Christensen et al., 2007; Stenka and Ormrod, 2007;
11 The resulting statistics show that the sample data is not normally distributed, and as a result, due care was needed in
examining the mean values. The study thus gave consideration to both the mean and median values. This argument is
based on the perception that in such circumstances, median values may provide a better estimate of adjustments than the
mean values. .
16
Stenka et al., 2008; Horton and Serafeim, 2009). However, the overall impact is smaller
as compared to the results reported in earlier studies on large listed companies. Table 2
further shows that the average increase in total profit is associated with IFRS 3 Goodwill
(16.38 percent), IAS 28 Investment in Associates (7.56 percent), followed by IAS 38
Intangible Assets (6.11 percent), and others (unclassified standards-accumulations of
multiple standards).
Table 2: Descriptive Statistics - IFRS Adjustments to Income Statement
Mean SD Medn. Max Min Skew Kurt
UK GAAP 100 100 100 100
IAS 1 Presentation 1.40 0.12 0.00 0.00 -5.86 4.24 18.00
IFRS 1 Property Revaluation 0.18 0.01 0.00 13.84 0.00 4.00 16.00
IFRS 2 Share based payment -2.48 0.10 -0.55 70.08 -29.90 -2.71 10.78
IFRS 3 Goodwill 16.38 0.51 6.30 822.22 -319.81 1.12 0.89
IFRS 3 Business Combinations 5.20 0.60 0.00 348.08 -1520.8 -1.88 9.51
IFRS 5 Discontinued Operations 1.35 0.15 0.00 0.00 -61.20 2.91 11.64
IFRS 6 Expo of Mineral Resource -0.34 0.03 0.00 6.13 -4.07 -4.56 21.44
IAS 10 Events after B/S Dividend 0.34 0.03 0.00 0.00 -1.66 4.58 21.00
IAS 12 Income taxes -9.82 1.79 0.00 567.30 -209.14 -6.95 54.03
IAS 16 Property, plant and equip. -1.23 0.10 0.00 0.61 -13.45 -4.30 18.59
IAS 17 Leasing -0.16 0.04 0.00 9.17 -7.78 0.67 3.94
IAS 18 Revenue -1.67 0.12 0.00 0.00 -11.08 -4.03 16.58
IAS 19 Employee Benefits -2.54 0.15 -1.02 263.16 -73.39 -3.46 16.79
IAS 21 Foreign Exchange -1.01 0.11 0.00 18.87 -8.83 -2.00 7.93
IAS 23 Borrowing costs 0.51 0.04 0.00 4.44 0.00 4.00 16.00
IAS 28 Investments in Associates 7.56 1.04 0.00 18.83 -13.30 7.07 49.99
IAS 31 Interests in joint ventures -1.02 0.11 0.00 2.63 -5.81 -3.98 16.65
IAS 32/39 Financial Instruments -4.29 1.36 0.00 639.51 -16.62 -2.48 18.93
IAS 36 Impairment of Assets -2.01 0.15 0.00 17.97 -3.17 -4.16 17.95
IAS 38 Intangible Assets 6.11 0.45 0.00 339.62 -93.88 2.82 11.25
IAS 39 Financial Instruments -3.74 0.25 0.00 27.78 -15.50 -3.88 16.04
IAS 40 Investment Property 0.82 0.07 0.00 1.84 -73.31 4.20 17.75
Others 8.52 0.66 0.00 41.92 -18.58 4.10 16.62
IFRS Profit 106.66 7.60 112.5 822.22 -949.69 -0.47 16.25
It is evident from the results reported in Table 2 that IFRS 3: Goodwill is the most
influential standard in increasing reported net income, followed by IAS 38 Intangible
Assets. The treatment of goodwill and intangibles differs between UK GAAP and IFRS in
different aspects; however, the main differences here are based on the initial recognition
and measurement and in terms of subsequent measurements. These differences generated,
a priori, expectation that IFRS 3 based profit and equity would differ from UK GAAP

17
based measures. In addition, the initial calculation of goodwill in accordance with IFRS 3
requires a different measurement of the fair values of net assets compared to FRS 7 (Fair
Values in Acquisition Accounting-ASB 1994) in the UK. A further difference relates to
the accounting treatment of goodwill and other intangible assets under UK GAAP (FRS
10), and International Accounting Standards. IFRS 3 requires that all the acquiree’s
intangible assets at the acquisition date should be recognised separately in the
consolidated financial statements if they satisfy the IAS 38, definition of an intangible
asset. In contrast, as compared to IFRS, UK GAAP is not as prescriptive in identifying
intangible assets, and as a result, does not rule out the possibility of many intangibles
being subsumed within goodwill. We therefore, expect that on the adoption of IFRS, the
amount of other intangibles will be greater than those reported under UK GAAP.
In terms of the subsequent treatment of goodwill after initial measurement, there is a
major difference between UK GAAP and IFRS. Under the requirements of IFRS,
goodwill is subject to annual impairment reviews, whereas, under FRS 10 the life of
goodwill is a maximum of 20 years where amortization is charged over its useful life. As
a consequence, it was expected that due to the accounting treatment of goodwill, profit
under IFRS would be greater than that reported under UK GAAP. This is because it is
more likely that less impairment charges may arise during the reconciliation period as
compared to the systematic amortisation amount under UK GAAP. Our analysis has
confirmed this and has shown a 16.38 percent positive effect of goodwill on profit under
IFRS as compared to the UK GAAP based profit (see Table 2 for details).
The IFRS treatment of business combinations is similar, but not identical to FRS 2. The
first difference relates to the description of the concept of control and exclusions from
consolidation whereas the second difference is the treatment of gains or losses on disposal
of subsidiaries. In case of IFRS, previously written off goodwill is excluded whereas
under FRS 2, previously written-off goodwill is included in the calculation of gains or
losses on disposal. In addition, under UK GAAP, goodwill that was previously held in
reserves is recycled and included in the profit or loss on disposal of a subsidiary.
However, under IFRS 3, any goodwill held in reserves is not recycled and is excluded
from the profit or loss of a subsidiary, thereby increasing the profit on disposal of a
subsidiary. This shows the impact and significance of looking into some individual
standards which have produced large effects on the profit figures of AIM listed
companies under IFRS.
18
On the basis of the above discussions, we argue that the impact of IAS 38 on profit could
be associated largely with the treatment of intangibles on acquisition and with different
approaches or criteria for intangibles on initial consolidation. This may be due to the
directors using their discretion to recognise goodwill, which is not amortized, and by
avoiding recognising the amortised intangibles in profit (Stenka et al., 2008; Bonham et
al., 2009). In addition, any gains resulted on the exchange of assets under UK GAAP, are
recorded directly in equity, whereas gains on the exchange of assets under IFRS are
recognised in profit only. As a result, differences were expected in the reported profits
and equity of the sample companies. However, the current large effect on the mean value
can be attributed to the adjustment in one of the sample firm’s (Young’s plc.) figures,
which is duly depicted by the Kurtosis value of 49.99, reported in Table 2, under IAS 28.
It is also evident from the results in Table 2 that the positive effect of IFRS on profit
reported under UK GAAP is largely balanced by the negative effect of IAS 12: Income
Taxes (-12.14 percent); IAS 32/IAS 39: Financial Instruments-Disclosures and
Presentation/Recognition and Measurement (-4.29 percent); IAS 39: Financial
Instruments (-3.74 percent); and IFRS 2: Share-based Payments (-2.48 percent). As a
result, the total impact of the IFRS adjustments on the net profit calculated under UK
GAAP is a net increase of about 6.66 percent. Furthermore, under UK GAAP, FRS 19
allows discounting of deferred taxation, whereas IAS 12 does not permit discounting of
deferred tax and this may be the reason for the lower profit due to tax effects under IFRS
(Horton and Serafeim, 2009). Table 2 also shows no other large variations in adjustments
of any particular standard except IAS 12 for the sample companies. This particular
adjustment belongs to Young’s plc and is due to ‘Tax on the Rollover Gains’.
Interestingly, the removal of this particular adjustment significantly enhances the average
impact of IFRS on profit.
In order to test normality of the distribution, skewness and kurtosis were also calculated.
However, for some standards, due to the zero impact produced by their application (such
as, IAS 2, IAS 8, IAS 11, IAS 27 etc.), calculation of skewness was not possible. In
addition, since most of the standards were negatively skewed, the overall adjustments also
resulted in negative skewness. Furthermore, there was also an increase of 12.5 percent in
median values as a result of the application of the new accounting regulation. The reasons
behind the aforementioned changes to profit (loss) are due to the different approaches in

19
the recognition and measurements of accounting based values, between UK GAAP and
IFRS.
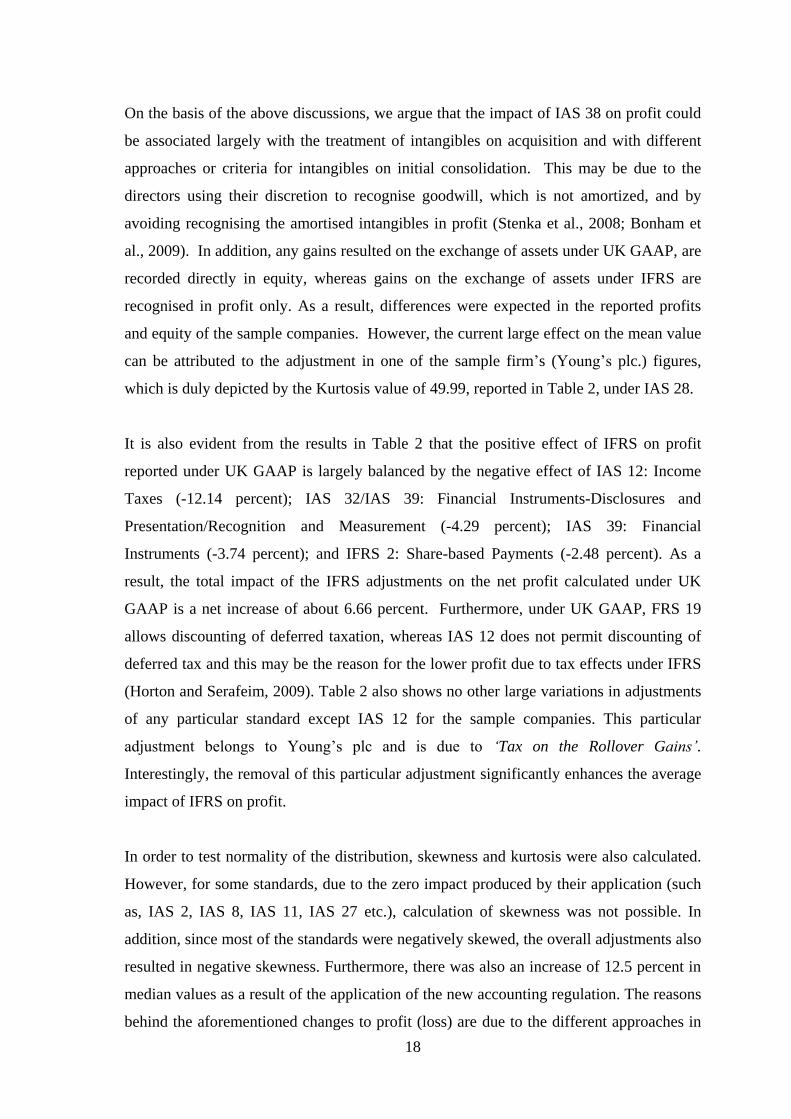
Table 3 shows the impact of IFRS adjustments as a percentage change to the total equity
calculated and reported under UK GAAP. These results are consistent with the impact of
IFRS adoption on profit, that is, the impact on equity for the sample companies varies
from standard to standard on their transition to IFRS. The table shows that the average
IFRS-based equity is 98.29 percent of its value calculated and reported under the UK
GAAP. This means that IFRS adoption has resulted in a 1.71 percent average decrease in
total equity reported under the UK GAAP. Table 3 also shows that the largest single
effect, which reduced total equity, can be associated with IAS 19: Employee Benefits (-
4.10 percent), followed by IAS 32/IAS 39: Financial Instruments-Disclosures and
Presentation/Recognition and Measurement (-3.56 percent), and IAS 12: Income Taxes (-
2.49 percent).
Table 3: Descriptive Statistics - IFRS Adjustments to Balance Sheet
The significantly negative adjustment of IAS 19 (Employee Benefits), to the total equity
of sample companies is consistent with previous studies in the UK (Aisbitt, 2006, Dunne
Mean SD Median Max Min Skew Kurt
UK GAAP 100 100 100 100
IFRS 2 Share based payment 0.46 0.25 0.00 65.52 -0.30 3.82 15.76 IFRS 3 Goodwill 3.29 1.04 3.56 226.81 -38.69 1.64 3.17 IFRS 3 Business Combinations 0.23 0.80 0.40 112.90 -88.93 -0.90 4.23 IFRS Expo of Mineral Resource -0.66 0.53 0.00 0.00 -76.35 -3.85 14.89 IAS 10 Events after B/S, Divid. 2.74 0.94 0.00 185.63 0.000 1.59 1.88 IAS 12 Income taxes -2.49 3.82 0.02 387.10 -898.64 -5.02 31.33 IAS 16 Property, plant and eq. 0.98 0.84 -0.52 105.41 -18.13 1.43 1.30 IAS 17 Leasing -1.68 0.88 -1.07 20.00 -103.71 -2.88 8.79 IAS18 Revenue -0.75 0.55 0.00 0.00 -67.08 -3.32 11.00 IAS 19 Employee Benefits -4.10 2.46 -0.68 170.13 -415.04 -2.79 8.81 IAS 21 Foreign Exchange -0.73 0.37 -0.07 2.60 -30.05 -2.21 4.92 IAS 23 Borrowing costs 0.09 0.06 0.00 12.31 0.000 3.32 11.00 IAS 28 Investments in Asso. 0.16 0.12 0.00 21.20 -2.39 --- 8.37 IAS 32/39 Financial Inst. -3.56 3.47 0.00 26.00 -674.26 -4.97 25.54 IAS 36 Impairment of Assets -0.82 0.27 -0.42 -2.00 -21.44 -1.98 3.94 IAS 37 Provisions -0.38 0.28 0.00 170.13 -39.72 -3.73 14.15 IAS 38 Intangible assets 2.45 1.11 1.72 63.80 -122.40 -0.41 3.99
IAS 39 Hedging 0.36 0.29 0.00 24.40 -4.73 3.62 13.56
IAS 39 Financial Instruments -0.35 0.29 0.12 -3.45 -44.10 -2.06 4.11
IAS 40 Investment Property -0.03 0.02 0.00 0.00 -2.13 -2.83 8.00 Others -0.68 1.01 0.09 103.90 -79.22 -0.44 1.95 IFRS Equity 98.29 28.91 100.75 432.91 -600.33 3.04 10.93

20
et al., 2008, Stenka et al., 2008, Horton and Serafeim, 2009). There was a considerable
difference between IAS 19 and SSAP 24, and in order to bring UK GAAP on employee
benefits more in line with IFRS, SSAP 24 was replaced by FRS 17 in 2004. However, the
transitional requirements of FRS 17 permitted companies to report under SSAP 24 with
corresponding disclosures of the measurement principles of the new UK standards. In this
regard, Horton and Serafeim (2009) document that in relation to employee benefits, UK
companies have opportunistically utilised the transitional requirements of FRS 17, and as
a result, the first-time adoption of IAS 19 resulted in surplus or deficit in pension funds in
companies’ balance sheets. In line with this, most of the AIM listed companies reported
negative adjustments to their equity and disclosed pension deficit in their balance sheets
for the first time. Furthermore, the aforementioned differences between the two GAAPs
on deferred taxation (the wider scope of IAS 12 and the removal of discounting approach
of deferred tax by IAS19), both increased deferred tax liability and thereby decreased
shareholders’ equity. However, the overall negative impact of IFRS/IAS is nearly
balanced by the positive effect of some individual standards.
The negative effects of IFRS on the net equity produced under UK GAAP were also
nearly balanced by the positive effect of IFRS 3: Goodwill (3.29 percent) and IAS 10:
Events after Reporting Period Date regarding dividend recognition (2.74 percent), IAS
38: Intangible Assets (2.45 percent), and other standards. As a result, the total adjustment
to equity from IFRS adoption to UK GAAP is a net decrease of 1.71 percent. In addition,
besides the positive impact of IFRS 3: Goodwill, on the profit of sample companies, it has
also resulted in the highest positive impact on equity of the sample companies. This can
be primarily associated with the use of different approach of IFRS 3 to the calculation of
goodwill and the annual impairment test, than the amortisation approach required by UK
GAAP. As IFRS requires companies to separately recognise intangibles on acquisition,
which reduces the amount of recognised goodwill as compared to the figures reported
under UK GAAP, we initially expected that goodwill reported under IFRS will have a
moderate effect on equity. However, the absence of a requirement in IFRS 3 for the
amortisation of goodwill has resulted in the recognition of larger goodwill figures which
have produced larger figures on equity under the IFRS. In line with this, the results in
Table 3 show a 3.29 percent positive effect of goodwill on equity.
Similarly, adjustments to IAS 38 might be due to different approaches to the accounting
treatment of internally generated intangibles, and other development costs under UK

21
GAAP. The consequential effects of these changes in rules have therefore increased both
profit and equity and are consistent with prior UK-based studies (e.g., Stenka et al.,
2008). Simialrly, the positive impact of IAS 10 (events after reporting period date) is due
to the difference between the accounting treatment of dividends. According to IAS 10, a
dividend should be recognised when it is declared or paid to the ultimate shareholders,
whereas under the UK GAAP final dividend to be paid for the year had to be accrued as
liability when it is proposed by the directors (Aisbitt, 2006; Ernst and Young, 2006).
Therfore the adjustments classified under IAS 10 are the reversal of accruals made under
UK GAAP for the final dividend proposed from the current year’s profit (Aisbitt, 2006),
which resulted in positive adjustments to the equity reported under IFRS.
Moreover, similar to the total impact of the individual standards, Table 3 suggests
considerable variations in the standard deviations of some of the standards, including IAS
32/39 (3.47), IAS 12 (3.82), IAS 19 (2.46), and IFRS 3 (1.04). This notion is further
confirmed by minimum and maximum percentage adjustments, showing relatively large
differences for some of the aforementioned standards. This suggests that the adjustments
of IFRS varied and were different from company to company (Aisbitt, 2006). For
instance, the largest change is in IAS 12: Income Taxes, which ranges from as low as
-898.64 percent to a maximum positive movement of 387.10 percent of the total UK
GAAP based equity. The second largest adjustment is in IAS 32/39 which ranges from
-674.26 percent to 26.00 percent. For IAS 19, the adjustment ranges from -415.04 percent
to 170.13 percent. It is also interesting to note that goodwill has a positive impact on
equity and ranges from -38.69 percent to 226.81 percent. Furthermore, separate
adjustments were also observed (similar to adjustment relating to profit) for IAS 39:
Hedging and IAS 39 Financial Instruments, and are therefore reported separately to
distinguish and associate the difference to the particular segment. However, the overall
impact of these adjustments on equity was insignificant.
In order to identify the impact of IFRS on equity, skewness and kurtosis were also
calculated for testing the normality of the distribution for equity. For some of the
standards, it was not possible to calculate the skewness due to the zero impact or no
adjustment to the particular standards (for example, IAS 2, IFRS 5, IAS 8, IAS 11, IAS
31, etc.). Most of the standards have produced negative skewness (with relatively small
values), however, the overall adjustments across all standards show a positive skewness.
Since the distribution is not symmetrical, the relationship among the averages may be
22
influenced by the outliers. We also report medians, which show that in the IFRS figures,
there is a 0.75 percent increase in total equity of the sample firms. However, this effect
could be largely associated with the individual effect of IAS 32/39 of Park Group, due to
the application of different approach in revenue recognition and reduced loans and
receivables. If the individual adjustment related to Park Group is ignored, then the mean
and median impact become closer to each other, suggesting that the overall impact of
IFRS on the equity reported under UK GAAP, is negligible.
4.1. Comparison with the Findings of Previous Literature
In order to compare our results with previous research on the impact of change in
accounting regulations from UK GAAP to IFRS on large listed companies (such as;
Aisbitt, 2006; Dunne et al., 2008; Stenka et al., 2008; Horton and Serafeim, 2009), we
again refer to our results in Tables 2 and 3. Apart from a few exceptions, our results are
similar to the findings on large UK listed companies. For instance, Stenka et al. (2008)
examined the potential impact of IFRS on a sample of 50 non-financial FTSE 100
companies and report that the single largest average positive impact on profit was due to
IAS 40 (Investment Property) followed by IFRS 3 (Goodwill). However, as reported in
Table 2, the largest average positive impact on total profit is due to Goodwill (IFRS 3).
For IAS 40, our sample shows a positive, but insignificant impact. One possible reason
for this small effect could be the accounting policy choices available under IAS 40 and
SSAP 19. The major investment property companies are likely to be large firms, listed on
the main market. In contrast, only a small number of AIM listed companies have balance
sheets dominated by investment properties. A size effect therefore appears to be a
probable explanation. Another possible explanation could be due to the nature of property
market at the time, which was stable during the sample period. We thus argue that
differences with respect to IAS 40, between the findings of this paper and prior literature
are consistent with these two factors.
The impact of IFRS 3 (Goodwill) on profit and equity of the sample firms is similar to
that of previous studies on large listed companies (e.g., Stenka et al., 2008). However, as
compared to the evidence on large listed companies the relative scale of the impact of
IFRS on the profit of AIM companies is quite small. This may be due to the differences in
accounting policy choice between large main market listed and AIM listed companies or
it may be due to the involvement of large firms in acquisition activities which has resulted

23
in the generation of more goodwill in the underlying economic events. We thus argue
that in addition to accounting policy or measurement differences the quantitative
differences between the findings of this study and previous studies on listed companies
with respect to goodwill may be due to differences in the nature of the underlying
economic activity during the transitional period.
The current study shows that IAS 19: Employee Benefits and IFRS 2-Share-based
payments have the largest effect on equity (-3.64 percent). This is much smaller than that
reported in Aisbitt (2006) which shows -10.10 percent effects on equity. We also report a
negative average impact of IAS 32/39 (-3.56 percent) on equity. However, most of this
impact is also due to one of the companies noted earlier, for example, the average impact
of IAS 32/39 decreases to 0.72 if the individual impact of Park Group is ignored.
Moreover, the average adjustment to IAS 10: Events after the Reporting Period (2.74
percent) is lower than that reported in Aisbitt (2006) which shows an average adjustment
of 6.43 percent. However, as compared to average adjustments to UK GAAP based equity
of FTSE-100 companies reported in Aisbitt (2006), the impact of IAS 12-Income Tax is
similar; IAS 16-Property, Plant, and Equipment is lower, while that of IAS 17: Leasing, is
higher. As majority of AIM listed companies are comparatively smaller in size, they were
affected differently by the new accounting standards than large listed companies.
Our results can also be linked up with the findings of Horton and Serafeim (2009) which
report a strong negative impact of IAS 39 on equity and relatively smaller adjustment to
profit and argue that the reconciliation of UK GAAP and IFRS has information content.
However, unlike Horton and Serafeim (2009), the results of this study show a relatively
lower impact of IFRS on the profit and equity of AIM listed companies. For example,
the evidence we find in this study shows that IAS 39 resulted in an average negative
impact of -4.62 percent on profit and -0.35 percent on equity of AIM listed companies. In
line with these findings we argue that with respect to the impact of the above mentioned
standards on the profit and equity of AIM listed companies our results are inconsistent
with the existing literature on large listed companies.
With respect to the impact of IFRS 2 and IFRS 3 on the profit and equity of AIM listed
companies our results are similar to previous research findings, for IAS 38 and IAS 17 the
impact is shown as higher, whereas, for IAS 19 and IAS 12 the average percentage impact
on the profit and equity of AIM listed companies is lower than previous research findings
24
in the UK (e.g., Stenka et al., 2008). Furthermore, the findings of this study indicate that
transition to IFRS has resulted in an increase of 6.66 percent increase in profit and a
decrease of 1.71 percent in equity. In contrast to these findings, Stenka et al. (2008) have
reported an increase of 33.89 percent in profit and a decrease of 9.28 percent in equity of
their sample which is based on large listed UK companies. In light of these findings we
argue that changes in accounting regulation has implications for small and growing
companies and as result the UK corporate culture, existing regulatory system, tax system
and institutional settings should be borne in mind before the recommendation of any
major changes to accounting regulation in future years.12
5. Index of Conservatism - Profit
The index values were calculated using equations 1 to 4 for each sample company. The
results for the overall profit according to the bands of materiality with descriptive
statistics and significance are reported in Tables 4. The results suggest that upon their
transition from UK GAAP to IFRS, the profit figures for most of the sample companies
have been positively affected. The mean value for the overall indices indicates that profit
reported under UK GAAP was 85.6 percent of the profit reported under IFRS. In addition,
the median index value of 0.977 (significant at 5 percent level) confirms that in majority
of cases, companies’ profits have been affected positively, with a minority being affected
negatively, upon their transition to IFRS. More precisely, we find that 39 companies
reported an increase of 10 percent or more, from UK GAAP-based profit, while 18
companies reported a decrease of 10 percent or more in profit under IFRS than the profit
under UK GAAP.
12 Leuz (2010) argues that due to several differences across countries in accounting regulation, financial reporting
systems are unlikely to converge at the global stage.

25
Table 4: Index of Conservatism - Profit
Table 4 reports similar results at the sub-sample level (voluntary and mandatory adopters
of IFRS). It shows that the profits reported under IFRS by both these groups are
comparatively higher than those reported under UK GAAP. This is also confirmed by the
one-sample t test for median. Median index value of 0.824 (significant at 5 percent level)
shows that the profit reported by voluntary adopters of IFRS is higher than mandatory
adopters. Moreover, the Mann-Whitney test statistics also confirmed the aforementioned
results and suggest that the figures for both voluntary and mandatory adopters are
statistically significant at the 5 percent level. The table also shows that 71 percent of
voluntary adopters had a material impact on their profit compared to 64 percent of
mandatory adopters which specify a comparatively higher impact of IFRS on the profits
of voluntary adopters.
Our findings on the reporting of higher profits by the voluntary adopters reveal that these
companies may have adopted IFRS for some preconceived objectives, which is consistent
with prior literature (e.g., Dumontier and Raffournier, 1998; El-Gazzar et al., 1999; Ball
et al., 2003; Gassen and Sellhorn, 2006). The potential objectives of voluntary adopters
Level of materiality
Index value
Overall
Voluntary
Mandatory
Adjustment to UK GAAP based Profit
is –10% or more of the IFRS Profit ≤0.90 39 12 27
Adjustment to UK GAAP based Profit
is between -5% and -10% of the IFRS
Profit
0.90–0.95 08 02 06
Adjustment to UK GAAP based Profit
is within ± 5% of the IFRS Profit 0.95–1.05 39 04 35
Adjustment to UK GAAP based Profit
is between +5% and +10% of the IFRS
Profit
1.05–1.10 06 00 06
Adjustment to UK GAAP based Profit
is +10% or more of the IFRS Profit ≥1.10 18 03 15
Mean 0.856 0.626 0.9080
Standard Deviation 0.522 0.651 0.4753
Minimum -2.481 -1.109 -2.4810
Maximum 2.610 1.816 2.6110
Kurtosis 17.44 1.843 31.300
Skewness -3.00 -1.141 -4.001
Median 0.977** 0.824** 0.9927
Mann-Whitney test 837.5**
**, indicate significance at the 5% level.

26
would vary across different organisations and may relate to profit-based compensation,
mergers and acquisitions, debt contracting, and raising additional capital (both debt and
equity). For instance, profit-based compensation leads firms to inflate their reported profit
and therefore one possible reason for adopting IFRS voluntarily could be the management
compensation schemes. In addition, for owner managed firms, it could be the exit route to
sell their shares or venture capitalist shareholders (dominant shareholders) may want to
sell shares followed by an increase in reported profit. Alternatively, it is also possible that
these companies have initiated a new venture and are therefore seeking to enhance their
profit figure for its successful inception and attraction of external sources of finance.
5.1 Partial Index - Profit
Table 5 reports the results from the application of partial indices of comparability where
the index values are calculated for the individual IFRS, particularly, for those standards
which are contributing to differences in the reported profit. Thus the partial indices are
shown only for those standards, which had reported differences on their transition from
UK GAAP to IFRS. The mean index value of the partial index shows that apart from a
few exceptions, most of the adjustments are positive towards the total UK GAAP profit
figures of AIM listed companies. As noted earlier, the distribution of the score is not
normally distributed, either at total sample or at individual standard level. Thus, in order
to show the impact of individual standards on the profits of our sample companies we
show median values and their significance level in Table 5. This is because median values
are not greatly affected by very small or very large values in the sample.
Table 5 shows that only three partial indices had statistically significant median value
adjustments. It is evident from the table that IFRS 2 (Share-based Payments), IFRS 3
(Goodwill) and IAS 19 (Employee Benefits) have resulted in significant adjustments to
the profit reported under UK GAAP. First, IFRS 2 and IAS 19 are showing significantly
negative material adjustments of 2.6 percent and 2.4 percent, respectively, to UK GAAP
based profit figures. In other words, AIM listed companies have shown material
adjustments in their share-based payments and employee benefits. This finding may
suggest that the application of IFRS 2 negatively affects the profit of AIM listed
companies because these companies reward their employees through share-based
payments and expect that by having ownership stakes in their companies they will work
in the best interest of the company. Similar effects are also shown on the UK GAAP
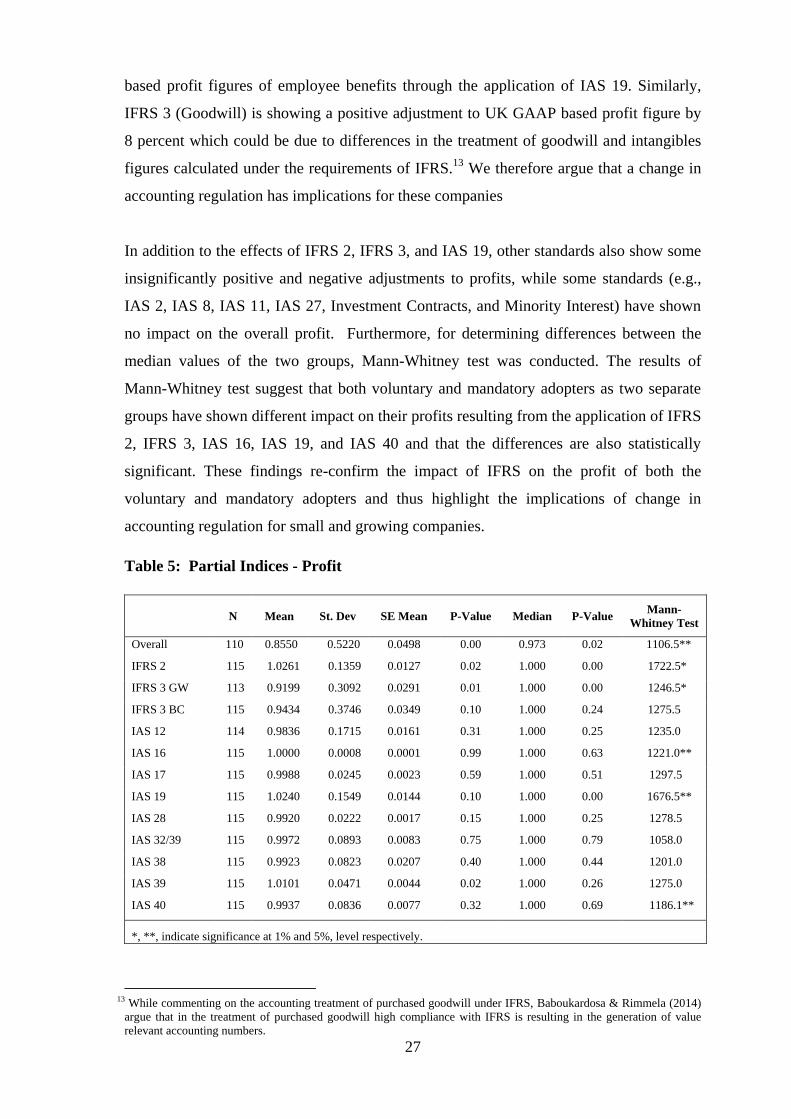
27
based profit figures of employee benefits through the application of IAS 19. Similarly,
IFRS 3 (Goodwill) is showing a positive adjustment to UK GAAP based profit figure by
8 percent which could be due to differences in the treatment of goodwill and intangibles
figures calculated under the requirements of IFRS.13
We therefore argue that a change in
accounting regulation has implications for these companies
In addition to the effects of IFRS 2, IFRS 3, and IAS 19, other standards also show some
insignificantly positive and negative adjustments to profits, while some standards (e.g.,
IAS 2, IAS 8, IAS 11, IAS 27, Investment Contracts, and Minority Interest) have shown
no impact on the overall profit. Furthermore, for determining differences between the
median values of the two groups, Mann-Whitney test was conducted. The results of
Mann-Whitney test suggest that both voluntary and mandatory adopters as two separate
groups have shown different impact on their profits resulting from the application of IFRS
2, IFRS 3, IAS 16, IAS 19, and IAS 40 and that the differences are also statistically
significant. These findings re-confirm the impact of IFRS on the profit of both the
voluntary and mandatory adopters and thus highlight the implications of change in
accounting regulation for small and growing companies.
Table 5: Partial Indices - Profit
13 While commenting on the accounting treatment of purchased goodwill under IFRS, Baboukardosa & Rimmela (2014)
argue that in the treatment of purchased goodwill high compliance with IFRS is resulting in the generation of value
relevant accounting numbers.
N Mean St. Dev
SE Mean
P-Value
Median
P-Value
Mann-
Whitney Test
Overall 110 0.8550 0.5220 0.0498 0.00 0.973 0.02 1106.5**
IFRS 2 115 1.0261 0.1359 0.0127 0.02 1.000 0.00 1722.5*
IFRS 3 GW 113 0.9199 0.3092 0.0291 0.01 1.000 0.00 1246.5*
IFRS 3 BC 115 0.9434 0.3746 0.0349 0.10 1.000 0.24 1275.5
IAS 12 114 0.9836 0.1715 0.0161 0.31 1.000 0.25 1235.0
IAS 16 115 1.0000 0.0008 0.0001 0.99 1.000 0.63 1221.0**
IAS 17 115 0.9988 0.0245 0.0023 0.59 1.000 0.51 1297.5
IAS 19 115 1.0240 0.1549 0.0144 0.10 1.000 0.00 1676.5**
IAS 28 115 0.9920 0.0222 0.0017 0.15 1.000 0.25 1278.5
IAS 32/39 115 0.9972 0.0893 0.0083 0.75 1.000 0.79 1058.0
IAS 38 115 0.9923 0.0823 0.0207 0.40 1.000 0.44 1201.0
IAS 39 115 1.0101 0.0471 0.0044 0.02 1.000 0.26 1275.0
IAS 40 115 0.9937 0.0836 0.0077 0.32 1.000 0.69 1186.1**
*, **, indicate significance at 1% and 5%, level respectively.
28
In light of these findings we argue that the impact of IFRS 2 on AIM companies could
either be due to size effects, where larger AIM companies are more likely to award share-
based payments to their managers and employees or in case of small firms it may be a
viable way of rewards because these firms do not possess enough cash for paying bonuses
to their employees. Similarly, the impact of IFRS 3 could also be associated with larger
AIM companies, which are likely to be more acquisitive and have therefore adopted IFRS
voluntarily. In addition, the impact of IAS 19 (employee benefits), could be associated
with the defined benefit pension scheme of larger AIM companies or voluntary adopters;
whereas the smaller AIM companies are more likely to have a defined contribution
scheme, where there is little capacity for accounting policy variation, or no pension
scheme. Moreover, the implication of IAS 40 (investment property) could also be linked
to the size effect because larger companies own more investment properties than smaller
ones. Additionally, IAS 40 is different from SSAP 19 and it provides an accounting
policy choice (i.e. fair value or cost model). Therefore, there were strong incentives for
the early adopters, who could significantly enhance their profit and/or net assets through
the early adoption of IFRS. This impact could be greater for property companies than
companies in other sectors.
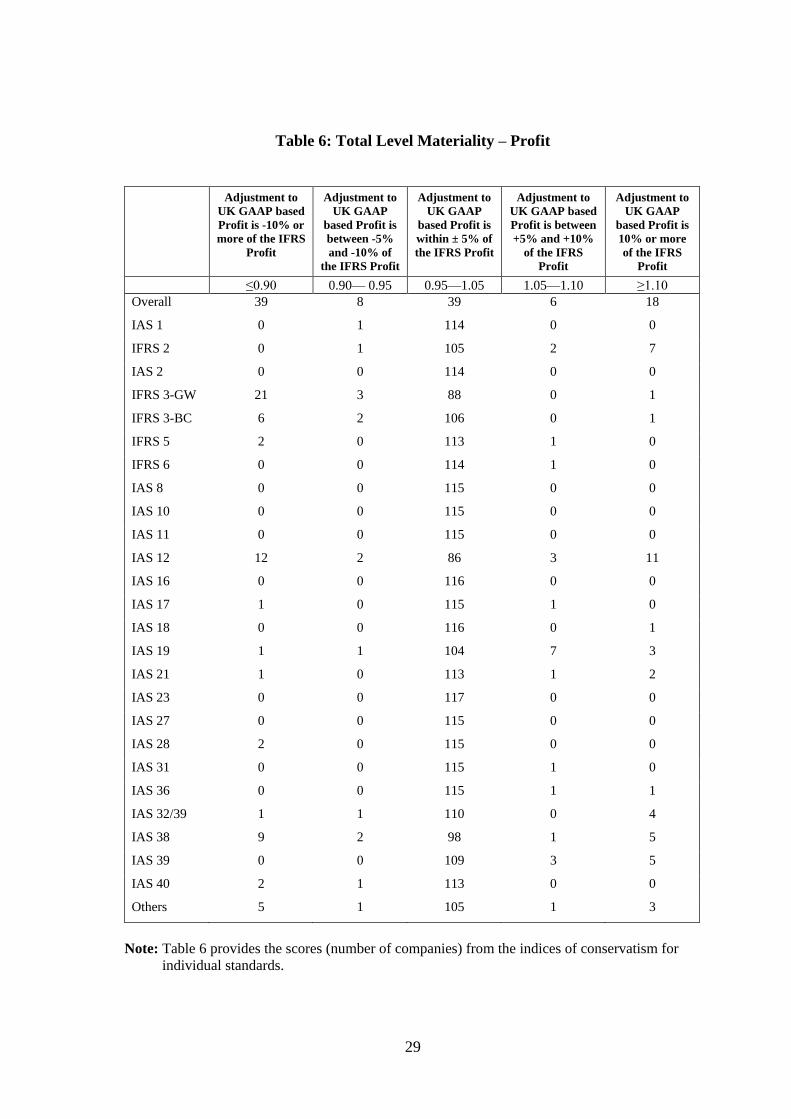
Table 6 provides further split of the index values at the individual standard’s level. It
confirms the results that, in most of the cases, the adjustments fall either in the grey area
or no adjustment (no effect) to the figures reported under UK GAAP and the impact can
generally be associated with a few companies and/or to particular standards. The results
in Table 6 reveal that IAS 40 has affected only a few companies which can be associated
with the size effect. The results also show that most of the IFRS have led to positive
adjustments to UK GAAP figures, which in turn, on average, has increased the IFRS
based profit figures. Our analysis thus shows that profits reported under UK GAAP are
only 85.6 percent of the figures calculated under IFRS.
29
Table 6: Total Level Materiality – Profit
Adjustment to
UK GAAP based
Profit is -10% or
more of the IFRS
Profit
Adjustment to
UK GAAP
based Profit is
between -5%
and -10% of
the IFRS Profit
Adjustment to
UK GAAP
based Profit is
within ± 5% of
the IFRS Profit
Adjustment to
UK GAAP based
Profit is between
+5% and +10%
of the IFRS
Profit
Adjustment to
UK GAAP
based Profit is
10% or more
of the IFRS
Profit
≤0.90 0.90— 0.95 0.95—1.05 1.05—1.10 ≥1.10
Overall 39 8 39 6 18
IAS 1 0 1 114 0 0
IFRS 2 0 1 105 2 7
IAS 2 0 0 114 0 0
IFRS 3-GW 21 3 88 0 1
IFRS 3-BC 6 2 106 0 1
IFRS 5 2 0 113 1 0
IFRS 6 0 0 114 1 0
IAS 8 0 0 115 0 0
IAS 10 0 0 115 0 0
IAS 11 0 0 115 0 0
IAS 12 12 2 86 3 11
IAS 16 0 0 116 0 0
IAS 17 1 0 115 1 0
IAS 18 0 0 116 0 1
IAS 19 1 1 104 7 3
IAS 21 1 0 113 1 2
IAS 23 0 0 117 0 0
IAS 27 0 0 115 0 0
IAS 28 2 0 115 0 0
IAS 31 0 0 115 1 0
IAS 36 0 0 115 1 1
IAS 32/39 1 1 110 0 4
IAS 38 9 2 98 1 5
IAS 39 0 0 109 3 5
IAS 40 2 1 113 0 0
Others 5 1 105 1 3
Note: Table 6 provides the scores (number of companies) from the indices of conservatism for
individual standards.
30
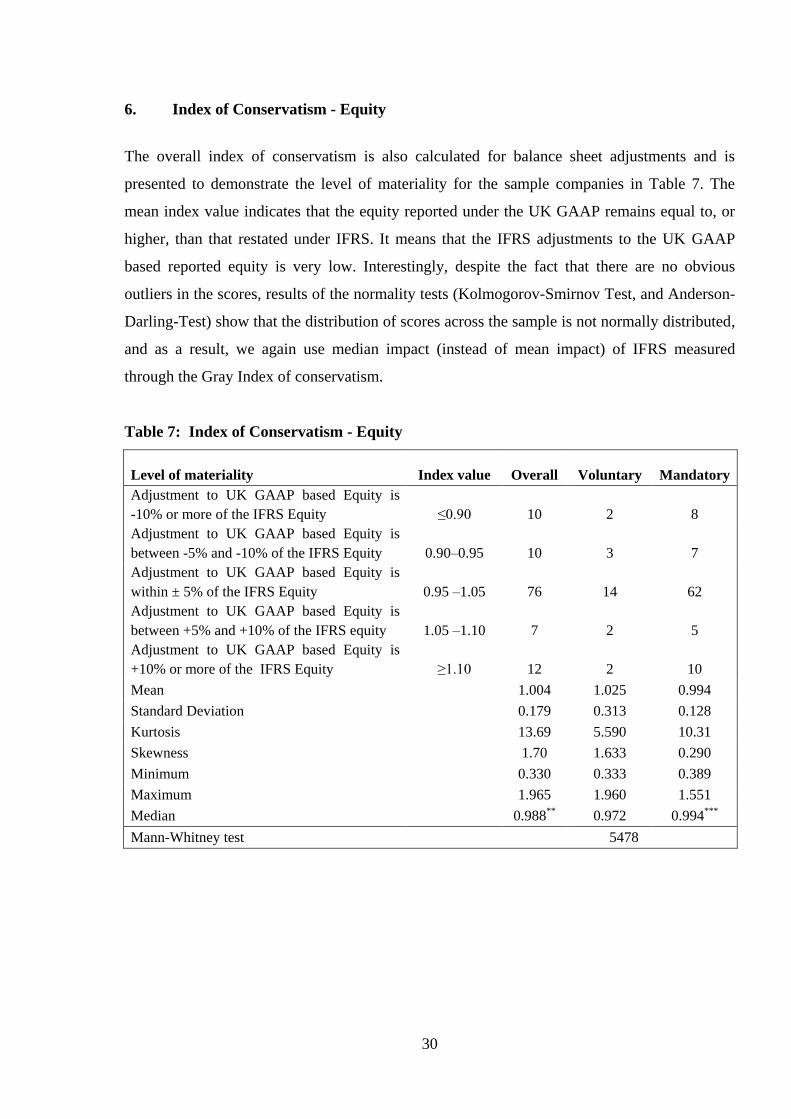
6. Index of Conservatism - Equity
The overall index of conservatism is also calculated for balance sheet adjustments and is
presented to demonstrate the level of materiality for the sample companies in Table 7. The
mean index value indicates that the equity reported under the UK GAAP remains equal to, or
higher, than that restated under IFRS. It means that the IFRS adjustments to the UK GAAP
based reported equity is very low. Interestingly, despite the fact that there are no obvious
outliers in the scores, results of the normality tests (Kolmogorov-Smirnov Test, and Anderson-
Darling-Test) show that the distribution of scores across the sample is not normally distributed,
and as a result, we again use median impact (instead of mean impact) of IFRS measured
through the Gray Index of conservatism.
Table 7: Index of Conservatism - Equity
Level of materiality Index value Overall Voluntary Mandatory
Adjustment to UK GAAP based Equity is
-10% or more of the IFRS Equity ≤0.90 10 2 8
Adjustment to UK GAAP based Equity is
between -5% and -10% of the IFRS Equity 0.90–0.95 10 3 7
Adjustment to UK GAAP based Equity is
within ± 5% of the IFRS Equity 0.95 –1.05 76 14 62
Adjustment to UK GAAP based Equity is
between +5% and +10% of the IFRS equity 1.05 –1.10 7 2 5
Adjustment to UK GAAP based Equity is
+10% or more of the IFRS Equity ≥1.10 12 2 10
Mean 1.004 1.025 0.994
Standard Deviation 0.179 0.313 0.128
Kurtosis 13.69 5.590 10.31
Skewness 1.70 1.633 0.290
Minimum 0.330 0.333 0.389
Maximum 1.965 1.960 1.551
Median 0.988** 0.972 0.994***
Mann-Whitney test 5478
31
One sample t-test for the median is therefore used to determine whether median index values
are statistically different, and not equal to the neutral value of one. The results along with the
band of materiality are shown for the full sample in Table 7. It depicts that 10 companies
experienced material positive adjustments and 12 companies experienced material negative
adjustments on their transition to IFRS. However, as adjustment to UK GAAP based equity for
the majority of sample companies is within ±5% of the IFRS Equity, the net effect of change to
IFRS is relatively smaller. The relationship is further explained by one sample t-test for the
median index value of 0.988, which is significant at the 5 percent level. This could mean that
on average more positive adjustments have been made to the equity of sample companies. In
contrast, previous studies which are based on main market listed companies have reported large
negative adjustments to reported equity following the transition to IFRS (e.g., Aisbitt, 2006;
Ormrod and Taylor, 2006; Stenka et al., 2008; Horton and Serafeim, 2009). However, the
overall impact of IFRS on UK GAAP based equity is still very small and can be regarded as
negligible.
Only two companies among the voluntary adopters are showing a material positive impact and
another two companies are showing a material negative impact on equity. In case of mandatory
adopters, more companies are showing negative adjustments to equity on their transition to
IFRS, suggesting that UK-GAAP based equity is greater than that reported under IFRS. The
median index value is shown as 0.994, which suggests that most of the companies have been
positively affected by the adoption of IFRS. In addition, the Mann-Whitney test results show
that both voluntary and mandatory adopters experience similar effects and are not statistically
different from each other. However, the standard deviations for the full sample and sub-
samples also show that the overall impact of IFRS on equity of the sample companies is very
small (only 1 percent). This again re-confirms the evidence reported earlier, suggesting little
effect of the IFRS adoption on equity of the sample companies.
6.1 Partial Index - Equity
Again partial indices of comparability are used for calculating the index values for each
individual IFRS, in particular, for those standards which contribute to the differences in
reported equity. Table 8 reports the impact of individual standards on equity based on a partial
index of conservatism. In order to show the impact of individual standards on the equity of our
sample companies we show both the mean and median index values and their one sample t test
and significance level in Table 8. The mean index value for most of the standards is close to 1

32
percent, which suggests that the impact of individual standards on reported equity is minimal.
Table 8 shows that IFRS 2, IFRS 3, IAS 16, IAS 32, IAS 39, and IAS 40 have no or a very
small transitory impact on the UK GAAP based equity of the sample companies. However,
IFRS 2, IFRS 3 (Goodwill), IAS 12, and IAS 38, have resulted in around 1% positive
adjustment, whereas, IAS 19, and IAS 32/39 have resulted in around 1% negative adjustment
to UK GAAP based equity figure.
The median index values for IFRS 2, IFRS 3, IAS 17, IAS 19 and IAS 38 are statistically
significant. This again suggests the differences in equity value resulted from the application of
the two accounting systems. The potential reasons for the differences have already been
discussed in previous sections; however, the impact of IAS 17 (Leases) on UK GAAP based
equity is worth noting, which could be due to the separate treatment of land and building.
Under the UK GAAP SSAP 21 takes land and building jointly, however, IAS 17 treats these
two separately, requiring each to be independently determined as operating or finance lease.
This could mean that land would be recognised as operating lease, while buildings can be
recognised as operating or financial lease. In addition, results of the Mann-Whitney test
suggest that both voluntary and mandatory adopters as two separate samples have experienced
similar impact on UK GAAP based equity from the application of individual IFRS. The only
difference between the results of two groups is the impact of IFRS 2 which suggests that the
change in regulation on share based payments has differently affected the voluntary and
mandatory adopters.
Table 8: Partial Indices - Equity
N Mean St. Dev SE Mean P-Value Median P-Value Mann-Whitney
Test
Overall 115 0.9812 0.2442 0.0228 0.41 0.9883 0.02 1192.0
IFRS 2 115 0.9981 0.0065 0.0006 0.08 1.000 0.01 1149.0**
IFRS 3 GW 115 0.9891 0.0713 0.0067 0.08 1.000 0.00 1232.0
IFRS 3 BC 115 0.9952 0.0476 0.0044 0.29 1.000 0.68 1257.0
IAS 12 115 0.9940 0.1753 0.0070 0.29 1.000 0.88 1320.0
IAS 16 115 0.9989 0.0111 0.0010 0.30 1.000 0.63 1322.5
IAS 17 115 1.0013 0.0088 0.0008 0.10 1.000 0.02 1295.0
IAS 19 115 1.0176 0.1197 0.0107 0.18 1.000 0.00 1440.0
IAS 32/39 115 1.0084 0.0816 0.0019 0.28 1.000 0.39 1175.5
IAS 38 115 0.9846 0.0873 0.0007 0.48 1.000 0.00 1347.0
IAS 39 FI 115 1.0005 0.0072 0.0002 0.61 1.000 0.80 1409.0
IAS 39 HG 115 0.9998 0.0026 0.0000 0.32 1.000 0.69 1357.0
IAS 40 115 1.0002 0.0003 0.0006 0.08 1.000 1.00 ×××
**, indicates significance at 5% level; ×××, indicates that all values in the column are identical
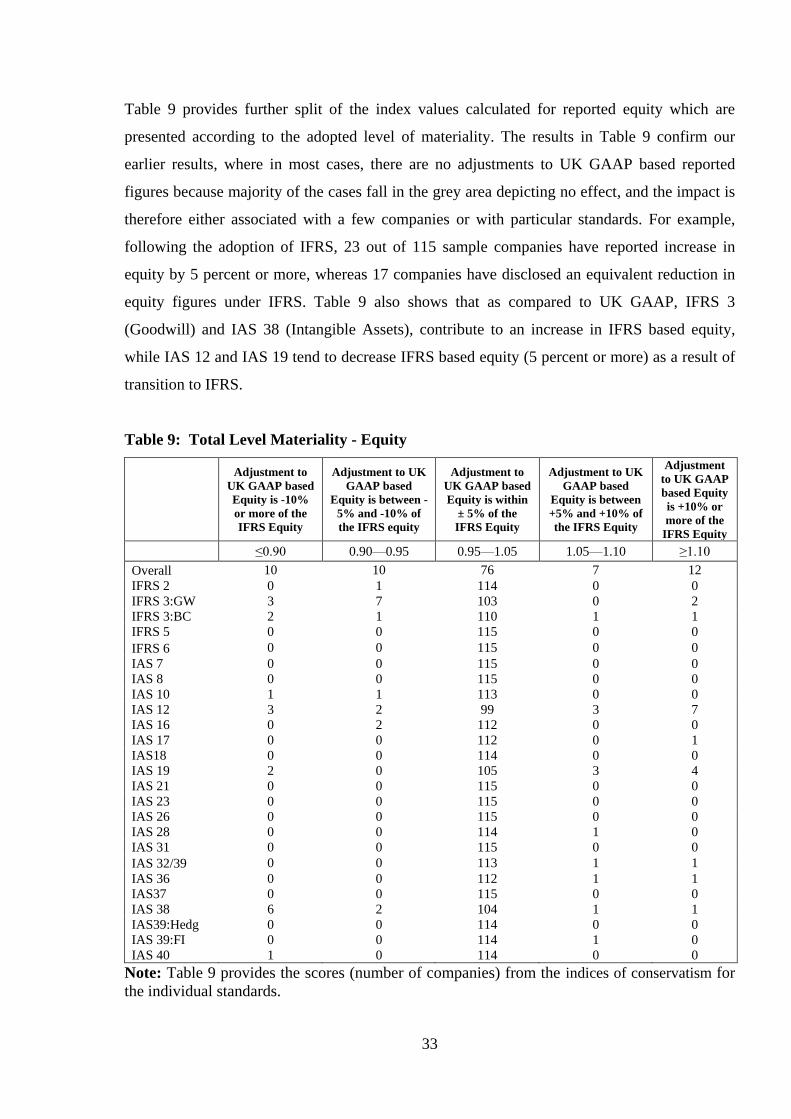
33
Table 9 provides further split of the index values calculated for reported equity which are
presented according to the adopted level of materiality. The results in Table 9 confirm our
earlier results, where in most cases, there are no adjustments to UK GAAP based reported
figures because majority of the cases fall in the grey area depicting no effect, and the impact is
therefore either associated with a few companies or with particular standards. For example,
following the adoption of IFRS, 23 out of 115 sample companies have reported increase in
equity by 5 percent or more, whereas 17 companies have disclosed an equivalent reduction in
equity figures under IFRS. Table 9 also shows that as compared to UK GAAP, IFRS 3
(Goodwill) and IAS 38 (Intangible Assets), contribute to an increase in IFRS based equity,
while IAS 12 and IAS 19 tend to decrease IFRS based equity (5 percent or more) as a result of
transition to IFRS.
Table 9: Total Level Materiality - Equity
Adjustment to
UK GAAP based
Equity is -10%
or more of the
IFRS Equity
Adjustment to UK
GAAP based
Equity is between -
5% and -10% of
the IFRS equity
Adjustment to
UK GAAP based
Equity is within
± 5% of the
IFRS Equity
Adjustment to UK
GAAP based
Equity is between
+5% and +10% of
the IFRS Equity
Adjustment
to UK GAAP
based Equity
is +10% or
more of the
IFRS Equity
≤0.90 0.90—0.95 0.95—1.05 1.05—1.10 ≥1.10
Overall 10 10 76 7 12
IFRS 2 0 1 114 0 0
IFRS 3:GW 3 7 103 0 2
IFRS 3:BC 2 1 110 1 1
IFRS 5 0 0 115 0 0
IFRS 6 0 0 115 0 0
IAS 7 0 0 115 0 0
IAS 8 0 0 115 0 0
IAS 10 1 1 113 0 0
IAS 12 3 2 99 3 7
IAS 16 0 2 112 0 0
IAS 17 0 0 112 0 1
IAS18 0 0 114 0 0
IAS 19 2 0 105 3 4
IAS 21 0 0 115 0 0
IAS 23 0 0 115 0 0
IAS 26 0 0 115 0 0
IAS 28 0 0 114 1 0
IAS 31 0 0 115 0 0
IAS 32/39 0 0 113 1 1
IAS 36 0 0 112 1 1
IAS37 0 0 115 0 0
IAS 38 6 2 104 1 1
IAS39:Hedg 0 0 114 0 0
IAS 39:FI 0 0 114 1 0
IAS 40 1 0 114 0 0
Note: Table 9 provides the scores (number of companies) from the indices of conservatism for
the individual standards.

34
7. Conclusion
This study takes advantage of the IFRS adoption by AIM listed companies and investigates
accounting policy implementation and choice across a broad spectrum. An additional unique
opportunity is the consistency and quality of IFRS 1 disclosures which provides measurement of
the impact of change, for an entire range of accounting standards at a common point in time.
Under the requirements of IFRS 1, firms were required to disclose their audited profit and equity
under both the new and old accounting regulations. We examine percentage adjustments to the
profit and equity of our sample companies following the IFRS adoption and explore the impact of
changes arising from the application of individual standards through the application of Gray
(1980) index of comparability. This study thus investigates adjustments of IFRS to UK GAAP
based figures required under the IFRS 1 reconciliation statement, and discusses the effects on the
profit and equity of the sample companies.
The results demonstrate that the overall impact of IFRS on the profit of AIM listed companies is
about 6.66 percent which is much smaller than the impact shown in prior literature on large listed
companies. The increase in total profit of AIM companies is mainly associated with IFRS 3, IAS
28, IAS 38 and other multiple standards. The positive adjustment to profit through the application
of IFRS 3, IAS 28, and IAS 38, is however, largely matched by the negative adjustments by IAS
12, IAS 32/39, and IFRS 2. As a result, the overall impact of the adoption of IFRS on the profit
of AIM listed companies disclosed under the requirements of IFRS 1 is comparatively smaller in
magnitude. However, the impact of some individual standards on the profit of AIM companies is
more than others. As a consequence, where there are significant effects on the profit due to
individual IFRSs, we offer probable explanations and the consequences of the change in
accounting regulation for small and growing companies.
An examination of the impact of IFRS adoption on the equity of sample companies suggests that
IFRS adoption has resulted in a smaller effect on the reported UK GAAP equity. This evidence is
consistent with prior literature on large listed companies. The standards that have the largest
negative effects on UK GAAP based equity are; IAS 32, IAS 39, IAS 19, and IAS 12. In contrast,
IFRS 3, IAS 10 and IAS 38 have resulted in a positive impact on equity of the sample companies.
However, the overall impact of IFRS on UK GAAP based reported equity is less than two percent
which is insignificantly negative and small. These results were re-confirmed through the
application of Gray Index of conservatism, the outcome of which shows the impact of IFRS on

35
UK GAAP based equity of the sample companies as statistically insignificant and small. We also
investigate the positive and negative effects of some of the individual standards on equity figures
of AIM companies and argue that this has implications for stakeholders and would need attention
in future research.
Further, we examine the index results at the sub-sample level by splitting the sample into
voluntary and mandatory adopters of IFRS. The results show that voluntary adopters experience a
positive and material adjustment to reported profits compared to mandatory adopters. This
indicates that voluntary adopters may have adopted IFRS earlier to enhance their profit for some
predetermined objectives rather than for compliance purposes. This is consistent with the findings
of prior research (e.g., Dumontier and Raffournier, 1998; El-Gazzar et al., 1999; Ball et al., 2000;
Street and Gray, 2002; Ball et al., 2003; Tarca, 2004; Gassen and Sellhorn, 2006; Jones and
Higgins, 2006). These findings have implications for accounting regulators, particularly in
circumstances, where a choice for voluntary adoption is given before the enforced implementation
of a new accounting system.
We argue that, in line with the anticipated objectives of companies in relation to the adoption of
IFRS, the differences between UK GAAP and IFRS for voluntary and mandatory adopters could
be due to the following reasons. First, companies might have adopted IFRS earlier because the
resulting profit/equity figures were more favourable to them under IFRS than UK GAAP. Second,
early adopters reported differences in IFRS based figures with UK GAAP, before the mandatory
change in rules which may help those firms in a smooth convergence to IFRS. Accordingly, at the
time of adoption, AIM listed early adopters, even if selected randomly, would have reported
larger differences between UK GAAP and IFRS based figures. This is because at this point in
time the degree of convergence was less than that of the mandatory adoption in 2007-2008. This
suggests that the real nature and effects of changes in accounting systems should be fully explored
before implementing mandatory changes in accounting systems.
The findings of this research can thus be related to the assumptions of positive accounting theory
which suggest, that managers of firms would adopt certain accounting methods for self-interest
(Watts and Zimmerman, 1978). In line with this prediction, the reconciliation statement analysis
indicates that voluntary adopters have shown positive adjustments to their reported income
suggesting that managers of the sample companies adopted IFRS voluntarily for some
preconceived objectives. Furthermore, the results of higher profits with the transition to IFRS can

36
also be interpreted in line with the management compensation hypothesis of positive accounting
theory, where managers adopt income increasing accounting policies. It can thus be concluded
that voluntary adopters could have opportunistically used International Accounting Standards for
self-interest. This paper therefore suggests that before the implementation of a new accounting
regulation, the implications and pros and cons of voluntary adoption time should be considered by
the regulators otherwise the anticipated objectives of the new regulation may not be achieved
during the voluntary adoption period. The findings of this paper also have implications for
managers, shareholders, debtholders and other stakeholders which may be different across
countries and cultures.
The evidence from this paper could inform regulators in different jurisdictions which have not yet
adopted IFRS, such as the US, Japan, and Columbia etc., but have announced their intention to
adopt IFRS. In addition, many other countries are now either intending to fully adopt IFRS as
their financial reporting system for listed companies or considering IFRS for small and growing
companies in the near future. Our findings may be relevant and useful for the regulatory
authorities of all those countries which have already adopted IFRS on partial or voluntary basis,
and intend to make IFRS mandatory in future years. Perhaps most significantly, this study can
inform companies and policy makers of the consequences of IFRS adoption in those countries
which have already introduced IFRS for larger companies, but intend to expand its application
more widely to smaller companies, either on a compulsory or voluntary basis. We argue that due
to cultural, political, economic, institutional, and several other differences across countries, there
are barriers to the process of accounting harmonization worldwide which need the attention of
international scholars in future research.
37
References
Adams, C.A., Weetman, P. & Gray, S.J., (1993). Reconciling national with international accounting
standards. European Accounting Review, 2, 471-494.
Adams, C.A., Weetman, P., Jones, E.a.E. & Gray, S.J., (1999). Reducing the burden of US GAAP
reconciliations by foreign companies listed in the United States: the key question of materiality.
European Accounting Review, 8, 1 - 22.
Aisbitt, S., (2006). Assessing the Effect of the Transition to IFRS on Equity: The Case of the FTSE 100.
Accounting in Europe, 3, 117 - 133.
Baboukardosa, D., & Rimmela, G., (2014). Goodwill under IFRS: Relevance and disclosures in
anunfavorable environment. Accounting Forum, 38, 1-17.
Ball, R., Kothari, S. & Robin, A., (2000). The effect of international institutional factors on properties of
accounting earnings. Journal of Accounting and Economics, 29, 1-51.
Ball, R., Robin, A. & Wu, J.S., (2003). Incentives versus standards: properties of accounting income in
four East Asian countries. Journal of Accounting and Economics, 36, 235-270.
Barth, M.E., Landsman, W.R. & Lang, M.H., (2008). International Accounting Standards and Accounting
Quality. Journal of Accounting Research, 46, 467-498.
Beckman, J., Brandes, C. & Eierle, B., (2007). German Reporting Practices: An Analysis of
Reconciliations from German Commercial Code to IFRS or US GAAP. Advances in International
Accounting, 20, 253-294.
Bonham, M., Crisp, R., Curtis, M. & Dekker, P., (2009). International GAAP, Chichester John Wiley and
Sons.
Brown, P., & Tarca, A., (2005). A commentary on issues relating to the enforcement of International
Financial Reporting Standards in the EU. European Accounting Review, 14(1), 181-212.
Chand, P., Cummings, L., & Patel, C., (2012). The Effect of Accounting Education and National Culture
on Accounting Judgments: A Comparative Study of Anglo-Celtic and Chinese Culture. European
Accounting Review, 21(1), 153-182.
Chesley, G. R., (1986). Interpretation of uncertainty expressions. Contemporary Accounting Research, 2,
179-199.
Christensen, H.B., Lee, E. & Walker, M., (2007). Cross-sectional variation in the economic consequences
of international accounting harmonization: The case of mandatory IFRS adoption in the UK. The
International Journal of Accounting, 42, 341-379.
Christensen, H.B., Lee, E. & Walker, M., (2009). Do IFRS Reconciliations Convey Information? The
Effect of Debt Contracting. Journal of Accounting Research, 47(5), 1167-1199.
Cooke, T.E., (1993). The Impact of Accounting Principles on Profits: The US versus Japan. Accounting &
Business Research, 23, 460-476.
Cordazzo, M., (2008). The impact of IAS/IFRS on accounting practices: evidences from Italian listed
companies. . School of Economics and Management, University of Bozen-Bolzano.
Daske, H., & Gebhardt, G., (2006). International financial reporting standards and experts' perceptionsof
disclosure quality. Abacus, 42(3-4), 461-498.
Daske, H., Hail, L., Leuz, C., & Verdi, R.S. (2008). Mandatory IFRS Reporting around the World: Early
Evidence on the Economic Consequences. Journal of Accounting Research, 46 (5), 1085-1142.
Doupnik, T. S., & Richter, M., (2003). Interpretation of uncertainty expressions: A cross-national study.
Accounting, Organizations and Society, 28, 15-35.

38
Doupnik, T. S., & Riccio, E. L., (2006). The influence of conservatism and secrecy on the interpret¬ation
of verbal probability expressions in the Anglo and Latin cultural areas. The International Journal of
Accounting, 41, 237-261.
Dumontier, P. & Raffournier, B., (1998). Why Firms Comply Voluntarily with IAS: An Empirical
Analysis with Swiss Data. Journal of International Financial Management and Accounting. 9(3), 216-
245.
Dunne, T., Fifield, S., Finningham, G., Fox, A., Hannah, G., Helliar, C., Power, D. & Veneziani, M.,
(2008). The Implementation of IFRS in the UK ,Italy & Irland. Institute of Chartered Accountants of
Scotland.
EC, (2002). Regulation (EC) No. 1606/2002 of the European Parliament and of the Council of 19 July
2002 on the application of international accounting standards. Official Journal of the European
Communities, 1-4.
El-Gazzar, S.M., Finn, P.M. & Jacob, R., (1999). An empirical investigation of multinational firms'
compliance with International Accounting Standards. The International Journal of Accounting, 34, 239-
248.
Ernst & Young, (2006). Observations on the Implementation of IFRS. London.
Fifield, S., Finningham, G., Fox, A., Power, D. and Veneziani, M., (2011). A cross-country analysis of
IFRS reconciliation statements. Journal of Applied Accounting Research, 12 (1), 26-42.
Gassen, J. & Sellhorn, T., 2006. Applying IFRS in Germany: Determinants and Consequences. Available
at: www.ssrn.com.
Ghioa, A., & Roberto Verona, R., (2015). Accounting harmonization in the BRIC countries: A common
path?, Accounting Forum, 39, 121-139.
Gray, S.J., (1980). The Impact of International Accounting Differences from a Security-Analysis
Perspective: Some European Evidence. Journal of Accounting Research, 18 (1), 64-76.Gray, S.J.
(1988). Towards a Theory of Cultural Influence on the Development of Accounting Systems
Internationally, Abacus, 24, 1-15.
Hofstede, G. H., (1980). Culture’s consequences: International differences in work-related values.
Beverly Hills, CA: Sage.
Gray, S.J., Linthicum, C.L. & Street, D.L., (2009). Have 'European' and US GAAP measures of income
and equity converged under IFRS? Evidence from European companies listed in the US. Accounting &
Business Research, 39, 431-447.
Haller, A., Ernstberger, J. & Froschhammer, M., (2009). Implications of the mandatory transition from
national GAAP to IFRS - Empirical evidence from Germany. Advances in Accounting, 25(2). 226-236.
Haverty, J.L., (2006). Are IFRS and U.S. GAAP converging?: Some evidence from People's Republic of
China companies listed on the New York Stock Exchange. Journal of International Accounting,
Auditing and Taxation, 15, 48-71.
Hellman, N., (1993). A comparative analysis of the impact of accounting differences on profits and return
on equity-Differences between Swedish practice and US GAAP. European Accounting Review, 2, 495-
530.
Horton, J. & Serafeim, G., (2009). Market reaction to and valuation of IFRS reconciliation adjustments:
first evidence from the UK. Review of Accounting Studies, 15, 725–751.
Hung, M. & Subramanyam, K., (2007). Financial statement effects of adopting international accounting
standards: the case of Germany. Review of Accounting Studies, 12, 623-657.
IASplus, (2011). Insight through Conversation with Sir David Tweedie, Outgoing IASB Chairman.

39
Jermakowtcz, E.K., (2004). Effects of Adoption of International Financial Reporting Standards in
Belgium: The Evidence from BEL-20 Companies. Accounting in Europe, 1, 51-70.
Jones, S. & Higgins, A.D., (2006). Australia's switch to international financial reporting standards: a
perspective from account preparers. Accounting and Finance, 46, 629-652.
Leuz, C., (2010). Different approaches to corporate reporting regulation: How jurisdictions differ and
why. Accounting and Business Research, 40(3), 229-256.
LSE (2015). A Guide to the Alternative Investment Market. Published by White Page Ltd. and London
Stock Exchange, London, United Kingdom.
Lopes, P.T. & Viana, R.C., (2008). The transition to IFRS: Disclosures by Portuguese listed companies.
Working Paper No 285, University of Porto.
Nobes, C.W., & Parker, R., (2012). Comparative International Accounting. Harlow: Pearson Education
Limited.
Norton, J., (1995). The Impact of Financial Accounting Practices on the Measurement of Profit and
Equity: Australia Versus the United States. Abacus, 31, 178-200.
Ormrod, P. and Taylor, P., (2004). The Impact of the Change to International Accounting Standards on
Debt Covenants: A UK Perspective. Accounting in Europe, 1, 71-94.
Ormrod, P. & Taylor, P., (2006). Surprise surprise. Accountancy, 138, 82-83.
Pallant, J., (2007). SPSS Survival Manual: A Step by Step Guide to Data Analysis. Maidenhead:
OpenUniversity Press.
PriceWaterhouseCoopers, (2005). IFRS/UK main differences indicator. The Accounting Technical
Department of PricewaterhouseCoopers,Chartered Accountants: PricewaterhouseCoopers.
PriceWaterhouseCoopers, (2010). A comparison of UK GAAP, IFRS for SMEs and IFRS. London:
PricewaterhouseCoopers.
Radebaugh, L., & Gray, S., (2002). International Accounting and Multinational Enterprises. New York:
John Wiley.
Roberts, C.B., Weetman, P. & Gordon, P., (2005). International financial reporting: a comparative
approach: Prentice Hall-Financial Times, London.
Schadewitz, H. & Vieru, M., (2008). Impact of IFRS transition complexity on audit and non-audit fee:
Evidence from small and medium-sized listed companies in Finland. Available at:
http://ssrn.com/abstract=967314.
Stenka, R. & Ormrod, P., (2007). The Impact of IFRS Adoption in the UK – Issues in Group Accounting.
Proceedings of the European Accountng Association Annual Conference, Lisbon, Portugal.
Stenka, R., Ormrod, P. & Chan, A., (2008). Accounting for Business Combinations - The Consequences
of IFRS Adoption for UK Listed Companies. Available at: www.ssrn.com.
Stent, W., Bradbury, M. & Hooks, J., (2010). IFRS in New Zealand: Effects on financial statements and
ratios. Pacific Accounting Review, 22, 92-107.
Street, D.L. & Gray, S.J., (2002). Factors influencing the extent of corporate compliance with
International Accounting Standards: summary of a research monograph. Journal of International
Accounting, Auditing and Taxation, 11, 51-76.
Tarca, A., (2004). International Convergence of Accounting Practices: Choosing between IAS and US
GAAP. Journal of International Financial Management & Accounting, 15, 60-91.
Tendeloo, B. V., & Vanstraelen, A., (2005). Earnings management underf German GAPP versus IFRS.
European Accouting Review, 14(1), 155-180.
40
Tsalavoutas, I. & Evans, L., (2010). Transition to IFRS in Greece: Financial statement effects and auditor
size. Managerial Auditing Journal, 25, 814-842.
Tsalavoutas, I., Andre, P., & Evans, L., (2012). The transition to IFRS and the value relevance of financial
statements in Greece. British Accounting Review, 44(4), 262-277.
Watts, R.L. & Zimmerman, J.L., (1978). Towards a positive theory of the determination of accounting
standards. The Accounting Review, 53, 112-134.
Weetman, P. & Gray, S.J., (1991). A Comparative International Analysis of the Impact of Accounting
Principles on Profits: The USA versus the UK, Sweden and The Netherlands. Accounting & Business
Research, 21, 363-379.
Weetman, P., Jones, E.A.E., Adams, C.A. and Gray, S.J., (1998). Profit Measurement and UK Accounting
Standards: A Case of Increasing Disharmony in Relation to US GAAP and IASs. Accounting &
Business Research, 28(3),189-208.