Impact of Inflation on Financial Ratios
21
IMPACT OF INFLATION ON FINANCIAL RATIOS: An Empirical study on Manufacturing Firms in India Bhagaban Das 1 Pramod K Patjoshi 2 Abstract This paper investigates the impact of inflation accounting on key financial ratios by analyzing the financial statements of 42 Indian manufacturing companies covering 7 industrial sectors. To study the impact of inflation on major financial ratios, to two sets of ratios are formed basing upon two methods of accounting: historical cost based method and current purchasing power method. Different statistical tools like; descriptive statistics and t- test have been conducted on the financial ratios of the companies. The results show that a significant difference between adjusted cost based financial ratios and historical cost based financial ratios occurs only for current, ratios, equity ratios and noncurrent turnover ratios. Keywords: Inflation, Financial Ratios, Historical Cost Based Method and Current Purchasing Power Method 1 Professor & Head, Department of Business Management, Fakir Mohan University, Balasore, he can be reached at:b[email protected] 2 Asst. Professor, Department of Management Studies, Regional College of Management Autonomous, Bhubaneswar, he can be reached at [email protected]
-
Upload
bhagaban-das -
Category
Documents
-
view
180 -
download
0
Transcript of Impact of Inflation on Financial Ratios

IMPACT OF INFLATION ON FINANCIAL RATIOS:
An Empirical study on Manufacturing Firms in India
Bhagaban Das1
Pramod K Patjoshi2
Abstract
This paper investigates the impact of inflation accounting on key financial ratios by analyzing the financial statements of 42 Indian manufacturing companies covering 7 industrial sectors. To study the impact of inflation on major financial ratios, to two sets of ratios are formed basing upon two methods of accounting: historical cost based method and current purchasing power method. Different statistical tools like; descriptive statistics and t-test have been conducted on the financial ratios of the companies. The results show that a significant difference between adjusted cost based financial ratios and historical cost based financial ratios occurs only for current, ratios, equity ratios and noncurrent turnover ratios.
Keywords: Inflation, Financial Ratios, Historical Cost Based Method and Current Purchasing Power Method
1 Professor & Head, Department of Business Management, Fakir Mohan University, Balasore, he can be reached at:[email protected]
2 Asst. Professor, Department of Management Studies, Regional College of Management Autonomous, Bhubaneswar, he can be reached at [email protected]

Introduction
The existing accounting practice of preparation of financial statements is based on money
measurement concept. As per this concept, only those business transactions which are
capable of being expressed in terms of money are open for recording by accounting system.
Further, it is also assumed that monetary unit, used for recording the business transactions,
is stable in nature. However, price does not remain constant over a period of time. It tends
to change due to various economical, social, political factors. These changes in the price
level lead to inaccurate presentation of financial statements which otherwise are prepared
to present true and fair view of the company’s financial health.
The Research Problem
In the past few years of high inflation, most of the companies in India have reported
very high profits on the one hand, but have faced real financial obscurity on the other. This
is so due to payment of dividend and taxes out of capital. This overstatement of profits
arrived by adopting the historical cost based accounting have several further effects too.
When this reported profit is used as the basis determining corporate tax liabilities, it leads to
higher tax payments and as result, the Government becomes an important beneficiary.
Furthermore, when this reported profit is used as a basis of corporate decision making, the
companies may not be setting prices sufficiently high to ensure an adequate rate of return
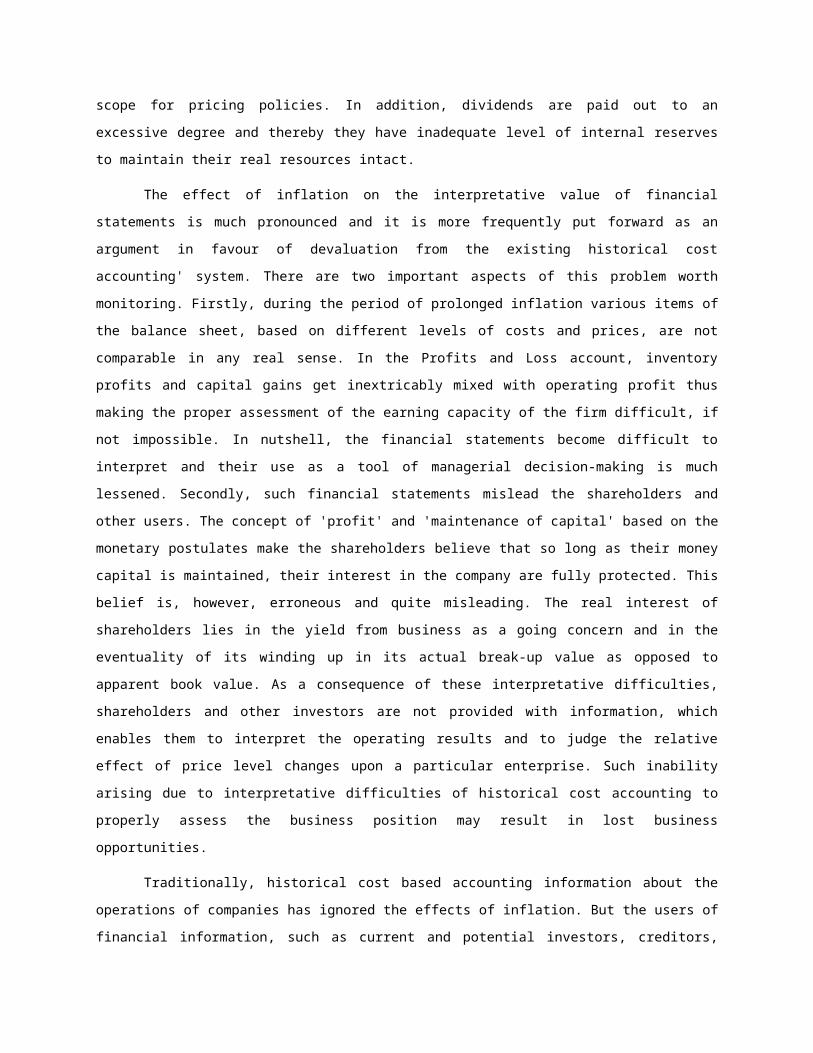
on a long-term basis, if they have some scope for pricing policies. In addition, dividends are
paid out to an excessive degree and thereby they have inadequate level of internal reserves
to maintain their real resources intact.
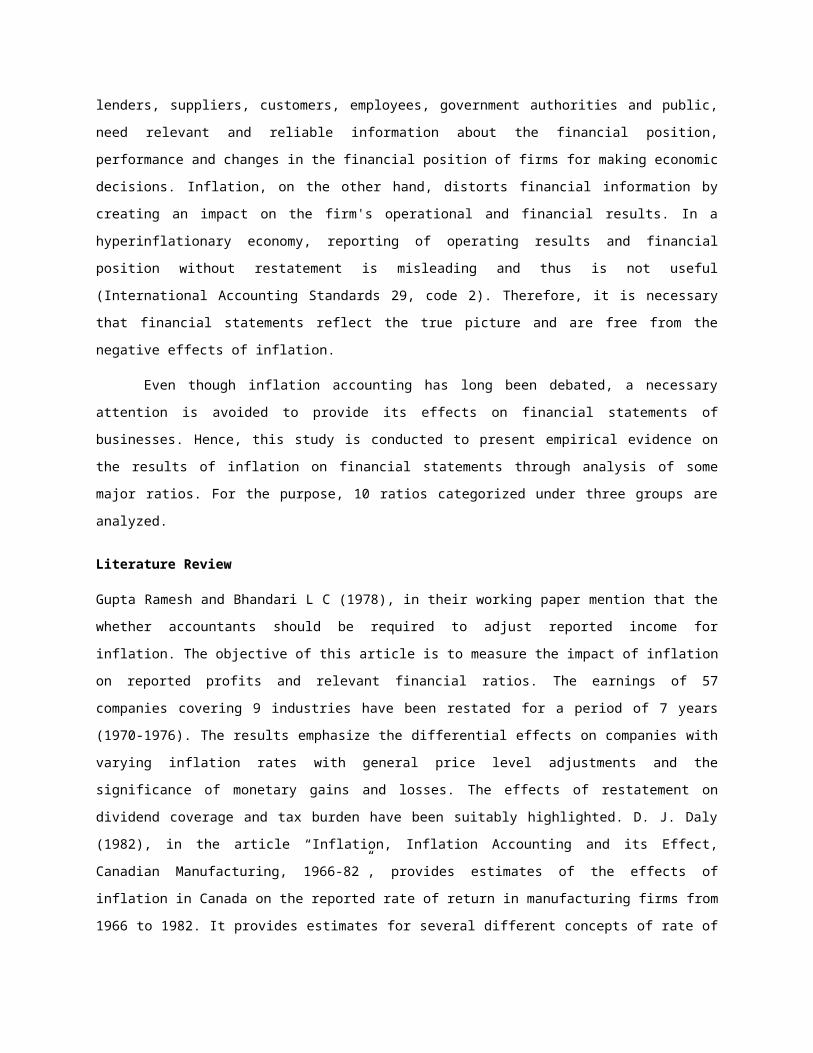
The effect of inflation on the interpretative value of financial statements is much
pronounced and it is more frequently put forward as an argument in favour of devaluation
from the existing historical cost accounting' system. There are two important aspects of this
problem worth monitoring. Firstly, during the period of prolonged inflation various items of
the balance sheet, based on different levels of costs and prices, are not comparable in any
real sense. In the Profits and Loss account, inventory profits and capital gains get
inextricably mixed with operating profit thus making the proper assessment of the earning
capacity of the firm difficult, if not impossible. In nutshell, the financial statements become
difficult to interpret and their use as a tool of managerial decision-making is much lessened.
Secondly, such financial statements mislead the shareholders and other users. The concept
of 'profit' and 'maintenance of capital' based on the monetary postulates make the
shareholders believe that so long as their money capital is maintained, their interest in the
company are fully protected. This belief is, however, erroneous and quite misleading. The
real interest of shareholders lies in the yield from business as a going concern and in the
eventuality of its winding up in its actual break-up value as opposed to apparent book value.
As a consequence of these interpretative difficulties, shareholders and other investors are
not provided with information, which enables them to interpret the operating results and to
judge the relative effect of price level changes upon a particular enterprise. Such inability
arising due to interpretative difficulties of historical cost accounting to properly assess the
business position may result in lost business opportunities.
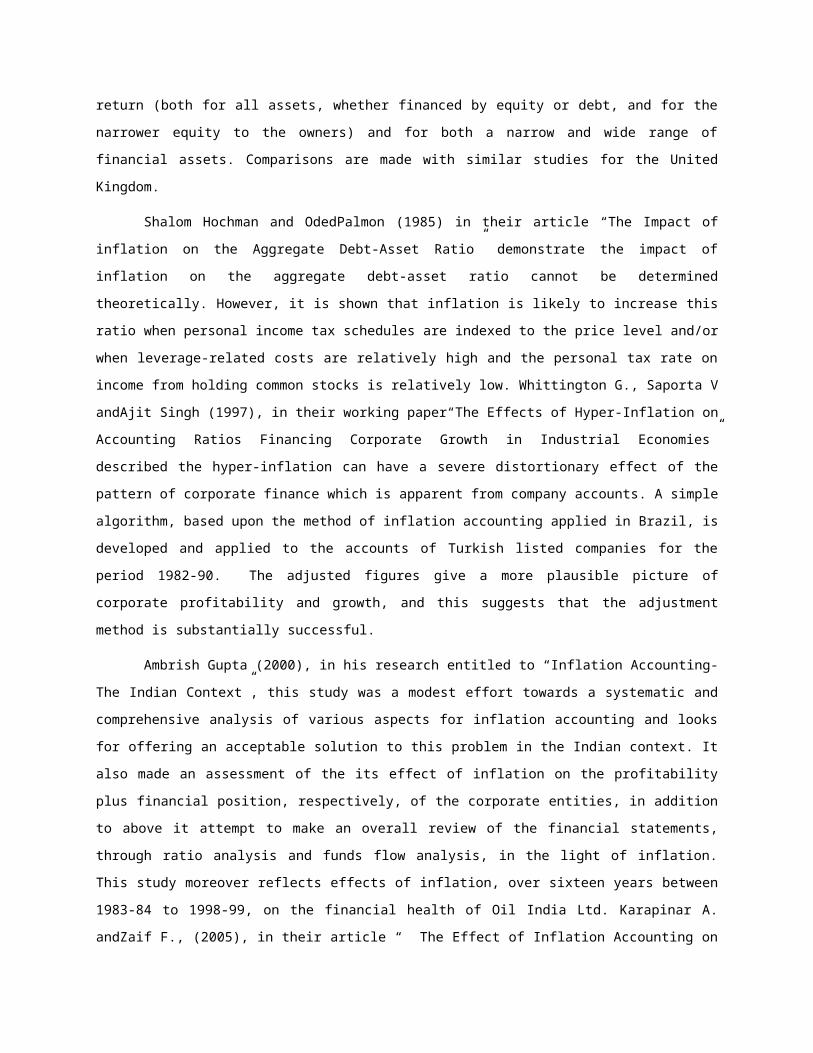
Traditionally, historical cost based accounting information about the operations of
companies has ignored the effects of inflation. But the users of financial information, such as
current and potential investors, creditors, lenders, suppliers, customers, employees,
government authorities and public, need relevant and reliable information about the
financial position, performance and changes in the financial position of firms for making
economic decisions. Inflation, on the other hand, distorts financial information by creating an
impact on the firm's operational and financial results. In a hyperinflationary economy,
reporting of operating results and financial position without restatement is misleading and
thus is not useful (International Accounting Standards 29, code 2). Therefore, it is necessary
that financial statements reflect the true picture and are free from the negative effects of
inflation.
Even though inflation accounting has long been debated, a necessary attention is
avoided to provide its effects on financial statements of businesses. Hence, this study is
conducted to present empirical evidence on the results of inflation on financial statements
through analysis of some major ratios. For the purpose, 10 ratios categorized under three
groups are analyzed.
Literature Review
Gupta Ramesh and Bhandari L C (1978), in their working paper mention that the whether
accountants should be required to adjust reported income for inflation. The objective of this
article is to measure the impact of inflation on reported profits and relevant financial ratios.
The earnings of 57 companies covering 9 industries have been restated for a period of 7
years (1970-1976). The results emphasize the differential effects on companies with varying
inflation rates with general price level adjustments and the significance of monetary gains
and losses. The effects of restatement on dividend coverage and tax burden have been
suitably highlighted. D. J. Daly (1982), in the article “Inflation, Inflation Accounting and its
Effect, Canadian Manufacturing, 1966-82”, provides estimates of the effects of inflation in
Canada on the reported rate of return in manufacturing firms from 1966 to 1982. It provides
estimates for several different concepts of rate of return (both for all assets, whether
financed by equity or debt, and for the narrower equity to the owners) and for both a narrow
and wide range of financial assets. Comparisons are made with similar studies for the United
Kingdom.
Shalom Hochman and OdedPalmon (1985) in their article “The Impact of inflation on
the Aggregate Debt-Asset Ratio” demonstrate the impact of inflation on the aggregate debt-
asset ratio cannot be determined theoretically. However, it is shown that inflation is likely to
increase this ratio when personal income tax schedules are indexed to the price level and/or
when leverage-related costs are relatively high and the personal tax rate on income from
holding common stocks is relatively low. Whittington G., Saporta V andAjit Singh (1997), in
their working paper“The Effects of Hyper-Inflation on Accounting Ratios Financing Corporate
Growth in Industrial Economies” described the hyper-inflation can have a severe
distortionary effect of the pattern of corporate finance which is apparent from company
accounts. A simple algorithm, based upon the method of inflation accounting applied in
Brazil, is developed and applied to the accounts of Turkish listed companies for the period
1982-90. The adjusted figures give a more plausible picture of corporate profitability and
growth, and this suggests that the adjustment method is substantially successful.
Ambrish Gupta (2000), in his research entitled to “Inflation Accounting- The Indian
Context”, this study was a modest effort towards a systematic and comprehensive analysis
of various aspects for inflation accounting and looks for offering an acceptable solution to
this problem in the Indian context. It also made an assessment of the its effect of inflation on
the profitability plus financial position, respectively, of the corporate entities, in addition to
above it attempt to make an overall review of the financial statements, through ratio
analysis and funds flow analysis, in the light of inflation. This study moreover reflects effects
of inflation, over sixteen years between 1983-84 to 1998-99, on the financial health of Oil
India Ltd. Karapinar A. andZaif F., (2005), in their article “ The Effect of Inflation Accounting
on Financial Statement Analysis” In their study, Karapinar and Zaif examined the effects of
inflation on accounting practice of companies’ financial ratios. Their sample covered the 73
non-financial companies listed Istanbul Stock Exchange as of 2003. The ratios were
calculated on both historical and adjusted numbers of financial statements to form two sets
of ratios. Results showed that there was no significant change in liquidity, financial,
profitability and activity ratios except fixed asset turnover ratios. Akdoğan, Aktas and Unal,
in their study in 2009, extended the number of companies in the sample of Karapınar and
Zaif. The results covering 146 companies were consistent with the findings of Karapınar and
Zaif’s study. Their results revealed that a statistically significant change for the whole
sample occurs only on Total Assets Turnover. Other ratios did not show any considerable
difference.
Charles N'cho-Oguee, Daniel L. Blakley, L.William Murray, and Marolee Beaumont
Smith (2011), in their article “Econometric Analysis of Functional Relationship between
Inflation and Growth of Firms in South Africa: Empirical Research Findings” this research is
to investigate the impact inflation and other factors on the growth of business firms
operating in South Africa. Data sets of South African firms’ financial statements over the
period of 1983-1990 were assembled to permit a detailed examination of the impact of
inflation on firm’s financial ratios. It has concluded that firm's debt-to-equity, sales-to-assets,
and profitability ratios are all positively associated with growth and adversely affected by
high inflation; a firm's working capital-to-sales ratio is negatively related to growth and is
positively affected by high inflation; and there is a real, measurable impact of the financial
instabilities associated with apartheid on firm’s growth. Aydın Karapinar, Figen Zaifand
Rıdvan Bayirli (2012), this study investigates the impact of inflation accounting application
on key financial ratios. These studies related to the financial statements of 132 companies
listed in the Istanbul Stock Exchange (ISE) are studied. An analysis of paired samples t test
has been conducted on the financial ratios of the companies. The results showed that a
significant difference between adjusted cost based financial ratios and historical cost based
financial ratios occurs only for current, ratios, equity ratios and noncurrent turnover ratios.
The study offered valuable information as to analyzing companies operating in
hyperinflation economies. In India serious thinking on having to adjust historical cost
accounts to price level change has been rather few and far between.
Objectives of the Study
The objectives of the proposed study are to find the impact of inflation on financial
performance &position through analyzing the major financial ratios. The objectives of the
proposed study are
a) To study the impact of inflation on short term solvency of sample companies through
liquidity ratios.
b) To analysis the impact of inflation on financial performance of sample companies
through profitability ratios.
c) To find out the impact of inflation on efficiency of resources employed by the sample
companies through Activity Ratios.
Hypotheses for the Study
To study the research problems and to attain the research objectives, three hypotheses

have framed. Broadly, we have attempted to test the null hypothesis against the alternative
hypothesis. The null hypothesis and the alternative hypothesis framed for the purpose are:
1. Null Hypothesis (H01): There is no significant difference in between reported and
inflated liquidity ratios.
Alternative Hypothesis (Ha1): There is a significant difference in between reported
and inflated liquidity ratios.
2. Null Hypothesis (H02): There is no significant difference in between reported and
inflated profitability ratios.
Alternative Hypothesis (Ha2): There is a significant difference in between reported
and inflated profitability ratios.
3. Null Hypothesis (H03): There is no significant difference in between reported and
inflated activity ratios.
Alternative Hypothesis (Ha3): There is a significant difference in between reported
and inflated activity ratios.
Data and Methodology
The work conducted is a study of 42 undertakings, selected randomly from manufacturing
sectors operating in India. The companies so selected are capital intensive, where there is a
heavy investment in fixed assets and inventories, profitable and following the same
accounting practices throughout the period of study. These sample companies belong to
different sectors, viz. Auto, Cement, Chemical, Fertilizer, Food, Petroleum and Steel.
The year-end financial statements of sample companies were used for the comparing
the reported and inflated performances. The published annual reports, books, journals, web
pages, etc. of the selected companies form the main sources of information. The data so
collected are analyzed with the help Current Purchasing Power Method (CPP), Financial
Statement Analysis (FSA) and Statistical tools such as; Average, Variance Standard
Deviation, Kurtosis, Skewness, and t-test are employed too to draw meaningful conclusion.
The t-test is used to compare the values of the means from two groups. The two sample of t-
test has been performed because the variances of two groups are assumed to be unequal.
Current Purchasing Power Method
Current Purchasing Power Method of accounting requires the companies to maintain the
financial statements on conventional historical cost basis, but it further requires
presentation of supplementary statements in items of current purchasing power of currency
at the end of the accounting period. In this method the various items of financial
statements, i.e. balance sheet and profit and loss account are adjusted with the help of
recognized general price index. The consumer price index or the wholesale price index

prepared by the Reserve Bank of India can be taken for conversion of historical costs.
However, WPI (All Commodities) is being used in this study,
Conversion Process
For analyzing the impact inflation on financial performance the Historical Cost Based (HCB)
accounting, financial statements for all the years from 2004-05 to 2008-09 were converted
into Accounting for Current Purchasing Power (CPP) financial statements in terms of the
index number prevailing in the month of March 2009. The adjustments for inflation are
based on movements in wholesale price index.
Table No. - 1Wholesale Price Index in India
[2000-09]
Year Average Average as per2004-05
Year End Year End as per2004-05
2000-01 83.19 100.00 84.00 100.00
2001-02 86.18 103.59 85.48 101.76
2002-03 89.12 107.13 90.60 107.86
2003-04 93.98 112.97 94.93 113.01
2004-05 100.07 120.29 100.00 119.05
2005-06 104.50 125.62 105.70 125.83
2006-07 111.40 133.91 112.80 134.29
2007-08 116.60 140.16 121.50 144.64
2008-09 126.00 151.46 123.50 147.02
Source: Handbook of Statistics on Indian Economics: RBI, 2008-09 Sept 15 2009, Office of
Economic Advisor Ministry of Commerce and Industry, Govt of India.
The conversion process is explained hereunder
(a) All items of Profit &Loss Account, except Inventory Cost, Depreciation, Taxation, and
Equity Dividend have been restated with reference to the "average price index of the
year/period" as applicable to the individual year.
(b) Inventory cost has been restated after segregating opening balance of inventories,
purchases of raw materials and closing balance of inventories as follows:
Opening balance of inventories restated in previous year average price index.
Closing inventories and purchases of raw materials restated in average year price
index as applicable to the individual year.
(c) Fixed Assets and Depreciation cost of all the years of study has been adjusted to year
base year 2000-01 at year end price index.

(d) Taxation, Dividend on equity shares have been restated with reference to the "end of
the year/period index" as applicable to the individual year
(e) The CPP Method divides the Balance Sheet items into two categories: Monetary items
and Non-monetary items. Monetary items are those assets and liabilities the amounts of
which are fixed by contract or statute in terms of the number of rupees irrespective of
the changes in the purchasing power of rupee. Items which comes under monetary in
nature are as follows:
Monetary assets include Investments, which are fixed in rupees, Current Assets other
than Inventories.
Monetary Liabilities include Secured Loans, Unsecured Loans, Current Liabilities and
Provisions
Since the value of monetary items is fixed in rupees, they are already expressed in terms of
current purchasing power of rupee and, therefore, need no restatement.
For Calculating purchasing power gain/loss, the balance of net monetary liabilities/assets as
on the date of the Balance Sheet is bifurcated into opening balance and
additions/decrements thereto during the year. The opening balance is restated with
reference to the index prevalent on that date. Additions/decrements are restated with
reference to the average index of the year. The closing balance is deducted from the total of
restated opening balance and additions/decrements. The resultant figure, if positive, is gain
otherwise loss in the case of net monetary liabilities and vice versa in the case of net
monetary assets.
Empirical Findings
After converting the Historical Based financial statements into Current Purchasing
Power, the major financial ratio has been calculated. The calculated ratios are presented in
Table-2.
Table - 2Ratios Used in the Study
Liquidly Ratios Profitability Ratio
Current Ratio Gross Profit Margin
Quick Ratio Operating Profit Margin
Activity Turnover Ratio
Net Profit Margin
Debtor Turnover Ratio Return on Investment
Creditor Turnover Dividend Payout

Ratio RatioInventory Turnover Ratio
Impact of Inflation on Liquidity Ratios
These ratios are calculated to comment upon the short-term paying capacity of a firm or a
concern’s ability to meet its current obligation. The important liquidity ratios are current
ratio and quick ratio.Table-3 summarizes the results of Liquidity Ratios under HCB method as
well as CPP method from 2004-05 to 2008-09 by the help of descriptive statistics and t-test.
Descriptive statistics and t-test for the current ratio provide that mean of reported
current ratio is less as compared to that of the inflated; leading to the conclusion that
liquidity position of sample companies is better under CPP method. On the contrary, lower
standard deviation for reported current ratio as compared to inflated current ratio clearly
indicates that former is more consistent than the latter. Even though value of kurtosis is
found to be more than 3 under both the methods, it is higher in CPP as compared to HCB
method. Therefore it can be concluded that the inflated current ratio is more peaked than
that of the reported current ratio. Yet again, the correlation value is 0.9998 represents high
degree of positive correlation between both the methods. The p-value of 0.0188, which is
less than 0.05, indicates a significant difference in the value of current ratio between HCB
and CPP methods at 5 percent level of significance.
Table - 3Statistical Results of Liquidity Ratios
Particulars
Current Ratio Quick Ratio
HCB CPP HCB CPP
Mean 2.1681 2.2620 1.2038 1.2038Standard Error 0.4737 0.5162 0.1117 0.1117Standard Deviation 3.0700 3.3454 0.7239 0.7239Sample Variance 9.4249 11.1917 0.5241 0.5241Kurtosis 34.5451 35.3145 1.2978 1.2978Skewness 5.6496 5.7361 1.2626 1.2626Range 20.2625 22.1101 3.1082 3.1082Minimum 0.4701 0.4846 0.3210 0.3210Maximum 20.7325 22.5947 3.4292 3.4292Sum 91.0582 95.0051 50.5592 50.5592Count 42 42 42 42Confidence Level (95.0%) 0.9567 1.0425 0.2256 0.2256Pearson Correlation 0.9998 1.0000Hypothesized Mean Difference
0.0000 0.0000

Df 40 40t Stat -2.1502P(T<=t) one-tail 0.0188t Critical one-tail 1.6839P(T<=t) two-tail 0.0376t Critical two-tail 2.0211
Hence in the case of Current Ratio our Null Hypothesis (H03) is rejected as there is a
significant difference between two accounting methods. Consequently our Alternative
Hypothesis (Ha3) is accepted.
The Descriptive statistics and t-test analysis for the quick ratio in Table-5.3 reveals
that the mean, standard deviation, kurtosis, skewness and all other findings are the same
under both the accounting methods (HCB and CPP). It is because inventory is taken away
from current assets for finding out the quick assets, the result indicates the reported and
inflated quick ratios are identical.
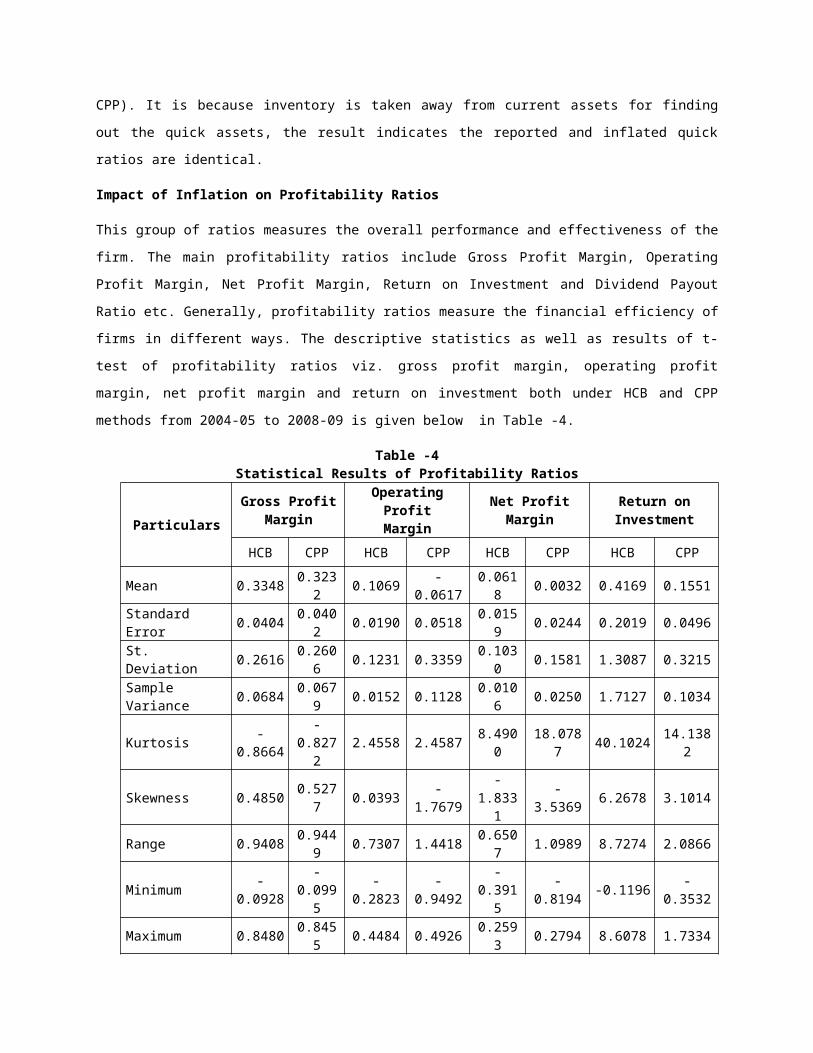
Impact of Inflation on Profitability Ratios
This group of ratios measures the overall performance and effectiveness of the firm. The
main profitability ratios include Gross Profit Margin, Operating Profit Margin, Net Profit
Margin, Return on Investment and Dividend Payout Ratio etc. Generally, profitability ratios
measure the financial efficiency of firms in different ways. The descriptive statistics as well
as results of t-test of profitability ratios viz. gross profit margin, operating profit margin, net
profit margin and return on investment both under HCB and CPP methods from 2004-05 to
2008-09 is given below in Table -4.
Table -4Statistical Results of Profitability Ratios
Particulars
Gross Profit Margin
Operating Profit
Margin
Net Profit Margin
Return on Investment
HCB CPP HCB CPP HCB CPP HCB CPP
Mean 0.3348 0.3232 0.1069 -0.0617 0.0618 0.0032 0.4169 0.1551Standard Error 0.0404 0.0402 0.0190 0.0518 0.0159 0.0244 0.2019 0.0496St. Deviation 0.2616 0.2606 0.1231 0.3359 0.1030 0.1581 1.3087 0.3215Sample Variance
0.0684 0.0679 0.0152 0.1128 0.0106 0.0250 1.7127 0.1034
Kurtosis -0.8664
-0.8272
2.4558 2.4587 8.4900 18.0787 40.1024 14.1382
Skewness 0.4850 0.5277 0.0393 -1.7679 -1.8331
-3.5369 6.2678 3.1014
Range 0.9408 0.9449 0.7307 1.4418 0.6507 1.0989 8.7274 2.0866
Minimum -0.0928
-0.0995
-0.2823 -0.9492 -0.3915
-0.8194 -0.1196 -0.3532
Maximum 0.8480 0.8455 0.4484 0.4926 0.2593 0.2794 8.6078 1.7334

Sum 14.0618
13.573 4.4906 -2.5905 2.5941 0.1362 17.5090 6.5152
Count 42 42 42 42 42 42 42 42Confidence Level (95.0%)
0.0815 0.0812 0.0384 0.1047 0.0321 0.0493 0.4078 0.1002
Pearson Correlation
0.9953 0.5010 0.9212 0.5676
Hypothesized Mean Difference
0.0000 0.0000 0.0000 0.0000
Df 40 40 40 40T Stat 2.9901 3.7177 5.1103 3.4662P(T<=t) one-tail
0.0024 0.0003 0.0000 0.0006
T Critical one-tail
1.6839 1.6839 1.6839 1.6839
P(T<=t) two-tail
0.0048 0.0006 0.0000 0.0013
T Critical two-tail
2.0211 2.0211 2.0211 2.0211
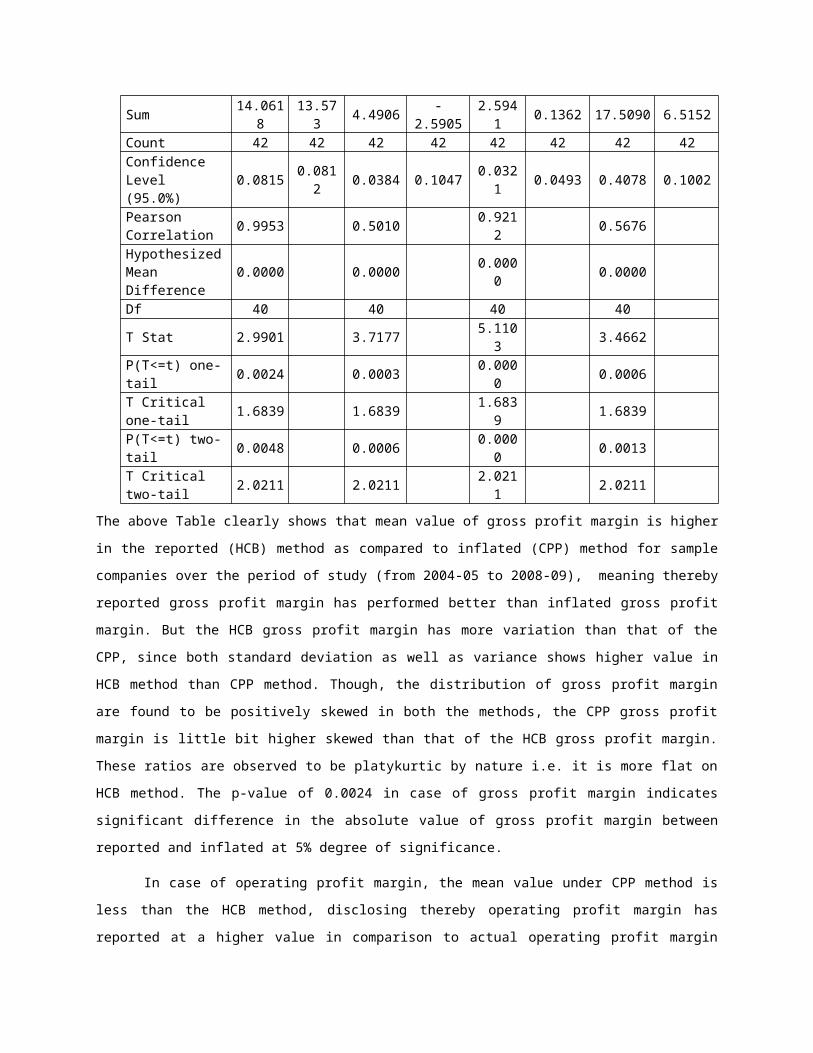
The above Table clearly shows that mean value of gross profit margin is higher in the
reported (HCB) method as compared to inflated (CPP) method for sample companies over
the period of study (from 2004-05 to 2008-09), meaning thereby reported gross profit
margin has performed better than inflated gross profit margin. But the HCB gross profit
margin has more variation than that of the CPP, since both standard deviation as well as
variance shows higher value in HCB method than CPP method. Though, the distribution of
gross profit margin are found to be positively skewed in both the methods, the CPP gross
profit margin is little bit higher skewed than that of the HCB gross profit margin. These ratios
are observed to be platykurtic by nature i.e. it is more flat on HCB method. The p-value of
0.0024 in case of gross profit margin indicates significant difference in the absolute value of
gross profit margin between reported and inflated at 5% degree of significance.
In case of operating profit margin, the mean value under CPP method is less than the
HCB method, disclosing thereby operating profit margin has reported at a higher value in
comparison to actual operating profit margin adjusted to inflation. The standard deviation of
reported operating profit margin is less than inflated which reveals that there is less
variation in reported operating profit margin in comparison to inflated. Skewness of
operating profit margin found to be positive in case of HCB method, where as it is negative
in case of CPP method. So HCB operating profit margin is positively skewed and for CPP it is
negatively skewed. The p-value shows a significant difference between reported and inflated
with respect to operating profit margin. The factors influencing the inflation were tested for
the degree of relationship among them to find whether the fluctuation in one factor affects
the other factors. To identify the same, the factors were measured for bi-variate correlation

with respect to each other and their coefficients were given in the above Table. From the
Table, it is clear that there is a significant correlation existing between the factors of
operating profit margin of reported and inflated.
Similarly, the mean of net profit margin is higher in case of HCB method as compared
to CPP method. The variation of reported net profit margin is less than the inflated net profit
margin as both standard deviation and variance is found to be less in HCB method. Here too
there is a significant difference between reported and inflated net profit margin as the p-
value is less than 0.05. However the skewness under both HCB and CPP method was found
to be negative. So it can be said that net profit margins are negatively skewed. Net profit
margins under both the methods experimented to be leptokurtic by nature i.e. they are
peaked.
From the Table-4, it is evidenced that Return on Investment (ROI) has executed the
same trend like that of gross profit margin, operating profit margin and net profit margin.
The mean value and the standard deviation of Return on Investment (ROI) under HCB
method is found higher than that of CPP method. Therefore there is less consistency in case
of reported return on investment. The value of p shows that there is a significant difference
between reported and inflated return on investment among the two accounting methods
(HCB and CPP) for the study period. While in the case of skewness both reported and inflated
return on investment are positively skewed and HCB return on investment is higher than the
CPP return on investment. Both the reported and inflated returns on investment are
leptokurtic by nature. The HCB return on investment is more peaked than the return on
investment of CPP.
Table 4 shows the results of the profitability ratios, where it can be observed that the
entire profitability ratios have dropped significantly. This shows that inflation adjustment
leads to impact upon the shareholders’ funds. The 3rd hypothesis does suggest no
significant difference between the ratios of two groups (HCB and CPP). But the p-values of
0.0024, 0.0003, 0.0000 and 0.0006 respectively for gross profit margin, operating profit
margin, net profit margin and return on investment shows that there is significant difference
between reported and inflated profitability ratios. Therefore our Null Hypothesis (H03): ‘there
is no significant difference in reported and inflated financial ratios’ is rejected accepting the
alternative hypothesis (Ha3).
Impact of Inflation on Activity Ratios
Activity ratios are calculated to measure the efficiency with which the resources of a firm
have been employed. These ratios are also called turnover ratios because they indicate the
speed at which the assets are being turned over into sales. Activity ratio is a very important
tool to measure the velocity of current assets of an organization and includes generally
Creditor Turnover Ratio, Debtor Turnover Ratio and Inventory Turnover Ratio. The details of
descriptive statistics and t-test of these ratios for sample companies under HCB method as
well as CPP method are given away in Table -5 for the period under study.
It is observed from the Table -5 that the creditor turnover ratio has performed better
in the case of CPP method as compared to HCB method, which indicates creditors are
treated well in case of inflationary condition. The standard deviation as a measure of
variation is found to be higher in CPP creditor turnover ratio than that of the HCB. Again, the
creditor turnover ratio under both the methods is found to be positively skewed, but it is
more skewed under CPP method than the HCB method. The ratio is experiential to be
platykurtic by nature i.e. it is more flat in case of HCB method. As the p-value comes to
0.0000, so it is concluded that there is significant difference in creditor turnover ratio under
both the accounting methods under discussion.
Table -5Statistical Results of Activity Ratios
Particulars
Creditors’Turnover Ratio
Debtors’Turnover Ratio
Inventory Turnover Ratio
HCB CPP HCB CPP HCB CPP
Mean 3.7426 4.0907 22.9793
25.1120 11.4766
11.1810
Standard Error 0.4393 0.4825 3.6672 3.9989 1.2040 1.1668
Standard Deviation 2.8469 3.1267 23.7664
25.9161 7.8027 7.5617
Sample Variance 8.1050 9.7761 564.8427
671.6457
60.8817
57.1790
Kurtosis -0.1930 -0.0783
5.3379 5.2297 3.1295 3.0977
Skewness 0.7862 0.8134 2.2205 2.2088 1.5887 1.5714
Range 10.4887 11.7801
109.8264
118.0484
37.5967
36.5980
Minimum 0.3097 0.3355 1.6000 1.7463 0.4390 0.4199
Maximum 10.7984 12.1156
111.4264
119.7948
38.0357
37.0179
Sum 157.1911
171.8101
965.1307
1054.7024
482.0173
469.6033
Count 42 42 42 42 42 42
Confidence Level 0.8872 0.9743 7.4061 8.0760 2.4315 2.3564
(95%)
Pearson Correlation 0.9997 0.9998 0.9994
Hypothesized Mean Difference
0.0000 0.0000 0.0000
Df 40 40 40
t Stat -7.5652 -6.0256 5.5831
P(T<=t) one-tail 0.0000 0.0000 0.0000
t Critical one-tail 1.6839 1.6839 1.6839
P(T<=t) two-tail 0.0000 0.0000 0.0000
t Critical two-tail 2.0211 2.0211 2.0211
Similarly, it is observed from the Table-5 that the mean value of debtor turnover ratio
is superior under the CPP method as compared to that of HCB method but having more
variations (as the standard deviation is found to be higher). Thus it can be said that inflation
has favorable impact debtors of the sample companies during the period of study. Yet again
the ratio is found to be positively skewed and leptokurtic under both the methods of
accounting, but more skewed as well as more peaked under the HCB method than CPP. Like
the creditor turnover ratio, there is significant difference in values of this ratio under both
the accounting methods since value of p is found to zero.
On the contrary, The mean value, standard deviation as well as variance of inventory
turnover ratio is found to be higher in HCB method as compared to the CPP method implying
that the production efficiency of sample companies has suffered to greater extent due to
inflation, but it is inconsistent during the period of study. Here also, like other turnover
ratios, we found the inventory turnover ratio is positively skewed under both the methods
and marginally more peaked under HCB method. There is also significant difference in
values of inventory turnover ratio under both the accounting methods as evidenced from the
p-value.
As the p-values for all three activity ratios (Creditor Turnover Ratio, Debtor Turnover
Ratio and Inventory Turnover Ratio) are found to be equal (0.0000), there is a significant
difference in between two accounting methods. For this reason our Null Hypothesis (H03) for
Activity Ratios is discarded and the Alternative Hypothesis (Ha3) is accepted.
Conclusion
From the above discussion and interpretation of the descriptive statistics and t-test of key
financial ratios, undoubtedly it is observed that inflation has affected all the ratios under
study except the quick ratio. With the pressure of inflation the current ratio, creditor
turnover ratio and debtor turnover ratio have changed and performed better, but no change

has occurred to the quick ratio. Nevertheless all the profitability ratios and inventory
turnover ratio have suffered badly due to the impact of inflation. The financial ratio analysis
thus confirms the findings recorded in previous chapter that historical accounts overstate
profitability and understate liquidity.
The results yield valuable findings concerning the financial analysis of companies
operating in hyperinflationary economy. The analists to analyse companies in high inflation
economy, even if not in hyperinflation, should evaluate ratios according to the findings of
this article.
This study enables standard setters to evaluate non-monetary assets more
realistically and thus overcome the negative effects of inflation. We suggest a similar study
be conducted for the financial sector companies as a further study.
References
1. Akdoğan N., Aktas R. and Unal S., (2009), “Effect of Inflation Accounting on Financial
Ratios: An Empirical Analysis of Non-Financial Firm Listed on Istanbul Stock Exchange”.
The Icfai University Journal of Accounting Research 2, 47-62.
2. Daly D. J. (1982), Inflation, Inflation Accounting and its Effect, Canadian Manufacturing
1966-82”, York University, Downs view, Ontario pp. 355-374.
3. Gupta A., (2000) “Inflation Accounting in the Indian Context” Kanishka Publishers and
Distributors.
4. Gupta R. and Bhandari L. C., (1978), “Impact of Inflation Accounting on Corporate Profits
- A Study of 57 Indian Companies, Institute of Management Ahmedabad, Research and
Publication Department, working Paper Series
5. Hochman S. and Palmon O., (1985), “”The Impact of Inflation on the Aggregate Debt-
Asset Ratio” The Journal Of Finance, p.1115-1125
6. Hand Book on Statistics of the Indian Economy, Reverse Bank of India 2008-09
7. Hand Book on Statistics of the Indian Economy, Reverse Bank of India September 15
2011.
8. http://financial-dictionary.thefreedictionary.com/Inflation+Accounting (2012)
9. http://hindi.economictimes.indiatimes.com/currentquote.cms?
ticker=a&matchcompanyname=true&pagesize=30&pagenumber=1

10. http://www.moneycontrol.com/stocksmarketsindia/
11. Jennings R. & Maturana G. (2005) in their article The Usefulness Of Chilean Inflation
Accounting, in the journal ABANTE, p 85-118
12. Kohler, E.L., A Dictionary of Accountants, 6th edition, Prentice Flail of India Pvt. Ltd.,
New Delhi, 1983, p.111.
13. Karapinar A. and Zaif F., (2005), “The Effect of Inflation Accounting on Financial
Statement Analysis”, Yaklaşım Dergisi 26, p49–72.
14. Karapinar A., Zaif F. &Bayirli R., (2012) “Impact of Inflation Accounting application on
Key Financial Ratios” Isletme Arastirmalari Desgisi, Journal of Business Research, Turk,
p44-57
15. Lacey, K.C., Some implications of the first-in-first-out method of stock valuation,
Economics, Feb., 1945, PP. 26-30.
16. N'cho-Oguee C., Blakley D. L., Murray L. W. & Smith M. B., (2 011), Econometric
Analysis Of Functional Relationship Between Inflation And Growth Of Firms In South
Africa : Empirical Research Findings Journal of Financial Management and Analysis, Om
Sai Ram Centre for Financial Management Research p1-19
17. Sharma R. K And Gupta S. K.,(2003) A book on Management Accounting pp31.1-31.21
18. Table of Wholesale Price Index -All India, Economic Survey of Delhi, 2007-08 Month And
Year Wise Wholesale Price Index Numbers of All India P272-278
19. Whittington G., Saporta V and Ajit Singh (1997) “The Effects of Hyper-Inflation on
Accounting Ratios. Financing Corporate Growth in Industrial Economies” Working paper
series from The World Bank; International Finance Corporation, IFC Technical Paper
Number 3, p1-36