Impact of increasing feed, meat and biofuel demand on ...
28
Impact of increasing feed, meat and biofuel demand on China’s agriculture and environment: Simulations of regional effects through 2030 Laixiang Sun SOAS, University of London, UK; and IGSNRR, Chinese Academy of Sciences (on behalf of CATSEI-team) IGSNRR, China Academy of Sciences Beijing 21 Dec. 2008
Transcript of Impact of increasing feed, meat and biofuel demand on ...

Impact of increasing feed, meat and biofuel demand on China’s agriculture
and environment: Simulations of regional effects through 2030
Laixiang SunSOAS, University of London, UK; and IGSNRR, Chinese
Academy of Sciences(on behalf of CATSEI-team)
IGSNRR, China Academy of SciencesBeijing 21 Dec. 2008

Outline
Background
Chinese agriculture today
An overview of the Chinagro model.
Baseline simulation through 2030, with emphasis on: foreign trade (food, feed), on-farm income, & environmental pressure
Alternative scenario simulations: High world price, high livestock production, biofuel demand (work in progress)
Spatial livestock production planning under risks and uncertainties (scenarios on livestock allocation)
Concluding remarks.

1. Background
Chinagro: “Policy decision support for sustainable adaptation of China’s agricultural to globalization”. EU 5th Framework “International Scientific Cooperation Project (INCO)”, from Oct 2001 to January 2005.
Bridging fund by Dutch government & the CAS project on “Human Activities & Changes of Terrestrial Ecosystems in China.”
Catsei: “Chinese agricultural transition: Trade, social and environmentalimpacts”. EU 6th Framework “Special Targeted Research Project (STRP), from January 2007 to December 2009.
It is regarded by peers as an extraordinary success to win two EU FP5 and FP6 projects in sequence. It is an award to the continuous and fruitful collaborations between CCAP and IGSNRR on the China side and IIASA, SOW-VU, and SOAS in the Europe side (IFPRI in Washington DC and LEI in the Hague join the Catsei Project).

2. Chinese agriculture today
Figure 1. Agricultural output per capita, 1955-2005
Source: Naughton (2007) compiles from Statistical Yearbook of China (various years).
Note: Meat production is carcass weight, total production of pork, mutton, and beef. Official meat production data are adjusted downward in accord with the procedure in Ma, Huang, and Rozelle (2004).
Reference: Naughton, Barry (2007), The Chinese Economy: Transitions and Growth. MIT Press.

2. Chinese agriculture today
Figure 2. Fertilizer use, irrigation, and mechanical power
Source: Naughton (2007) compiles from Statistical Yearbook of China (various years).
Reference: Naughton, Barry (2007), The Chinese Economy: Transitions and Growth. MIT Press.

2. Chinese agriculture today
Unit China World United States
Production per hectareRice, paddyWheatCornSoybeans
Fertilizer use per hectareFarm worker per 100 hectareLand irigatedTractor per 1,000 hectare
TonsTonsTonsTonsKilogramsNumberPercentNumber
6.23.74.61.7
271310407
3.92.74.32.2
94821818
7.02.88.62.6
11121327
Table 1. Comparison of yields & inputs, 1997
Source: Naughton (2007) cites Gale (2002) “China at a glance: A statistical overview of China’s food and agriculture,” in USDA (2002), China’s Food and Agriculture: Issues for the 21st Century.

2. Chinese agriculture today
Fig 3. The different path of agricultural innovation in East Asia and North America
Reference: Naughton, Barry (2007), The Chinese Economy: Transitions and Growth. MIT Press.

3. An overview of the Chinagro model
General equilibrium model: consumers, producers, markets
Focus on agriculture (non-agriculture largely exogenous)
Supply at county level (2433)
Demand at region level (8), with 3 urban and 3 rural classes
Tradable and local commodities
Market clearing for each tradable commodity (flows across regions and from/to abroad)

3. An overview of Chinagro model
Farm sector: Specified at county level
3 cropping types and 6 livestock systems, each with several activities
Production function with two branches: one with labor input, and one with feed or fertilizer input (Fig. 5)
Local and tradable inputs
Land and livestock resources exogenous
Endogenous labor shifts across land use types
Maximization of net profits at given market prices

3. An overview of Chinagro model
f
0
l
1yy
2l
3l
2y 3y y

3. An overview of Chinagro model
Base-year 1997 (‘complete’ data collection)
Validation in 2003 (‘replicate’ economy of 2003)
Scenario simulations for selected years (2010, 2020, 2030)
Scenarios are driven by a coherent set of exogenous driving variables

4. Base scenario: main driving forces
Sustained high non-agricultural growth (6-7.5%)Moderate population growth (to 1460 million)Further urbanization (to 60 %)Hence, large demand increases for meat (almost doubling) and dairy (more than tripling)
Loss of crop land (7 million ha), especially rainfedFurther intensification of livestock sectorContinued technical progress (0.5 - 1.0 % per year)
Continued trade liberalization (tariffs and non-tariff barriers)Farm taxes abolished, and grain support introduced
World agricultural prices derived from FAO-OECD projections

4. Baseline simulation results: trade (1)
Main imports 2030Reference:world trade
Meat Share of domestic level, 2004Million ton demand million ton
Beef, mutton 0.0 0 % 10.0Pork 1.4 2 % 7.7Poultry meat 0.7 4 % 10.3
Feed
Maize 16.6 12 % 85.1Carbohydrate feed 19.7 19 % 40.6Protein feed 43.5 38 % 151.1
Feed import not excessive for China but significant for world market and F4

4. Baseline simulation results: trade (2)
Main exportsBase, 2030
Million ton Supply share
Rice 3.7 2.8 %Wheat 1.8 2.2 %Vegetables 13.0 4.7 %Fruits 4.9 6.3 %
Export potential for, especially, fruits and vegetablesYet, this is an aggregate, absorption capacity specific markets needs to be studied
case studies CATSEI on market chain

4. Baseline simulation results: social
Can on-farm incomes follow non-agricultural earnings?
Annual increases in value added from farming, per manyear: cropping 3.7 %livestock 4.6 %all farming 4.1 %
These are strong but fall behind rise in per capita non-agricultural incomes (6 to 7 % per year)
Confirming present concerns about urban-rural income distribution– especially because these agricultural growth rates differ strongly across
regions
and land balances (+environmental pressure) point to supply constraints
no solution without rural based industrialization

4. Baseline simulation results: environment (1)
Danger from fertilizer losses and unused manure surpluses?
In 2003:Fertilizer application quite high: on average 330 kg chemical and 70 kg organic nutrient per haManure supply of confined livestock about 33 kg nutrient per ha agricultural land (incl. pasture)
Increases until 2030 (Figure 6)As such moderate overall but highest in areas with largest pressure
confirms serious concerns (Section 7).

4. Baseline simulation results: environment (2)
Figure 6. Fertilizer use in kg/ha, 2003 and 2030

5. High world price scenario: specification
This scenario studies how China’s meat and feed imports would respond to high world prices
Reasons: F4! OECD-FAO takes about half of biofuel mandates to be met from non Generation 1 source (not so sure what this would be) Chinagro Baseline implies higher demand than assumed by OECD-FAO
Different from Base after 2010 for world prices: World prices of meat, maize and carbohydrate feed:
20% higher in 2030World prices other agricultural commodities:
10% higher in 2030
For imported and exported commodities, price changes are fully transmitted to farmers
Enhanced Chinagro model will be more flexible in this respect

5. High world price simulation: foreign trade
Meat Reference 2004 Baseline High world price World trade
Beef, mutton 0.0 0.0 10.0Pork 1.4 0.0 7.7Poultry meat 0.7 0.0 10.3
Feed imports
Maize 16.6 8.6 85.1 Carbohydrate feed 19.7 18.2 40.6Protein feed 43.5 42.8 151.1
All meat in autarky (imports disappear)Feed imports less, but only maize strong reaction

5. High world price simulation: impacts within China
In 2030, as compared to baseline:
Agricultural trade deficit substantially lowerGains for crop farmers Livestock farmers have mixed results, because the feedcosts are higher and higher meat prices cannot compensate for this in all countiesAverage growth of farm earnings per manyear now 4.4% instead of 4.1% but still far below non-agriculture Environmental pressure changes little (spatially and in time)
Losses for consumers due to higher prices:Domestic supply does not respond fullyAnnual meat intake 2 kg per person lower

6. High livestock: effects on manure discharge
Green counties are below the national average

6. High livestock scenario: evaluation
Issue: would it be better to produce more meat inside China?
Answer not simple:trade-off between consumption and environmental pressurein addition, complicated effects on regional income distribution
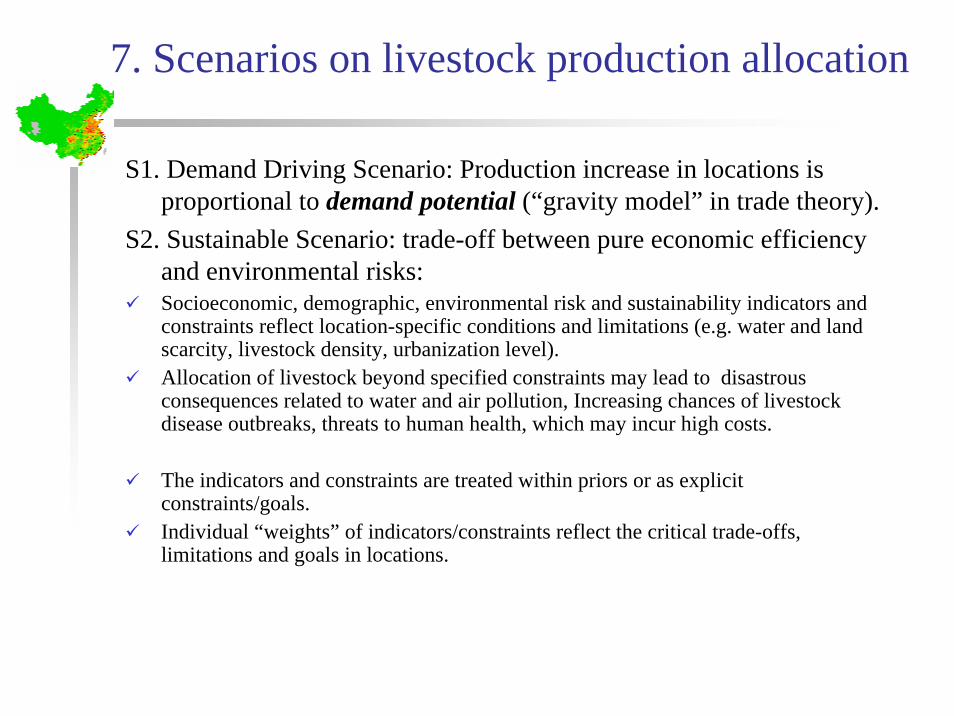
7. Scenarios on livestock production allocation
S1. Demand Driving Scenario: Production increase in locations isproportional to demand potential (“gravity model” in trade theory).
S2. Sustainable Scenario: trade-off between pure economic efficiency and environmental risks:Socioeconomic, demographic, environmental risk and sustainability indicators and constraints reflect location-specific conditions and limitations (e.g. water and land scarcity, livestock density, urbanization level). Allocation of livestock beyond specified constraints may lead to disastrous consequences related to water and air pollution, Increasing chances of livestock disease outbreaks, threats to human health, which may incur high costs.
The indicators and constraints are treated within priors or as explicit constraints/goals.Individual “weights” of indicators/constraints reflect the critical trade-offs, limitations and goals in locations.

7. Scenarios on livestock production allocation
“Riskiness” of a location is determined by indicators and constraints.
This type of risk definition is often applied in environmental studies to define ambient standards
Urbanization level
0
1
8010
0.5
50% of urban pop in total pop of county
R1Share of build-up area
0
1
10
0.5
5025% in total land
R2

7. Scenarios on livestock production allocation
Nutrients in excess of crop uptake
0.5
Ratio of nutrients supply to crop nutrients uptake
0
1
15011090
Livestock biomass
0
1
600300 1100kg animals biomass / ha cultivated land
R4
Compound risk indicator:
R3
R = max(R1, R2) × min (R3, R4)
7. Scenarios on livestock production allocation
0.0 0.2 0.4 0.6 0.8 1.0
N
NE
E
C
S
SW
NW
0.0 0.2 0.4 0.6 0.8 1.0
N
NE
E
C
S
SW
NW
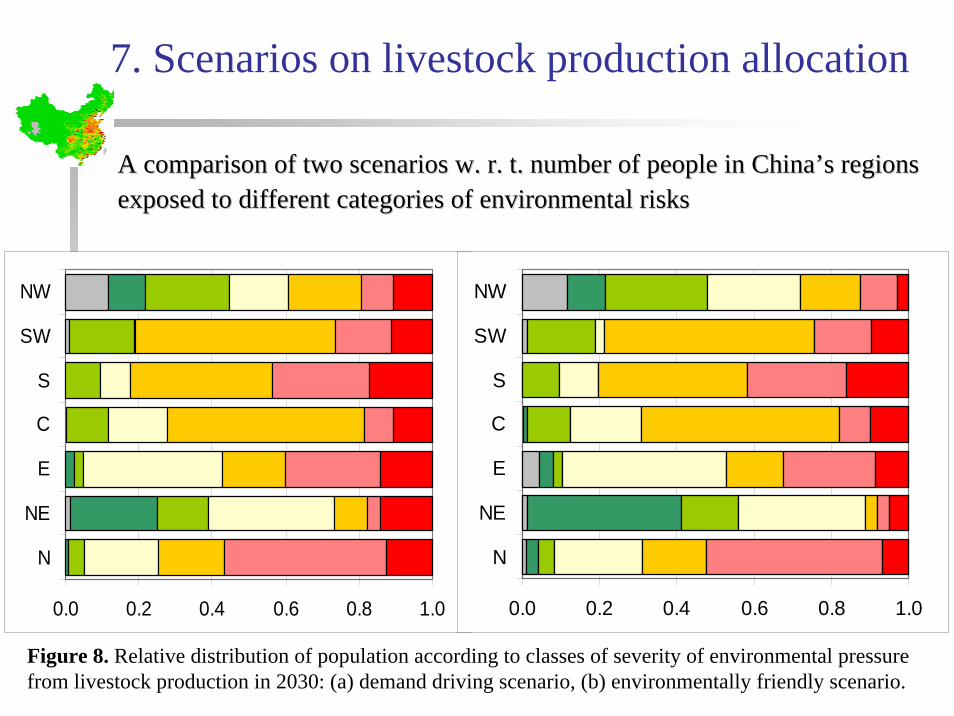
Figure 8. Relative distribution of population according to classes of severity of environmental pressure from livestock production in 2030: (a) demand driving scenario, (b) environmentally friendly scenario.
A comparison of two scenarios w. r. t. number of people in ChinaA comparison of two scenarios w. r. t. number of people in China’’s regions s regions exposed to different categories of environmental risksexposed to different categories of environmental risks

8. Concluding Remarks
Intensified livestock system will play the leading role in meeting the increased demand for meat in the future. Pig, broiler and layer stock in intensified systems are expected to increase at least 2.5 times between 2000 and 2030.The “business as usual” scenario suggests a high correlation between geographic distribution of animals and population density. This may imply serious environmental problems caused by unused animal manure and losses in the application of fertilizer, especially in densely populated areas.We suggest a practical method for spatially explicit planning of production levels in given locations, which is based on a rebalancing algorithm and takes into account “weighted” combinations of criteria for sustainable livestock-production allocation and intensification. The research highlights the urgent demand for technological breakthrough in manure management (3rd generation of bio-fuel technology?).

Thank you for your attentionThank you for your attention