Impact of Hurrican Katrina on the Insurance Industry ... · Hurricane Andrew and 9/11 occurred...
29
Hurricane Katrina Analysis of the Impact on the Insurance Industry *This paper was originally written and produced in October 2005.
Transcript of Impact of Hurrican Katrina on the Insurance Industry ... · Hurricane Andrew and 9/11 occurred...

Hurricane Katrina Analysis of the Impact on the Insurance Industry
*This paper was originally written and produced in October 2005.
Hurricane Katrina: Analysis of the Impact on the Insurance Industry 2towerswatson.com
Tragic stories of extreme hardship emerged, and we will long remember some of the horrific images that were captured by the media. We can only hope that this experience will lead to meaningful improvements in disaster response, particularly with respect to the economically disadvantaged members of our society. The insurance industry plays an important role in natural disaster recovery, and will undoubtedly be both the subject of and a participant in the public debate arising from this catastrophe. We have prepared this white paper in hopes of contributing to the discussion of the financial impact on insurers, as well as the deeper implications for the industry.
As of September 30, 2005, we estimate the insured losses from Katrina to be between $40 billion and $55 billion, displacing the 9/11 terrorist attacks as the single most expensive insured occurrence in the U.S. to date. Some claims from the 9/11 attacks are still open, but the consensus estimate of the insured losses is approximately $35 billion (in 2004 dollars). As further points of comparison, Hurricane Andrew produced approximately $20 billion of insured losses, followed closely by the 1994 Northridge earthquake (approximately $18 billion).
We write this soon after Hurricane Rita came ashore close to Katrina’s landfall. Rita weakened significantly as she approached the coast, and the onshore damage appears to be contained relative to that of Katrina. However, reports are not yet in from the critical offshore energy industry, much of which was on the “bad” (eastern) side of Rita’s eye. Coming so soon after the 2004 hurricane season that introduced Florida to Charley, Francis, Ivan and Jeanne in quick succession, the Katrina/Rita “double whammy” makes it easy to think that hurricane seasons have suddenly gotten worse. We include a brief comparison of Hurricanes Andrew and Katrina, and a look at historical hurricane losses, along with some insights on hurricane frequency and severity.
Following the Executive Summary, we provide analyses and estimates of insured losses by major line of business. Even a month after Katrina’s landfall, we must emphasize that the estimation of ultimate insured losses is an uncertain venture, certainly more art than science. This is particularly true in light of both the continuing inaccessibility of some damaged areas and the difficulty of dividing damage between wind (covered by normal homeowners policies) and storm surge (excluded from homeowners policies). We then discuss the broader impact of the storm on the insurance industry, as well as implications for financial and operational risk management, concluding with brief comments on some of the immediate public policy issues that have arisen.
The effects of Hurricane Katrina stunned and moved the entire country — indeed, the world. We generally expect things to get better rapidly once the wind and the rain stop, but the news from New Orleans only got worse as the weather improved.
Introduction

Hurricane Katrina: Analysis of the Impact on the Insurance Industry 3towerswatson.com
Katrina is a major hurricane by several measures. Meteorologically, Katrina was the third-strongest storm (in terms of central pressure) to make landfall in the U.S. It also had the widest recorded radius of any category 4 hurricane. The widespread damage due to the breadth and strength of the wind was exacerbated by the storm surge that accompanied it, which was measured at a record 29 feet along the Mississippi coast. While much of the media attention has focused on Louisiana and New Orleans, the coastline across Mississippi into Alabama was devastated as well.
The estimated insurance loss is between $40 and $55 billion. Based on information available as of this writing, we estimate the range of privately insured loss to be between $40 and $55 billion. (This excludes losses insured under the National Flood Insurance Program.) Katrina will displace Andrew as the costliest hurricane and is likely to eclipse the 9/11 terrorist attacks as the single most expensive insured occurrence in the U.S. Our estimate includes an allowance for demand surge (the increase in local market costs due to the vastly increased demand for materials and services relating to cleanup and reconstruction). However, it excludes the costs to the insurance industry of any retroactive expansion of property coverage to include damage that would otherwise be attributable to flooding. Our estimate also includes a provision for liability insurance claims arising from allegations relating to pollution, negligent health and nursing home care, errors and omissions by insurance agents in explaining coverage, and other possible causes of action.
The industry is responding reasonably well. Under the circumstances, the insurance industry is responding reasonably well to the disaster — both operationally and financially. An estimated 10,000 claim adjusters have been dispatched by insurers to handle what is anticipated to be well over a million claims, using mobile units equipped with satellite hookups and other support technology. Responses to disasters of this magnitude are never perfect, and much of the work for these people still lies ahead. However, it appears that the claim-adjusting process is well under way. Financially, while roughly two dozen insurers have been placed on various types of “watch” lists by rating agencies pending a clearer understanding of the impact of their Katrina losses on capital adequacy, there have been no reported failures. For most affected insurers, Katrina will be more of an earnings event than a capital event.
The primary insurance market will harden — but only selectively. We expect prices for homeowners and commercial property in catastrophe-prone areas to rise — or to stabilize to the extent that the latter were softening prior to Katrina. The marine and energy markets will be particularly problematic, due to the size of the Katrina loss in conjunction with last year’s heavy hurricane losses and further losses from Hurricane Rita; insurance prices in this market will rise everywhere. Some of the market impact will be immediate; some will occur more gradually as pricing models are recalibrated to incorporate Katrina and Rita. In catastrophe-prone areas, both onshore and offshore, commercial insurance terms and conditions will be tightened as insurers seek to control their aggregate hurricane exposure. In these areas, there may also be availability problems as insurers and reinsurers reevaluate their exposures. There will be little overall movement in automobile and liability rates. Businesses outside of areas exposed to catastrophes are likely to see further softening in their rates as insurers compete more aggressively for the “safe” business.
The reinsurance markets will also be affected. We expect that the property per-risk and property catastrophe reinsurance market will harden, and capacity may be reduced somewhat. To the extent that reinsurers rely on retrocessional protection, they will experience higher prices and less capacity to support them. Like the associated primary market, the marine and energy reinsurance market will be particularly problematic as the players reevaluate their appetite for this sector.
Executive Summary

Hurricane Katrina: Analysis of the Impact on the Insurance Industry 4towerswatson.com
Katrina (and Rita) will create pressure for stronger capitalization. Rating agencies are currently in a dialogue with companies most affected by Katrina, reviewing the extent of their losses and plans to replenish capital. A number of companies have already announced capital-raising activities. Once these immediate issues are settled, we expect rating agencies to begin exerting pressure on companies writing catastrophe-exposed business to (a) further improve their catastrophe risk management systems and controls, and (b) provide stronger capitalization to support the risks inherent in this type of business.
Katrina will attract few (if any) new insurers. Hurricane Andrew and 9/11 occurred during or at the end of very soft insurance markets, when there was clear potential for upward rate activity. In addition, they caused industry surplus growth to stagnate (Andrew) or actually become negative (9/11), leading to lack of capacity in the existing markets. This combination created business opportunities for new market entrants supported by fresh capital. In 2005, the industry is just starting to come off a hard market, with less room for rate increases. While the combination of Katrina and Rita will severely reduce industry earnings for the year and has meaningfully impaired the capital of several individual insurers, we do not expect industry-wide capacity problems. In addition, more insurers (especially in Bermuda) are now publicly traded, providing enhanced investment opportunities without incurring the frictional costs of new company formation.
Seeking to reduce volatility, insurers (and reinsurers) will look hard at their approaches to risk management. This review will include both the mix of risks in their portfolio and their reinsurance protections. Although new technologies, particularly geographic mapping and catastrophe models, have vastly improved insurers’ exposure management capabilities, the losses from Katrina have shown that there is still room for improvement, particularly in commercial lines and business interruption exposures. We expect that even where the exposures are already relatively well understood (as they are in personal lines), companies’ tolerance for risk concentration will decrease. Katrina has also exposed weaknesses in the other end of
the business, as several insurers are already “back in on top” of their reinsurance protections. This event will almost certainly cause a shift in the industry’s perception of what constitutes adequate reinsurance protection.
Insurers — and society as a whole — will need to reconsider the potential for mega-catastrophes. Our analysis of past hurricanes clearly indicates that radical growth in property concentrations in catastrophe-prone coastal areas has vastly increased the potential for large catastrophe losses. When including other perils, such as earthquake and terrorism, it appears that a Katrina-sized loss event will occur between every 50 and 100 years. “Smaller” events (in the $20 billion range) should occur, on average, roughly every 15 years. Insurers, investors, regulators and policymakers need to adjust to this new reality.
Several important problem areas should receive thoughtful public attention. Many key concerns that have been raised, such as the state of governmental planning and preparedness, are only indirectly related to insurance. However, given the significant role that private insurance plays in disaster recovery, it is inevitable that some areas under discussion will impact insurers. For instance, when it comes to natural disaster risk management and financing, should consumers pay the market price of their risk? To what extent should rebuilding be allowed in catastrophe-exposed areas? How do we address the disproportionate lack of insurance coverage among the poor? Is there a need to create a federal national disaster pool? Is mandatory integration of flood coverage into homeowners policies needed?

Hurricane Katrina: Analysis of the Impact on the Insurance Industry 5towerswatson.com
Insured Losses From Katrina
The direct damage from Katrina has multiple components: privately insured, publicly insured through the National Flood Insurance Program, and self-insured or uninsured. In addition, there are extensive indirect costs to both individuals and the economy as a whole. In spite of their record-setting size, private insurance payments will be only a part of the total cost.
Our estimate of the privately insured losses from Hurricane Katrina is $40 billion to $55 billion. This includes an allowance for demand surge (i.e., the increase in local market costs due to vastly increased demand for services and materials). It excludes any allowance for the expansion of property coverage to include storm surge and flood damage under policies with flood exclusions. Should this coverage be granted retroactively, it would substantially increase insurers’ payments. It also excludes potential losses to financial guaranty, credit and surety insurers, as there is not yet sufficient information to develop meaningful estimates in these lines.
At this time, we do not believe that life and health insurance losses will be material, in spite of the temporary deterioration in public health facilities in the most affected areas.
Our total estimate was built up from our estimates of the losses to major lines of business, which are discussed at length in the next section. We also developed an estimate based on the losses announced to date by individual insurers and found the results to be compatible.
Several factors increase the uncertainty of our Katrina estimates beyond that of a “normal” hurricane.
• Given the breadth of the storm’s wind field and the resulting extent of the damaged area, we expect that the demand surge will be unusually high. Many buildings will be either total or constructive total losses, and the “constructive total loss” standard will be adjusted according to the local ability to repair the buildings, which is affected by the demand surge.
• Once insurance adjusters have full access to the damaged areas, the separation of damages between wind and flood will be both difficult and contentious. Mold growth, even in otherwise undamaged properties, adds another layer of complexity.
• Unlike many past hurricanes, the losses resulting from Katrina will include a larger proportion of commercial losses, which are more difficult to estimate, particularly business interruption costs.
• The ultimate costs of additional living expenses in personal lines and business interruption in commercial lines will depend on the length of the recovery process.
• The environmental impact of the storm and flood will take years to understand; resolution of the potential litigation will take even longer.
• Some damaged rural areas are still essentially unreachable. Access to parts of New Orleans continues to be restricted and will likely be further delayed by renewed flooding resulting from Hurricane Rita.
• Louisiana, Mississippi and Alabama are considered by the U.S. Chamber of Commerce to be among the top five most unfavorable legal climates. The extent to which this will become a factor is unknown at this time.
As noted above, we reviewed our estimate for reasonability against the loss estimates announced publicly by individual insurers. There are a number of difficulties in summing up the estimates from individual insurers and reinsurers:
• Most important, not all insurers have released estimates, so the announced estimates have to be “grossed up” for the missing companies.
• Estimates of aggregate natural catastrophe losses have a tendency to develop upward over time. We believe that Katrina’s losses are likely to develop somewhat more slowly than normal due to the greater-than-normal involvement of commercial lines and the effect of flood/surge losses.
Important differences Andrew Katrina
Wind field Compact Wide
Beach exposure Little Vast
Storm surge Relatively small Record-breaking
Offshore energy impact Minimal Large
Figure 1. Andrew vs. Katrina
Perspective on Katrina

Hurricane Katrina: Analysis of the Impact on the Insurance Industry 6towerswatson.com
• The estimates are stated on inconsistent bases: Some are after tax, while others are before tax. Some are in dollars, while others are a percentage of the ultimate total industry loss. Most are net of reinsurance, but a few are gross of recoveries.
• Where estimated losses are stated net of reinsurance, some companies have included the cost of reinstatement premiums for their reinsurance, but most have not. Reinsurers typically include reinstatement premiums as an offset to their reported losses.
Taking these factors into account, we believe that our estimate of the total insured loss is compatible with the individual estimates released to date.
Hurricanes Andrew and Katrina
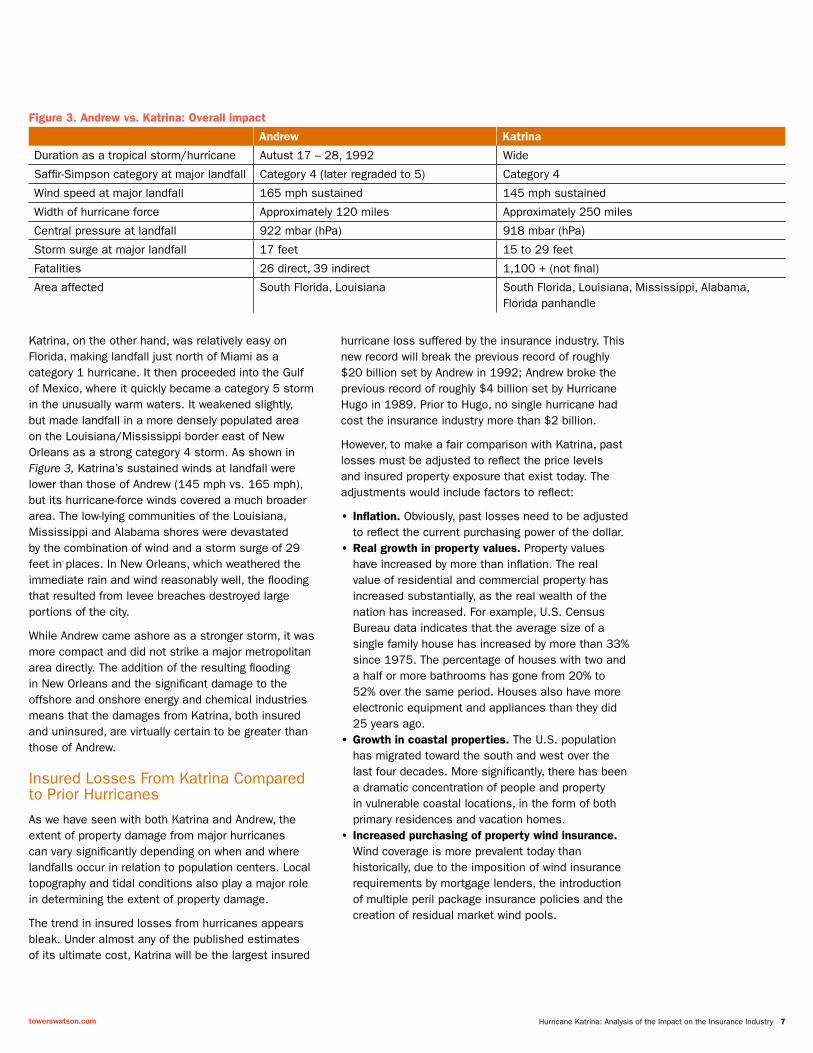
Hurricane Katrina will replace Hurricane Andrew as the largest insurance loss from a natural disaster in U.S. history. Both were strong storms that first struck the east coast of Florida and then proceeded into the Gulf of Mexico to prepare for a second landfall on the Gulf Coast. However, there are many differences between the storms themselves and their resulting damage (Figure 1 on page 5).
The relative effects of the two hurricanes on Florida and the Gulf Coast were exactly reversed. Andrew’s largest impact was in Florida, where its eye struck a relatively lightly populated suburban area. As shown in Figure 2, Andrew had very high sustained winds but was a compact storm and, therefore, affected a relatively small area. After crossing Florida, Andrew headed into the Gulf of Mexico, maintaining its category 3 status, and made landfall in a less densely populated area along the central Louisiana coast.
Figure 2. Andrew vs. Katrina: Wind fields and population density
Hurricane Katrina Hurricane Andrew
Will need new maps. Can not locate files
Hurricane Katrina: Analysis of the Impact on the Insurance Industry 7towerswatson.com
hurricane loss suffered by the insurance industry. This new record will break the previous record of roughly $20 billion set by Andrew in 1992; Andrew broke the previous record of roughly $4 billion set by Hurricane Hugo in 1989. Prior to Hugo, no single hurricane had cost the insurance industry more than $2 billion.
However, to make a fair comparison with Katrina, past losses must be adjusted to reflect the price levels and insured property exposure that exist today. The adjustments would include factors to reflect:
• Inflation. Obviously, past losses need to be adjusted to reflect the current purchasing power of the dollar.
• Real growth in property values. Property values have increased by more than inflation. The real value of residential and commercial property has increased substantially, as the real wealth of the nation has increased. For example, U.S. Census Bureau data indicates that the average size of a single family house has increased by more than 33% since 1975. The percentage of houses with two and a half or more bathrooms has gone from 20% to 52% over the same period. Houses also have more electronic equipment and appliances than they did 25 years ago.
• Growth in coastal properties. The U.S. population has migrated toward the south and west over the last four decades. More significantly, there has been a dramatic concentration of people and property in vulnerable coastal locations, in the form of both primary residences and vacation homes.
• Increased purchasing of property wind insurance. Wind coverage is more prevalent today than historically, due to the imposition of wind insurance requirements by mortgage lenders, the introduction of multiple peril package insurance policies and the creation of residual market wind pools.
Katrina, on the other hand, was relatively easy on Florida, making landfall just north of Miami as a category 1 hurricane. It then proceeded into the Gulf of Mexico, where it quickly became a category 5 storm in the unusually warm waters. It weakened slightly, but made landfall in a more densely populated area on the Louisiana/Mississippi border east of New Orleans as a strong category 4 storm. As shown in Figure 3, Katrina’s sustained winds at landfall were lower than those of Andrew (145 mph vs. 165 mph), but its hurricane-force winds covered a much broader area. The low-lying communities of the Louisiana, Mississippi and Alabama shores were devastated by the combination of wind and a storm surge of 29 feet in places. In New Orleans, which weathered the immediate rain and wind reasonably well, the flooding that resulted from levee breaches destroyed large portions of the city.
While Andrew came ashore as a stronger storm, it was more compact and did not strike a major metropolitan area directly. The addition of the resulting flooding in New Orleans and the significant damage to the offshore and onshore energy and chemical industries means that the damages from Katrina, both insured and uninsured, are virtually certain to be greater than those of Andrew.
Insured Losses From Katrina Compared to Prior Hurricanes
As we have seen with both Katrina and Andrew, the extent of property damage from major hurricanes can vary significantly depending on when and where landfalls occur in relation to population centers. Local topography and tidal conditions also play a major role in determining the extent of property damage.
The trend in insured losses from hurricanes appears bleak. Under almost any of the published estimates of its ultimate cost, Katrina will be the largest insured
Andrew Katrina
Duration as a tropical storm/hurricane Autust 17 – 28, 1992 Wide
Saffir-Simpson category at major landfall Category 4 (later regraded to 5) Category 4
Wind speed at major landfall 165 mph sustained 145 mph sustained
Width of hurricane force Approximately 120 miles Approximately 250 miles
Central pressure at landfall 922 mbar (hPa) 918 mbar (hPa)
Storm surge at major landfall 17 feet 15 to 29 feet
Fatalities 26 direct, 39 indirect 1,100 + (not final)
Area affected South Florida, Louisiana South Florida, Louisiana, Mississippi, Alabama, Florida panhandle
Figure 3. Andrew vs. Katrina: Overall impact

Hurricane Katrina: Analysis of the Impact on the Insurance Industry 8towerswatson.com
Of these four factors, our analysis indicates that the growth in coastal properties is by far the most significant. Inflation is actually a small component relative to the other three factors.
In 2001, we published a study3 that adjusted estimates of actual insured losses for hurricanes from 1900 forward for each of the above factors. That study indicated that there was no discernable trend in the historical levels of annual insured losses from hurricanes once the losses were adjusted for the factors described above.
Figure 4 shows the top 10 insured losses from past hurricanes from our 2001 study, with insured losses updated to 2005 so that they are comparable to those of Katrina. In the 20th century, there were 10 hurricanes that would produce insured losses in excess of $10 billion today. While we estimate that Katrina’s property losses will place it at the high end of the range, Katrina is not likely to be the biggest loss in real terms.
Modeling firms have also published estimates of the hypothetical losses that would occur today if events similar to those that happened in the past were to repeat themselves. These estimates are derived by applying their models to current levels of insured property exposures. For example, in a 2000 study for ISO, AIR estimated that if Andrew had made landfall just 25 miles farther north — in downtown Miami — losses would have exceeded $50 billion. Similarly, if Hurricane Gloria (only a category 2 storm) had made landfall in Brooklyn rather than Long Island it would have generated losses in excess of $16 billion. If the storm had been a category 4 rather than a category 2, the losses would have been roughly $39 billion. These hypothetical event results are generally consistent with our adjusted estimates of actual past losses.
The inescapable conclusion is that the issue isn’t the hurricanes themselves; rather it’s the buildup of insured property in exposed coastal areas. A study by AIR Worldwide estimates that the total insured value of coastal property in hurricane-prone states is now close to $7 trillion dollars.
Planning for Catastrophes
In addition to hurricanes, the insurance industry is exposed to catastrophic loss from other perils, both natural and man-made. While losses from these types of events have been significantly less frequent, they need to be considered in the context of the overall risk from catastrophe losses that the insurance industry faces.
Due to the infrequency of earthquakes and terrorist attacks, it is necessary to place greater reliance on the advice from the modeling firms as to the extent of potential insured losses from these perils. Actual losses can provide us with only anecdotal evidence. The modeling firms have performed similar “what if” exercises relating to hypothetical earthquake and terrorism events. These analyses indicate that insured losses from either of these perils could be substantial as well. Losses from reasonably foreseeable earthquakes or terrorist attacks could be $20 billion; more extreme but still quite plausible events could generate insured losses of $60 billion or more.
Even with all the historical data and science available, establishing the likelihood of catastrophic losses at a given level still requires considerable judgment. Taking the available knowledge into account, it would appear reasonable to operate under the assumption that the insurance industry will experience a U.S. catastrophic loss of at least $20 billion, on average, approximately every 15 years. While most of these losses will come from hurricanes, other perils will contribute occasionally. A larger loss of the magnitude estimated for Katrina would appear to be less frequent — but clearly more frequent than a one-in-100-year event. Insurers, investors, regulatory authorities and policymakers will need to adjust to this new reality.
Year Hurricane Major landfall Estimated insured losses at 2005 levels ($ billions)
1926 Number 6 Florida 65.3
1992 Andrew Florida 31.3
1900 Number 1 Texas 21.1
1915 Number 2 Texas 20.8
1965 Betsy Louisana 14.5
1928 Number 4 Florida 13.1
1919 Number 2 Florida 12.6
1938 Number 4 New York 12.4
1954 Hazel North Carolina 11.0
1909 Number 9 Florida 10.1
Figure 4. Insured losses from past hurricanes adjusted for inflation, growth in coastal properties, real growth in property values and increased property insurance coverage

Hurricane Katrina: Analysis of the Impact on the Insurance Industry 9towerswatson.com
Our estimates by major lines of business are shown in Figure 5. We expect the market to react to these losses somewhat differently from the way it did following the major losses of 1992 and 2001, when the rates were generally very soft. Now, the insurance market is coming off a three-year hard market with reasonable levels of industry profitability, although buyers were starting to get some relief this past year as the market began to soften. As a result of Katrina, we expect that this softening trend will likely reverse selectively, with particular hardening in rates for property catastrophe and property per-risk reinsurance along with energy and marine. “Safe” insureds outside heavily exposed areas may be courted by insurers seeking to shift the geographic distribution of their business, leading to some rate decreases. Coverage forms will be reexamined in order to increase clarity regarding covered perils and damages. In addition, there will be changes in the underwriting appetite of both insurance and reinsurance companies that could reduce coverage availability. However, the overall impact will vary by line of business, with more dramatic changes in the property and marine markets, and less impact (if any) in casualty lines. Also, coastal exposures will most likely see a reduction in capacity. Our estimates by line of business, along with the associated implications for the industry, are discussed in greater detail below.
Since Andrew, an ongoing issue for primary insurers has been the difficulty in passing the full cost of reinsurance on to their insureds. Both regulatory constraints and market conditions have been contributing factors. Because reinsurance prices are likely to remain high and some primary companies may conclude that they need to purchase additional reinsurance coverage, this issue may be further exacerbated. Ultimately, insurers and regulators will need to agree on a way to pass the market price of catastrophe risk on to the consumer.
The extent of the socialization of these costs will also need to be more openly debated. Should catastrophe costs be borne completely by those who have chosen to live in the most disaster-prone areas, allowing market forces to operate freely, or should those costs be spread over a broader base of insureds? Given the demand for beachfront housing, for example, this is a difficult decision for regulators and legislators.
Residential Property (Homeowners)
Insured Losses
Our estimate of the insured losses resulting from homeowners and personal property coverages is $14 billion to $17 billion. It assumes that direct damage from rising waters in the flooding of New Orleans will not be covered by homeowners policies. However, even beyond New Orleans flood losses, there is unusual uncertainty regarding the total loss as a result of certain assumptions that are required in developing an estimate.
In developing our estimate, we considered information released by individual insurers and by the professional hurricane modelers. The modelers offer a comprehensive early source of insured losses from the hundreds of thousands of homes damaged by Hurricane Katrina in the Gulf Coast, plus the Florida losses when Katrina was only a category 1 hurricane. However, the treatment of the various components of the total loss differs between the firms. We gratefully acknowledge the assistance of Applied Insurance Research (AIR), EQECAT and Risk Management Services (RMS) in responding to our questions.
Low High
Personal property lines
Residential property 14.0 17.0
Personal auto 1.0 2.0
Personal watercraft 0.2 0.3
Total 15.2 19.3
Commercial property lines
Commercial property (excluding offshore) 13.5 16.0
Business interruption (other than marine and energy) 6.0 9.0
Commercial auto 0.2 0.3
Total 19.7 25.3
Marine and energy 4.0 6.0
Liability 1.0 3.0
Other 0.0 1.0
Total all lines 39.9 54.6
Figure 5. Katrina insured losses
Line of Business Insured Loss Estimates and Implications

Hurricane Katrina: Analysis of the Impact on the Insurance Industry 10towerswatson.com
• Demand surge. Our estimates, as well as those of individual insurers and catastrophe modelers, include demand surge. The models were originally calibrated on past storms with some element for this additional cost, but a bigger storm creates a larger proportional demand surge. Because the damage from Katrina is so extensive, there is no relevant historical data. Andrew came close, but the modelers have been careful in the past to explain that their wind-speed damage factors do not try to replicate Andrew, but instead are a composite of 10 or so prior storms as well — all much smaller, with less demand surge. The modelers have estimated that the increase in costs due to this real-world display of the laws of supply and demand will be 20% or greater.
• Storm surge. Virtually all U.S. homeowners policies cover damage from wind and wind-driven rain (among other perils) but not flood. The damage from a hurricane’s storm surge is defined as flood damage and is, therefore, not insured unless the homeowner has also purchased flood insurance. However, when a property is damaged by both wind and storm surge, there is likely to be some ambiguity about how much of the damage arises from each cause of loss. Where it is present, this ambiguity has tended to be resolved in favor of the insured, i.e., the pure wind loss tends to be increased somewhat.
• We understand that the modelers’ estimates represent what the wind alone likely did to the houses in harm’s way, with some allowance for ambiguous losses. In fact, a number of houses on the coast, and even fairly far inland, sustained significant (if not complete) damage from the storm surge. The estimates assume that the claim adjusters will be able to distinguish the actual wind damage on a home from the water damage. This difficult task will be complicated by the fact that, across large portions of the coast, the only remains of buildings are foundations and steps. For a house still standing, there is evidence to look at, such as wind damage to a roof versus water marks in the living room, but settlement of total losses will be much more difficult.
• There was no coastal storm surge in the city of New Orleans and much less wind than on the right side of the eye. Approximately 80% of homes in the city and nearby suburbs sustained some level of flood damage as a result of the levee breaches. Since there is clear flood exclusion in the standard homeowners policy for coverages A and C (building and contents), we assume that little, if any, of this damage is covered by insurance.
• Because of the severe winds on the east side of the eye and the fact that much of the damage in New Orleans was caused by flood, the insured homeowners losses in Mississippi are likely to exceed those in Louisiana.
• Additional living expenses (ALE). Insurers may incur losses from the ALE coverage provided in homeowners policies. There has been discussion that the trigger for payment of ALE is the government’s order to evacuate, and many policies have a provision for some out-of-pocket expense for the time of the order, regardless of whether covered damage actually ensued. However, once the order is revoked, if there was no damage from a covered peril (namely wind, as opposed to flood), the duration of that mandated evacuation puts an effective cap on the size of the payment due under Section D of the standard homeowners policy. (There are also both time and amount limits on ALE in the standard policy forms.) Mold infestations that developed during the evacuation and when air conditioning was not available may increase ALE payments as well as losses.
• Extent and type of insurance coverage. There is also uncertainty regarding how many homes had a standard homeowners policy, versus dwelling extended coverage, versus no policy whatsoever.
Hurricane Katrina: Analysis of the Impact on the Insurance Industry 11towerswatson.com
Implications
Post-Katrina, primary insurance rates for this line will be scrutinized by carriers as well as regulators. A key question is whether the base rates have sufficient margin built in to pay for reinsurance, especially the higher renewal rates that are sure to come. The margins also need enough to cover the risk to the carrier that still retains some catastrophe risk, especially at the top end.
The homeowners market in the Gulf states is likely to experience the same turmoil that followed Andrew in Florida, with regulatory resistance to rate increases and restrictions on withdrawals, followed by proposals for state-run “facilities.”
Given the lawsuits by some and protests by others regarding the lack of flood coverage in homeowners policies, policy wordings will no doubt be reexamined, but it is unlikely that significant improvements can be made, given the clarity of the current language. However, this event has highlighted the need for further efforts to educate all stakeholders about coverage exclusions. In addition, the reasons why flood coverage is excluded must also be emphasized. Although the federal flood program is widely advertised, there appears to be some confusion about who should purchase it and what it covers. Insurers, regulators, legislators, agents and consumer groups together must address the problem of why so many potentially exposed insureds elect not to buy coverage.
The profile of consumer loss mitigation measures will likely increase in the Gulf area. In Florida, loss mitigation has been a major topic, and there has been much publicity and, indeed, government action to spur this activity. A mitigation class plan was part of the residual market’s major rate-level application five years ago, and the entire primary insurance industry was compelled to follow suit in 2003, when no homeowners rate-level filings were permitted without a companion class plan to recognize savings from a variety of identified and accepted loss mitigation devices.
Such an effort has not started in the Gulf states, perhaps because the threat was not perceived to be as great. Also, the estimated frequency of large storms was not as high, so the payback period for installed devices would have been longer than in southern Florida. Nevertheless, with greater public focus on the potential for loss, it is likely that some insureds would have taken steps to protect their homes, even with a
longer payback from reduced property premiums. (This assumes that the private market would have enough incentive to offer premium discounts if the base rates are still perceived to be inadequate for an unprotected house.)
We note that insureds with large homes in areas exposed to flood and storm surge may not be able to insure their property to value, as the federal flood program only offers $250,000 of coverage. Appetite for this peril among private insurers is generally limited, but there is some discussion of the possibility of offering excess flood coverage for high-value properties. To the extent that such a market develops, it should be part of the greater discussion of the social implications of supporting development in disaster-prone areas.
This may become part of a debate on the integration of flood (and possibly earthquake) coverage into homeowners policies, with government (federal or state) as a reinsurer or facilitator of reinsurance. Such a change would remove the policyholders from coverage disputes by making flood coverage mandatory, thus preventing lack of coverage, and preventing disputes between the flood insurers and homeowners insurers by making them the same company.
Personal Automobile and Watercraft
Insured Losses Unlike homeowners coverage, flood is covered under the automobile comprehensive coverage of standard U.S. personal auto policies. Our estimate of the insured losses resulting from personal automobile coverage is $1.0 billion to $2.0 billion (net of salvage). This range is based on information from individual companies and public sources, as described below.
Our estimate was developed using a frequency/severity approach or: (Number of claims) x (Average claim cost).
• Number of claims. There have been various published estimates of the total number of cars damaged by the second landfall of Katrina on the Gulf Coast, ranging from 460,000 to half a million vehicles. However, early estimates from insurers indicate approximately 200,000 to 250,000 claims industrywide.5 These two sources are generally compatible, since many of the exposed autos may not have been insured, as older vehicles tend to shed coverage as the actual cash value of the car

Hurricane Katrina: Analysis of the Impact on the Insurance Industry 12towerswatson.com
declines, and insureds instinctively begin to self-insure that risk. In addition, because banks are not as involved in the financing, the insured is free to cancel the comprehensive coverage part of the policy.
• Average claim cost. No early estimates of either claim severity or the proportion of total losses has been released, but all sources agree that the extensive storm surge and New Orleans flooding will cause a much higher proportion of totaled cars than other hurricanes have. To size the possible range, we assumed average severities ranging from $4,000 to $7,000. This range encompasses the possibility that up to half of the cars could be total losses. We also reviewed the estimates of the modelers, but note that hurricane simulation models do not usually contain a good estimate of personal auto losses because the vehicles are mobile. Given the usual early warning, many owners move their cars to avoid the storm’s effect. The extended coastal area exposed to Katrina means that personal watercraft losses will be relatively high. Recreational marine consists of yachts and smaller personal watercraft, including jet skis. Based on market reports and conversations with insurers writing this business, we estimate that there will be approximately 15,000 personal watercraft claims, with an average severity of $18,000. This generates a total expected insured loss of $0.2 billion to $0.3 billion.
ImplicationsLittle change in the personal auto market is likely as a result of Hurricane Katrina. While the number of vehicles damaged or destroyed is large, the losses relative to the size of the market are not significant.
The recreational watercraft market is closely linked to the private passenger automobile market, with the same major providers. Exposed boats may see significant premium increases. In addition, Gulf Coast insureds may begin to see a separate catastrophe deductible of 5% or 10% (based on the hull value). This was put in place almost universally in Florida following the four storms of 2004, and expansion of this requirement beyond Florida appears likely.
Commercial Property (Including Commercial Automobile)
Insured LossesOur estimate of the direct insured losses (excluding business interruption) to commercial properties from the combination of wind, storm surge and flooding is $13.5 billion to $16.0 billion. In addition, we estimate that there will be $0.2 billion to $0.3 billion of vehicular claims.
This is based on our own analysis and our interpretation of projections made by catastrophe modelers, as well as information obtained from the Insurance Information Institute and Merrill Lynch.It includes an implicit allowance for “sue and labor” claims (i.e., for insureds’ costs in trying to protect their property from damage or additional damage).
Unlike homeowners, flood coverage can be purchased from commercial property insurers under certain conditions. However, there is no reliable information about the take-up rate for commercial flood coverage. As a result, considerable uncertainty exists around this estimate.
A significant part of the estimated loss is due to the destruction on the Mississippi coast, where nine casinos were heavily damaged. In addition, many hotels and other businesses critical to the tourism industry in both Mississippi and New Orleans were badly damaged.
This storm also had a disastrous impact on the commercial vehicle fleets in the affected area. Because Katrina hit over a weekend, when many businesses are not open, it increased the likelihood that commercial vehicles were left in their normal weekend garaging locations, with reduced opportunity to drive them out of the storm’s path. Consequently, we are projecting that as many as 20,000 commercial vehicles were totally or severely damaged. In addition, business vehicles are, on average, more expensive than personal vehicles. However, the physical damage deductibles in commercial policies are typically much higher than those selected by individuals, and many businesses do not purchase physical damage on their fleets at all. We are estimating insured losses of $0.2 billion to $0.3 billion under commercial auto policies.
Hurricane Katrina: Analysis of the Impact on the Insurance Industry 13towerswatson.com
ImplicationsWith renewal season immediately following a difficult hurricane season, it is reasonable to expect significant price increases in the overall property and business interruption markets. If developing losses exhaust the catastrophe reinsurance covers of the primary insurers, the re-underwriting and upside pricing pressure could be even more severe. However, clean commercial insureds outside of disaster-prone areas may find some decrease in rates as competition for less risky business intensifies. Like personal auto, the commercial auto market will see little change.
Business Interruption (Excluding Marine and Energy)
Insured LossesOur estimate of insured losses resulting from business interruption is $5 billion to $9 billion. In developing this estimate, we considered both business interruption and contingent business interruption losses. Because of the importance of the port of New Orleans, many companies throughout the country will be affected indirectly by Katrina, but very few buy contingent business interruption coverage (probably less than 3%). The take-up rate on business interruption coverage is a critical but uncertain component of the estimate. We believe less than half of the loss is insured.
In total, it is not unreasonable to project that Katrina will cause disruption of commerce, including the contingent business impact referenced above, equivalent to almost 100% of the commercial trade in the affected region for an average of four months. Annualized commercial trade in the region was approaching $100 billion before Katrina hit. However, a large part of this is not covered by business interruption insurance. Furthermore, even where there is insurance, time element waiting periods, coverage exclusions, time limits on coverage and other factors will reduce the actual insured amount.
ImplicationsUnlike earlier natural catastrophes, business interruption losses are a significant part of the total loss for this event, as they were for the 9/11 attacks. In the past, underwriting focused on the potential property damage losses, and business interruption was considered companion coverage. In the future, insurers will pay closer attention to evaluating the potential for business interruption losses. In the immediate future, there may be some rate increases and tighter underwriting for business interruption, but not to the same extent as for pure property lines.
Marine and Energy
Insured LossesOur estimate of insured losses resulting from the marine and energy businesses (including business interruption) is $4.0 billion to $6.0 billion.
Commercial marine includes tugs, barges, oil field service vessels, fishing vessels, port facilities, cargo, ship repairers and any associated liability exposures. (Gulf Coast casino boats were generally covered by commercial packages, rather than marine policies, and so are included in our commercial property estimate.) Due to its unique location at the mouth of the Mississippi River, with easy access into the Gulf of Mexico and possessing a natural harbor with excellent water depth, New Orleans is the major port of entry or exit for all sorts of commodities necessary for the agricultural and industrial Midwest. Shippers of products such as grain, coffee, sugar, steel, fruit, oil and natural gas rely on the port, and its easy and cost-effective river transport system to move these large-volume commodities around the U.S. and the world. Thus, a large marine infrastructure needed to handle the cargo, and repair and maintain the vessels, was exposed to the hurricane.
While the ultimate loss for the commercial hull coverage remains unclear, it appears that the storm has affected only a relatively small number of commercial tugs, barges and service vessels. Commercial fishing fleets have also suffered from this event. It is reported that there was damage to a significant portion of the Vietnamese shrimp fleet, some 200 vessels strong, which operates out of Louisiana and eastern Texas. Other fishing fleets, including the oyster fleets, have also been affected.
The port itself appears to be relatively lightly damaged. Port officials visually surveyed the port, storage facilities and waterways 10 days after the event, and reported minor damage to several cranes and damage to some warehouses (including water ingress at several). They found that the dockside water depths are all in excess of 36 feet. From this, it appears likely that the port is in a position to physically resume operations after power is restored. The most serious concern will be the number of available workers. Many former port workers, stevedores, mechanics and logistics personnel have left the area. Given the lack of basic services in the area, it is unlikely that they will return for some time. This could delay operations at the port, triggering potential insurance claims on delay- of-delivery sections of many cargo policies.
Hurricane Katrina: Analysis of the Impact on the Insurance Industry 14towerswatson.com
With respect to cargo losses, the situation is both more uncertain and expected to be more severe. Cargos such as coffee, sugar, fruits, vegetables and grain will be declared total losses if they came in contact with water. It is feared that at least three warehouses, two storing coffee and one sugar, have had serious water ingress. In addition to the effects of water, winds could have affected several large distribution centers for major retailers like Wal-Mart, Kmart and Home Depot, the contents of which are usually covered under cargo policies. Many producers carry delay-of-delivery/business interruption policies, which will increase the insured loss if they are unable to deliver their goods due to damage at the receiving warehouses. If the cargos were damaged in transit, insurers of shippers may be held responsible for shipments under the cargo legal liability section.
In addition to the port itself, ship repair yards and marinas have sustained damage to their facilities. In the repair yards, in addition to the facilities damage, vessels that came loose while under the care of repair yards may raise liability claims to the yards. Many marinas in the Louisiana, Mississippi and Alabama coast regions were damaged, and at least five were completely destroyed.
The offshore energy sector has significant exposure on the Texas and Louisiana Gulf Coast (Figure 6). The offshore energy insurance business can be broken down into four segments: production platforms, drilling rigs, pipelines and the associated business interruption.
Production platforms are rigid structures fixed to the seabed to extract oil and natural gas from the ground and deliver it into the refining chain. There are more than 2,000 production platforms throughout the Gulf, and approximately 250 of these units were potentially affected by Katrina. Thirty-eight platforms sustained damage; of those, 18 were completely lost, and another 16 incurred major damage. Most of the lost platforms were older units operating in shallow waters near the coast and generating smaller amounts of oil. Excluding the two discussed below, the damaged platforms generated less than 1% of the daily Gulf of Mexico oil production. Replacement cost for these units will vary between $10 and $20 million per site, and it is likely that some units will not be replaced. The losses associated with these platforms will result from both physical damage and possible claims for wreck removal.
The Shell Oil Mars tension leg platform and its sister platform will be the biggest energy losses. Prior to Katrina, their output was approximately 225,000 barrels of oil per day, representing almost 6% of the total daily oil output from the Gulf. The extent of damage to this facility is severe. With an insured value approaching $500 million for the Mars platform alone, this will be the largest single loss emanating from the Gulf. It is expected that this platform will be offline for a minimum of three to six months, almost certainly triggering any business interruption coverage in force.
Drilling rigs are mobile units that are used for drilling and exploration. Since they float, rigs are subject to greater loss from the actions of wind and waves. There were approximately 100 rigs in the footprint of the storm, but only 58 were exposed to wind speeds in excess of 75 mph. Several of these are likely to be total losses.
Unlike Hurricane Ivan, which did extensive damage to undersea pipelines, Katrina does not appear to have caused the same undersea mudslides and therefore is not expected to create significant pipeline claims.
Business interruption losses in the energy industry are particularly challenging to estimate since there are many factors and unique policy wordings associated with each operator and drilling contractor that purchases this cover. After Hurricane Ivan in 2004, business interruption represented almost two-thirds of the ultimate paid loss for the offshore energy market. It is likely that business interruption claims from Katrina will be similar to Ivan in dollars (although less as a percentage of the total loss), due to widespread platform damage, bottlenecks in refining capacity, and damage to the onshore pumping stations servicing the undersea pipelines.
ImplicationsEffects in the commercial marine market will vary by line. Commercial hull coverage may not see noticeable rate changes because the losses were small and localized, although there may be some capacity restriction arising from losses in other classes of marine business. However, changes are anticipated in the commercial cargo coverage options that will be offered to insureds. Cargo, shipyards and builder’s risk coverages are all likely to see significant price increases, with some restriction in capacity.

Hurricane Katrina: Analysis of the Impact on the Insurance Industry 15towerswatson.com
Given two consecutive multibillion-dollar losses, the offshore energy market will experience significant changes as a result of Katrina. Significant price increases are likely, even for policyholders without losses. Coverage for others might be placed only with event limitations. Business interruption coverage will be more standardized, with potentially dramatic rate increases and a reduction in overall market capacity. Much of the capacity reduction will be reinsurance, thereby forcing the remaining insurers to offer lower limits and higher rates to their insureds.
The reinsurance market is likely to bear 50% or more of the final marine costs of Katrina. Following the losses from Ivan in 2004, marine reinsurers believe they have surrendered all the profits earned on the ocean marine business in the preceding 20 years. Senior management will no doubt ask their marine underwriters what they can do to prevent a reccurrence. First and foremost, prices are likely to rise, even for clean renewals. Clients with losses will almost certainly have both restrictions in cover and additional price increases. More important, the way in which clients purchase marine reinsurance may change significantly. For years, non-marine reinsurers have required that their clients purchase separate per-risk and catastrophe protections, but marine reinsurance programs can still be structured to protect a portfolio from both per-risk and catastrophe losses in the same vertical tower. Marine reinsurers may change the structure of their offerings, which would translate into increased reinsurance expenditures and larger retentions for primary carriers.
Liability
Insured LossesOur estimate of insured losses resulting from all liability lines of business is $1.0 billion to $3.0 billion, including defense costs. This includes directors and officers liability, professional liability, environmental liability and general liability. Although there are exposures known today that could potentially result in lawsuits, the unknown potential exposures create a large amount of uncertainty around this estimate.
The largest portion of our estimate is derived from the potential liability of hospitals and nursing homes for patients whose conditions worsened during and after the storm, although there may be a slight increase in exposure from physicians practicing out of state on a temporary basis. Fifteen hospitals were located in Louisiana ZIP codes affected by the storm, and there were three hospitals in Alabama and one in Mississippi in storm-affected ZIP codes. In addition,
there were 27 nursing homes in New Orleans proper and many more in the surrounding areas. In the New Orleans area, people died in nursing homes and hospitals that were severely crippled by the storm. Given that Louisiana’s frequency of physicians’ losses is 50% higher than the national average, we believe it is inevitable that lawsuits will be filed. The Louisiana Patient Compensation Fund provides for a $500,000 cap on noneconomic damages for all medical providers that participate with regard to professional liability. However, this liability could fall under general liability policies and therefore would not be capped.
The large number of potentially uninsured losses due to flood and storm surge, as well as other discussions of the proximate cause of property losses, has created a “buzz” that may lead to suits alleging negligence by insurance agents. In the face of potential financial ruin, residents without flood insurance will look for deep pockets. If filed, these suits will be covered by agents’ professional liability policies. This potential exposure exists across the entire affected geographic area.
We believe there will be very few insured public entity liability losses. Governmental entities at all levels — local, state and federal — have been faulted for their response to this storm. In an insurance context, the questions center on how government immunities and tort laws will apply, and whether the entities are self-insured. We believe that the activities performed by the state and federal government entities will fall under their immunity protections as nondiscretionary duties. The smaller and medium-sized cities along the Mississippi and Alabama Gulf Coast likely purchased insurance coverage, although the larger of these would tend to have significant self-insured retentions. However, there are no significant reports of response failures in these jurisdictions. New Orleans, on the other hand, has been criticized, but likely is self-insured.
The storm has created long-term environmental damage. It has been reported that a total of more than 6.5 million gallons of oil were released from four different facilities, along with numerous smaller spills, the source of which may be impossible to locate. (By comparison, the Exxon Valdez spilled 11 million gallons, and the cleanup cost to Exxon was more than $2 billion.) There are four federal Superfund sites in or near New Orleans that may have been disturbed by the storm. There were over 450 industrial sites that had storage facilities containing highly toxic chemicals along the Gulf Coast in Louisiana, Mississippi and Alabama. The flood waters from New Orleans have been dumped back into Lake Ponchartrain untreated. The Louisiana Department of Environmental Quality has referred to these waters, which contain a mixture of garbage, raw sewage, petroleum products from various sources, pesticides and other chemicals, as a “bacterial soup.”
Hurricane Katrina: Analysis of the Impact on the Insurance Industry 16towerswatson.com
It is unclear whether the pollutants can be traced back to their origins and, if so, how much of the cleanup cost will be covered by insurance. We believe that very little of the cleanup costs will be insured. Environmental impairment liability coverage is available from a number of specialized markets, but can be costly. As a result, many entities with potential pollution cleanup liabilities may be self-insured for this exposure. Pollution exclusions in the standard general liability policy will prevent the indemnity costs from being covered under these policies. Some defense costs and a small portion of the cleanup costs may be borne by the insurance sector.
The unique losses produced by this storm create the potential for shareholder and other suits against the boards of publicly traded companies. Boards may be taken to task for lack of preparedness for such a catastrophic storm, for not having enough insurance in place or for poor execution of existing risk management plans. In spite of business interruption coverage, earnings will be negatively impacted across many different industries, including oil, fishing, retail and tourism. Shareholder suits are costly to defend, and those that do result in damages have very high average severity. On the other hand, we note reports of outstanding preparation by large companies in multiple sectors. Andrew, 9/11 and the 2004 quartet of Florida hurricanes have clearly resulted in improved corporate awareness of the need for realistic disaster planning. To the extent that such preparedness was widespread, it will act as a defense against such lawsuits.
There are a number of other potential, but difficult to quantify, exposures. What class action suits will be filed? One has already been filed against oil companies alleging destruction of the wetlands protecting New Orleans by their system of pipelines. Will attorneys be sued for records lost in the flood or if the statute of limitations runs out during the time the attorney was out of business due to the storm? Will reinsurance brokers be sued if their client purchased insufficient catastrophe cover? Will any of these or other potential exposures be covered by insurance? We acknowledge a large element of uncertainty in our liability estimates, but nonetheless believe that liability will be a minor part of the overall insured loss.
ImplicationsLiability markets should not see dramatic price increases, but liability underwriters may pay closer attention to insureds’ disaster preparedness and recovery, and to the effectiveness of risk management programs. This is particularly true in the health care industry.
Although not affecting the liability market immediately, the extensive uninsured flood loss produced by Katrina (and the resulting potential E&O losses) will likely lead to improved education regarding the National Flood Insurance Program.
It is also possible that pricing will increase and underwriting criteria will be stepped up for specialized environmental liability as a result of the apparent oil leaks and chemical spills that resulted from the flooding in New Orleans.
Financial Guaranty, Credit and Surety
We do not believe that meaningful estimates can be developed for this sector at this time, since there is still significant uncertainty about the broader economic effects of Katrina, including the extent and timing of rebuilding.
While the four major credit insurers are exposed to over $11 billion in municipal bond issuances in the affected area, it is unlikely that any losses from this section of the industry will add measurably to the total loss. In past disasters, when insurers had to pay missed bond payments on behalf of the municipality, they typically recovered these amounts in the future. There is also potential exposure for guarantors of corporate and general revenue bonds in cases where the underlying revenue streams are sufficiently impaired to lead to default.
Private mortgage guarantors may also sustain losses, but these are not quantifiable at this time. The widespread destruction of residential real estate may lead to an increase in mortgage defaults. With the combination of uninsured and underinsured properties, there is the risk that homeowners with little equity in their homes and no coverage for their damages will walk away and leave mortgage insurers to cover the defaults, bringing otherwise uninsured losses into the insurance system.

Hurricane Katrina: Analysis of the Impact on the Insurance Industry 17towerswatson.com
Market Percentage Amount
Insurers 47% to 53% $18.8 to $28.9
Reinsurers 52% to 44% $20.7 to $24.0
Capital markets 1% to 3% $0.4 to $1.6
Total 100% $39.9 to $54.6
Figure 7. Hurricane Katrina insured loss by market ($ billions)Splitting the Insured Loss: Insurers, Reinsurers and Capital Markets
Based on our estimates of the loss by line of business, we believe that insurers will retain 47% to 53% of the total insured loss, with the reinsurance market absorbing 52% to 44%, and only 1% to 3% going to the capital markets (Figure 7). Our discussions with reinsurers support this estimated split.
This is a very different outcome from the estimated division for the four Florida hurricanes in 2004, when approximately 25% to 35% of the losses went to reinsurers. This is the case because Katrina was basically a single large event rather than four smaller ones, and most reinsurance programs have only one reinstatement, unless a third event cover has been purchased. With a large event, most property catastrophe reinsurance programs will attach and only one deductible will be required. In the case of four discrete events, insurers had to exhaust four separate deductibles and may have been left unprotected after the first two hurricanes.
It is important to note that the share of the loss ceded to reinsurers will vary widely across the universe of affected direct insurers, for many reasons, including:
• Retentions (including co-participation) generally increase with the size of the insurance company. However, individual insurers select their retentions based on their own analyses of their need for capital protection and their level of risk aversion. In fact, our estimate of the share of the loss going to the reinsurance market would normally have been higher, but we are aware that at least one heavily affected insurer group retains most of its exposure to loss, and several others appear to have losses exceeding their reinsurance protections.
• During the 2005 renewals, some primary insurers may have been able to purchase 96-hour coverage, which would allow their Florida losses from Katrina to be included in the Gulf Coast event. If they have the usual 72-hour clause, Florida claims, while being considered the same Katrina event, would not be covered due to the time limitation and would, therefore, be part of the net loss.
• Contract wording may lead to discussions about the number of events within the overall Katrina loss (e.g., whether the wind loss is a separate event from the levee breaches and the ensuing flood). However, our discussions with insurers and reinsurers indicated that most currently consider the Gulf claims from Katrina to be one event.
• Heavily affected insurers may not have purchased sufficient reinsurance and may be back in on top of their protections, so that any increases in their losses will be held net.
• Wording of exclusions on reinsurance programs differs by contract and may differ from that of the underlying policies. Reinsurers usually follow the fortunes of the insurers. Where contract wording is weak, however, it is possible that the reinsurance market may take a stronger stance on the flood element and try to exclude flood loss if the flood exclusions under the insurance policies do not hold up in court. The success of this approach will depend on the exact wording of the reinsurance contracts.
Capital Markets
There are two main sources of capital market involvement: catastrophe bonds and industry loss warranties (ILWs).
Based on the current bid-ask quotations for catastrophe bonds, it appears that the capital markets do not expect that these bonds will be affected by Katrina, as most bonds are trading around par. There could be a number of reasons for this lack of departure from par:
• Most cat bonds are in the top layer of catastrophe programs, making them less likely to pay.
• Most cat bonds provide coverage only for modeled exposures. Under normal circumstances, none of the three modeling firms used for cat bond assessment include flood losses in the models. As a result, this exposure is typically excluded from the protection, even though it may be a covered loss under direct policies, such as automobile and some commercial property. There has not been a demand to change this, since the common wisdom is that larger hurricanes move faster and spread rain over a larger area, thus causing less flooding. Katrina has clearly demonstrated that exceptions always exist.
Hurricane Katrina: Analysis of the Impact on the Insurance Industry 18towerswatson.com
• Linked to the previous comment, most cat bonds are for personal lines, where flood exclusions are the norm, thus further reducing the need for the cover.
• At the time of writing, there appears to be a lull in the trading of cat bonds. Information about the storm is still evolving, and there is some worry from the cat bond traders that the reinsurance market may have better models, data and analysis, thereby giving them better insights about the potential size of the loss and the resulting probability of the different cat bonds being attached. Based on this information, the reinsurers could be able to execute advantageous trades. The other owners of cat bonds prefer to wait until the information is more widely available. As a result, there is a “wait and see” situation in cat bond trading.
Another source of capital market support comes from ILWs, which are linked to the market loss as a whole or to some segment of the market (e.g., marine losses). This market loss is generally determined by a third party such as Property Claim Services. While many of these contracts are sold by reinsurers, hedge funds have recently entered the market, viewing the contracts as an easy way to take on insurance-related risk. Most ILWs have attachment points around $20 billion to $25 billion, but some attach as low as $15 billion and as high as $40 billion, so we expect that most ILWs will pay out if the industry losses are within our range. However, the total market investment for all-risk U.S. exposure ILWs is only approximately $1.5 billion. As a result, we expect that the ILWs will pay for only a small share of the insured loss. It is impossible to determine how much of this will come from reinsurers versus hedge funds.
The London Market
Katrina will significantly affect Lloyd’s of London and the greater London market due to their sizable participation in U.S. risks. The exposure is driven more by commercial risks than personal risks, with the majority of losses from onshore and offshore energy, property catastrophe, business interruption and marine cargo. For the most part, these come into London through reinsurance, retrocessions and direct lines on large commercial risks.
Lloyd’s has announced that its expected losses from Katrina will be approximately $2.55 billion. (This is net loss after reinsurance recoveries from reinsurers outside Lloyd’s.) This makes Katrina one of the largest single losses to the market to date, but at this level of loss, it is not expected that Lloyd’s in total will have a solvency issue. The impact on individual syndicates will be determined as further loss estimates develop. As part of its risk management activities, Lloyd’s creates Realistic Disaster Scenarios, one of which was a Gulf of Mexico windstorm. Lloyd’s has announced that the estimated loss to the market “is consistent with that model.”
An immediate challenge to the market is the funding of U.S. trust funds that U.S. regulators require of many alien insurers and reinsurers. Funding must be completed by September 30, but the loss from Katrina at that time was still very uncertain, particularly in the layers written by London. Thus, it is not clear what the funding requirements should be. (This mirrors the difficulties that all affected insurers will have in preparing their third quarter financial reports.)
Some increase is likely in reinsurance rates in general, with significant rate hikes for energy risks in the worst hurricane-affected areas. There is now open discussion that insured risks in the Gulf of Mexico region have been structurally underpriced and that rates need to rise to make the business economical for the insurance industry as a whole. However, recent boon profits for oil producers have undoubtedly put some of them in a position to look hard at the alternatives to insurance if they consider the terms to be too onerous.
Market wisdom is that 75% of the global catastrophe losses to the London market come from U.S. insureds, but only about 50% of the premium. It seems likely that the market will act to reduce the imbalance. Because foreign insurers and reinsurers are not subject to the same on-the-ground regulatory pressures as U.S. domiciled companies, they will likely take harder stances regarding expansion of coverage and noncontractual payments. This may lead to disagreements over the “follow the fortunes” clause of reinsurance contracts.
Hurricane Katrina: Analysis of the Impact on the Insurance Industry 19towerswatson.com
Essentially all insurers writing any property coverage in the southeastern U.S. and most reinsurers across the globe will have losses stemming from Katrina. The top 10 insurers with exposure to Katrina, based on 2004 market shares for personal and commercial property lines in Louisiana, Mississippi and Alabama, are State Farm, Allstate, Southern Farm Bureau, St. Paul Travelers, AIG, Zurich, CNA, Nationwide, Liberty Mutual and Allianz.
However, the financial impact on an individual insurer is a function of many factors in addition to exposure through direct policies written in the area. Some of the exposure would have been passed on to reinsurers, but the amount that is ultimately reinsured varies widely among insurers. Since data on the amount and type of reinsurance purchased by each company are not routinely published, it is difficult to estimate how much of the direct exposure is retained versus transferred to reinsurers. Capital adequacy and availability are also important factors, since even large losses will be more easily absorbed by a company that has adequate capital or that can raise capital easily. Rating agencies and the stock markets are already trying to sort out these effects.
Rating Agency Activity
As one would expect, the rating agencies are keeping a watchful eye on the financial impact that Katrina will have on the insurance industry. Their interest has and will continue to focus on the following areas:
• The estimated loss of capital that individual companies will suffer relative to the indicated capital required for their current rating
• The levels of loss that individual companies suffer relative to their peer group of companies. In this regard, the rating agencies will review the level of risk management that was practiced at each company. In addition, the rating agencies will assess which companies actually practiced diversification of risk that they assumed
• The availability of new capital to replace the losses caused by Katrina
• The company’s ability to take advantage of any potential future price increases
Rating agencies have taken specific actions on a number of companies to date. Standard and Poor’s (S&P) has placed eight companies on credit watch with negative implications. (One was removed from credit watch after raising capital and given a negative outlook). The stated reasons for S&P’s credit watch actions included the following:
• Uncertainty regarding ultimate losses • Lower earning expectations • Potential for material adverse financial impact on capitalization
• Lack of diversification and thus disproportionate exposure
• Uncertainty with regard to operational performance within the range mandated at the company’s current rating level
In Appendix A, we provide a current list of announced rating agency actions. As that list shows, S&P has downgraded Alea, PXRE and the Advent Syndicate 780, in addition to putting eight companies on credit watch with negative implications. For Alea, the downgrade brought it to a level below the important A category. The downgrade may have been a result of both pre-Katrina and Katrina loss activity.
However, regardless of its exact cause, the action was a catalyst for the company’s board to indicate that it would reevaluate new business written to reflect its lower rating or perhaps put the company up for sale.
A.M. Best has also announced significant actions. In addition to downgrading both Alea and Olympus Re to below the A category, A.M. Best also downgraded PXRE. Further, the A.M. Best analysts have placed 22 companies under review with negative implications. In addition, three companies (American Re, Munich Re and Transatlantic Re) previously under review remain under review subject to potential downgrade and are on notice that A.M. Best’s review will focus on their exposure to Katrina losses. Moody’s is expected to take similar action as Katrina’s loss estimates begin to accumulate.
The Insurance Market: Broader Financial Implications

Hurricane Katrina: Analysis of the Impact on the Insurance Industry 20towerswatson.com
As of this writing, both Montpelier Re and ACE have had their ratings affirmed and been removed from credit watch as a result of raising additional capital. PXRE also raised additional capital but was downgraded by both rating agencies. The capital raised by PXRE and Montpelier Re (approximately $1 billion in total) was roughly equal to the sum of their announced Katrina losses, while ACE raised a greater amount. In spite the magnitude of Lloyd’s announced loss, A.M. Best believes that Lloyd’s overall capitalization position post-Katrina remains supportive of its current financial strength rating of A (excellent) and insurance claim-paying rating of “a,” which remain unchanged at this time.
In addition to the mainstream insurers and reinsurers, there are some niche specialists and group captives that will also be financially impacted by Katrina. These specialists include companies backed by specific industries with a heavy concentration of risk in the area. In particular, the oil industry may be hard hit by the number of offshore oil rigs that were damaged or destroyed.
Since they are generally smaller companies, single-parent captives could be at risk for substantial losses from an event this size. However, captives are generally used by companies to write liability and workers compensation insurance, rather than property coverages. Therefore, the exposure to most captives is expected to be limited unless large liability losses result.
Stock Prices
The equity markets post-Katrina have reflected individual companies’ prospects for future growth and profitability. Since Katrina will likely impact specific companies and segments of the industry differently, it is not surprising that insurance industry stocks have not reacted in a uniform manner.
Despite a negative move immediately after Katrina, insurance companies in general have experienced a modest rise in their stock prices. Some companies are poised to take advantage of expected price increases while estimating losses within the range of one-half to a full year’s earnings. Their stocks have appreciated in the low single digits. Clearly, if losses escalate, these stocks will respond negatively to both possible rating agency action and/or required capital raising that will dilute future earnings per share.
A few insurers and reinsurers have suffered significant equity price declines since August 29, 2005. For Goshawk, Montpelier Re and PXRE, the declines exceeded 20%. Five other companies experienced losses of approximately 10% of their pre-Katrina stock prices. These companies either anticipate a disproportionate loss of their capital as a result of Katrina losses, have suffered a rating agency watch or downgrade, or have or will be forced to raise capital, which will dilute future earnings per share.
On the other hand, insurance broker stocks have all moved higher since August 29, 2005. The biggest gain was made by Willis Group, whose stock price has appreciated by low double digits since Katrina. Other large brokers also experienced gains in the range of high single digits over the past few weeks. This movement appears to be in reaction to the expected positive impact on insurance and reinsurance pricing, which can only help the brokers’ bottom lines.
Will Katrina Trigger New Market Entrants?
Both Andrew (1992) and the terrorist attack of 9/11 (2001) led to a number of new insurers and reinsurers entering the market. It now appears that Katrina’s insured losses will exceed each of these earlier events. However, in order to evaluate the prospect for new industry capital, it is necessary to review the insurance market place in both 1992 and 2001, and the actual impact that Andrew and 9/11 had on those markets.
Both events produced insurance industry losses for property and business interruption of approximately $20 billion. (In addition, there were approximately $15 billion of additional nonproperty losses from 9/11) Both events occurred after a period of soft insurance industry pricing, and the losses, therefore, caused reductions in the balance sheet capital of many companies, which greatly reduced their capacity for future risk assumption. This led to the belief that much stronger pricing would result, followed by the entrance of new capital. After Andrew, six new property cat reinsurers were formed. In addition, a number of primary insurers were eventually created to fill the homeowners void in Florida. After 9/11, eight new Bermuda multiline companies were created, attracting approximately $8 billion of new capital to the industry.
Will Katrina act as another catalyst for new capital
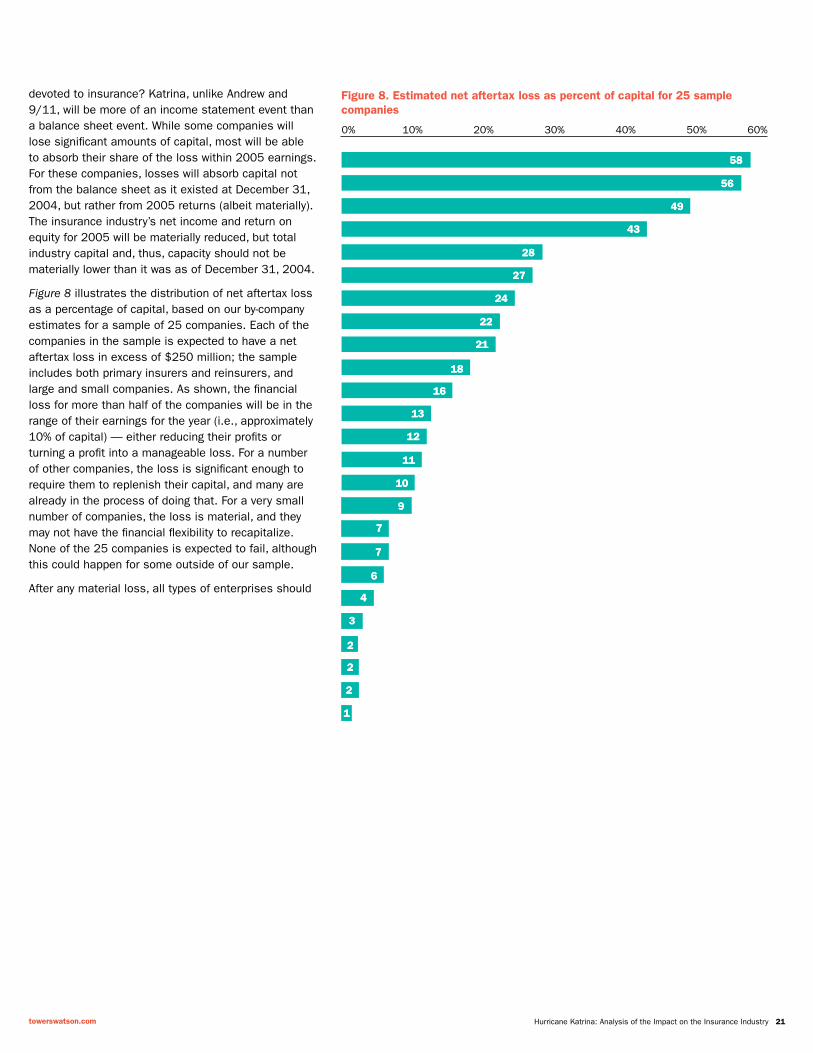
Hurricane Katrina: Analysis of the Impact on the Insurance Industry 21towerswatson.com
devoted to insurance? Katrina, unlike Andrew and 9/11, will be more of an income statement event than a balance sheet event. While some companies will lose significant amounts of capital, most will be able to absorb their share of the loss within 2005 earnings. For these companies, losses will absorb capital not from the balance sheet as it existed at December 31, 2004, but rather from 2005 returns (albeit materially). The insurance industry’s net income and return on equity for 2005 will be materially reduced, but total industry capital and, thus, capacity should not be materially lower than it was as of December 31, 2004.
Figure 8 illustrates the distribution of net aftertax loss as a percentage of capital, based on our by-company estimates for a sample of 25 companies. Each of the companies in the sample is expected to have a net aftertax loss in excess of $250 million; the sample includes both primary insurers and reinsurers, and large and small companies. As shown, the financial loss for more than half of the companies will be in the range of their earnings for the year (i.e., approximately 10% of capital) — either reducing their profits or turning a profit into a manageable loss. For a number of other companies, the loss is significant enough to require them to replenish their capital, and many are already in the process of doing that. For a very small number of companies, the loss is material, and they may not have the financial flexibility to recapitalize. None of the 25 companies is expected to fail, although this could happen for some outside of our sample.
After any material loss, all types of enterprises should
0% 10% 20% 30% 40% 50% 60%
5858
5656
4949
4343
2828
2727
2424
2222
2121
1818
1616
1313
1212
1111
1010
Figure 8. Estimated net aftertax loss as percent of capital for 25 samplecompanies
99
77
77
66
44
33
22
22
22
11
Hurricane Katrina: Analysis of the Impact on the Insurance Industry 22towerswatson.com
look at their risk management processes as part of the risk management control cycle, identifying what worked and what didn’t, and taking corrective actions as needed. Rating agencies will ask insurers pointed questions about their financial and operational preparedness, so these reviews will go beyond an internal exercise. We anticipate an increased emphasis on identification and management of risk concentrations, capital adequacy and appropriate reinsurance protection. For example, S&P recently announced that, among other changes to its rating process, it intends to explicitly review companies’ approaches to managing their portfolio of risks.
Exposure Management
Since Andrew, the insurance industry has significantly improved its ability to monitor geographic exposure accumulations. Companies have developed geographic databases that contain their current inventory of insured exposures with details as to the locations and types of structures, as well as insured values. These databases can be linked to geographic mapping systems that allow companies to visualize the extent of their exposure in any particular area, providing underwriters with an electronic pin map to replace the manual pin maps used since the 19th century by fire underwriters to manage conflagration risk. (After 9/11, workers compensation underwriters added covered lives to their geographic exposure databases so that they could monitor concentrations of insured workers as well as property.)
Most property reinsurers require detailed extracts from the exposure databases of their customers so that they, too, can have a clear picture of their accumulated exposure.
Working with the various catastrophe modeling firms or their own proprietary models, insurers and reinsurers can use exposure databases to estimate losses that might arise from various types of hypothetical catastrophes. These exercises are a critical underwriting control for insurers and reinsurers. The results also play a major role in decisions on how much reinsurance coverage to buy.
One test of the success of these exposure management activities is the number of insolvencies that are precipitated by a catastrophe. After Hurricane Hugo in 1989, roughly a dozen insurers were financially overwhelmed by the claims and ultimately failed. Generally, these were smaller regional insurers that had not purchased sufficient reinsurance to protect
themselves. At the time, exposure management of the type described above was virtually nonexistent, and therefore insurers did not appreciate the extent of losses that could arise from exposures that were geographically concentrated in a single area. After Andrew, many insurers suffered extensive losses, and nine of them failed. Even some very large carriers were stressed to the limit. State Farm Fire received a cash infusion of almost $4 billion from its mutual auto insurance parent, and Prudential Property & Casualty got a reinstatement of its lost $1 billion of surplus from its parent life insurance company.
As of this writing, there have been no reports of insurance company failures as a result of Hurricane Katrina. If this situation holds true, it represents a clear indication of improvement in catastrophe risk management. However, given the uncertainty, it would be premature to draw a definitive conclusion in this regard.
The adequacy of reinsurance programs would be a more stringent test of the success of catastrophe risk management activities. In this case, the results may not be as positive. As reported losses continue to grow, a significant number of primary companies will likely exhaust their reinsurance coverage and be back in on top. Similarly, a number of reinsurers are likely to exhaust their retrocessional coverage. The extent to which this happens depends on the magnitude of the ultimate insured losses from Katrina.
The implication is that there is still room for improvement in industry risk management practices.
• For some companies, the exposure data still aren’t good enough. While not an issue for most personal lines insurers, exposure data for commercial lines still suffer from shortcomings. Property associated with large commercial accounts operating at many locations is sometimes not captured in sufficient detail. In addition, the terms associated with business interruption coverage are often not recorded. These issues hamper the ability of commercial insurers to measure the loss potential arising from these types of exposures.
• The models aren’t perfect. While the hurricane catastrophe models use all the available science and technology, they are far from precise measurement tools. Historical data are quite sparse, which means that significant judgment is involved when calibrating various models. Even 100 years of actual hurricane data may not replicate the true long-term probabilities.
This uncertainty is particularly problematic when
Risk Management
Hurricane Katrina: Analysis of the Impact on the Insurance Industry 23towerswatson.com
one is trying to make decisions about purchasing protection against 100-year events that may in reality be 50-year events. Also, while the models are reasonably good at predicting damage to property from wind, they are not as good at predicting business interruption or additional living expenses that depend on circumstances after the event. While the models can provide good analytical support and guidance, their limitations must be appreciated.
• Reinsurance is underappreciated, particularly in the higher layers. While companies knew that they could suffer losses of this magnitude, they may have chosen not to purchase reinsurance at these levels because it was too expensive. At the very high layers of coverage, reinsurance can be perceived to be very expensive, since the price reflects mostly a charge for risk taking with only a small element for expected losses. A rational-expectations purchaser might not purchase reinsurance protection at these layers, choosing instead to retain the risk.
While the quality of exposure data has continued to improve over the last few years, Katrina should cause some insurers to seek further improvement. Reinsurers may also use Katrina as an opportunity to raise the bar on exposure data requirements for reinsurance submissions. Companies will also need to be appropriately more cautious in their reliance on the catastrophe models, more fully understating their limitations and building in appropriate conservatism in decisions that rely upon them. Finally, we expect that companies will look more carefully at the value of their reinsurance relative to other sources of capital. In doing so, they may choose to purchase coverage higher up.
Although the available exposure management tools allow each insurer to identify which insureds contribute most to their catastrophe loss potential, few insurers have heretofore been willing to selectively jettison business to lower their risk. (This is not the same as wholesale withdrawals, which have occurred; here we are talking about optimizing the portfolio of exposures by selective nonrenewals where concentration is the greatest.) Having fought hard to win new business, it is natural that companies would be reluctant to abandon it. However, in the post-Katrina environment, we are likely to see more optimization, as the perceived stakes are now higher. This may create availability issues to the extent that others are not willing to expand their share of the market.
Volatility Management
Our analysis of losses relative to capital suggests that catastrophe risk is still not well spread across the insurance industry. While no insurance companies have (as of this writing) failed as a result of Katrina, some have suffered material losses in relation to their capital. The sufficiency of risk spreading is an important financial management issue, as empirical evidence suggests that equity market valuations penalize volatility. For some companies, better risk spreading may therefore be important to shareholder value.
Some might argue that insurers are in the risk-taking business, so occasional material losses are not an issue. However, most of the insurance industry is viewed as being in the risk-spreading, rather than the risk-taking, business: taking on large volumes of discrete, independent risks that are diversified away through pooling. While some companies (for example, some of the Bermuda reinsurers or the Lloyd’s syndicates) are viewed as risk-taking enterprises, most companies are not. For those insurers that are generally viewed as risk spreaders, Katrina may prove to be a tipping point. Investors may have grown tired of the earnings surprises and penalize share value. To the extent that this is the case, achieving better risk spreading may be imperative. Unfortunately, the ability of the property & casualty insurance industry to spread catastrophe risk in total is limited. With global insurance capital in the range of $700 billion, pretax catastrophe losses of 5% of industry capital — reducing pretax industry earnings by half — appear increasingly likely. Even with good sharing of catastrophe risk across the industry through better portfolio optimization and increased use of reinsurance protection, catastrophe risk will still be a significant source of volatility for individual companies. If insurers want to use private market mechanisms to reduce volatility arising from catastrophes, they will need to increase their utilization of the capital markets via securitization of catastrophe risk. Currently, this can be done either with funded vehicles such as catastrophe bonds or unfunded vehicles such as industry loss warranties. Insurers and investors may need to be enticed into making more of a market for these types of instruments. The principal obstacles to greater use of the capital markets are (a) perceived high prices due to the magnitude of the risk charges required, (b) unwillingness of insurers to take on the “basis risk,” the difference between their loss and the industry loss, (c) high frictional costs and (d)
Hurricane Katrina: Analysis of the Impact on the Insurance Industry 24towerswatson.com
regulatory limitations as a result of accounting rules. If catastrophe volatility is an important shareholder value issue, overcoming these obstacles through modification of current vehicles or development of new techniques will be a priority.
Some have already suggested that a federal reinsurance pool is needed to cover mega-losses such as Katrina. Their reasoning includes the limited amount of capital market activity today and the likelihood that it will take years to build the market to a level that is meaningful in relation to need. Some view a pool only as an interim solution until a robust capital market solution can be developed. Proposals of this type will certainly be a topic of discussion in Washington for the next year.
Others have argued that the federal government could provide similar assistance by revising the tax code to allow insurers to retain funds for catastrophe losses, especially for mega-events that must be partially paid out of retained earnings (as opposed to current earnings). Currently, these losses must be paid with aftertax dollars. There have been several proposals to remedy this problem, including one for a 401(k)-type account for insurers.6
Catastrophe Response Management
The industry has learned many lessons in the 13 years since Andrew made landfall in southern Florida. The changes in catastrophe response by claim organizations have been extensive, and sophisticated catastrophe response units are now an everyday part of many carriers’ ability to handle the challenges presented by various sizes of storms as quickly and efficiently as possible. The logistical challenges posed by Katrina’s widespread damage, followed so closely by Rita, are providing a real-world test of these improvements.
The Way It Was
Before Andrew, there was a fair amount of catastrophe response discussion and planning, but the magnitude of the event exposed the inadequacies of the industry’s strategic plans. At that time, the claim industry was in the initial stages of implementing remote adjuster utilization, including laptops and mobile phones, but these tools were expensive and their use was limited.
Logistically, many companies would attempt to marshal their resources either just prior to or soon after an event. Response plans for large events did not compare to the size and specificity of today’s plans and were often formulated as storms were imminent. In addition, few organizations had the designated catastrophe coordinator and response team that are resident in many claim departments today. Call centers were not commonplace, and the ability of insurers to adequately handle or respond to the volume of claim calls from a catastrophe was, in itself, a significant challenge.
Once initial claim information was received from the insured, the potential for delays in transmitting the information to a remote adjuster was high. Even after receiving their assignments, adjusters had extensive difficulties in locating insured properties, communicating with both policyholders and their own home offices, and issuing payments, due to a lack of technology that we take for granted today.
The Way It Is
Since Andrew, the industry has shifted from a reactive to a proactive approach, assisted in large part by the development of much more sophisticated technology, fully formulated catastrophe response plans and the realization of the necessity for immediate response.
Most states require insurers to have a written catastrophe response plan on file with their department of insurance. These plans vary depending on the size of the insurer, spread of business and available resources. Larger claim organizations have established specialized pre-strike teams that are staffed with designated adjusters ready to be deployed prior to the onset of an event. For example, two of the largest carriers doing business in the Gulf Coast region deployed a total of approximately 5,000 adjusters in advance of Katrina.
In addition, mobile catastrophe response units that can be easily sent to bases near the areas most affected are a major innovation established as a result of Andrew. These mobile units, equipped with portable generators, fuel, satellite links for laptops, phones, fax machines and global positioning systems (GPS), are deployed prior to the event and serve as technological nerve centers for adjusters. Today’s well-equipped adjuster carries a portable GPS to assist in the location of policyholder addresses, as well as a wireless laptop for use at the damage scene.

Hurricane Katrina: Analysis of the Impact on the Insurance Industry 25towerswatson.com
Carriers with sufficient resources have response plans that call for the deployment of specialized adjusters (e.g., marine specialists for Katrina) based on the location of impact and types of claims anticipated.
Many carriers have contracted with a network of independent adjusters that will provide priority response to that carrier. In addition, the Property Claims Services section of the Insurance Services Office provides a subscriber service that issues catastrophe alerts and wind damage estimates, and polls insurers regarding impact estimates. Many insurers reserve, in advance, blocks of hotel rooms for their response teams in areas that are near the anticipated strike zone. They also make arrangements for overflow personnel, if needed. To control costs, larger carriers may make advance arrangements with distributors of certain building materials that are common to the target area so that they will be readily available.
In addition to airing ads on local radio and television stations, some insurers use airplanes with banners as an effective way to reach large numbers of policyholders with contact information. When it is known that large concentrations of displaced residents have been moved to centralized locations (e.g., the Astrodome), insurers will establish claim-reporting stations in the parking lots to allow their policyholders to report their claims.
In summary, insurers have both recognized the need for specialized catastrophe units and provided appropriate budgets to support them, including the required technology. As a result, the level of effective response to these types of events has increased dramatically since 1992.
Issues Specific to Katrina
In spite of the industry’s many improvements, circumstances can hamper even the best of plans. Regardless of how well prepared insurers were to respond, Katrina created logistical and coverage problems that are certain to lead to indemnity and expense costs well above those anticipated or predicted based on prior catastrophe experience.
Logistically, the extensive flooding has challenged insurers’ response plans. Typically, adjusters attempt to obtain access to the most heavily damaged areas first. This provides benefits in damage assessment, earlier determination of loss estimates and reserves,
mitigation of damages and the level of customer service their policyholders expect. In Katrina’s case, access to the most heavily impacted areas was prevented due to the flooding and wholesale destruction. While the floodwater remained, damages related to water saturation, mold, structural instability and business interruption continued to escalate.
Coverage issues related to the number of occurrences are expected to arise in the resolution of claims. This comes not only from the wind-versus-flood question discussed earlier, but also from the new flooding caused by Rita. The latter question will be particularly difficult to resolve in cases where the adjusters have not yet been able to inspect the original loss.
Adding to the difficulty is the growing political pressure on insurers to find coverage where none exists, even though the policy language has withstood scrutiny in past events. Mississippi’s insurance commissioner has issued a bulletin requiring insurers to demonstrate the cause of loss and mandating resolution of ambiguous losses in favor of the insureds. In addition, the Mississippi attorney general filed a lawsuit against a number of insurers seeking to force them to override the flood exclusions in standard homeowners policies and pay for flood-related damages. Louisiana’s insurance commissioner met with insurers and reinsurers and called on the industry to pay all valid claims. All of this pressure is likely to increase indemnity and expense costs.
Payment of noncovered claims exposes insurers to other problems, including shareholder suits for payment of noncovered claims, policyholder suits for failing to appropriately and consistently apply policy language for all customers (from insureds who incurred the extra expense of flood insurance), and the development of precedents that will affect future events. As a result, insurers must walk a fine line between meeting public expectations and managing their obligations to other stakeholders.
We are still in the early days of what will undoubtedly be a difficult claim-adjustment process. Given the sheer magnitude of the losses from Katrina and the importance of the questions that have risen from both Katrina and Rita, the industry will gain valuable insights that will help transform its operations.
Hurricane Katrina: Analysis of the Impact on the Insurance Industry 26towerswatson.com
Public Policy Questions The losses from Katrina have raised significant public policy questions, many of which are only indirectly related to insurance, such as coordination of the various public relief activities. However, three of the important issues have clear insurance implications:
Issue #1: We need a robust national dialogue on natural disaster risk management and financing. Some types of natural disasters are either so unpredictable or so widespread that it is impossible to avoid them altogether without depopulating whole sections of the country. Blizzards, heat waves and tornadoes fall into this category. On the other hand, flooding has long been recognized as a (usually) geographically limited peril, leading to the establishment of the National Flood Insurance Program and associated programs to limit rebuilding in flood plains after multiple inundations.
Despite the obvious need to restrict building in flood-prone areas, there has been a radical increase in construction very close to or directly on hurricane-prone coasts. Policymakers must engage in a serious debate on whether this should be allowed to continue, whether rebuilding after loss should be restricted and who should bear the risk of loss. If construction is attempted after a loss, should insurance in areas proved to be subject to damage, such as barrier islands, be banned as a matter of public policy? If insurance is allowed, how much should the risk be socialized through property insurance rates and pools that can assess the industry (and through it, the wider population) for their losses? In moderate-risk areas, does post-disaster government aid provide a disincentive for consumers to purchase adequate insurance?
Insurance rate regulation can impede the effective control of natural disaster risk when it keeps rates in disaster prone areas artificially low, requiring the difference to be made up by lower-risk insureds. If the industry had more flexibility to charge actuarially fair rates to all, some higher-risk consumers would have greater incentive to mitigate their exposure and possibly even rebuild elsewhere after a significant loss.
New Orleans presents a unique opportunity for a constructive dialogue about risk mitigation. Should the “bowl” be raised to sea level? This would be a massive and costly undertaking that some believe to be pointless, since the city would still be sinking. Others argue that it would make the city safer, especially for the poorer residents from the flooded areas, and would buy time for a serious public debate about the deterioration of the Mississippi River delta.
The raising of the flooded areas of Galveston after the deadly 1900 hurricane clearly demonstrates that meaningful risk mitigation can be achieved if there is a will to do it. However, times have changed; many more people are involved, and the “correct” answer is not clear. The need for this discussion is painfully time-sensitive. There is no sense in allowing people to return and begin rebuilding if it is ultimately decided that we must bring the city up above sea level.
Issue #2: Many of those hardest hit by Katrina, particularly in the New Orleans flood, are poor and under- or uninsured, either because they did not appreciate the need for insurance or could not afford it. What is the appropriate government response to systematic lack of insurance among vulnerable parts of the population? Insurance both helps its insureds recover after a loss and decreases disaster relief costs (by providing extra expense coverage, for example). Would society be better served by providing access to meaningful insurance for all (but at market rates), letting market forces operate toward an acceptable level of risk mitigation and then limiting disaster relief to the true first response (search and rescue, emergency food and water, communications, etc.)? If insurance is not a “right,” how do we keep the poor and sick from suffering a disproportionate share of the inevitable unreimbursed loss?
Issue #3: What is the role (if any) of the federal government in supplementing the insurance industry against very large losses? The question of federal involvement has already been raised and answered affirmatively by TRIA and the National Flood Insurance Program, but both of these address single perils. The events of 9/11 taught us that we don’t always know where the next loss will come from. Katrina taught us that we don’t always believe it even when we do know. Where will the next “supercat” come from?
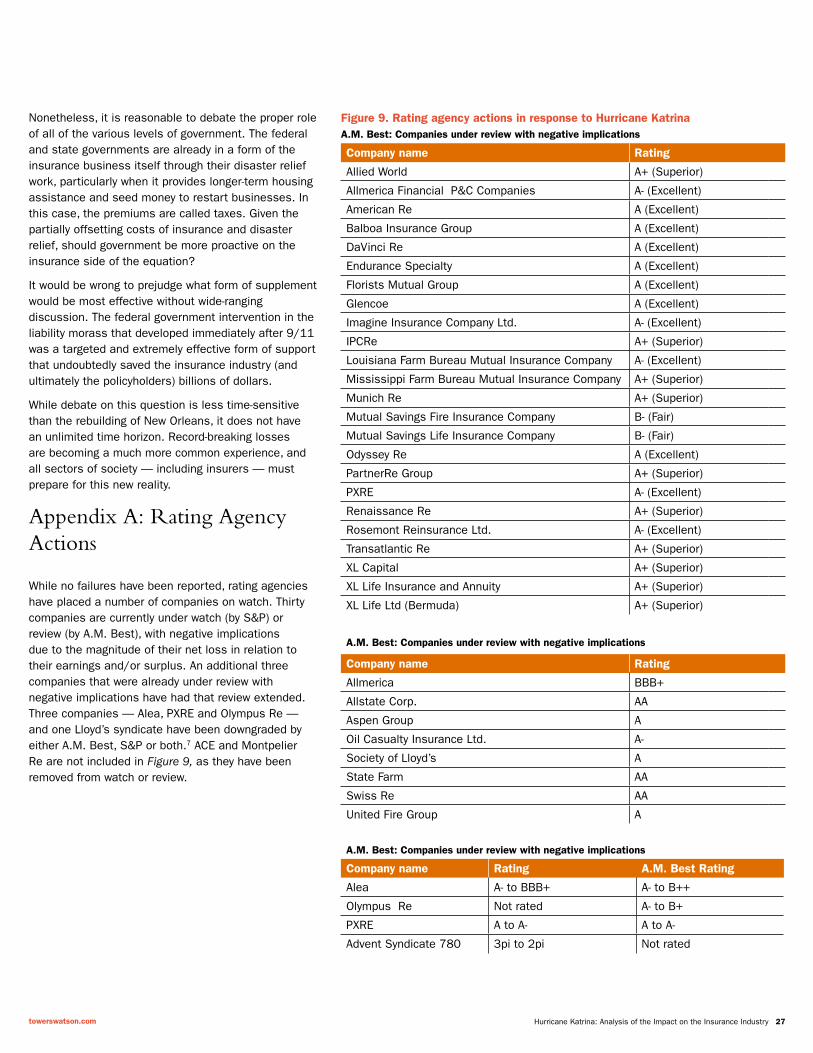
Hurricane Katrina: Analysis of the Impact on the Insurance Industry 27towerswatson.com
Nonetheless, it is reasonable to debate the proper role of all of the various levels of government. The federal and state governments are already in a form of the insurance business itself through their disaster relief work, particularly when it provides longer-term housing assistance and seed money to restart businesses. In this case, the premiums are called taxes. Given the partially offsetting costs of insurance and disaster relief, should government be more proactive on the insurance side of the equation?
It would be wrong to prejudge what form of supplement would be most effective without wide-ranging discussion. The federal government intervention in the liability morass that developed immediately after 9/11 was a targeted and extremely effective form of support that undoubtedly saved the insurance industry (and ultimately the policyholders) billions of dollars.
While debate on this question is less time-sensitive than the rebuilding of New Orleans, it does not have an unlimited time horizon. Record-breaking losses are becoming a much more common experience, and all sectors of society — including insurers — must prepare for this new reality.
Appendix A: Rating Agency Actions
While no failures have been reported, rating agencies have placed a number of companies on watch. Thirty companies are currently under watch (by S&P) or review (by A.M. Best), with negative implications due to the magnitude of their net loss in relation to their earnings and/or surplus. An additional three companies that were already under review with negative implications have had that review extended. Three companies — Alea, PXRE and Olympus Re — and one Lloyd’s syndicate have been downgraded by either A.M. Best, S&P or both.7 ACE and Montpelier Re are not included in Figure 9, as they have been removed from watch or review.
Company name Rating
Allied World A+ (Superior)
Allmerica Financial P&C Companies A- (Excellent)
American Re A (Excellent)
Balboa Insurance Group A (Excellent)
DaVinci Re A (Excellent)
Endurance Specialty A (Excellent)
Florists Mutual Group A (Excellent)
Glencoe A (Excellent)
Imagine Insurance Company Ltd. A- (Excellent)
IPCRe A+ (Superior)
Louisiana Farm Bureau Mutual Insurance Company A- (Excellent)
Mississippi Farm Bureau Mutual Insurance Company A+ (Superior)
Munich Re A+ (Superior)
Mutual Savings Fire Insurance Company B- (Fair)
Mutual Savings Life Insurance Company B- (Fair)
Odyssey Re A (Excellent)
PartnerRe Group A+ (Superior)
PXRE A- (Excellent)
Renaissance Re A+ (Superior)
Rosemont Reinsurance Ltd. A- (Excellent)
Transatlantic Re A+ (Superior)
XL Capital A+ (Superior)
XL Life Insurance and Annuity A+ (Superior)
XL Life Ltd (Bermuda) A+ (Superior)
A.M. Best: Companies under review with negative implications
Company name Rating
Allmerica BBB+
Allstate Corp. AA
Aspen Group A
Oil Casualty Insurance Ltd. A-
Society of Lloyd’s A
State Farm AA
Swiss Re AA
United Fire Group A
Figure 9. Rating agency actions in response to Hurricane KatrinaA.M. Best: Companies under review with negative implications
A.M. Best: Companies under review with negative implications
Company name Rating A.M. Best Rating
Alea A- to BBB+ A- to B++
Olympus Re Not rated A- to B+
PXRE A to A- A to A-
Advent Syndicate 780 3pi to 2pi Not rated

Hurricane Katrina: Analysis of the Impact on the Insurance Industry 28towerswatson.com
A great deal of press coverage has been devoted to trends in the level of hurricane activity and the influence of global warming on the trends. Whether man-made or not, climatologists have noted that sea surface temperatures in the tropical oceans around the globe — a key factor in hurricane activity in each region — have risen over the last few years. Between 1970 and 2004, tropical sea surface temperatures have increased by approximately half a degree Celsius.
However, recent climatological studies report that, over the same period, this warming in sea surface temperatures has only translated into a measurable increase in hurricane frequency in the Atlantic basin. Hurricane frequencies in other areas of the world do not exhibit any discernable trend, despite the rise in sea surface temperatures. The conclusion is that, globally, no trend in hurricane frequency is evident from the available historical data. However, the scientific community continues to worry about what a further increase in sea surface temperature might do to frequencies.
When viewed on a longer historical time scale, the increase in Atlantic hurricane frequency appears to be part of a multi-decade cycle. As indicated in Figure 10, major hurricanes (those making landfall at category 3, 4 or 5 on the Saffir-Simpson scale, with maximum sustained winds above 110 mph) were more frequent until the 1950s. In the 1960s through the 1990s, there appears to have been a lull in the level of hurricane activity. (Interestingly, the lull in hurricane activity coincided with the massive buildup in coastal properties in the southeastern U.S.) These data suggest that conditions have returned to a more active phase. If the experience prior to 1960 is indicative, on average, we should expect an intense hurricane to hit the U.S. coast roughly three out of every four years.
While hurricane frequencies may not be rising globally, historical evidence suggests that the average intensity of hurricanes has increased globally since 1970. The proportion of the total numbers of hurricanes globally that achieve category 4 and 5 intensity at any point in their development (but not necessarily at landfall) has risen from approximately 20% in the 1970s to around 35% today. This pattern of rising intensity has occurred in all regions, including the Atlantic basin. However, the trend is not evident when the data are restricted to the landfalling intensity of hurricanes striking the
U.S. When Saffir-Simpson categories are retroactively estimated for U.S. landfalling hurricanes before 1970 (admittedly an imprecise exercise), there is evidence of an increase since the 1970s, but not when viewed over the entire 20th century.
While much of the data are subject to various interpretations, we believe that two points are clear:
• Global data should cause some concern that we may see increased intensity among U.S. landfalling hurricanes in the future.
• We should not use the benign experience of the 1970s and 1980s as a reference point. It is a mistake to use the past that most of us remember as a basis for our planning.
0 2 4 6 8 10
2000s
1990s
1980s
1970s
1960s
1950s
1940s
1930s
1920s
1910s
1900s66
88
55
88
88
99
66
44
55
66
99
Figure 10. Number of major hurricanes hitting the U.S. by decade
Appendix B: Changes in Hurricane Frequency and Severity

Copyright © 2013 Towers Watson. All rights reserved.TW-NA-2013-34749
towerswatson.com
About Towers WatsonTowers Watson is a leading global professional services company that helps organizations improve performance through effective people, risk and financial management. With 14,000 associates around the world, we offer solutions in the areas of benefits, talent management, rewards, and risk and capital management.