Impact of FTA on Philippine Industries: Analysis of ...
44
DISCUSSION PAPER SERIES NO. 2020-31 DECEMBER 2020 Impact of FTA on Philippine Industries: Analysis of Network Effects Francis Mark A. Quimba, Mark Anthony A. Barral, Maureen Ane D. Rosellon, and Sylwyn C. Calizo Jr. The PIDS Discussion Paper Series constitutes studies that are preliminary and subject to further revisions. They are being circulated in a limited number of copies only for purposes of soliciting comments and suggestions for further refinements. The studies under the Series are unedited and unreviewed. The views and opinions expressed are those of the author(s) and do not necessarily reflect those of the Institute. Not for quotation without permission from the author(s) and the Institute. CONTACT US: RESEARCH INFORMATION DEPARTMENT Philippine Institute for Development Studies 18th Floor, Three Cyberpod Centris - North Tower EDSA corner Quezon Avenue, Quezon City, Philippines [email protected] (+632) 8877-4000 https://www.pids.gov.ph
Transcript of Impact of FTA on Philippine Industries: Analysis of ...
DISCUSSION PAPER SERIES NO. 2020-31
DECEMBER 2020
Impact of FTA on Philippine Industries: Analysis of Network Effects
Francis Mark A. Quimba, Mark Anthony A. Barral, Maureen Ane D. Rosellon, and Sylwyn C. Calizo Jr.
The PIDS Discussion Paper Series constitutes studies that are preliminary and subject to further revisions. They are being circulated in a limited number of copies only for purposes of soliciting comments and suggestions for further refinements. The studies under the Series are unedited and unreviewed. The views and opinions expressed are those of the author(s) and do not necessarily reflect those of the Institute. Not for quotation without permission from the author(s) and the Institute.
CONTACT US:RESEARCH INFORMATION DEPARTMENTPhilippine Institute for Development Studies
18th Floor, Three Cyberpod Centris - North Tower EDSA corner Quezon Avenue, Quezon City, Philippines
[email protected](+632) 8877-4000 https://www.pids.gov.ph

Impact of FTA on Philippine Industries: Analysis of Network Effects
Francis Mark A. Quimba
Mark Anthony A. Barral
Maureen Ane D. Rosellon
Sylwyn C. Calizo Jr.
PHILIPPINE INSTITUTE FOR DEVELOPMENT STUDIES
December 2020

2
Abstract
Trade is an important component of the Philippine economy. Contemporary trade is shaped
primarily by the evolution of Global Value Chains (GVCs), and this has a significant
implication in integrating developing countries, such as the Philippines, into the global
economy. An economy's inclusion into GVCs is affected by different factors, one of which is
through a Free Trade Agreement (FTA). The impact of FTAs has long been studied in the
Philippines, but the network effects of FTA trade shocks and its resulting impact to industry
firm performance have not been explored as much. This study contributes to filling that gap by
calculating the direct impact of trade agreements to the performance of various sectors. The
results of the analysis show that FTA imports have a positive and significant direct effect on
industry growth and labor productivity. The network effects, however, are not statistically
significant for real Gross Value Added growth. On employment, the direct effect is negative
and statistically significant, but the network effects would temper this effect because the
upstream effect arising from customers is positive and statistically significant. The shock also
has a positive and statistically significant direct effect on labor productivity, which implies that
increasing imports increases labor productivity of Philippine sectors.
Keywords: Trade, network effects, trade agreements, FTA, Philippines

3
Acknowledgement
This study was funded by the Economic Research Institute for ASEAN and East Asia (ERIA),
which is an international organization established by a formal agreement among 16 Heads of
Government at the 3rd East Asia Summit in Singapore on 21 November 2007. It works closely
with the ASEAN Secretariat, researchers, and research institutes from East Asia to provide
intellectual and analytical research and policy recommendations. ERIA is supported by the
Research Institutes Network (RIN) that consists of research institutes from 16 East Asia
Summit countries. The Philippine Institute for Development Studies (PIDS) is a member of the
RIN.
The views expressed herein do not necessarily represent those of the supporting institutions.
All errors and omissions are solely the responsibility of the authors.
4
Table of Contents
1. Introduction ..................................................................................................................... 8
1.1 Objectives of the study .......................................................................................................... 8
1.2 Significance of the study ....................................................................................................... 8
1.3 Limitations of the study ......................................................................................................... 9
2. Philippine Trade and Industry ...................................................................................... 10
2.1 Background on Philippine industry .................................................................................. 10
2.1.1 Value added ...................................................................................................................... 10
2.1.2 Employment ...................................................................................................................... 12
2.1.3 Productivity ........................................................................................................................ 14
2.1.4 Forward and backward linkages .................................................................................... 15
2.2 Philippine trade and industrial policy .............................................................................. 17
3. Methodology .................................................................................................................. 20
3.1 Sources of data ...................................................................................................................... 20
3.2 Econometric model ............................................................................................................... 21
4. Results and Discussion ................................................................................................ 24
5. Conclusion and Policy Recommendations ................................................................. 28
5.1 Conclusion .............................................................................................................................. 28
5.2 Policy recommendations ..................................................................................................... 29
References ........................................................................................................................ 31
Appendix ........................................................................................................................... 34
5
List of Tables
Table 1 Structure of the economy by major sector .............................................................................................. 11
Table 2 Average annual growth rates by sector ................................................................................................... 12
Table 3 5-year average labor productivity by sector, 1991-2018 (constant 2000 prices) .................................... 14
Table 4 Growth rates of labor productivity, %...................................................................................................... 15
Table 5 Philippine Logistics Performance Index, 2007-2018 ................................................................................ 17
Table 6 Major trade and investment policies of the Philippines by decade ......................................................... 18
Table 7 Direct impact to all sectors, Million Pesos (in 2000 prices) ..................................................................... 20
Table 8 Average growth rate of Gross Value Added growth of industries (%) ..................................................... 20
Table 9 Average growth rate of employment (%) ................................................................................................ 21
Table 10. Average growth of labor productivity (%) ............................................................................................. 21
Table 11. Average Upstream and Downstream multipliers by industry ............................................................... 23
Table 12 Impact of trade shocks on industry performance, all schemes ............................................................. 24
Table 13 Summary of the impact of trade shocks on GVA growth by scheme .................................................... 25
Table 14 Share of tariff lines with zero tariff rates to total tariff lines by FTA ..................................................... 28
Table 15 Utilization rate of FTAs by FTA partner in 2018, % ................................................................................ 28
List of Figures
Figure 1 Employment by sector ............................................................................................................................ 13
Figure 2 Average growth rates of major industries (2005-2015) ......................................................................... 13
Figure 3 Top 3 import products by top 10 import source with an FTA to the Philippines, 2014-2018 (5-year
average) ................................................................................................................................................................ 27
List of Appendices
Appendix 1 Growth rate of employed persons by industry group, 2005-2015 .................................................... 34
Appendix 2 Upstream and Downstream multipliers ............................................................................................ 35
Appendix 3 Impact of trade shocks on industry performance, AFTA (Panel estimation with Fixed Effects) ....... 37
Appendix 4 Impact of trade shocks on industry performance, AANZFTA (Panel estimation with Fixed Effects) . 38
Appendix 5 Impact of trade shocks on industry performance, ACFTA (Panel estimation with Fixed Effects) ..... 39
Appendix 6 Impact of trade shocks on industry performance, AIFTA (Panel estimation with Fixed Effects) ...... 40
Appendix 7 Impact of trade shocks on industry performance, AJFTA (Panel estimation with Fixed Effects) ...... 41
Appendix 8 Impact of trade shocks on industry performance, AKFTA (Panel estimation with Fixed Effects) ..... 42
Appendix 9 Impact of trade shocks on industry performance, PJEPA (Panel estimation with Fixed Effects) ...... 43
6
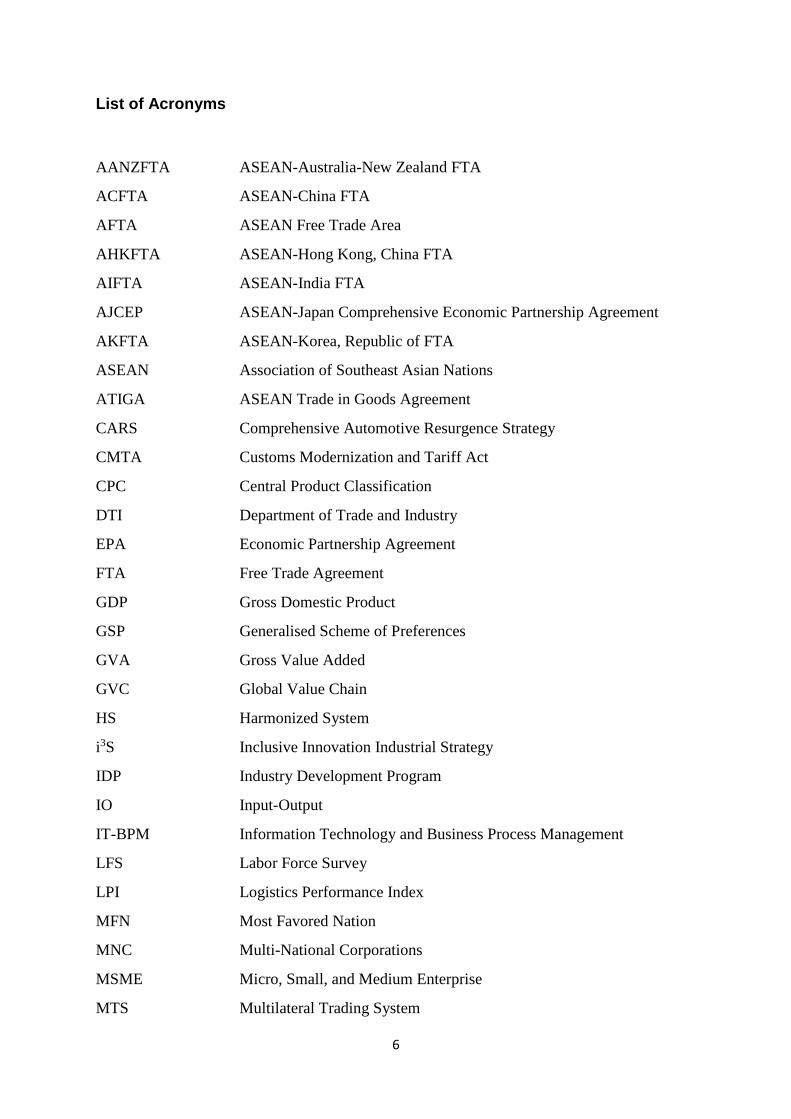
List of Acronyms
AANZFTA ASEAN-Australia-New Zealand FTA
ACFTA ASEAN-China FTA
AFTA ASEAN Free Trade Area
AHKFTA ASEAN-Hong Kong, China FTA
AIFTA ASEAN-India FTA
AJCEP ASEAN-Japan Comprehensive Economic Partnership Agreement
AKFTA ASEAN-Korea, Republic of FTA
ASEAN Association of Southeast Asian Nations
ATIGA ASEAN Trade in Goods Agreement
CARS Comprehensive Automotive Resurgence Strategy
CMTA Customs Modernization and Tariff Act
CPC Central Product Classification
DTI Department of Trade and Industry
EPA Economic Partnership Agreement
FTA Free Trade Agreement
GDP Gross Domestic Product
GSP Generalised Scheme of Preferences
GVA Gross Value Added
GVC Global Value Chain
HS Harmonized System
i3S Inclusive Innovation Industrial Strategy
IDP Industry Development Program
IO Input-Output
IT-BPM Information Technology and Business Process Management
LFS Labor Force Survey
LPI Logistics Performance Index
MFN Most Favored Nation
MNC Multi-National Corporations
MSME Micro, Small, and Medium Enterprise
MTS Multilateral Trading System

7
PEZA Philippine Economic Zone Authority
PH-EFTA FTA Philippines-European Free Trade Area FTA
PJEPA Philippines-Japan Economic Partnership Agreement
PSA Philippine Statistics Authority
PSIC Philippine Standard Industry Classification
SME Small and Medium Enterprise
TRP Trade Reform Program
WITS World Integrated Trade Solution
WTO World Trade Organization

8
Impact of FTA on Philippine industries: Analysis of network effects
Francis Mark A. Quimba, Mark Anthony A. Barral, Maureen Ane D. Rosellon, and Sylwyn C. Calizo Jr.1
1. Introduction
The evolution of Global Value Chains (GVCs) significantly changed how global trade and
industry worked. GVCs led to a fragmented production process where producers capitalized
on comparative advantages across regional supply chains. This fragmentation allowed
developing economies to participate in the production process, which eventually led to an
economic growth backed by the creation of domestic jobs, foreign currency inflows, poverty
reduction, and access to information. Sustaining this GVC-led economic growth will not only
ensure that the economy continues to attract investments but will also push local firms to
become globally more competitive (Duke CGGC 2016).
1.1 Objectives of the study
This study revisits the findings of a number of studies (Wignaraja et al. 2010; Aldaba et al.
2015; DTI 2015; Barral and Quimba 2019; Quimba, Rosellon, and Calizo 2020) on the impact
of Free Trade Agreements (FTAs)2 on the economy through the performance of domestic
industries. It provides a different perspective by incorporating the network effects of increased
trade to the impact of trade on industry firm performance. It also expands the study by Aldaba
et al. (2015) by looking also at the agricultural sector.
By looking at the impact of trade agreements on industries and their value chains, this study is
able to provide essential guidance to policymakers and implementers on how to maximize the
increasing participation of the country in the global economy. Participation in the global
economy, as a strategy of the Philippines, is expected to increase employment, promote
inclusive growth, and diversify export markets.
1.2 Significance of the study
A number of studies (Wignaraja et al. 2010; Aldaba et al. 2015; DTI 2015; Barral and Quimba
2019; Quimba, Rosellon, and Calizo 2020) have been conducted on the importance of trade
agreements to the country. For instance, Aldaba et al. (2015) surveyed around 100 firms and
found that close to a third are FTA users. Most of these are medium-sized firms with total
1 Senior Research Fellow, two Supervising Research Specialists, and Research Specialist, respectively, at the Philippine Institute for Development Studies 2 The Philippines enforces a total of nine FTAs. Most of these are through the Association of Southeast Asian Nations (ASEAN), namely: ASEAN Free Trade Area (AFTA) and ASEAN Trade in Goods Agreement (ATIGA), ASEAN-China FTA (ACFTA), ASEAN-Japan Comprehensive Economic Partnership Agreement (AJCEP), ASEAN-Australia-New Zealand FTA (AANZFTA), ASEAN-India FTA (AIFTA), ASEAN-Korea, Republic of FTA (AKFTA), and ASEAN-Hong Kong, China FTA (AHKFTA). The other two FTAs are bilateral, namely: the Philippines-Japan Economic Partnership Agreement (PJEPA) and the Philippines-European Free Trade Association FTA (PH-EFTA FTA)

9
employment ranging from 50 to 300 workers. Their study finds that the lack of information
and the use of other schemes, such as the Generalised Scheme of Preferences (GSP+) or
incentives from the Philippine Economic Zone Authority (PEZA), are reasons affecting the use
of FTAs.
Wignaraja et al. (2010) found that lower tariffs increased export sales are the most significant
benefits of AFTA. However, respondent firms have also raised their concerns when facing
cheaper imports and high costs of documentation in order to utilize the FTA. For example,
Barral and Quimba (2019) used a synthetic control method to evaluate the impact of PJEPA on
the performance of the Philippines’ exports while Quimba, Rosellon, and Calizo (2020)
analyzed the utilization rate of trade agreements and found room for improving the utilization
of FTAs, particularly for PJEPA. Further, Quimba, Rosellon, and Calizo (2020) also found that
the significantly lower tariffs provided by trade agreements increase utilization for the
importation of all products in the Philippines.
According to a study commissioned by the Department of Trade and Industry (DTI 2015), 22.0
percent of all survey respondents were FTA users. A closer inspection further shows that 16.0
percent of Small and Medium Enterprises (SMEs) and 39.0 percent of large firms utilized
FTAs. It was also found that AFTA and ATIGA were the most used FTAs, among respondents,
followed by ACFTA and AJCEP
While the preceding studies have found varying rates of utilization, few have actually looked
at the impact of FTAs to firm performance. This study contributes to this existing body of
literature by incorporation the network effects of an influx of products through an FTA. The
hypothesis is that the impact of a shock on the macro-economy would be bigger if we include
the subsequent effects on other sectors or firms. This research utilizes the information provided
by the Input-Output (IO) tables provided by the Philippine Statistics Authority (PSA) to
incorporate the network effects to an influx of imported products from the Philippines’ trade
partners.
1.3 Limitations of the study
This study is limited by the availability of three types of data, namely: FTA utilization rates on
imports at the product level (10-digit HS Code),3 indicators on industry performance at the
PSIC4 level, availability of the PSA IO tables for the same industries that have growth rates at
the PSIC level. Unfortunately, industry growth rates are available only at a highly aggregated
level. Appendix 1 presents the industries with available growth rates. This study is also limited
3 The Harmonised Commodity Description and Coding Systems (HS) is an international nomenclature for the classification of products introduced in 1988. For more on the HS system, see: https://unstats.un.org/unsd/tradekb/Knowledgebase/50018/Harmonized-Commodity-Description-and-Coding-Systems-HS 4 The Philippine Standard Industrial Classification (PSIC) is a detailed classification of industries prevailing in the Philippines according to the kind of productive activities undertaken by establishments. For more on the PSIC system, see: https://psa.gov.ph/content/philippine-standard-industrial-classification-psic
10
by the concordance and alignment of the HS codes, ISIC5, PSIC, and the PSCC.6 For each
conversion and alignment that the researchers have to conduct, a number of assumptions were
made, which could result to measurement errors affecting the regression coefficients.
Further, the impact of trade agreements on a sector would not only be through the influx of
imported products but also through exports (i.e., the expansion of markets). This study fails to
incorporate exports to the model because it is not as diligently monitored as imports.
Furthermore, this analysis is limited by the lack of firm level information on key imports and
sources of these imports. While the PSA has information on imports, this is unrelated to the
information on products.
The rest of this paper is organized as follows: Chapter 2 presents a background of the Philippine
economy and related trade and industrial policies that were implemented during this period.
Chapter 3 provides the methodology and data sources used for the evaluation of the role of
FTAs. The estimation results will then be discussed in Chapter 4. Finally, the conclusion and
policy recommendations are found in Chapter 5.
2. Philippine Trade and Industry
2.1 Background on Philippine industry
2.1.1 Value added
Aldaba (2013) has found that, since the 1980s, the share of services has been increasing from
about 36.0 percent to 44.0 percent in 2000. From 2011-2018, industry share has been more
than 55.0 percent (Table 1), increasing from 53.0 percent at the end of the century. Looking
further at the data over time, Aldaba (2013) found that at the outset of the trade reforms,
industry’s share has been the largest at 40.5 percent, but this figure has declined between 1980
and 1985. Recent figures show that industry’s share has been steady at about 33.0 percent.
The share of agriculture, hunting, forestry and fishing value added slightly dropped from 21.0
percent in 1980 to 19.0 percent in 2000 (Aldaba 2013). It has further declined over time with
about 14.0 percent at the beginning of the millennium to only about an 8.0 percent share of
value added from 2016-2018.
5 The International Standard Industrial Classification of All Economic Activities (ISIC) is a standard classification of economic activities arranged so that entities can be classified according to the activity they carry out. For more on the ISIC, see: https://ilostat.ilo.org/resources/methods/classification-economic-activities/ 6 The Philippine Standard Commodity Classification (PSCC) is a detailed classification of all imported and exported commodities being used for tariff and statistical purposes. For more on the PSCC, see: https://psa.gov.ph/content/philippine-standard-commodity-classification-pscc
11
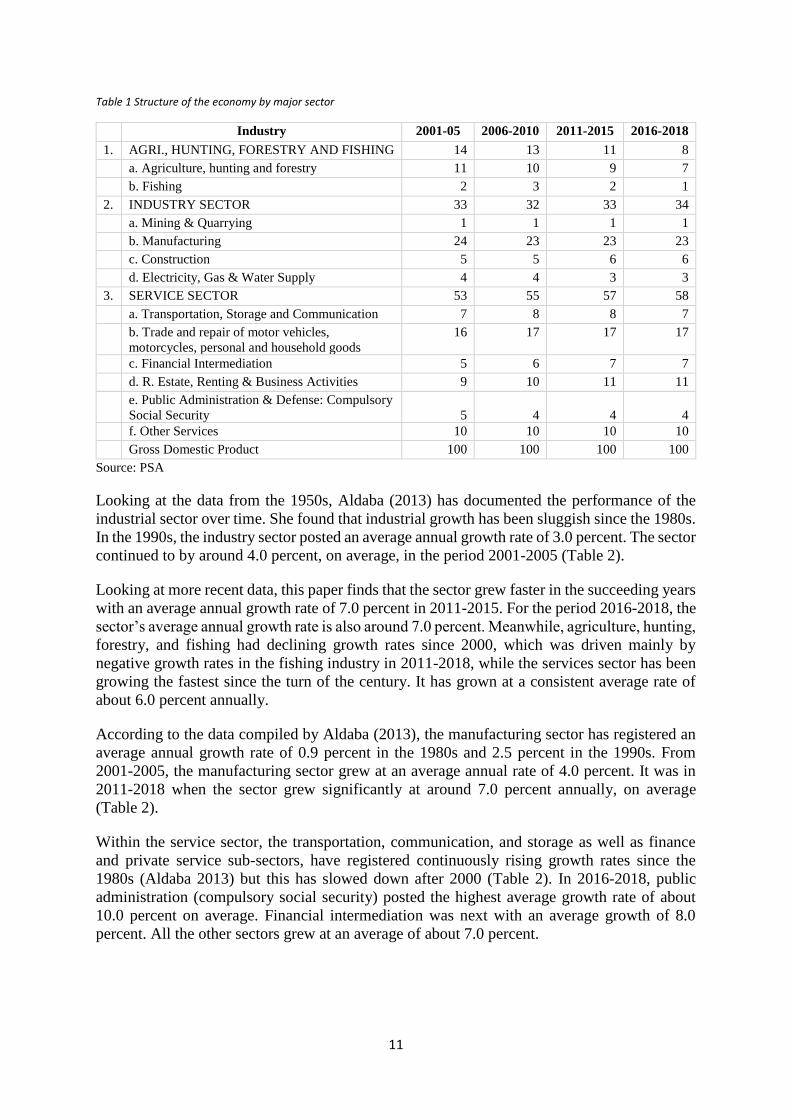
Table 1 Structure of the economy by major sector
Industry 2001-05 2006-2010 2011-2015 2016-2018
1. AGRI., HUNTING, FORESTRY AND FISHING 14 13 11 8 a. Agriculture, hunting and forestry 11 10 9 7 b. Fishing 2 3 2 1
2. INDUSTRY SECTOR 33 32 33 34 a. Mining & Quarrying 1 1 1 1 b. Manufacturing 24 23 23 23 c. Construction 5 5 6 6 d. Electricity, Gas & Water Supply 4 4 3 3
3. SERVICE SECTOR 53 55 57 58 a. Transportation, Storage and Communication 7 8 8 7 b. Trade and repair of motor vehicles,
motorcycles, personal and household goods
16 17 17 17
c. Financial Intermediation 5 6 7 7 d. R. Estate, Renting & Business Activities 9 10 11 11 e. Public Administration & Defense: Compulsory
Social Security 5 4 4 4 f. Other Services 10 10 10 10
Gross Domestic Product 100 100 100 100
Source: PSA
Looking at the data from the 1950s, Aldaba (2013) has documented the performance of the
industrial sector over time. She found that industrial growth has been sluggish since the 1980s.
In the 1990s, the industry sector posted an average annual growth rate of 3.0 percent. The sector
continued to by around 4.0 percent, on average, in the period 2001-2005 (Table 2).
Looking at more recent data, this paper finds that the sector grew faster in the succeeding years
with an average annual growth rate of 7.0 percent in 2011-2015. For the period 2016-2018, the
sector’s average annual growth rate is also around 7.0 percent. Meanwhile, agriculture, hunting,
forestry, and fishing had declining growth rates since 2000, which was driven mainly by
negative growth rates in the fishing industry in 2011-2018, while the services sector has been
growing the fastest since the turn of the century. It has grown at a consistent average rate of
about 6.0 percent annually.
According to the data compiled by Aldaba (2013), the manufacturing sector has registered an
average annual growth rate of 0.9 percent in the 1980s and 2.5 percent in the 1990s. From
2001-2005, the manufacturing sector grew at an average annual rate of 4.0 percent. It was in
2011-2018 when the sector grew significantly at around 7.0 percent annually, on average
(Table 2).
Within the service sector, the transportation, communication, and storage as well as finance
and private service sub-sectors, have registered continuously rising growth rates since the
1980s (Aldaba 2013) but this has slowed down after 2000 (Table 2). In 2016-2018, public
administration (compulsory social security) posted the highest average growth rate of about
10.0 percent on average. Financial intermediation was next with an average growth of 8.0
percent. All the other sectors grew at an average of about 7.0 percent.

12
Table 2 Average annual growth rates by sector
Industry 2001-05 2006-2010 2011-2015 2016-2018
1. AGRI., HUNTING, FORESTRY AND FISHING 4 2 2 1 a. Agriculture, hunting and forestry 3 2 2 2 b. Fishing 6 4 -1 -2
2. INDUSTRY SECTOR 4 5 7 7 a. Mining & Quarrying 17 9 4 2 b. Manufacturing 4 4 7 7 c. Construction 0 11 7 11 d. Electricity, Gas & Water Supply 4 5 4 6
3. SERVICE SECTOR 6 6 6 7 a. Transportation, Storage and Communication 10 4 6 5 b. Trade and repair of motor vehicles,
motorcycles, personal and household goods
6 5 6 7
c. Financial Intermediation 7 8 8 8 d. R. Estate, Renting & Business Activities 5 7 8 7 e. Compulsory Social Security 3 4 3 10 f. Other Services 4 6 6 7
Gross Domestic Product 5 5 6 7
Source: PSA
2.1.2 Employment
In terms of employment contribution, the services sector has become the largest provider of
employment in the most recent period (Figure 1). The share of the labor force employed in the
sector consistently increased from around 32.0 percent in the mid-1970s to about 49.0 percent
in 2000-2011. The share of industry to total employment has been almost stagnant at 15.0
percent from the mid-1970s to the most recent period under review.
Industry (e.g., manufacturing and construction, among others), has unsuccessfully created
employment opportunities for new entrants to the labor force as well as those who move out of
the agricultural sector. Its share dropped from 11.0 percent in the mid-1970s to 9.0 percent in
2000-2011. While the share of agriculture has been declining, the sector has remained an
important source of employment. From 52.8 percent in the mid-1970s, the agriculture sector’s
share in total employment continuously declined in the succeeding decades and is around 36.0
percent from 2000-2011. The most recent figure shows that agriculture share of employment
is around 27.0 percent (Figure 1).

13
Figure 1 Employment by sector
Source: World Development Indicators
In terms of the expansion of sector employment, the average growth rate of manufacturing has
been below 1.0 percent from 2005-2015 (Figure 2). The sub-sectors that have grown in terms
of employment include mining and quarrying, it has the slowest growth after agriculture and
fishing.
Figure 2 Average growth rates of major industries (2005-2015)
Source: Authors’ calculations using data from PSA’s Philippine Statistical Yearbooks
0%
20%
40%
60%
80%
100%
1991 1994 1997 2000 2003 2006 2009 2012 2015 2018
Per
cen
t o
f to
tal e
mp
loym
ent
Services Industry Agriculture
7.5 7.2
4.84.2
3.6 3.53.0 2.7 2.7
2.1 1.8 1.7
0.4
-0.3 -0.5-2%
0%
2%
4%
6%
8%
10%

14
On average, total employment in the country grew by only 1.7 percent on average for this
period. This is sluggish relative to the growth of the economy. The fastest growing sectors in
terms of employment are hotel and restaurants, and mining and quarrying that have both grown
beyond 7.0 percent, on average, in 2005-2015. Construction, other services, and financial
intermediation complete the five fastest growing industries.
2.1.3 Productivity
One of the ways to measure productivity is through the calculation of total value added divided
by total employment (i.e., value added per worker or labor productivity). Several studies
(Balisacan and Hill 2003; Herrin and Pernia 2003; Llanto 2012; Aldaba 2013) have
documented the trend in the productivity of labor across the different economic sectors since
the mid-1970s. Aldaba (2013) finds that labor productivity is low and disparities across the
three major sectors are wide. Industry had the highest labor productivity, which declined from
the mid-1970s to the 1990s (Aldaba 2013), but showed some improvement in the current period
although it still has not reached its highest average level registered in the mid-1970s. More
recent figures support the finding that labor productivity is highest in industry followed by
services (Table 3).
Table 3 5-year average labor productivity by sector, 1991-2018 (constant 2000 prices)
Sector 1991-1995 1996-2000 2001-2005 2006-2010 2011-2015 /1 2016-2018 /2
All Sectors 115,076 124,583 131,642 151,456 177,109 213,507
Agriculture,
Forestry and
Fishing 39,607 44,566 49,640 54,801 59,597 70,806
Industry 254,242 262,669 277,263 326,330 371,589 396,962
Services 145,026 143,754 146,283 166,161 188,511 218,637
Source: Authors’ calculations using data from PSA /1 For 2013-2016, values are based on the average of April, July, and October employment data, which excluded
Leyte province /2 For 2016, values are based on the average of January, April, July, and October employment data, which excluded
Leyte province
The average labor productivity in the services sector has declined from the mid-1970s to the
1990s but improved in 2000-2010. In 2011-2015, the labor productivity in the services sector
has grown as fast as the industry sector. The agriculture, fishery, and forestry sectors had the
lowest level of labor productivity, which remained stagnant from the mid-1970s (Aldaba 2013)
up to the 1990s although slight increases were experienced in the latest period.
In terms of labor productivity growth, Table 4 shows that, on the one hand, the agriculture
sector is experiencing erratic movements in labor productivity growth with a sharp increase in
2016-2018 but less than one growth in 2001-2005. On the other hand, industry has consistently
grown at 3.0 percent since 2006. Meanwhile, the services sector has also rapidly improved as
it has grown at negative rates since 1991-2000 but has grown at a rate of 7.0 percent in 2016-
2018.

15
Table 4 Growth rates of labor productivity, %
Sector 1991-1995 1996-2000 2001-2005 2006-2010 2011-2015 /1 2016-2018 /2
All Sectors -0.7 1.2 1.3 2 4 8
Agriculture,
Forestry and
Fishing -0.8 2.7 0.9 1 2 11
Industry -1.7 1.2 1.1 3 3 2
Services -0.8 -0.6 1.4 2 3 7
Source: Authors’ calculations using data from PSA /1 For 2013-2016, values are based on the average of April, July, and October employment data, which excluded
Leyte province /2 For 2016, values are based on the average of January, April, July, and October employment data, which excluded
Leyte province
Factors that could affect labor productivity in the Philippines have been studied by Llanto
(2012) and Herrin and Pernia (2003). Llanto (2012) found that foreign direct investments,
educational attainment (i.e., capturing research and development), openness of the economy,
and government expenditure in health and education are significant determinants of labor
productivity. Macroeconomic stability is also a positive determinant of labor productivity as it
leads to more investments and job creation. These results are consistent with the findings of
Herrin and Pernia (2003) that identified three factors that affected the labor productivity from
the mid-1970s to the 1990s. First, the limited investment in modern technology by the firms
and the reluctance to implement international best practices in production and management.
Second, the rapid population growth overwhelming the small expenditure and investment in
human capital. Third, the relatively quick expansion of employment in low productivity
services sector.
2.1.4 Forward and backward linkages
The Philippines is a relatively newcomer to GVCs compared to other countries in the
Association of Southeast Asian Nations (ASEAN) region (Duke CGGC 2016). To address this
concern, DTI has focused on creating a stable trade and industry environment. The policies and
strategies of the DTI aim to contribute to increasing manufacturing growth through GVCs.
GVCs are defined as “the full range of activities that firms, workers, and supporting institutions
around the world perform to bring a product from conception through production and end use
(Duke CGGC 2016, p.2).” This entails the process of producing goods from raw materials to
finished products carried out wherever the necessary skills and materials are available at
competitive cost and quality.
It is important for developing countries, such as the Philippines, to effectively participate in
GVCs because this helps to not only diversify the developing country's export basket but also
to strengthen domestic industries, which then becomes a catalyst for inclusive economic
growth. Gereffi and Fernandez-Stark (2011) even adds that a holistic view of industries,
particularly through both a top-down and a bottom-up approach, is important, and this holistic
view can be achieved by examining factors, such as labor, technology, standards, and
regulations, among similar others. Gereffi et al. (2005), however, reminds that developing
countries should not stop at just participating in GVCs but to continue further by moving into
higher-value activities in the value chain - a movement that is known in the GVC literature as
economic upgrading.

16
Aldaba (2008) looked at forward and backward linkages in analyzing how Philippine firms can
increase participation of SMEs in GVCs. On the one hand, backward linkages arise when firms
source raw materials and intermediate products or services from domestic companies. The
creation of these backward linkages would increase the domestic value added of Multi-National
Corporations (MNCs) and lead to significant contributions to the domestic economy. On the
other hand, forward linkages are created when domestic-based companies sell goods or services
to other Philippine-based companies.
In their analysis of the spillover effects of foreign direct investment, Aldaba and Aldaba (2010)
used the 1988 and 1998 IO tables to calculate the horizontal forward and backward linkages
among industries in the Philippines. They found that nine manufacturing sectors had values
between 0.9 and 1.0, which signals that these sectors have strong horizontal linkages. These
nine sectors include: (1) other dairy products; (2) hardboard and particle board; (3) stationers,
artists, and office supplies; (4) petroleum refineries; (5) flat glass; (6) professional and
scientific measuring and controlling equipment; (7) watches and clocks; (8) soaps and
detergents; and, (9) fiber batting, padding, and upholstery fillings.
Aldaba and Aldaba (2010) also reported nine other sectors that had high horizontal linkages,
namely: (1) milk processing; (2) butter and cheese manufacturing; (3) flavoring extracts; (4)
carpets and rugs; (5) rubber tire and tube; (6) metal and wood working machinery; (7) parts
and supplies for radio, television, and communication; (8) photographic and optical
instruments; and, (9) rebuilding and major alteration of motor vehicles. Incidentally, these
sectors also have a significant foreign presence.
In terms of backward and forward linkages, Aldaba and Aldaba (2010) found that textile
spinning; weaving, texturizing and finishing; milk processing; and, basic industrial chemicals
actually had strong backward linkages, while asphalt, lubricants, and miscellaneous products;
products of petroleum and coal; butter and cheese manufacturing; ice cream and sherbets;
carpets and rugs; rubber and tire manufacturing; and, pesticides and insecticides had strong
forward linkages.
Corollary to the participation in GVCs is the quality of the country’s international supply chain,
which, in its simplest form, involves the transport of goods and services from a production
facility in one country to a warehouse or distribution center in another country. This would
therefore involve facilitating trade for a given country, which would include facilitating imports
of parts and components and their movement to a production facility, as well as facilitation
exports of the processed good from the production facility to the port (Patalinghug et al. 2015).
Recognizing that around 80.0 percent of international trade is involved with seaports, a
country’s participation in GVCs depends not only on the efficiency of the procedures
associated with the movement of goods to-and-from the ports, whether by air or by sea, but
also on how well those ports are connected to other countries. Using the World Bank’s
Logistics Performance Index (LPI)7, Table 5 shows that the Philippines has done little to
improve the state of its logistics. The Philippines’ LPI score has decreased over time. From the
7 The LPI is a perception index based on a survey of 1,000 logistics and trade-facilitation professionals around the globe. It is used to measure logistics efficiency across countries. Respondents evaluate eight markets on six core dimensions on a scale from 1 (worst) to 5 (best). The six core dimensions include: efficiency of the clearance process; quality of trade and transport infrastructure; ease of arranging competitively priced shipments; competence and quality of logistics services; ability to track and trace consignments; and, timeliness of shipments in reaching their destination. For more on the LPI, see: www.worldbank.org

17
baseline assessment, the Philippines’ logistics has decreased in almost all dimensions. Only the
quality of trade and transport infrastructure increased from the baseline figure.
Table 5 Philippine Logistics Performance Index, 2007-2018
Component 2007 2010 2012 2014 2016 2018
Overall LPI 2.69 3.14 3.02 3.00 2.86 2.90
Customs 2.64 2.67 2.63 3.00 2.61 2.53
Infrastructure 2.26 2.57 2.80 2.60 2.55 2.73
Timeliness 3.14 3.83 3.30 3.07 3.35 2.98
International Shipments no data 3.40 2.97 3.33 3.01 3.29
Tracking and Tracing no data 3.29 3.30 3.00 2.86 3.06
Logistics Competence
and Quality no data no data 3.14 2.93 2.70 2.78
Source: World Bank
2.2 Philippine trade and industrial policy
Economic theory provides that trade liberalization can benefit the economy through three
channels. First, the static gains arising from trade liberalization as resource allocation improves
within and across industries. Trade reforms induce profound changes to the industry structure.
For instance, resources used by different economic sectors can be reallocated among
themselves or industries can undergo restructuring to some extent. Such a reallocation of
resources or industrial restructuring can drive unprofitable businesses to contract and profitable
businesses to grow (Aldaba and Cororaton 2002).
Second, trade liberalization can also bring about learning and innovation (i.e., technical
change) that leads to improved productivity growth. These are considered as the dynamic gains
that could be brought about by trade liberalization. Third, it is believed that imports can also
compete with incumbent domestic industries and result to competitive effects.
The trade liberalization experience of the Philippines did not result in the expected growth in
manufacturing and industry. The Philippines joined the World Trade Organization (WTO) in
1995 and committed to pursue trade liberalization and to integrate itself into the multilateral
trading system (MTS) of the WTO. Also, the Philippines, in the 1980s to the 1990s, has a trade
strategy characterized by the reduction of tariff and non-tariff barriers in the manufacturing and
agricultural sectors (Table 6).
After 2010, the Philippines has been guided by a shift in perspective in industrialization policy
as the previous decade has been characterized by jobless growth and high underemployment
(Aldaba 2015). There is also a better appreciation on the role of innovation in improving the
competitiveness of the sector to promote inclusive and sustainable growth. To address these
factors, DTI launched the Industrial Development Program (IDP) in 2012, which has a vision
of a globally competitive industrial sector with strong backward and forward linkages.
A decade into the 2000s, the government moved towards the Comprehensive National
Industrial Strategy (CNIS)8, which is a new industrial policy aimed at maximizing trade and
investments, creating more quality jobs, and attaining sustainable and inclusive growth. From
8 For more on the CNIS, see: http://industry.gov.ph/comprehensive-national-industrial-strategy/

18
2012, the government crafted programs and strategies for a comprehensive national industrial
policy that builds innovative and globally-competitive industries and strong local and global
linkages.
Table 6 Major trade and investment policies of the Philippines by decade
Period Policy Regime Policy Description
1950s-1970s Import Substitution Phase
Restrictive Investment Policy
-Protectionist measures such as high tariffs,
import quotas, and other non-tariff barriers
-Restricted foreign ownership to 40.0 percent in
non-pioneer industries; 100.0 percent eligibility
for foreign investment subject to Board of
Investments’ approval
-Complicated investment incentive system
1980s-1990s Unilateral trade Liberalization period
Investment Liberalization
Multilateral/Regional trade
liberalization
-Trade Reform Program (TRP) I: reduced tariff
range from 70.0-100.0 percent to 0.0-50.0 percent
-TRP II: reduced tariff range to 3.0-30.0 percent
-TRP III: further tariff changes towards a 5.0
percent uniform tariff -1987 Omnibus Investment
Code (Board of Investments)
-1991 Foreign Investment Act
-Creation of PEZA (1995), Subic Bay
Metropolitan Authority (1992), & Clark
Development Corporation (1993)
-GATT-WTO (1995)
-AFTA-CEPT (1993)
2000s Trade Facilitation
Regionalism/Bilateralism through
Free Trade Agreement
-Customs reforms (since mid-1990s)
-Revised Kyoto Convention (2009)
-National Single Window (2010)
-ACFTA (2004); AKFTA (2006); AJCEP (2008);
AANZFTA (2009); AIFTA (2009)
-PJEPA (2006)
-ASEAN+3, ASEAN+6 Talks
2010 Innovation-driven industrialization,
trade and Investment policy
GVC-focused industrial policy
-Comprehensive Automotive Resurgence
Strategy (CARS) Program
-Manufacturing roadmap
-Philippine Inclusive Innovation Industrial
Strategy (i3S)
Source: Adopted from Aldaba (2013)
A strategic first step for the CNIS was the development of roadmaps to revive the
manufacturing sector from its stagnant performance in the past two decades. The government,
through DTI, and various industry associations collaborated on a project that generated over
30 roadmaps for various industries in manufacturing as well as agriculture and services.9 For
the manufacturing sector, the roadmaps fed into the Manufacturing Resurgence Program10
whose main goal is to enhance competitiveness of domestic manufacturing industries to
integrate them into higher value added regional and global value chains.
9 Examples of these industries are aerospace, automotive, auto parts, biodiesel, ceramic tiles, chemicals, copper, e-vehicles, electronics, furniture, iron and steel, metal casting, motorcycle, natural health products, petrochemicals, plastics, paper, rubber, tool and die, cacao, carrageenan, condiments, processed fruit, meat and shrimp, information technology and business process management (IT-BPM), and housing. For more on these industries, see: http://industry.gov.ph/ 10 For more on the Manufacturing Resurgence Program, see: http://industry.gov.ph/manufacturing-resurgence-program/
19
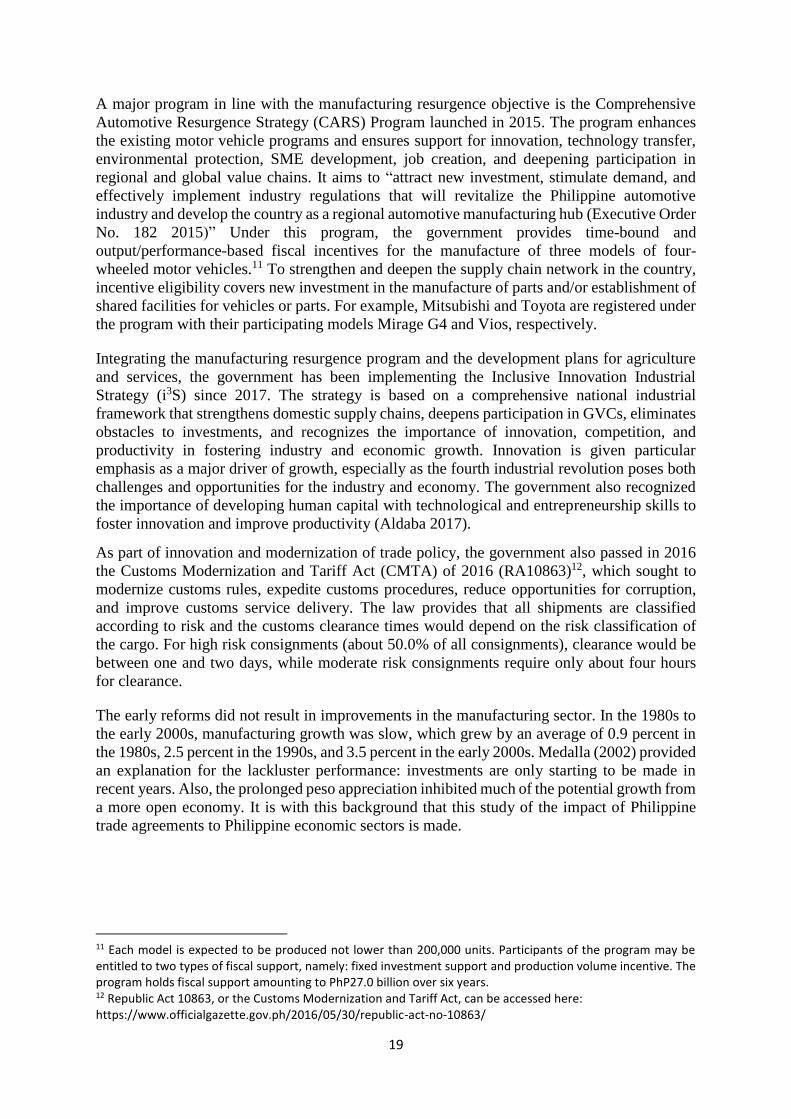
A major program in line with the manufacturing resurgence objective is the Comprehensive
Automotive Resurgence Strategy (CARS) Program launched in 2015. The program enhances
the existing motor vehicle programs and ensures support for innovation, technology transfer,
environmental protection, SME development, job creation, and deepening participation in
regional and global value chains. It aims to “attract new investment, stimulate demand, and
effectively implement industry regulations that will revitalize the Philippine automotive
industry and develop the country as a regional automotive manufacturing hub (Executive Order
No. 182 2015)” Under this program, the government provides time-bound and
output/performance-based fiscal incentives for the manufacture of three models of four-
wheeled motor vehicles.11 To strengthen and deepen the supply chain network in the country,
incentive eligibility covers new investment in the manufacture of parts and/or establishment of
shared facilities for vehicles or parts. For example, Mitsubishi and Toyota are registered under
the program with their participating models Mirage G4 and Vios, respectively.
Integrating the manufacturing resurgence program and the development plans for agriculture
and services, the government has been implementing the Inclusive Innovation Industrial
Strategy (i3S) since 2017. The strategy is based on a comprehensive national industrial
framework that strengthens domestic supply chains, deepens participation in GVCs, eliminates
obstacles to investments, and recognizes the importance of innovation, competition, and
productivity in fostering industry and economic growth. Innovation is given particular
emphasis as a major driver of growth, especially as the fourth industrial revolution poses both
challenges and opportunities for the industry and economy. The government also recognized
the importance of developing human capital with technological and entrepreneurship skills to
foster innovation and improve productivity (Aldaba 2017).
As part of innovation and modernization of trade policy, the government also passed in 2016
the Customs Modernization and Tariff Act (CMTA) of 2016 (RA10863)12, which sought to
modernize customs rules, expedite customs procedures, reduce opportunities for corruption,
and improve customs service delivery. The law provides that all shipments are classified
according to risk and the customs clearance times would depend on the risk classification of
the cargo. For high risk consignments (about 50.0% of all consignments), clearance would be
between one and two days, while moderate risk consignments require only about four hours
for clearance.
The early reforms did not result in improvements in the manufacturing sector. In the 1980s to
the early 2000s, manufacturing growth was slow, which grew by an average of 0.9 percent in
the 1980s, 2.5 percent in the 1990s, and 3.5 percent in the early 2000s. Medalla (2002) provided
an explanation for the lackluster performance: investments are only starting to be made in
recent years. Also, the prolonged peso appreciation inhibited much of the potential growth from
a more open economy. It is with this background that this study of the impact of Philippine
trade agreements to Philippine economic sectors is made.
11 Each model is expected to be produced not lower than 200,000 units. Participants of the program may be entitled to two types of fiscal support, namely: fixed investment support and production volume incentive. The program holds fiscal support amounting to PhP27.0 billion over six years. 12 Republic Act 10863, or the Customs Modernization and Tariff Act, can be accessed here: https://www.officialgazette.gov.ph/2016/05/30/republic-act-no-10863/
20
3. Methodology
3.1 Sources of data
Imports data are taken from PSA for the years 2016-2018, disaggregated into different tariff
schemes. The 2016 imports are classified using the 2004 PSCC, which is based on the HS 2002,
while the 2017 and 2018 imports used the 2015 PSCC, which is based on the HS 2012. These
data were matched against the MFN rates taken from the World Integrated Trade Solutions
(WITS), which used the HS 2012 system. Given the difference in the systems used, the 2016
data were first converted to match the HS 2012.
The growth of the Gross Value Added (GVA) of the sectors were obtained from the Philippine
Statistical Yearbook. The growth of employment and wages of the sectors were obtained from
the October round of the Labor Force Survey (LFS).
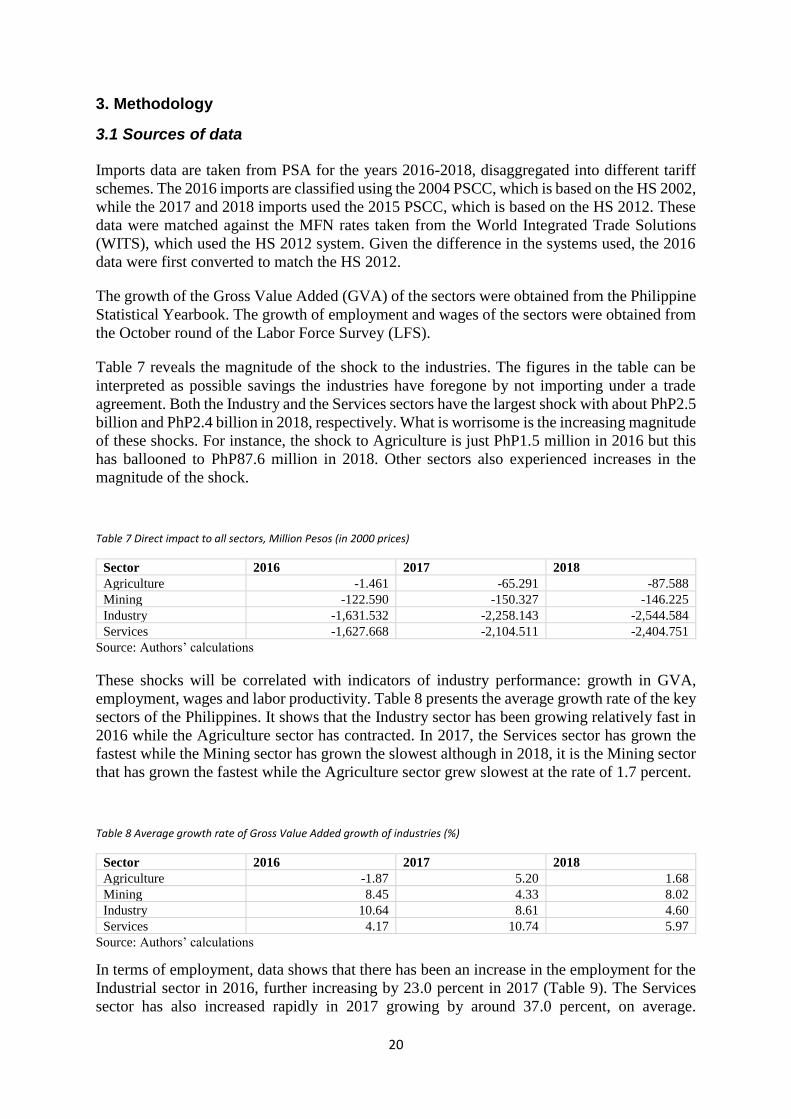
Table 7 reveals the magnitude of the shock to the industries. The figures in the table can be
interpreted as possible savings the industries have foregone by not importing under a trade
agreement. Both the Industry and the Services sectors have the largest shock with about PhP2.5
billion and PhP2.4 billion in 2018, respectively. What is worrisome is the increasing magnitude
of these shocks. For instance, the shock to Agriculture is just PhP1.5 million in 2016 but this
has ballooned to PhP87.6 million in 2018. Other sectors also experienced increases in the
magnitude of the shock.
Table 7 Direct impact to all sectors, Million Pesos (in 2000 prices)
Sector 2016 2017 2018
Agriculture -1.461 -65.291 -87.588
Mining -122.590 -150.327 -146.225
Industry -1,631.532 -2,258.143 -2,544.584
Services -1,627.668 -2,104.511 -2,404.751
Source: Authors’ calculations
These shocks will be correlated with indicators of industry performance: growth in GVA,
employment, wages and labor productivity. Table 8 presents the average growth rate of the key
sectors of the Philippines. It shows that the Industry sector has been growing relatively fast in
2016 while the Agriculture sector has contracted. In 2017, the Services sector has grown the
fastest while the Mining sector has grown the slowest although in 2018, it is the Mining sector
that has grown the fastest while the Agriculture sector grew slowest at the rate of 1.7 percent.
Table 8 Average growth rate of Gross Value Added growth of industries (%)
Sector 2016 2017 2018
Agriculture -1.87 5.20 1.68
Mining 8.45 4.33 8.02
Industry 10.64 8.61 4.60
Services 4.17 10.74 5.97
Source: Authors’ calculations
In terms of employment, data shows that there has been an increase in the employment for the
Industrial sector in 2016, further increasing by 23.0 percent in 2017 (Table 9). The Services
sector has also increased rapidly in 2017 growing by around 37.0 percent, on average.
21
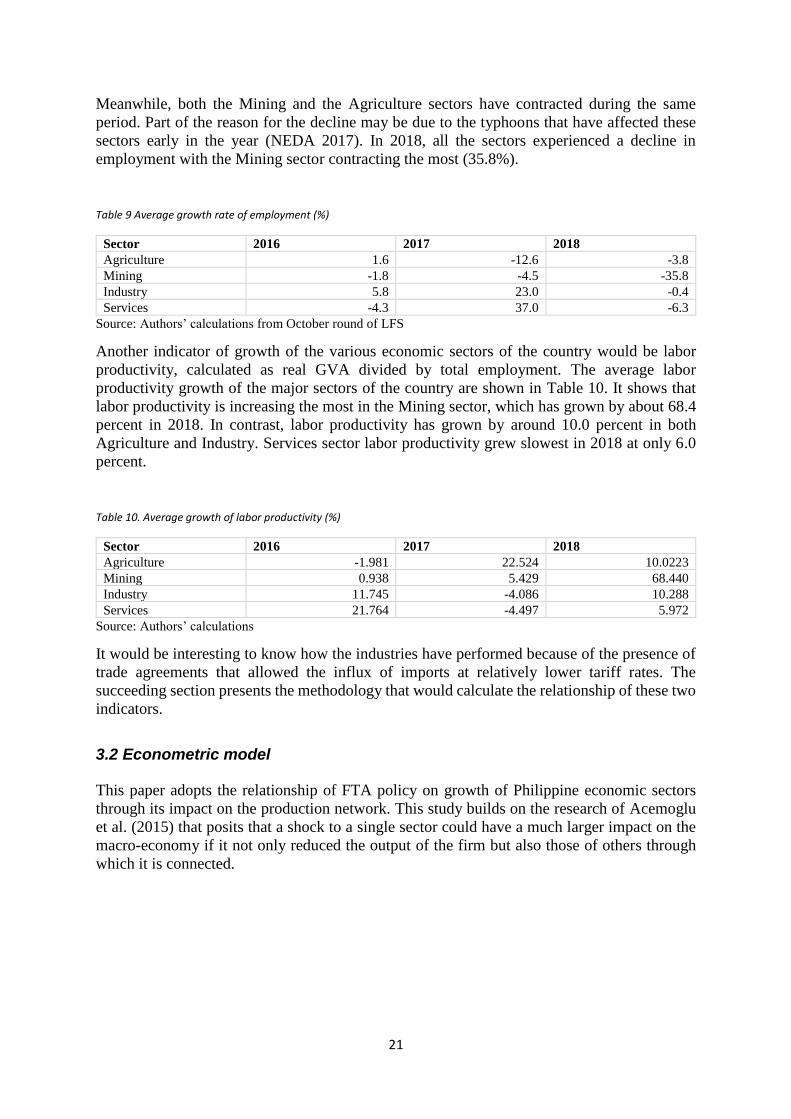
Meanwhile, both the Mining and the Agriculture sectors have contracted during the same
period. Part of the reason for the decline may be due to the typhoons that have affected these
sectors early in the year (NEDA 2017). In 2018, all the sectors experienced a decline in
employment with the Mining sector contracting the most (35.8%).
Table 9 Average growth rate of employment (%)
Sector 2016 2017 2018
Agriculture 1.6 -12.6 -3.8
Mining -1.8 -4.5 -35.8
Industry 5.8 23.0 -0.4
Services -4.3 37.0 -6.3
Source: Authors’ calculations from October round of LFS
Another indicator of growth of the various economic sectors of the country would be labor
productivity, calculated as real GVA divided by total employment. The average labor
productivity growth of the major sectors of the country are shown in Table 10. It shows that
labor productivity is increasing the most in the Mining sector, which has grown by about 68.4
percent in 2018. In contrast, labor productivity has grown by around 10.0 percent in both
Agriculture and Industry. Services sector labor productivity grew slowest in 2018 at only 6.0
percent.
Table 10. Average growth of labor productivity (%)
Sector 2016 2017 2018
Agriculture -1.981 22.524 10.0223
Mining 0.938 5.429 68.440
Industry 11.745 -4.086 10.288
Services 21.764 -4.497 5.972
Source: Authors’ calculations
It would be interesting to know how the industries have performed because of the presence of
trade agreements that allowed the influx of imports at relatively lower tariff rates. The
succeeding section presents the methodology that would calculate the relationship of these two
indicators.
3.2 Econometric model
This paper adopts the relationship of FTA policy on growth of Philippine economic sectors
through its impact on the production network. This study builds on the research of Acemoglu
et al. (2015) that posits that a shock to a single sector could have a much larger impact on the
macro-economy if it not only reduced the output of the firm but also those of others through
which it is connected.

22
The relationship of sectoral performance to the trade shock is provided by the following
equation:
𝛥𝑙𝑛 𝑌𝑖𝑡 = 𝛿𝑡 + 𝜓𝛥𝑙𝑛 𝑌𝑖,𝑡−1 + 𝛽𝑜𝑤𝑛𝑆ℎ𝑜𝑐𝑘𝑖.𝑡−1 + 𝛽𝑢𝑝𝑠𝑡𝑟𝑒𝑎𝑚𝑈𝑝𝑠𝑡𝑟𝑒𝑎𝑚𝑖,𝑡−1
+𝛽𝐷𝑜𝑤𝑛𝑠𝑡𝑟𝑒𝑎𝑚𝐷𝑜𝑤𝑛𝑠𝑡𝑟𝑒𝑎𝑚𝑖,𝑡−1 + 𝜖𝑖,𝑡 ( 1 )
;where, Δln𝑌 is the industry performance indicator (growth of GVA, employment, wage
and labor productivity;
𝑆ℎ𝑜𝑐𝑘 is the direct impact of the FTA shock to the sector;
𝑈𝑝𝑠𝑡𝑟𝑒𝑎𝑚 is the indirect impact of the FTA shock to industry i as the upstream
sector; and,
𝐷𝑜𝑤𝑛𝑠𝑡𝑟𝑒𝑎𝑚 is the indirect impact of the FTA shock to industry i as the
downstream sector.
Equation 1 is shows that the explanatory variables used are the lagged values of the direct shock
and the Upstream and Downstream shocks to address issues of contemporaneous measurement
issues between the dependent variable and the explanatory variable. In addition, model 1 is
estimated using panel fixed effects to control for omitted variable bias.
𝑆ℎ𝑜𝑐𝑘𝑠 are calculated as the difference between FTA imports at time t-1 and the MFN imports
at t-1 at the previous year:
𝑆ℎ𝑜𝑐𝑘𝑠 = 𝐼𝑚𝑝𝑜𝑟𝑡𝑠𝐹𝑇𝐴𝑡 − 𝐼𝑚𝑝𝑜𝑟𝑡𝑠𝑀𝐹𝑁𝑡 ( 2 )
This shock is the main variable as it relates an indicator of the FTA to the performance of the
firms as aggregated into the industry performance. It can be interpreted as the savings of the
industry due to the influx of imported goods under a trade arrangement as against importing
under MFN tariff. Thus, a higher value of the shock implies a higher savings of the industry
because the cost of the importation is lower. Negative values of the shock imply there is a
reduction in the savings of the industry because the industry could have imported the MFN
imports at FTA rates.
The shock variables are then magnified into two further impacts, namely: the downstream and
upstream effects. The downstream and upstream effects are calculated using the following
formula:
𝐷𝑜𝑤𝑛𝑠𝑡𝑟𝑒𝑎𝑚𝑖𝑡 = ∑ (𝑖𝑛𝑝𝑢𝑡%𝑗→𝑖2012 − 1𝑗=𝑖)𝑗 ∗ 𝑠ℎ𝑜𝑐𝑘𝑗𝑡 ( 3 )
𝑈𝑝𝑠𝑡𝑟𝑒𝑎𝑚𝑖𝑡 = ∑ (𝑜𝑢𝑡𝑝𝑢𝑡%𝑖→𝑗2012 − 1𝑗=𝑖)𝑗 ∗ 𝑠ℎ𝑜𝑐𝑘𝑗𝑡 ( 4 )
The study assumes that the direct shock to a certain industry is the difference in the value of
imports under an Economic Partnership Agreement (EPA) with value of imports under MFN.
Given this shock, the downstream and upstream effects to a given industry is calculated using
the Leontief coefficients13 (Equations 3 and 4). On the one hand, Equation 3 says that the shock
to some industry j affects industry i because industry i is in the downstream of these industries
while, on the other hand, Equation 4 says that the shock to an industry j will affect industry i
13 The coefficients of industries are matched to the IO linkages using the 2012 IO table, which contains 65 industries. However, the 2012 IO table follows the classification of industries using the 1994 PSIC, which closely matches to ISIC 3.1. In order to match the import products that are already classified using the HS 2012 system, the codes must be converted to the Central Product Classification (CPC) 2.1, to ISIC 4.0, then to ISIC 3.1

23
because industry i is in the upstream of these industries. Acemoglu et al. (2015) describes
downstream more succinctly as the impact to an industry arising from its suppliers while
upstream as the impact arising from its customers.
Table 11 presents the average multiplier effect of a shock in a given sector. It shows that a one
unit shock to industry j will affect be, on average, translated to about 0.6 units impact to
industries in the Agriculture sector because the Agriculture sector is the supplier (upstream) of
industry j. On the other hand, a one unit shock to industry j will translate to about 0.5 units of
shock to the industries in the Agriculture sector because these industries in the Agriculture
sector are customers of industry j.
Table 11 also reveals that the average upstream multiplier is relatively higher for all sectors
except for industry where the downstream multiplier is higher. This means that a one-unit shock
to industry j will be around 1.6 units of shock to sectors in the Industry sector because these
sectors purchase their inputs from industry j. Meanwhile, a one-unit shock to industry j will
only be 1.1 units of shock to sectors to the Industrial sector because the Industrial sector is the
supplier to industry j. The upstream and downstream multipliers show that Industry is really
affected by shocks to its suppliers more than shocks from its customers while the other sectors
are affected by shocks to their customer industries.
Table 11. Average Upstream and Downstream multipliers by industry
Sector Upstream
(Arising from
customers)
Downstream
(Arising from
suppliers)
Agriculture 0.60 0.54
Mining 1.06 1.05
Industry 1.12 1.63
Services 1.36 0.98
Source: Authors’ calculations14
Examine the following illustration of the upstream and downstream multipliers. Consider the
canned tuna manufacturing industry where the local tuna harvesting industry is the supplier of
the canned tuna manufacturing industry that is in turn the supplier to the wholesale and retail
sector of food products.
An FTA-shock of one unit would have a direct impact to all three industries: local tuna
harvesting industry, canned tuna manufacturing industry, and wholesale and retail industry.
However, there is the network effect on the canned tuna manufacturing industry such that the
one-unit shock would be about 0.54 units as the shock is coming from the tuna harvesting
industry (Agriculture row in Table 11, column Downstream), a supplier of the canned tuna
manufacturing industry. In addition, the canned tuna manufacturing industry would be
experiencing a 1.36-unit additional shock from the shock experienced by the wholesale and
retail sector of food product (Services row in Table 11, column Upstream).
14 See Appendix 2 for the Upstream and Downstream multipliers by industry.
24
4. Results and Discussion
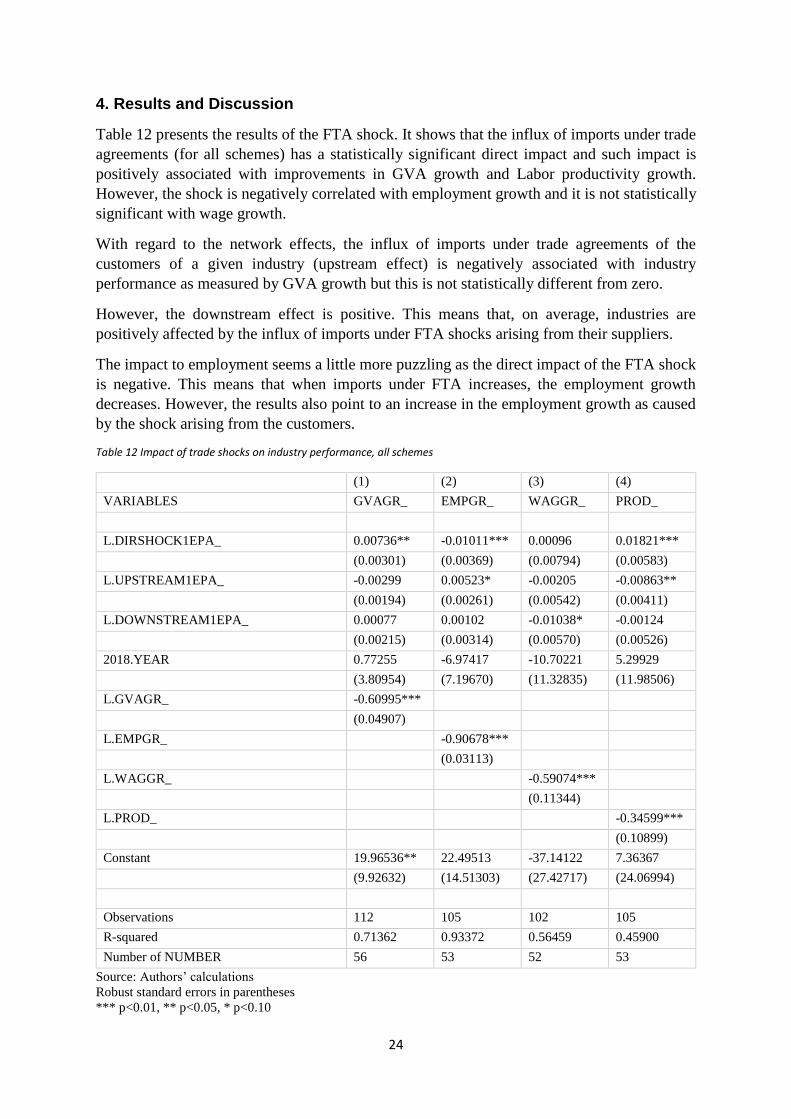
Table 12 presents the results of the FTA shock. It shows that the influx of imports under trade
agreements (for all schemes) has a statistically significant direct impact and such impact is
positively associated with improvements in GVA growth and Labor productivity growth.
However, the shock is negatively correlated with employment growth and it is not statistically
significant with wage growth.
With regard to the network effects, the influx of imports under trade agreements of the
customers of a given industry (upstream effect) is negatively associated with industry
performance as measured by GVA growth but this is not statistically different from zero.
However, the downstream effect is positive. This means that, on average, industries are
positively affected by the influx of imports under FTA shocks arising from their suppliers.
The impact to employment seems a little more puzzling as the direct impact of the FTA shock
is negative. This means that when imports under FTA increases, the employment growth
decreases. However, the results also point to an increase in the employment growth as caused
by the shock arising from the customers.
Table 12 Impact of trade shocks on industry performance, all schemes
(1) (2) (3) (4)
VARIABLES GVAGR_ EMPGR_ WAGGR_ PROD_
L.DIRSHOCK1EPA_ 0.00736** -0.01011*** 0.00096 0.01821***
(0.00301) (0.00369) (0.00794) (0.00583)
L.UPSTREAM1EPA_ -0.00299 0.00523* -0.00205 -0.00863**
(0.00194) (0.00261) (0.00542) (0.00411)
L.DOWNSTREAM1EPA_ 0.00077 0.00102 -0.01038* -0.00124
(0.00215) (0.00314) (0.00570) (0.00526)
2018.YEAR 0.77255 -6.97417 -10.70221 5.29929
(3.80954) (7.19670) (11.32835) (11.98506)
L.GVAGR_ -0.60995***
(0.04907)
L.EMPGR_
-0.90678***
(0.03113)
L.WAGGR_
-0.59074***
(0.11344)
L.PROD_
-0.34599***
(0.10899)
Constant 19.96536** 22.49513 -37.14122 7.36367
(9.92632) (14.51303) (27.42717) (24.06994)
Observations 112 105 102 105
R-squared 0.71362 0.93372 0.56459 0.45900
Number of NUMBER 56 53 52 53
Source: Authors’ calculations
Robust standard errors in parentheses
*** p<0.01, ** p<0.05, * p<0.10
25
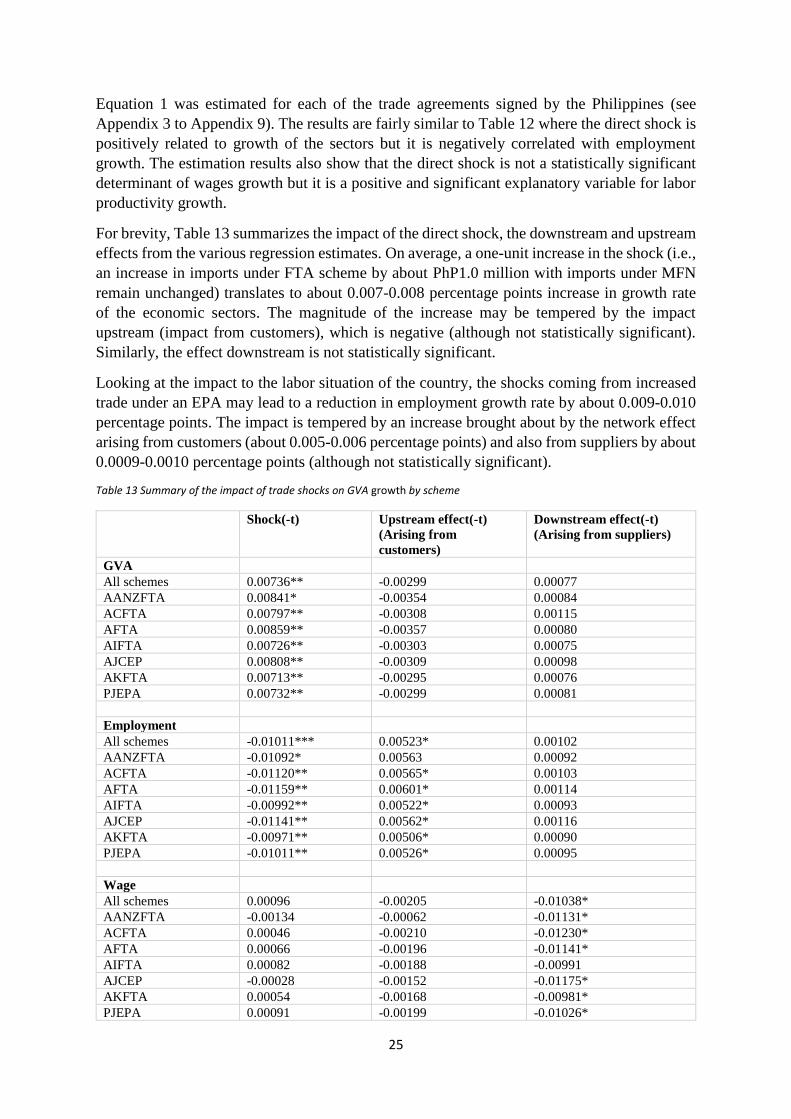
Equation 1 was estimated for each of the trade agreements signed by the Philippines (see
Appendix 3 to Appendix 9). The results are fairly similar to Table 12 where the direct shock is
positively related to growth of the sectors but it is negatively correlated with employment
growth. The estimation results also show that the direct shock is not a statistically significant
determinant of wages growth but it is a positive and significant explanatory variable for labor
productivity growth.
For brevity, Table 13 summarizes the impact of the direct shock, the downstream and upstream
effects from the various regression estimates. On average, a one-unit increase in the shock (i.e.,
an increase in imports under FTA scheme by about PhP1.0 million with imports under MFN
remain unchanged) translates to about 0.007-0.008 percentage points increase in growth rate
of the economic sectors. The magnitude of the increase may be tempered by the impact
upstream (impact from customers), which is negative (although not statistically significant).
Similarly, the effect downstream is not statistically significant.
Looking at the impact to the labor situation of the country, the shocks coming from increased
trade under an EPA may lead to a reduction in employment growth rate by about 0.009-0.010
percentage points. The impact is tempered by an increase brought about by the network effect
arising from customers (about 0.005-0.006 percentage points) and also from suppliers by about
0.0009-0.0010 percentage points (although not statistically significant).
Table 13 Summary of the impact of trade shocks on GVA growth by scheme
Shock(-t) Upstream effect(-t)
(Arising from
customers)
Downstream effect(-t)
(Arising from suppliers)
GVA
All schemes 0.00736** -0.00299 0.00077
AANZFTA 0.00841* -0.00354 0.00084
ACFTA 0.00797** -0.00308 0.00115
AFTA 0.00859** -0.00357 0.00080
AIFTA 0.00726** -0.00303 0.00075
AJCEP 0.00808** -0.00309 0.00098
AKFTA 0.00713** -0.00295 0.00076
PJEPA 0.00732** -0.00299 0.00081
Employment
All schemes -0.01011*** 0.00523* 0.00102
AANZFTA -0.01092* 0.00563 0.00092
ACFTA -0.01120** 0.00565* 0.00103
AFTA -0.01159** 0.00601* 0.00114
AIFTA -0.00992** 0.00522* 0.00093
AJCEP -0.01141** 0.00562* 0.00116
AKFTA -0.00971** 0.00506* 0.00090
PJEPA -0.01011** 0.00526* 0.00095
Wage
All schemes 0.00096 -0.00205 -0.01038*
AANZFTA -0.00134 -0.00062 -0.01131*
ACFTA 0.00046 -0.00210 -0.01230*
AFTA 0.00066 -0.00196 -0.01141*
AIFTA 0.00082 -0.00188 -0.00991
AJCEP -0.00028 -0.00152 -0.01175*
AKFTA 0.00054 -0.00168 -0.00981*
PJEPA 0.00091 -0.00199 -0.01026*

26
Labor productivity
All schemes 0.01821*** -0.00863* -0.00124
AANZFTA 0.02093** -0.00994* -0.00113
ACFTA 0.02018*** -0.00927* -0.00110
AFTA 0.02122** -0.01013* -0.00146
AIFTA 0.01798*** -0.00871* -0.00114
AJCEP 0.02067*** -0.00928* -0.00140
AKFTA 0.01768*** -0.00846* -0.00110
PJEPA 0.01819*** -0.00868** -0.00117
Source: Authors’ calculations
*** p<0.01, ** p<0.05, * p<0.10
With regard to labor productivity, the results of the study show that higher FTA imports relative
to MFN imports is associated with higher labor productivity. The magnitude of a one increase
in the shock would be associated with around 0.017-0.020 percentage point increase in labor
productivity.
The impact to GVA growth mirrors closely the import structure of the Philippines. Key imports
from Japan and neighboring countries in ASEAN are electronic integrated circuits and micro-
assemblies. These are also the same industries that have been tagged as having the largest Gross
Domestic Product (GDP) multipliers, which is an indicator of linkages in the economy. This
may provide a reason why AJCEP and AFTA are the trade agreements that have the largest
estimated direct impact (Figure 3).
The results also provide a possible explanation for the perceived “jobless” growth that the
Philippines is experiencing (Salvosa 2015; Mourdoukoutas 2019; Punongbayan 2019). The
benefits from trade are translated as growth in output but it does not result in increase in
employment. The economic sectors benefit from expanding their output due to the increase in
imports but they are not hiring additional workers. Finally, the results show a positive and
significant effect on labor productivity. This means that as businesses would increase the
efficiency of their workforce because of the increase in imports from FTAs. However, the
direct effect is tempered by the network effects (Upstream and Downstream), which are
negative.

27
Figure 3 Top 3 import products by top 10 import source with an FTA to the Philippines, 2014-2018 (5-year average)
Source: Adopted from Quimba, Rosellon, and Calizo (2020)
Product Description: (0202) Meat of bovine animals, frozen; (1006) Rice; (1518) Animal or vegetable fats, oils, fractions, modified in any way; (2523) Portland cement,
aluminous cement, slag cement, supersulphate cement and similar hydraulic cements; (2701) Coal; (2709) Petroleum oils and oils obtained from bituminous minerals, crude;
(2710) Petroleum oils, oils from bituminous minerals, not crude; (3004) Medicaments; (8473) Machinery; (8517) Electrical apparatus for line- telephony or telegraphy;
(8525) Transmission apparatus for radio- telephony, telegraphy, broadcasting or television; (8542) Electronic integrated circuits and microassemblies; (8702) Vehicles;
(8703) Motor cars and other motor vehicles; (8704) Vehicles, for the transport of goods; (8711) Motorcycles and cycles

28
5. Conclusion and Policy Recommendations
5.1 Conclusion
Trade is an important component of the Philippine economy given that 2017 figures show that
total imports and exports (size of trade) is about 72.0 percent of GDP. The Philippine
Development Plan 2017-2022 (NEDA 2017) also identified trade as an integral component of
the Philippine strategy for industrial development through the expansion of markets and
increasing the linkages of domestic firms, particularly the Micro, Small, and Medium
Enterprises (MSMEs) to GVCs. To this, the Philippines has pursued forming trade agreements
with key partners in the region.
The Philippine trade agreements has allowed the Philippines to import majority of products
from its partner countries at zero tariff rates (Table 14). Neighboring ASEAN partners have
close to 100.0 percent of its exports to the Philippines at zero percent tariff. Japan, through the
PJEPA, and Australia and New Zealand also have more than 95.0 percent of products subjected
to zero tariffs. Despite this, utilization rates of FTAs (Table 15) have been very low for some
of the country’s key partners. Japan, India, and South Korea have below 50.0 percent utilization
rate of FTAs. China performs a little better at 62.7 percent but this is still relatively lower than
Thailand (73.4%), Indonesia (79.3%) and New Zealand (81.4%).
Table 14 Share of tariff lines with zero tariff rates to total tariff lines by FTA
2016 2017 2018
AANZFTA 95.75 95.78 95.22
ACFTA 88.28 88.28 84.71
AFTA 5.13 99.23 99.30
AIFTA 5.05 5.04 12.96
AJCEP 70.78 72.43 91.92
AKFTA 90.15 90.01 86.91
PJEPA 74.34 75.86 95.01
Source: Adopted from Quimba, Rosellon, and Calizo (2020)
Note: Calculated for imports where the Most Favored Nation (MFN) tariff is greater than the tariff under the trade
agreement
Table 15 Utilization rate of FTAs by FTA partner in 2018, %
AANZFTA ACFTA AFTA AIFTA AJCEP AKFTA PJEPA MFN
Australia 54.1 - - - - - - 45.9
Brunei
Darussalam
- - 92.2 - - - - 7.8
Cambodia - - 59.0 - - - - 41.0
China - 62.7 - - - - - 37.3
Indonesia - - 79.3 - - - - 20.7
India - - - 35.0 - - - 65.0
Japan - - - - 0.7 - 16.6 82.7
Korea,
Republic of
- - - - - 31.2 - 68.8
Lao PDR - - 74.9 - - - - 25.1
Myanmar - - 66.6 - - - - 33.4
Malaysia - - 55.5 - - 0.0 - 44.5
New Zealand 81.4 - - - - - - 18.6
Singapore - 0.1 25.6 - 0.0 - - 74.3
Thailand - - 73.4 - - - - 26.6
Viet Nam 0.2 0.2 60.3 - - - - 39.2

29
Source: Adopted from Quimba, Rosellon, and Calizo (2020)
Note: Calculated for imports where the Most Favored Nation (MFN) tariff is greater than the tariff under the
trade agreement
It is with this background that this study analyzed the impact of imports under lower tariff rates
relative to Philippine economic sectors. Using Philippine imports data matched with data on
industry performance, this study was able to calculate the direct impact of trade agreements to
various sectors. It was also able to control for the network effects that would also indirectly
affect the performance of different sectors of the country. The results of the analysis show that
FTA imports have a positive and significant direct effect on industry growth and labor
productivity. The network effects are not statistically significant for real GVA growth. In terms
of impact on employment, the direct effect is negative and statistically significant. However,
the network effects would temper this effect because the Upstream effect (effect from
customers) is positive and significant.
The shock also has a positive and statistically significant direct effect on labor productivity,
which implies that increasing imports increases labor productivity of Philippine sectors.
5.2 Policy recommendations
The results of the analysis show that imports under an FTA scheme (relative to MFN imports)
have a positive and significant direct effect on industry growth and labor productivity. This
provides evidence that the country is benefiting from trade agreements through improvements
of industry output. The results also show that the Philippines is not benefitting from trade
agreements through the increase in employment. Businesses seem to increase their output by
increasing the labor productivity of their employees rather than increasing the number of
workers.
The results of the analysis show that the linkages of the Philippines seem weak as reflected by
the statistically insignificant relationship of the upstream and downstream effects with GVA.
One way of increasing the connectivity of Philippine businesses and industries is to initiate
Supplier development and linkage programs which would link domestic firms, especially
SMEs, with foreign affiliates of MNCs. It is recommended that key government agencies
related to trade and investment (e.g. DTI/BOI) facilitate the matching of firms as well as
providing subcontracting and outsourcing advice to domestic firms.
The impact of trade agreements on industry performance is magnified by network effects. It is
recommended that policies which support industries sourcing their inputs domestically be
pursued. This would include policies that strengthen the supply chain and reduce the non-tariff
related cost of importation (i.e., informal payments). The passage of the CMTA of 2016 and
Ease of Doing Business Act of 2018 (RA11032)15, is a good first step toward this end but there
is a need to review whether the provisions of the law are being strictly implemented.
It is also recommended that trade policies ensure that businesses translate gains from cheaper
imports to increasing production and employment. The negative relationship between the shock
and employment reveal that businesses are hesitant to increase employment despite benefiting
from importation at lower rates. It is therefore recommended that trade policies are supported
by strong employment policies. In an interview, former NEDA Secretary General Ernesto
Pernia mentioned that young Filipinos “are underutilized because their skills are not being
15 Republic Act 11032, or the Ease of Doing Business and Efficient Government Services Delivery Act of 2018, can be accessed here: https://www.officialgazette.gov.ph/2018/05/28/republic-act-no-11032/

30
enhanced by education, training or employment. Government needs to strengthen its JobStart
program, which provides assistance to young Filipinos in finding decent jobs (NEDA 2016).”
Businesses are hesitant to increase employment because these tend to become long-term
investments which would include in-house training and skills development. Thus, government
needs to increase the confidence of industries and companies in the growth prospects of the
country for them to translate their gains from tariff-free imports to employment.
There is also the need to address the supply side issues of labor. To ensure that businesses
would be able to find the appropriately skilled workers for employment, there may be a need
for government to provide incentives to encourage universities and researchers to interact more
closely with industry and thus, in the medium to long run develop the specialized skills and
technological capabilities they need.
Finally, the results of the study are greatly dependent on the availability of data on imports at
the firm level. PSA has already expressed matching the Foreign Trade Statistics with the
Annual Survey of Philippine Business and Industry. It would be good to revisit the results of
this study using that dataset.

31
References
Acemoglu, D., U. Akcigit, and W. Kerr. 2015. Networks and the macroeconomy: An
empirical exploration. NBER Macroeconomics Annual 30(1): 273-335.
Aldaba, R. 2008. SMEs in the Philippine manufacturing industry and globalization: Meeting
the development challenges. In H. Lim (Ed.), SME in Asia and Globalization.
https://www.eria.org/SMEs%20in%20the%20Philippine%20Manufacturing%20Indu
stry%20and%20Globalization%20Meeting_the%20Development%20Challenges.pdf
(accessed March 2020)
———. 2013. Twenty years after Philippine trade liberalization and industrialization: What
has happened and where do we go from here. PIDS Discussion Paper Series No.
2013-21. https://pidswebs.pids.gov.ph/CDN/PUBLICATIONS/pidsdps1321.pdf
(accessed March 2020)
———. 27 May 2015. The Philippine new industrial policy for more competitive regional
economies. Presented at the Baguio Country Club. http://industry.gov.ph/wp-
content/uploads/2015/09/Aldaba_Baguio-28May.pdf (accessed March 2020)
———. 21 Sep 2017. The Philippine new industrial strategy: Inclusive, innovative and
sustainable. Presented at the Symposium on Economic Integration and Nation
Building. Pasig City, Philippines.
Aldaba, R. and F. Aldaba. 2010. Assessing the spillover effects of FDI to the Philippines.
PIDS Discussion Paper Series No. 2010-27.
https://pidswebs.pids.gov.ph/CDN/PUBLICATIONS/pidsdps1027.pdf (accessed
March 2020)
Aldaba, R. and C. Cororaton. 2002. Trade liberalization and pollution: Evidence from the
Philippines. Economy and Environment Program for Southeast Asia Research
Report No. 2002-RR7. https://idl-bnc-
idrc.dspacedirect.org/bitstream/handle/10625/45901/132347.pdf;jsessionid=8626479
334B4D5730B6C94FD12EC3435?sequence=1 (accessed March 2020)
Aldaba, R., E. Medalla, J. Yap, M. Rosellon, F. del Prado, M. Mantaring, and V. Ledda.
2015. Survey report on the use of free trade agreements in the Philippines. In L. Ing
and S. Urata (Eds.), The use of FTAs in ASEAN: Survey-based analysis. Jakarta,
Indonesia: Economic Research Institute for ASEAN and East Asia.
Balisacan, A. and H. Hill (Eds.). 2003. The Philippine economy: Development, policies, and
challenges. USA: Oxford University Press.
Barral, M. and F. Quimba. 2019. JPEPA, a decade after: Evaluating the effects in Philippine
exports using the synthetic control method. PIDS Discussion Paper Series No. 2019-
33. https://pidswebs.pids.gov.ph/CDN/PUBLICATIONS/pidsdps1933.pdf (accessed
March 2020)
Duke University Center on Globalization, Governance and Competitiveness (Duke CGGC).
2016. The Philippines: Upgrading in manufacturing global value chains.
http://industry.gov.ph/wp-content/uploads/2017/08/The-Philippines-in-
Manufacturing-Global-Value-Chains_An-Introduction.pdf (accessed March 2020)

32
Executive Order No. 182. 2015. Providing for a comprehensive automotive resurgence
strategy program. https://www.officialgazette.gov.ph/2015/05/29/executive-order-
no-182-s-2015/ (accessed March 2020)
Gereffi, G. and K. Fernandez-Stark. 2011. Global value chain analysis: A primer. USA, NC:
Duke University Center on Globalization, Governance & Competitiveness.
Gereffi, G., J. Humphrey, and T. Sturgeon. 2005. The governance of global value chains.
Review of International Political Economy 12(1): 78-104.
Herrin, A. and E. Pernia. 2003. Population, human resources, and employment. In A.
Balisacan and H. Hill (Eds.), The Philippine economy: Development, policies, and
challenges. USA: Oxford University Press.
Llanto, G. 2012. Philippine productivity dynamics in the last five decades and determinants
of total factor productivity. PIDS Discussion Paper Series No. 2012-11.
https://dirp4.pids.gov.ph/ris/dps/pidsdps1211.pdf (accessed March 2020)
Medalla, E. 2002. Trade and industrial policy beyond 2000: An assessment of the Philippine
economy. In J. Yap (Ed.), The Philippines beyond 2000: An economic assessment.
Makati City, Philippines: Philippine Institute for Development Studies.
Mourdoukoutas, P. 10 Feb 2019. Duterte’s jobless economic boom. Forbes.
https://www.forbes.com/sites/panosmourdoukoutas/2019/02/10/dutertes-jobless-
economic-boom/#402830f33ed3 (accessed August 2020)
National Economic and Development Authority (NEDA). 2016. Vibrant labor market
accompanies GDP growth. https://www.neda.gov.ph/vibrant-labor-market-
accompanies-gdp-growth/ (accessed August 2020)
———. 2017. Philippine development plan 2017-2022. http://pdp.neda.gov.ph/wp-
content/uploads/2017/01/PDP-2017-2022-07-20-2017.pdf (accessed January 2020)
Patalinghug, E., G. Llanto, A. Fillone, N. Tiglao, C. Salazar, C. Madriaga, and M. Arbo.
2015. Port congestion and underutilization in the Greater Capital Region:
Unpacking the issues. PIDS Policy Notes No. 2015-07.
https://pidswebs.pids.gov.ph/CDN/PUBLICATIONS/pidspn1507.pdf (accessed
March 2020)
Punongbayan, JC. 18 Jul 2019. The poor quality of economic growth under Duterte. Rappler.
https://rappler.com/voices/thought-leaders/analysis-poor-quality-economic-growth-
under-duterte (accessed August 2020)
Quimba, F., M. Rosellon, and S., Jr. Calizo. 2020. FTA utilization of Philippine imports.
PIDS Discussion Paper Series No. 2020-25.
https://www.pids.gov.ph/publications/7150 (accessed 17 December 2020)
Salvosa, F. 1 Sep 2015. Philippines struggles with unemployment despite economic growth.
CNBC. https://www.cnbc.com/2015/09/01/unemployment-in-philippines-an-issue-
despite-rapid-economic-growth.html (accessed August 2020)

33
Wignaraja, G., T. Lazaro, and G. de Guzman. 2010. FTAs and Philippine business: Evidence
from transport, food and electronics firms. ADBI Working Paper Series No. 185.
https://www.adb.org/publications/ftas-and-philippine-business-evidence-transport-
food-and-electronics-firms (accessed January 2020)
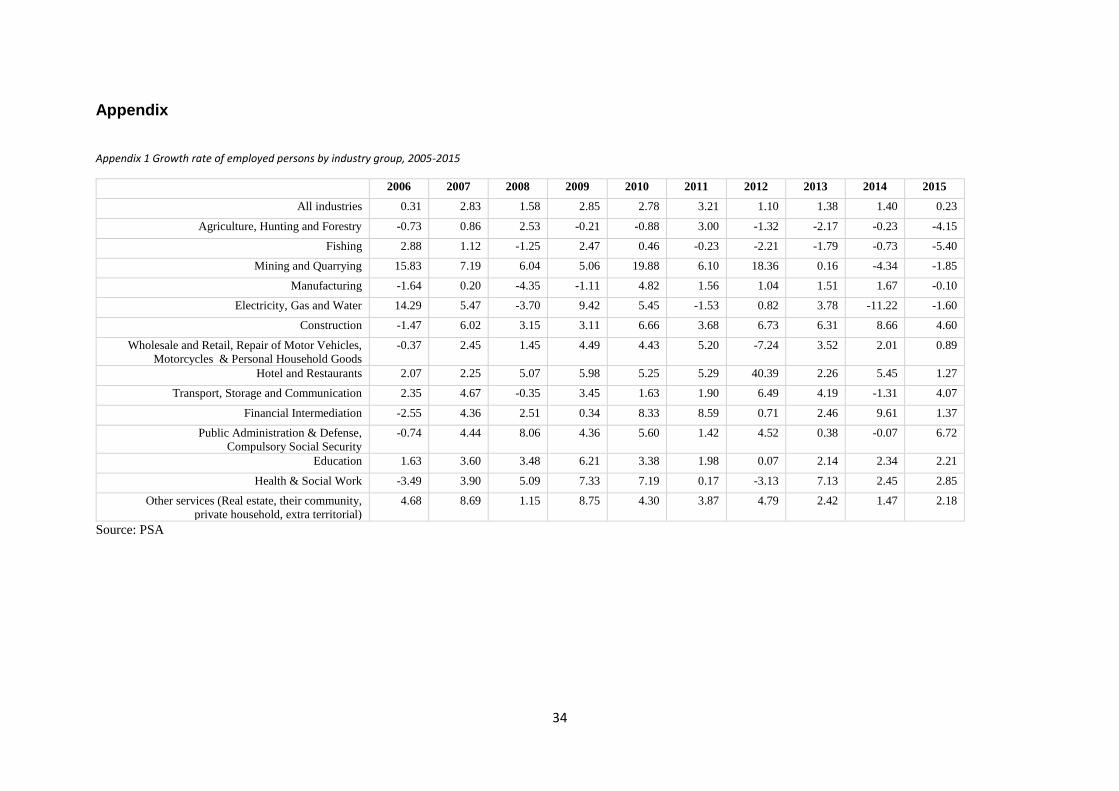
34
Appendix
Appendix 1 Growth rate of employed persons by industry group, 2005-2015
2006 2007 2008 2009 2010 2011 2012 2013 2014 2015
All industries 0.31 2.83 1.58 2.85 2.78 3.21 1.10 1.38 1.40 0.23
Agriculture, Hunting and Forestry -0.73 0.86 2.53 -0.21 -0.88 3.00 -1.32 -2.17 -0.23 -4.15
Fishing 2.88 1.12 -1.25 2.47 0.46 -0.23 -2.21 -1.79 -0.73 -5.40
Mining and Quarrying 15.83 7.19 6.04 5.06 19.88 6.10 18.36 0.16 -4.34 -1.85
Manufacturing -1.64 0.20 -4.35 -1.11 4.82 1.56 1.04 1.51 1.67 -0.10
Electricity, Gas and Water 14.29 5.47 -3.70 9.42 5.45 -1.53 0.82 3.78 -11.22 -1.60
Construction -1.47 6.02 3.15 3.11 6.66 3.68 6.73 6.31 8.66 4.60
Wholesale and Retail, Repair of Motor Vehicles,
Motorcycles & Personal Household Goods
-0.37 2.45 1.45 4.49 4.43 5.20 -7.24 3.52 2.01 0.89
Hotel and Restaurants 2.07 2.25 5.07 5.98 5.25 5.29 40.39 2.26 5.45 1.27
Transport, Storage and Communication 2.35 4.67 -0.35 3.45 1.63 1.90 6.49 4.19 -1.31 4.07
Financial Intermediation -2.55 4.36 2.51 0.34 8.33 8.59 0.71 2.46 9.61 1.37
Public Administration & Defense,
Compulsory Social Security
-0.74 4.44 8.06 4.36 5.60 1.42 4.52 0.38 -0.07 6.72
Education 1.63 3.60 3.48 6.21 3.38 1.98 0.07 2.14 2.34 2.21
Health & Social Work -3.49 3.90 5.09 7.33 7.19 0.17 -3.13 7.13 2.45 2.85
Other services (Real estate, their community,
private household, extra territorial)
4.68 8.69 1.15 8.75 4.30 3.87 4.79 2.42 1.47 2.18
Source: PSA
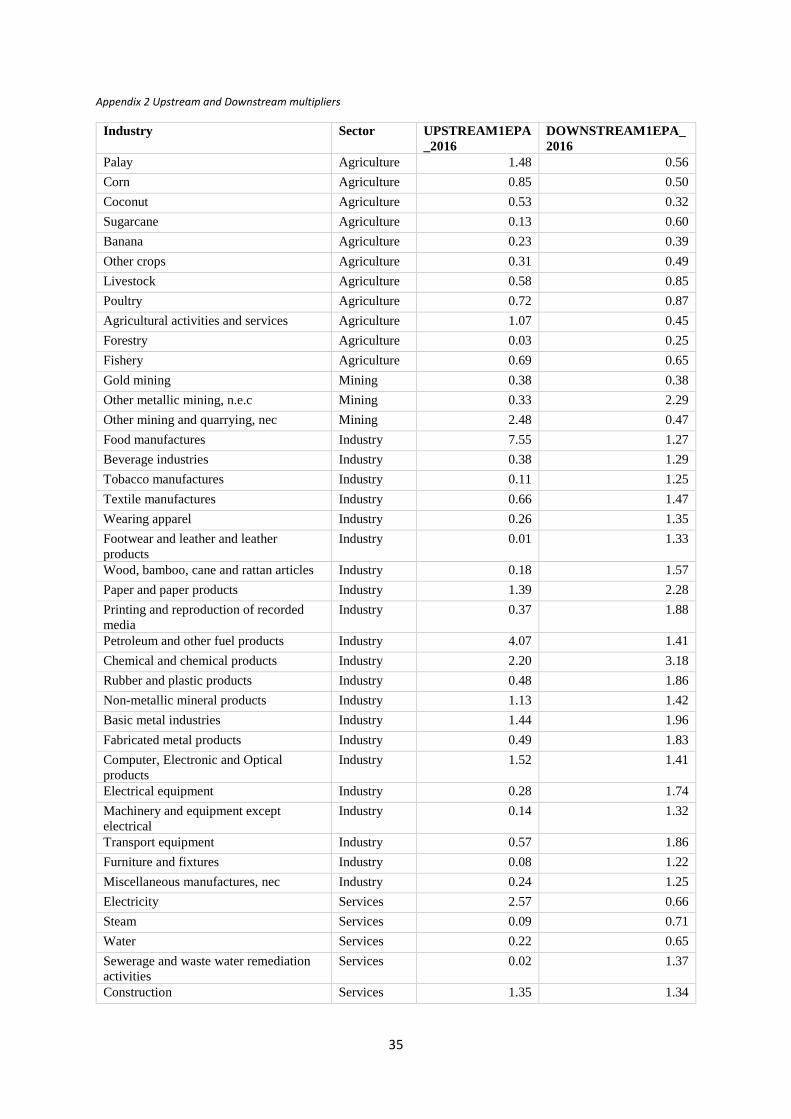
35
Appendix 2 Upstream and Downstream multipliers
Industry Sector UPSTREAM1EPA
_2016
DOWNSTREAM1EPA_
2016
Palay Agriculture 1.48 0.56
Corn Agriculture 0.85 0.50
Coconut Agriculture 0.53 0.32
Sugarcane Agriculture 0.13 0.60
Banana Agriculture 0.23 0.39
Other crops Agriculture 0.31 0.49
Livestock Agriculture 0.58 0.85
Poultry Agriculture 0.72 0.87
Agricultural activities and services Agriculture 1.07 0.45
Forestry Agriculture 0.03 0.25
Fishery Agriculture 0.69 0.65
Gold mining Mining 0.38 0.38
Other metallic mining, n.e.c Mining 0.33 2.29
Other mining and quarrying, nec Mining 2.48 0.47
Food manufactures Industry 7.55 1.27
Beverage industries Industry 0.38 1.29
Tobacco manufactures Industry 0.11 1.25
Textile manufactures Industry 0.66 1.47
Wearing apparel Industry 0.26 1.35
Footwear and leather and leather
products
Industry 0.01 1.33
Wood, bamboo, cane and rattan articles Industry 0.18 1.57
Paper and paper products Industry 1.39 2.28
Printing and reproduction of recorded
media
Industry 0.37 1.88
Petroleum and other fuel products Industry 4.07 1.41
Chemical and chemical products Industry 2.20 3.18
Rubber and plastic products Industry 0.48 1.86
Non-metallic mineral products Industry 1.13 1.42
Basic metal industries Industry 1.44 1.96
Fabricated metal products Industry 0.49 1.83
Computer, Electronic and Optical
products
Industry 1.52 1.41
Electrical equipment Industry 0.28 1.74
Machinery and equipment except
electrical
Industry 0.14 1.32
Transport equipment Industry 0.57 1.86
Furniture and fixtures Industry 0.08 1.22
Miscellaneous manufactures, nec Industry 0.24 1.25
Electricity Services 2.57 0.66
Steam Services 0.09 0.71
Water Services 0.22 0.65
Sewerage and waste water remediation
activities
Services 0.02 1.37
Construction Services 1.35 1.34

36
Wholesale and retail trade and
Maintenance and repair of motor
vehicles
Services 14.79 1.05
Land transport Services 1.95 1.17
Water transport Services 0.06 1.25
Air transport Services 0.24 1.48
Warehousing and support activities for
transportation
Services 0.98 1.14
Postal and courier activities Services 0.01 1.15
Publishing and Information Services 0.14 1.40
Communication Services 0.60 0.76
Banking Institutions Services 1.43 0.68
Non-bank Financial Intermediation Services 2.47 0.63
Insurance and activities auxiliary to
financial intermediation
Services 1.59 1.04
Real Estate Activities Services 0.45 0.84
Ownership of Dwellings Services 0.00 0.25
Professional, Scientific and Technical
Activities
Services 0.64 0.97
Administrative and Support Service
Activities
Services 0.77 0.86
Public Administration and Defense;
Compulsory social security
Services 0.39 0.71
Accommodation and Food Service
Activities
Services 0.93 1.37
Education Services 0.81 0.38
Human Health and Social Work
Activities
Services 0.19 0.98
Arts, Entertainment and Recreation Services 0.38 1.26
Other Service Activities, nec Services 2.19 1.25
Source: Authors’ calculation
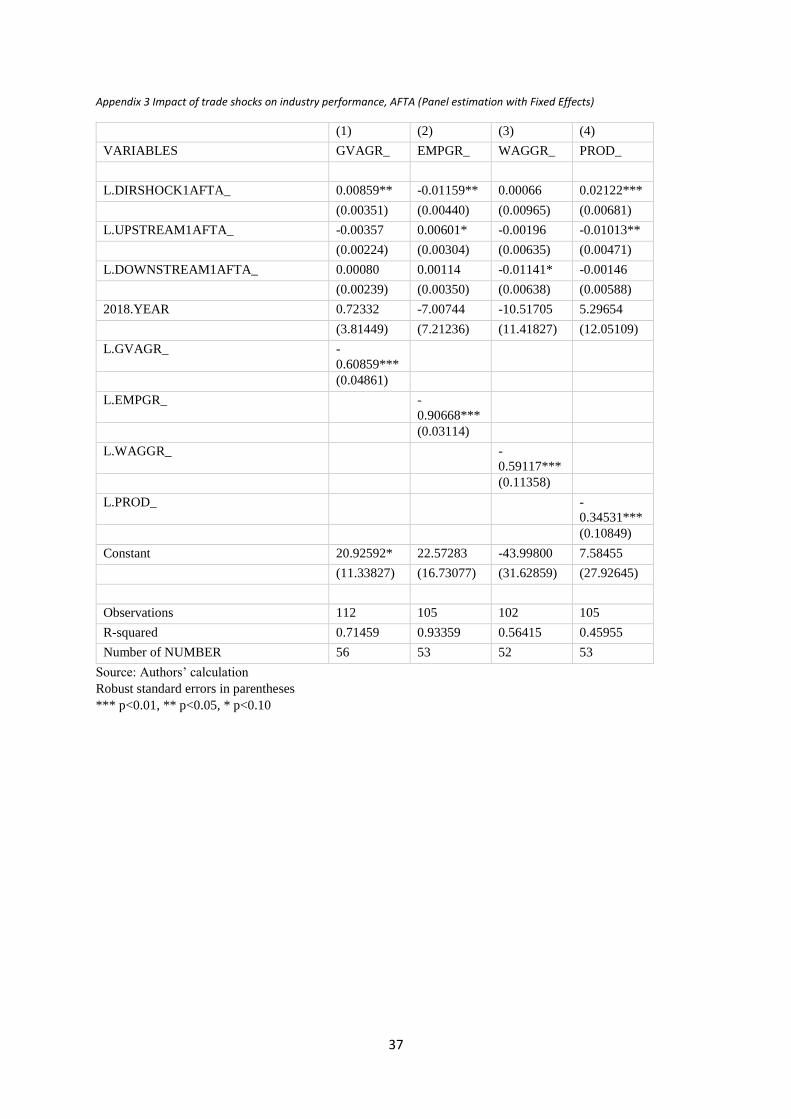
37
Appendix 3 Impact of trade shocks on industry performance, AFTA (Panel estimation with Fixed Effects)
(1) (2) (3) (4)
VARIABLES GVAGR_ EMPGR_ WAGGR_ PROD_
L.DIRSHOCK1AFTA_ 0.00859** -0.01159** 0.00066 0.02122***
(0.00351) (0.00440) (0.00965) (0.00681)
L.UPSTREAM1AFTA_ -0.00357 0.00601* -0.00196 -0.01013**
(0.00224) (0.00304) (0.00635) (0.00471)
L.DOWNSTREAM1AFTA_ 0.00080 0.00114 -0.01141* -0.00146
(0.00239) (0.00350) (0.00638) (0.00588)
2018.YEAR 0.72332 -7.00744 -10.51705 5.29654
(3.81449) (7.21236) (11.41827) (12.05109)
L.GVAGR_ -
0.60859***
(0.04861)
L.EMPGR_
-
0.90668***
(0.03114)
L.WAGGR_
-
0.59117***
(0.11358)
L.PROD_
-
0.34531*** (0.10849)
Constant 20.92592* 22.57283 -43.99800 7.58455
(11.33827) (16.73077) (31.62859) (27.92645)
Observations 112 105 102 105
R-squared 0.71459 0.93359 0.56415 0.45955
Number of NUMBER 56 53 52 53
Source: Authors’ calculation
Robust standard errors in parentheses
*** p<0.01, ** p<0.05, * p<0.10

38
Appendix 4 Impact of trade shocks on industry performance, AANZFTA (Panel estimation with Fixed Effects)
(1) (2) (3) (4)
VARIABLES GVAGR_ EMPGR_ WAGGR_ PROD_
L.DIRSHOCK1AANZ_ 0.00841* -0.01092* -0.00134 0.02093**
(0.00433) (0.00573) (0.01076) (0.00892)
L.UPSTREAM1AANZ_ -0.00354 0.00563 -0.00062 -0.00994*
(0.00264) (0.00379) (0.00688) (0.00588)
L.DOWNSTREAM1AANZ_ 0.00084 0.00092 -0.01131* -0.00113
(0.00243) (0.00343) (0.00638) (0.00579)
2018.YEAR 0.74384 -7.26863 -10.65001 5.82496
(3.89244) (7.20661) (11.61904) (12.10153)
L.GVAGR_ -
0.60525***
(0.04963)
L.EMPGR_
-
0.90609***
(0.03134)
L.WAGGR_
-
0.59069***
(0.11320)
L.PROD_
-
0.34204*** (0.10725)
Constant 22.67756 22.00305 -57.27111 9.56851
(14.16866) (20.41397) (39.06848) (34.26774)
Observations 112 105 102 105
R-squared 0.70380 0.93254 0.56538 0.45019
Number of NUMBER 56 53 52 53
Source: Authors’ calculation
Robust standard errors in parentheses
*** p<0.01, ** p<0.05, * p<0.10

39
Appendix 5 Impact of trade shocks on industry performance, ACFTA (Panel estimation with Fixed Effects)
(1) (2) (3) (4)
VARIABLES GVAGR_ EMPGR_ WAGGR_ PROD_
L.DIRSHOCK1AC_ 0.00797** -0.01120** 0.00046 0.02018***
(0.00370) (0.00456) (0.00934) (0.00731)
L.UPSTREAM1AC_ -0.00308 0.00565* -0.00210 -0.00927*
(0.00231) (0.00305) (0.00628) (0.00495)
L.DOWNSTREAM1AC_ 0.00115 0.00103 -0.01230* -0.00110
(0.00259) (0.00382) (0.00693) (0.00636)
2018.YEAR 1.09439 -7.25455 -10.47080 5.84598
(3.77923) (7.20586) (11.38516) (11.98635)
L.GVAGR_ -
0.61145***
(0.04955)
L.EMPGR_
-
0.90645***
(0.03117)
L.WAGGR_
-
0.59029***
(0.11337)
L.PROD_
-
0.34547*** (0.10923)
Constant 22.27793* 21.98444 -45.77712 9.15142
(11.72576) (17.34552) (32.57732) (28.69525)
Observations 112 105 102 105
R-squared 0.70664 0.93342 0.56439 0.45483
Number of NUMBER 56 53 52 53
Source: Authors’ calculation
Robust standard errors in parentheses
*** p<0.01, ** p<0.05, * p<0.10

40
Appendix 6 Impact of trade shocks on industry performance, AIFTA (Panel estimation with Fixed Effects)
(1) (2) (3) (4)
VARIABLES GVAGR_ EMPGR_ WAGGR_ PROD_
L.DIRSHOCK1AI_ 0.00726** -0.00992** 0.00082 0.01798***
(0.00305) (0.00379) (0.00804) (0.00596)
L.UPSTREAM1AI_ -0.00303 0.00522* -0.00188 -0.00871**
(0.00197) (0.00269) (0.00547) (0.00421)
L.DOWNSTREAM1AI_ 0.00075 0.00093 -0.00991* -0.00114
(0.00206) (0.00301) (0.00547) (0.00504)
2018.YEAR 0.79212 -7.04796 -10.63914 5.37536
(3.81606) (7.20078) (11.36654) (12.00742)
L.GVAGR_ -
0.60946***
(0.04898)
L.EMPGR_
-
0.90665***
(0.03116)
L.WAGGR_
-
0.59101***
(0.11353)
L.PROD_
-
0.34546*** (0.10870)
Constant 22.65886 22.84475 -55.94423 7.91723
(13.61312) (20.02013) (37.63141) (33.45393)
Observations 112 105 102 105
R-squared 0.71317 0.93362 0.56436 0.45866
Number of NUMBER 56 53 52 53
Source: Authors’ calculation
Robust standard errors in parentheses
*** p<0.01, ** p<0.05, * p<0.10

41
Appendix 7 Impact of trade shocks on industry performance, AJFTA (Panel estimation with Fixed Effects)
(1) (2) (3) (4)
VARIABLES GVAGR_ EMPGR_ WAGGR_ PROD_
L.DIRSHOCK1AJ_ 0.00808** -0.01141** -0.00028 0.02067***
(0.00364) (0.00444) (0.00943) (0.00714)
L.UPSTREAM1AJ_ -0.00309 0.00562* -0.00152 -0.00928*
(0.00220) (0.00287) (0.00602) (0.00465)
L.DOWNSTREAM1AJ_ 0.00098 0.00116 -0.01175* -0.00140
(0.00249) (0.00370) (0.00677) (0.00613)
2018.YEAR 0.98284 -7.17799 -10.27380 5.65693
(3.75902) (7.19551) (11.46201) (11.96662)
L.GVAGR_ -
0.60966***
(0.04902)
L.EMPGR_
-
0.90633***
(0.03125)
L.WAGGR_
-
0.59018***
(0.11328)
L.PROD_
-
0.34480*** (0.10851)
Constant 22.48076* 22.23134 -48.24106 8.78802
(12.19085) (18.19913) (34.57790) (30.06423)
Observations 112 105 102 105
R-squared 0.70894 0.93368 0.56416 0.45926
Number of NUMBER 56 53 52 53
Source: Authors’ calculation
Robust standard errors in parentheses
*** p<0.01, ** p<0.05, * p<0.10

42
Appendix 8 Impact of trade shocks on industry performance, AKFTA (Panel estimation with Fixed Effects)
(1) (2) (3) (4)
VARIABLES GVAGR_ EMPGR_ WAGGR_ PROD_
L.DIRSHOCK1AK_ 0.00713** -0.00971** 0.00054 0.01768***
(0.00311) (0.00389) (0.00802) (0.00613)
L.UPSTREAM1AK_ -0.00295 0.00506* -0.00168 -0.00846*
(0.00197) (0.00271) (0.00540) (0.00425)
L.DOWNSTREAM1AK_ 0.00076 0.00090 -0.00981* -0.00110
(0.00205) (0.00298) (0.00545) (0.00499)
2018.YEAR 0.82210 -7.10873 -10.60465 5.48643
(3.81537) (7.19587) (11.40011) (11.99813)
L.GVAGR_ -
0.60937***
(0.04915)
L.EMPGR_
-
0.90649***
(0.03121)
L.WAGGR_
-
0.59079***
(0.11347)
L.PROD_
-
0.34497*** (0.10856)
Constant 22.77002 22.66612 -56.13007 8.24921
(13.67932) (20.08403) (37.92516) (33.52480)
Observations 112 105 102 105
R-squared 0.71172 0.93349 0.56436 0.45738
Number of NUMBER 56 53 52 53
Source: Authors’ calculation
Robust standard errors in parentheses
*** p<0.01, ** p<0.05, * p<0.10

43
Appendix 9 Impact of trade shocks on industry performance, PJEPA (Panel estimation with Fixed Effects)
(1) (2) (3) (4)
VARIABLES GVAGR_ EMPGR_ WAGGR_ PROD_
L.DIRSHOCK1JP_ 0.00732** -0.01011** 0.00091 0.01819***
(0.00310) (0.00379) (0.00796) (0.00606)
L.UPSTREAM1JP_ -0.00299 0.00526* -0.00199 -0.00868**
(0.00198) (0.00267) (0.00545) (0.00424)
L.DOWNSTREAM1JP_ 0.00081 0.00095 -0.01026* -0.00117
(0.00213) (0.00312) (0.00568) (0.00520)
2018.YEAR 0.85101 -7.08131 -10.58688 5.41199
(3.79314) (7.18877) (11.34466) (11.96120)
L.GVAGR_ -
0.61033***
(0.04934)
L.EMPGR_
-
0.90658***
(0.03118)
L.WAGGR_
-
0.59093***
(0.11357)
L.PROD_
-
0.34569*** (0.10890)
Constant 22.09041* 22.57523 -50.50934 7.96918
(12.52358) (18.45029) (34.80711) (30.65850)
Observations 112 105 102 105
R-squared 0.71237 0.93369 0.56426 0.45838
Number of NUMBER 56 53 52 53
Source: Authors’ calculation
Robust standard errors in parentheses
*** p<0.01, ** p<0.05, * p<0.10