Impact of Flooding on Traffic Route Choices - core.ac.uk fileJalan P. Ramlee is one of the...
9
Impact of Flooding on Traffic Route Choices M.H. Othman 1 , A.H Abdul Hamid 2,a 1,2 School of Housing, Building and Planning, Universiti Sains Malaysia, 11800, Penang, Malaysia Abstract. Traffic route choice using road network modelling can play a key role in preventing and minimizing traffic problems during disasters. Using road network modelling, real road conditions during flooding are simulated in order to produce a response plan for road users to evacuate based on the roads’ real risks and situation. Using a Geographical Information System (GIS) we can forecast and provide road users with available alternatives when certain access roads or links need to be closed due to catastrophic hazards such as floods. This study focuses on floods as it is the most common form of natural disaster occurring in Malaysia, and due to the fact that the chance and risk of a flood occurring cannot be accurately predicted nor measured. Therefore, as a response to this problem, the outcome of this study is highly useful for the retrieval of information on flooded roads and the impacts on road users. Using GIS’s capability to display both spatial and attributive information, we have provided an attractive alternative to conventional methods in order to show available traffic route choices and a transportation network plan. 1 Introduction In Malaysia, flooding is the most commonly occurring natural disaster. Two major types of floods occurring in this country are monsoon floods and flash floods. The latest case of flooding, which was the worst flood to have ever occurred, took place in December 2013. The states affected were Kelantan, Terengganu, Pahang and Johor. The flood happened in such way that all the rescuers and help could only be delivered by air transportation during the critical stages of the flooding. In Pahang, six roads were closed for all types of road vehicles due to the hazard. These places included kilometre 28 of the Jalan Sungai Lembing-Kuantan, kilometre 36 of Jalan Gambang and several other locations. From the foregoing technical definition, a flood simply denotes a progressive abnormal increase in the elevation of the surface level of a stream’s flow until it reaches a maximum height from which the level slowly drops to what was its normal level [1]. This sequence describes all that takes place within a certain period of time. The main causes of flooding in Malaysia are as follows: increased runoff rates due to urbanization, loss of flood storage as a result of development extending into and taking over flood plains and drainage corridors, inadequate drainage systems or failure of localized drainage improvement works extended insufficiently downstream, constriction at bridges and culverts that are either undersized or partially blocked by debris build-up or from other causes, siltation in waterway channels from indiscriminate land clearing operations, localized continuous heavy rainfall, and inadequate river capacity [2]. a Corresponding author : [email protected] DOI: 10.1051 / C Owned by the authors, published by EDP Sciences, 2014 , / 01002 (2014) 201 conf Web of Conferences 4 01002 1 1 S S H 1 shs This is an Open Access article distributed under the terms of the Creative Commons Attribution License 4.0, which permits unrestricted use, distribution, and reproduction in any medium, provided the original work is properly cited. 1 Article available at http://www.shs-conferences.org or http://dx.doi.org/10.1051/shsconf/20141101002
Transcript of Impact of Flooding on Traffic Route Choices - core.ac.uk fileJalan P. Ramlee is one of the...

Impact of Flooding on Traffic Route Choices
M.H. Othman1, A.H Abdul Hamid2,a
1,2School of Housing, Building and Planning, Universiti Sains Malaysia, 11800, Penang, Malaysia
Abstract. Traffic route choice using road network modelling can play a key role in preventing and minimizing traffic problems during disasters. Using road network modelling, real road conditions during flooding are simulated in order to produce a response plan for road users to evacuate based on the roads’ real risks and situation. Using a Geographical Information System (GIS) we can forecast and provide road users with available alternatives when certain access roads or links need to be closed due to catastrophic hazards such as floods. This study focuses on floods as it is the most common form of natural disaster occurring in Malaysia, and due to the fact that the chance and risk of a flood occurring cannot be accurately predicted nor measured. Therefore, as a response to this problem, the outcome of this study is highly useful for the retrieval of information on flooded roads and the impacts on road users. Using GIS’s capability to display both spatial and attributive information, we have provided an attractive alternative to conventional methods in order to show available traffic route choices and a transportation network plan.
1 Introduction In Malaysia, flooding is the most commonly occurring natural disaster. Two major types of floods occurring in this country are monsoon floods and flash floods. The latest case of flooding, which was the worst flood to have ever occurred, took place in December 2013. The states affected were Kelantan, Terengganu, Pahang and Johor. The flood happened in such way that all the rescuers and help could only be delivered by air transportation during the critical stages of the flooding. In Pahang, six roads were closed for all types of road vehicles due to the hazard. These places included kilometre 28 of the Jalan Sungai Lembing-Kuantan, kilometre 36 of Jalan Gambang and several other locations. From the foregoing technical definition, a flood simply denotes a progressive abnormal increase in the elevation of the surface level of a stream’s flow until it reaches a maximum height from which the level slowly drops to what was its normal level [1]. This sequence describes all that takes place within a certain period of time. The main causes of flooding in Malaysia are as follows: increased runoff rates due to urbanization, loss of flood storage as a result of development extending into and taking over flood plains and drainage corridors, inadequate drainage systems or failure of localized drainage improvement works extended insufficiently downstream, constriction at bridges and culverts that are either undersized or partially blocked by debris build-up or from other causes, siltation in waterway channels from indiscriminate land clearing operations, localized continuous heavy rainfall, and inadequate river capacity [2].
a Corresponding author : [email protected]
DOI: 10.1051/C© Owned by the authors, published by EDP Sciences, 2014
,/
010 02 (2014)201conf
Web of Conferences4 010 02
11
S SH 1shs
This is an Open Access article distributed under the terms of the Creative Commons Attribution License 4.0, which permits unrestricted use, distribution, and reproduction in any medium, provided the original work is properly cited.
1
Article available at http://www.shs-conferences.org or http://dx.doi.org/10.1051/shsconf/20141101002

SHS Web of Conferences
In contemporary academia, disaster management plays a vital role in providing strategic evacuation plans for mobilization during disasters, in this case, when flooding happens. A disaster climate causes the road operation environment to worsen and also influences the road facility’s function as well as vehicle safety [3]. Therefore, studies on providing evacuation strategies, such as traffic route choice, can help the demand side (road users) so that they are aware of available choices and what they need to do. The proper operation of a flood evacuation plan through providing alternative traffic route choices will greatly reduce the impacts of flooding. An advanced and accurate modelling of road networks and a transportation management plan for when flooding occurs will help road users make proper decisions during the duration of the flood based on the information provided by the system. This can directly reduce traffic problems in a timely manner before and throughout the flood, besides acting as a mechanism to reduce the number of flood victim deaths, trauma and damage to vehicles. Flood evacuation hazard maps using ArcGIS can be disseminated to the public beforehand to help and guide flood victims, including roads users, to safety along the fastest possible routes when flooding occurs.
2 Road Flooding
Figure 1. The red line indicates Jalan P. Ramlee
Floods have negative consequences on traffic such as restricting the movement of vehicles and affecting road networking as a whole, as some affected roads become unusable and will therefore be closed. As a solution, a study of traffic route choice as an alternative for road users is important in order to overcome the problem.
In regard to studying how to solve the traffic issues related to flooding, Jalan P. Ramlee, Penang was selected as a case study. Jalan P. Ramlee is one of the connecting roads in George Town, and is especially used by those residing along or nearby Jalan P. Ramlee to go to Komtar or other places around George Town. Every time it rains, regardless of whether it is light or heavy rainfall, Jalan P. Ramlee experiences flooding. The water level can increase up to 4 feet from ground surface level when during such flooding. This causes people or road users to sit still, waiting for the floodwater to drain in order to move on. Sometimes road users have to bear a waiting time of more than one hour in order to use the road.
In light rainfall, there is no significant problem since the waiting time is about 15 minutes. However, when there is heavy rainfall, the waiting time becomes a vital factor causing stress and annoyance, most especially when those using the road are in urgent need or are already late for an appointment. A flooded road can also be risky for road users’ lives and vehicles. Providing other alternatives and other traffic route choices for them to take while the area is flooded could help solve traffic congestion problems and maximize the capacity of roads in the surrounding road network.
01002-p.2

Sustainable Built Environment Symposium (SBES 2014)
3 Research Settings
This study was conducted by collecting, preparing and analysing the duration of flood events, traffic and geometric data relating to Jalan P. Ramlee. The traffic volume data were taken manually for five days in order to determine the number, movements, and classifications of roadway vehicles at given locations. These data can help identify critical flow time periods and document traffic volume trends. The length of the sampling period was 2 hours with intervals of 15 minutes.
The method applied in this study was divided into two phases. The first phase used a theoretical approach to identify traffic demands using traffic volume data records. Meanwhile, the second phase dealt with a computerized database by using the GIS technique and developing relationship models between traffic demand and traffic route choice.
The method developed in this study helped to answer the following questions: (1) What other optimal route choices are available for the selected road? (2) How to foster dialogue about traffic jams and how to improve them? (3) How efficient is the recommended route choice in an emergency evacuation for the duration of a flood? (4) How can we reduce travel time and the delay of traffic flow due to such flooding events?
4 Results and Discussion
Throughout this section speed is discussed as the key facto of this research. Speed acts as a parameter of forecasting available route choices with different levels of flooding intensity. The stages of flooding are set as Stage 1 (worst flood: Jalan P. Ramlee needs to fully shut down with traffic moving at 0 km/h), Stage 2 (bad flood: Jalan P. Ramlee performs at 5 km/h), Stage 3 (average flood: Jalan P. Ramlee moves along at 10 km/h), and lastly, Stage 4 (light flood: Jalan P. Ramlee flows at 30 km/h). Referring to Table 1, a speed of 35km/h indicates normal conditions of Jalan P. Ramlee, that is, the traffic flow is 2,452 under a road capacity of 3,690. This condition is categorized as a 0.7 Level of Service (LOS) road with a travel time of 99.8 seconds per car to pass through 969.8 metres. Under normal conditions, the traffic that needs to be dispersed from Jalan P. Ramlee is 0 as the road can function normally. In this case, no other roads surrounding Jalan P. Ramlee will suffer or be affected, allowing them to perform at their own capacity and LOS.
Table 1: Normal conditions of Jalan P. Ramlee (No flooding)
However, traffic flow becomes an issue when flooding occurs on Jalan P. Ramlee. Referring to Table 2, the speed on Jalan P. Ramlee is reduced to 30 km/h, indicating Stage 4 (Light flooding). In
01002-p.3

Stage 4, the traffic flow that needs to be dispersed to other roads is 1,716. While referring to Table 3: Stage 3 (Serious flooding), the traffic flow that needs to be redirected is higher at 2,207. For Table 4: Stage 2 (Heavy flooding), the traffic flow that requires a detour is 2,329. Lastly, and in the worst case, Table 5: Stage 1 (Total flooding) indicates a situation in which the total volume of traffic at 2,452 cannot access the road and the road has to fully close.
Table 2: Stage 4 of Jalan P. Ramlee (Light flooding)
Table 3: Stage 3 of Jalan P. Ramlee (Serious flooding)
Traffic flow from Jalan P. Ramlee is classified in directional movements. As we go deeper, we need to understand what the importance of traffic volume is. Traffic volume is a key element in traffic studies to determine the appropriate standard of a road along with other measures of traffic such as traffic composition and traffic loading [4]. This is a fundamental measurement to determine the importance of any route based on demand and the fluctuations in traffic flow [5]. In addition, it assists in determining the distribution of traffic on a road system and investigating trends in using a road over time, which would help in forecasting future transportation needs [6].
SHS Web of Conferences
01002-p.4

Table 4: Stage 2 of Jalan P. Ramlee (Heavy flooding)
Table 5: Stage 1 of Jalan P. Ramlee (Total flooding)
Given the situation of Stage 1 (worst flooding) on Jalan P. Ramlee, the total volume that needs to be dispersed is 2,452. Therefore, because of this dispersion, other roads surrounding Jalan P. Ramlee are subject to receive traffic loading more than their usual capacity or loading which will increase the traffic density of those roads. An increase in density has subsequent effects such as causing higher traffic congestion and longer time delays. However, the traffic-loading problem can be minimized if we diffuse traffic volume fairly according to their roads’ performance. For example, referring to Figure 2, the capability of Direction 2 to withstand traffic loading is greater than Direction 1 at a ratio of 60% : 40%. It is possible to predict the Direction 2 performance based on traffic count data in Table 1. It can be seen that the South side area (covering Jalan Terengganu, Jalan Free School and Jalan Perak) can accommodate greater traffic loads compared to the North side (covering Jalan Terengganu, Jalan Air Hitam and Jalan Datuk Keramat). Since the capacity of the South side is able to hold more of the dispersed traffic, out of a total volume of 2,452, the South side could absorb approximately 1,471 vehicles while the North has the remaining volume of 981 vehicles.
The reason why the ratio is 60% : 40% is because of consideration towards the level of service (LOS) of the roads involved as shown in Table 1. Jalan Free School has a LOS of 0.4 compared to the North side, such Jalan Air Hitam ( LOS, 0.81) and Jalan Datuk Keramat (LOS, 0.87). Taking LOS into consideration, if a greater we traffic volume is still redirected to the North side it will cause
Sustainable Built Environment Symposium (SBES 2014)
01002-p.5

massive jams, longer delay times and result in more traffic problems. Using the same parameter, the ratio of 60% : 40%, traffic can be respectively dispersed to other roads using the same principle.
Using Stage 1 as an example, below are the alternative route choices available for road users to use when Jalan P. Ramlee is closed down due to flooding. Alternative 1 is shown in Figure 3. People from the side of Jalan P. Ramlee can use this alternative. Referring to Table 5, it can be seen that the average LOS in this alternative is 0.7 with the highest time delay on Jalan Datuk Keramat of 120.8 seconds. Under normal conditions, the speed is 35 km/h as stated in Table 5, however, this speed will be prone to changes as more traffic flowing from the closed Jalan P. Ramlee will have to be dispersed to these roads, making them experience slower speeds and more traffic compared to their normal state.
Figure 2. Mapping of Jalan P. Ramlee and surrounding areas
In this discussion, the results are based on the average LOS for the links. LOS analysis was carried out to identify the performance of each roadway [7]. LOS was chosen as a parameter to evaluate these alternative route choices to show how much traffic a given route can accommodate under various operating conditions within a traffic stream, generally in terms of such service measures as speed and delay time, traffic interruptions, comfort and convenience. In Figure 3, for this alternative the average LOS is 0.7, based on Jalan Terengganu (0.57), Jalan Air Hitam (0.81) and Jalan Datuk Keramat (0.87). For the yellow highlighted road ,when road users use this alternative they have to be aware that on Jalan Terengganu there are no massive traffic jams since the LOS is Type B. However, on Jalan Air Hitam & Datuk Keramat they will face significant congestion with time delays of 100.1 seconds and 120.8 seconds respectively.
For Alternative 2, shown in Figure 4, the average LOS is 0.8 which is slightly higher than that of the first alternative. Roads involved in Alternative 2 are the upper side of Jalan Terengganu (0.57), Jalan Air Hitam (0.81), Jalan Perak (0.0.81), Jalan Anson (0.91) and Jalan Macalister (1.05). In Alternative 2, road users will experience quite bad traffic jams such as on Jalan Air Hitam, Jalan Perak, Jalan Anson and Jalan Macalister with time delays of 100.1 sec, 21.8 sec, 73.1 sec and 87.3 sec respectively as tabulated in Table 5.
The pattern of alternative route choices uses the North side and South side areas. Alternatives 1 and 2 use the upper North side, while, for Alternatives 3 and 4, the South side is used to disperse the traffic flows.
SHS Web of Conferences
01002-p.6

Figure 3: Alternative Route 1
Figure 4 : Alternative Route 2
Figure 5 shows Alternative 3, with an average LOS of 0.7 which is similar to Alternative 1, however, with different connecting roads such as the lower side of Jalan Terengganu (0.57), Jalan Free School (0.43), Jalan Perak (0.81) and Jalan Datuk Keramat (0.87). The difference with Alternative 1 is that this route choice has a longer distance, which is double that of Alternative 1. Though Alternative 3 has a total travel distance of 4.8 km, longer in comparison with the travel distance of 2.7 km from using Alternative 1, road users will experience similar congestion since Jalan Perak and Jalan Air Hitam have the same LOS of 0.81 and both of these route choices will travel through Jalan Datuk Keramat.
Last but not least, is Alternative 4 in Figure 6. Referring to Table 5, among all of the alternative route choices, Alternative 4 gives the least average LOS. The roads involved in this alternative are the lower side of Jalan Terengganu (0.57), Jalan Free School (0.40), Lorong Perak (0.31), Jalan Jelutong (0.51), Jalan CY Choy (1.0) and Jalan Magazine (1.03). The average LOS is 0.5 with a travel distance of 4.8 km.
Sustainable Built Environment Symposium (SBES 2014)
01002-p.7
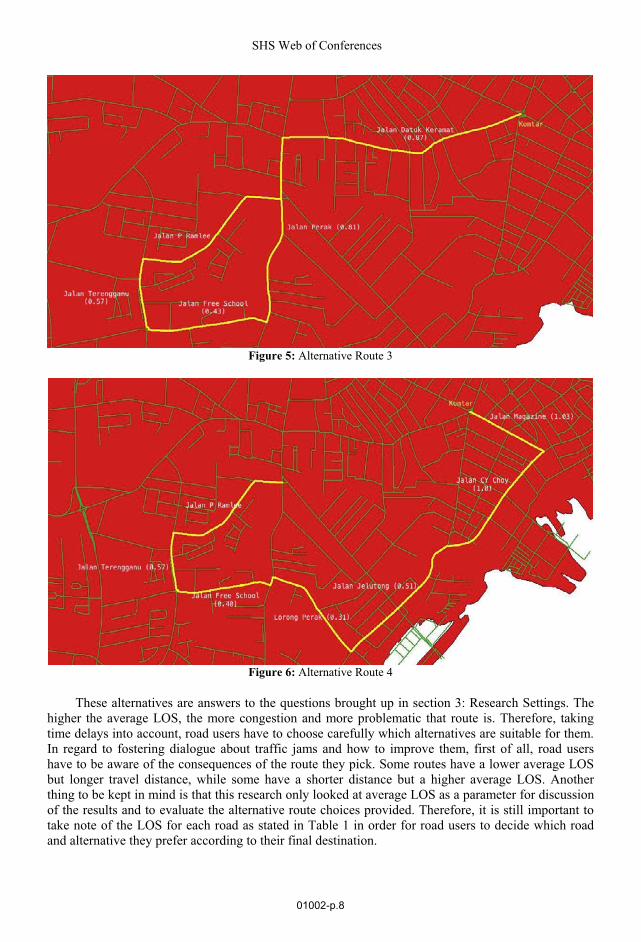
Figure 5: Alternative Route 3
Figure 6: Alternative Route 4
These alternatives are answers to the questions brought up in section 3: Research Settings. The higher the average LOS, the more congestion and more problematic that route is. Therefore, taking time delays into account, road users have to choose carefully which alternatives are suitable for them. In regard to fostering dialogue about traffic jams and how to improve them, first of all, road users have to be aware of the consequences of the route they pick. Some routes have a lower average LOS but longer travel distance, while some have a shorter distance but a higher average LOS. Another thing to be kept in mind is that this research only looked at average LOS as a parameter for discussion of the results and to evaluate the alternative route choices provided. Therefore, it is still important to take note of the LOS for each road as stated in Table 1 in order for road users to decide which road and alternative they prefer according to their final destination.
SHS Web of Conferences
01002-p.8

5 Conclusion
These alternative route choices provide one of the measures for a Traffic Management Plan (TMP) during flooding. This study covers utilization, adjustment and adaptation of existing roads to meet specified objectives such as improving traffic circulation in a flooded area without the need for new road construction. These alternatives and measures will help road users in their decision making when choosing the best route according to their needs and destination whenever a certain road is flooded.
The results presented discuss the conditions where the speed variable on a flooded road is zero, i.e. no movement is possible. This situation represents a worst case scenario during flooding. Other conditions of road usage, such as where only limited travel is possible, were also studied. These scenarios where speed was set at 5 km/h, 10 km/h and 30 km/h can show other traffic management alternatives using the same methodology. The different speeds scenarios gave different result of LOS, density and travel time. These alternative settings can hopefully be used to alert road users so that they are aware of what they have to do in case of flooding. Similar approaches can be used to study situations where there are accidents and crashes since these events have a similar effect on traffic, namely, causing delays and congestion.
References
1. Definition and Nature, PAGASA [Online resource;: http://www.pagasa.dost.gov.ph/component/content/category/36-learning-tools] [Accessed October 9, 2013]
2. Managing the Flood Problem in Malaysia. [Online resource; http://www.did.sarawak.gov.my/modules/web/download_show.php?id=54][Accessed October 10, 2013]
3. Ma Yan, Guo Zhong-yin, Guo Hua, Xu Yong-gang, 2009. Risk Assessment of Road Operation Environment Under Atrocious Weather Condition. ICCTP 2009: Critical Issues in Transportation Systems Planning, Development, and Management ©2009 ASCE
4. Falck-Jensen, K., 1996. Geometric Design Controls. In Thagesen, B. (Ed.). Highway and Traffic Engineering in Developing Countries
5. Hobbs F.D & Richardson, B.D, 1997. Traffic Engineering 6. Roess, R.P., Prassas E.S & McShane, W.R., 2004. Traffic Engineering (Third Edition) 7. Abdul Azeez Kadar Hamsa, 2013. Urban Traffic System
Sustainable Built Environment Symposium (SBES 2014)
01002-p.9