Impact of Fermentation Conditions on The Extraction of ...
11
406 Applied Science and Engineering Progress, Vol. 14, No. 3, pp. 406–416, 2021 Impact of Fermentation Conditions on the Extraction of Phenolics and Sensory Characteristics of Mangosteen Wine Tenzing Dasel Shrestha, Viyada Kunathigan and Kamolnate Kitsawad Department of Food Biotechnology, Faculty of Biotechnology, Assumption University, Bangkok, Thailand Siriwan Panprivech* Department of Agro-Industry, Faculty of Biotechnology, Assumption University, Bangkok, Thailand * Corresponding author. E-mail: [email protected] DOI: 10.14416/j.asep.2020.05.001 Received: 11 February 2020; Revised: 7 April 2020; Accepted: 15 April 2020; Published online: 7 May 2020 © 2021 King Mongkut’s University of Technology North Bangkok. All Rights Reserved. Abstract Phenolics play a major role in determining the quality of wine. This study focuses on the impact of fermentation conditions (varying pericarp content: 0, 5, 7.5, and 10% (w/v); Saccharomyces cerevisiae strain: Montrachet- UCD #522 and Pasteur Red-UCD #904) on the extraction of phenolics and sensory characteristics of mangosteen wine at 30 ± 2°C. The addition of pericarp showed a significant effect on color intensity, but the choice of strain of yeast used has no effect. With increasing percentage of pericarp added, the amount of phenolics, tannins, and anthocyanins increased, with the highest total phenolic content to be 4,000 mg/L catechin equivalent at the end of fermentation. At lower percentage of added pericarp, the yeast induced no apparent difference to the sensory characteristics, but at higher percentage the difference was more apparent. Wine with lower percentage of pericarp added had higher intensity of mangosteen pulp flavor, whereas wine with higher percentage of pericarp has more mangosteen pericarp characteristics. Pasteur Red contributed to a higher degree of fruity and floral aroma/flavor, while Montrachet contributed to a more intense body. Keywords: Phenolics, Mangosteen pericarp, Yeast, Mangosteen wine Research Article 1 Introduction Phenolic compounds are secondary plant metabolites that are found in all varieties of food material. Simple phenols, hydroxycinnamic derivatives, and flavonoids are the most common phenolic compounds. Fruits such as cranberries, apples, grapes, strawberries, pears, etc. are known to be major sources of phenolic compounds, and these compounds when consumed through fruits, vegetables, and beverages have a favorable impact on human health [1]. Among beverages, wine is one such beverage that is a good source of phenolic compounds. Phenolic compounds in wine are classified into two groups: non-flavonoids and flavonoids. Hydroxycinnamic acid and hydroxybenzoic acid are the non-flavonoid compounds while flavanols and their oligomers, the proanthocyanidins (generally referred to as tannins), anthocyanins, and flavonols make up the flavonoid group [2]. Among the flavonoid polyphenols, flavanols and anthocyanins are of great importance to red wine as they affect the astringency and color of the wine. These phenolic compounds affect the overall quality of wine due to its impact on color, mouthfeel, and ageability [3]. The extraction of phenolics during fermentation can be affected by many factors: fermentation temperature, pectolytic enzyme treatment, must freezing, and extended maceration has reportedly increased the Please cite this article as: T. D. Shrestha, V. Kunathigan, K. Kitsawad, and S. Panprivech, “Impact of fermentation conditions on the extraction of phenolics and sensory characteristics of mangosteen wine,” Applied Science and Engineering Progress, vol. 14, no. 3, pp. 406–416, Jul.–Sep. 2021, doi: 10.14416/j.asep.2020.05.001.
Transcript of Impact of Fermentation Conditions on The Extraction of ...

406 Applied Science and Engineering Progress, Vol. 14, No. 3, pp. 406–416, 2021
Impact of Fermentation Conditions on the Extraction of Phenolics and Sensory Characteristics of Mangosteen Wine
Tenzing Dasel Shrestha, Viyada Kunathigan and Kamolnate KitsawadDepartment of Food Biotechnology, Faculty of Biotechnology, Assumption University, Bangkok, Thailand
Siriwan Panprivech*Department of Agro-Industry, Faculty of Biotechnology, Assumption University, Bangkok, Thailand
* Corresponding author. E-mail: [email protected] DOI: 10.14416/j.asep.2020.05.001Received: 11 February 2020; Revised: 7 April 2020; Accepted: 15 April 2020; Published online: 7 May 2020© 2021 King Mongkut’s University of Technology North Bangkok. All Rights Reserved.
AbstractPhenolics play a major role in determining the quality of wine. This study focuses on the impact of fermentation conditions (varying pericarp content: 0, 5, 7.5, and 10% (w/v); Saccharomyces cerevisiae strain: Montrachet-UCD #522 and Pasteur Red-UCD #904) on the extraction of phenolics and sensory characteristics of mangosteen wine at 30 ± 2°C. The addition of pericarp showed a significant effect on color intensity, but the choice of strain of yeast used has no effect. With increasing percentage of pericarp added, the amount of phenolics, tannins, and anthocyanins increased, with the highest total phenolic content to be 4,000 mg/L catechin equivalent at the end of fermentation. At lower percentage of added pericarp, the yeast induced no apparent difference to the sensory characteristics, but at higher percentage the difference was more apparent. Wine with lower percentage of pericarp added had higher intensity of mangosteen pulp flavor, whereas wine with higher percentage of pericarp has more mangosteen pericarp characteristics. Pasteur Red contributed to a higher degree of fruity and floral aroma/flavor, while Montrachet contributed to a more intense body.
Keywords: Phenolics, Mangosteen pericarp, Yeast, Mangosteen wine
Research Article
1 Introduction
Phenolic compounds are secondary plant metabolites that are found in all varieties of food material. Simple phenols, hydroxycinnamic derivatives, and flavonoids are the most common phenolic compounds. Fruits such as cranberries, apples, grapes, strawberries, pears, etc. are known to be major sources of phenolic compounds, and these compounds when consumed through fruits, vegetables, and beverages have a favorable impact on human health [1]. Among beverages, wine is one such beverage that is a good source of phenolic compounds. Phenolic compounds in wine are classified into two groups:
non-flavonoids and flavonoids. Hydroxycinnamic acid and hydroxybenzoic acid are the non-flavonoid compounds while flavanols and their oligomers, the proanthocyanidins (generally referred to as tannins), anthocyanins, and flavonols make up the flavonoid group [2]. Among the flavonoid polyphenols, flavanols and anthocyanins are of great importance to red wine as they affect the astringency and color of the wine. These phenolic compounds affect the overall quality of wine due to its impact on color, mouthfeel, and ageability [3]. The extraction of phenolics during fermentation can be affected by many factors: fermentation temperature, pectolytic enzyme treatment, must freezing, and extended maceration has reportedly increased the
Please cite this article as: T. D. Shrestha, V. Kunathigan, K. Kitsawad, and S. Panprivech, “Impact of fermentation conditions on the extraction of phenolics and sensory characteristics of mangosteen wine,” Applied Science and Engineering Progress, vol. 14, no. 3, pp. 406–416, Jul.–Sep. 2021, doi: 10.14416/j.asep.2020.05.001.

407
T. D. Shrestha et al., “Impact of Fermentation Conditions on the Extraction of Phenolics and Sensory Characteristics of Mangosteen Wine.”
Applied Science and Engineering Progress, Vol. 14, No. 3, pp. 406–416, 2021
phenolic composition of the finished wine [3]. Wine has complex sensory characteristics that can be attributed to many factors such as fruit maturity, alcohol content, fermentation techniques, aging, phenolic content, etc. Accumulation of anthocyanins, tannins, and flavonols during ripening affects the taste, color, and mouthfeel of the wine. Condensation of monomeric flavan-3-ols to form proanthocyanidin (oligomers) and condensed tannin (polymers) affect the bitterness of the wine. Monomeric flavan-3-ols such as catechins are more bitter compared to their oligomers and polymers [4]. Wine components such as alcohol, acids, phenolic compounds, and other volatile compounds contribute to the taste, aroma, and all other sensory perceptions of wine [5]. However, the yeast used for fermentation can contribute to flavors and aromas of wine and also has influence on the extraction of phenolic compounds. Wine yeast can be purchased in both liquid and dry forms. However, dry yeast is easier for small wineries and home winemakers to use. S. cerevisiae UCD#522 (Montrachet) is popular dry yeast for producing both red and white wines and has been widely used in enology research. Montrachet conducts vigorous fermentation, has good ethanol tolerance, and can ferment grape musts and fruit juices to dryness. There is noted for producing low volatile acidity, good flavor complexity and intensely colored wines [6]. S. cerevisiae UCD#904 (Pasteur Red) is rapidly becoming the yeast of choice for producing full-bodied red wines which produces clean fermentations and has good color extraction characteristics [6]. Although the production of wines from grapes and other temperate fruit has a long history. In contrast, the production of wines from tropical fruit is comparatively recent and limited but is gaining interest as a means to enhance the economic value of tropical fruit crops. Wines can be produced from a wide range of tropical fruit, although modifications to the winemaking process may be required to achieve desirable alcohol content and to optimize extraction of phytochemicals from fruit pulp to ensure consistent quality [7]–[9]. However, the final composition of tropical fruit wine and grape wine, especially red wine, is very different. Tropical fruit wines lack astringency, as well as color, which are sought-after characteristics of red wine. While tannin level of many tropical fruits is not competing with the levels of tannin in grape berries.
However, mangosteen (Garcinia mangostana L.) is one such tropical fruit that is high in tannins and could potentially produce a fruit wine that is astringent. The relatively high anthocyanin content of mangosteen pericarp also makes it a favorable fruit for red wine fermentation. Apart from anthocyanins and tannins, mangosteen also contains various other bioactive compounds such as phenolic acids, flavonoids, and xanthones. Mangosteen is composed of 17% (w/w) outer pericarp, 48% inner pericarp, 31% flesh, and 4% cap. Most of the anthocyanins were found in the outer pericarp, while most of the total phenolic compounds were found in the inner pericarp [10]. The fruit shell or pericarp contains approximately 7–13% (w/w) tannins [11]. The predominant type of tannin in mangosteen pericarp is proanthocyanidins also known as condensed tannins [12], [13]. These characteristics of mangosteen along with the fermentation techniques contribute to the sensory characteristics of the resulting wine. Because the sugar content of mangosteen juice is generally reported to be below 20°Brix [14], the addition of sugar prior to fermentation are necessary to obtain sufficient alcohol to ensure desirable organoleptic properties and microbiological stability of the wine. Minh [15] studied the influence of several winemaking factors on mangosteen wine fermentation performance and quality including pectinase supplementation, water addition, yeast proliferation and yeast ratio, sugar addition, and fermentation time. There were also various researches done on other fruit wines, but studies on mangosteen wine is rare especially studies pertaining to the phenolic content. Therefore, the objectives of this study are to investigate the impact of adding different percentages of mangosteen pericarp on the extraction of phenolics and the effect of using two different yeast strains on the sensory properties of the resulting mangosteen wine.
2 Materials and Methods
2.1 Winemaking
Fresh mangosteens were purchased from a local market in Bangkok, Thailand while 65% mangosteen juice was purchased from Bee Fruits Brand, Chantaburi, Thailand. The mangosteens were washed and peeled. The inner pericarp was cut into a small cube (1 cm3)
T. D. Shrestha et al., “Impact of Fermentation Conditions on the Extraction of Phenolics and Sensory Characteristics of Mangosteen Wine.”
408 Applied Science and Engineering Progress, Vol. 14, No. 3, pp. 406–416, 2021
and stored at 20°C. Mangosteen juice was diluted with water in the ratio 1:1 (v/v). The diluted juice was chaptalized to 22°Brix with granulated cane sugar. Frozen mangosteen pericarp was thawed and added into the juice with 0, 5, 7.5, and 10% (w/v) of mangosteen pericarp, and the pH of the solution was adjusted to 3.5 using an acid blend (50% malic, 40% citric, and 10% tartaric acid) (L.D. Carlson, OH, USA). An addition of 10% potassium metabisulfite solution was performed for all treatments, giving a final concentration of 50 mg/L sulfur dioxide (SO2). The enzyme pectinase (L.D. Carlson, OH, USA) was added to all treatments (0.67 g/L), followed by 2 g/L of diammonium phosphate (DAP). For each of the individual treatments, two strains of the yeast Saccharomyces cerevisiae were used (0.25 g/L); Montrachet (UCD #522) and Pasteur Red (UCD #904) (manufactured by Red Star, Belgium). The impact of adding varying percentages of pericarp according to the phenolics produced was investigated; eight different treatments consists of wines made with 0, 5, 7.5, and 10% pericarp and fermented with Montrachet and Pasteur Red (0M, 0P, 5M, 5P, 7.5M, 7.5P, 10M, and 10P) were performed in triplicate. Each five liters of experimental treatment was performed in glass container with airlock. The treatments were fermented at 30 ± 2°C for 9 days. All treatments were sampled once a day at approximately 24-hour intervals. Samples were vacuum filtered through a Whatman paper no. 42 in a vacuum system (Diaphragm vacuum pump, model GM-0.5) and subsequently frozen at 20°C until analysis. The sugar content was measured manually with a refractometer. The fermented musts were subsequently pressed and filtered, then bottled into 750 mL glass bottles and stored at 12°C and left to age for 3 months.
2.2 Analysis of chemical composition of the finished wine
The chemical composition of the finished wine was analyzed in triplicate after completion of alcoholic fermentation. The ethanol content was measured using an ebulliometer (Dujardin Salleron™). The pH was measured using a pH meter (Hanna precision pH meter, model pH 211). The titratable acidity (TA) was measured by titration with 0.1N NaOH (AOAC 962.12, 1990). The reducing sugar was measured using the 3,5-Dinitrosalicylic acid (DNS) assay [16].
2.3 Determination of color measurement
The frozen samples were thawed at room temperature and centrifuged at 3000 rpm for 5 min prior to analysis. For color measurement, color intensity and hue were analyzed in triplicate using T70/T80 series UV/Vis spectrophotometer. Color intensity was quantified as the sum of absorbance at 420, 520, and 620 nm. Hue was calculated as the ratio between absorbance at 420 and 520 nm.
2.4 Modified Adams-Harbertson assay
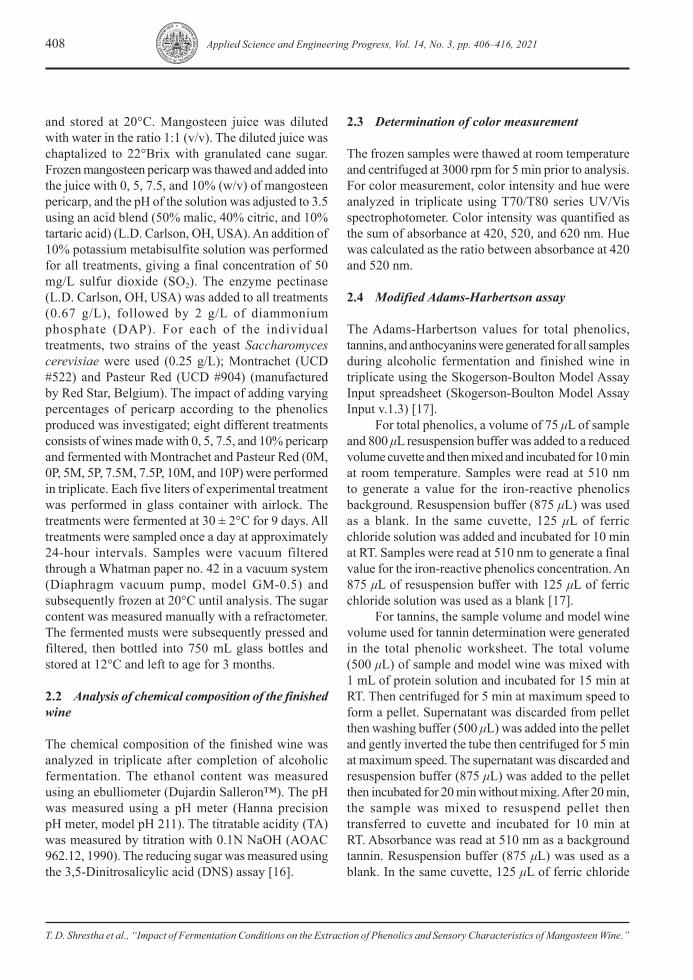
The Adams-Harbertson values for total phenolics, tannins, and anthocyanins were generated for all samples during alcoholic fermentation and finished wine in triplicate using the Skogerson-Boulton Model Assay Input spreadsheet (Skogerson-Boulton Model Assay Input v.1.3) [17]. For total phenolics, a volume of 75 μL of sample and 800 μL resuspension buffer was added to a reduced volume cuvette and then mixed and incubated for 10 min at room temperature. Samples were read at 510 nm to generate a value for the iron-reactive phenolics background. Resuspension buffer (875 μL) was used as a blank. In the same cuvette, 125 μL of ferric chloride solution was added and incubated for 10 min at RT. Samples were read at 510 nm to generate a final value for the iron-reactive phenolics concentration. An 875 μL of resuspension buffer with 125 μL of ferric chloride solution was used as a blank [17]. For tannins, the sample volume and model wine volume used for tannin determination were generated in the total phenolic worksheet. The total volume (500 μL) of sample and model wine was mixed with 1 mL of protein solution and incubated for 15 min at RT. Then centrifuged for 5 min at maximum speed to form a pellet. Supernatant was discarded from pellet then washing buffer (500 μL) was added into the pellet and gently inverted the tube then centrifuged for 5 min at maximum speed. The supernatant was discarded and resuspension buffer (875 μL) was added to the pellet then incubated for 20 min without mixing. After 20 min, the sample was mixed to resuspend pellet then transferred to cuvette and incubated for 10 min at RT. Absorbance was read at 510 nm as a background tannin. Resuspension buffer (875 μL) was used as a blank. In the same cuvette, 125 μL of ferric chloride

409
T. D. Shrestha et al., “Impact of Fermentation Conditions on the Extraction of Phenolics and Sensory Characteristics of Mangosteen Wine.”
Applied Science and Engineering Progress, Vol. 14, No. 3, pp. 406–416, 2021
solution was added and incubated for 10 min at room temperature. Absorbance was read at 510 nm as a final tannin. An 875 μL of resuspension buffer with 125 μL of ferric chloride solution was used as a blank [17]. For anthocyanins, a volume of 400 μL of model wine, 100 μL of sample, and 1 mL of anthocyanin buffer were mixed in a reduced volume cuvette and then incubated for 5 min at RT. Samples were then read at 520 nm. Anthocyanin buffer (1.5 mL) was used as a blank [17].
2.5 Sorting technique
A total of 30 panelists (male = 7, female = 23) were recruited to participate. Nine samples (8 treatments and 1 blind sample) were served to each panelist. The panelists were asked to evaluate the samples and freely group them based on their similarity and list down a minimum of 3 words to describes the characteristics of each group. The panelists were also asked to arrange the nine samples into at least three groups. The sorting technique was carried out in individual booths under red light to deter panelists from grouping the samples based on color. The samples were randomly served in wine glasses covered with a lid and code with 3-digit numbers. Drinking water and crackers were provided for palate cleansing between each sample.
2.6 Statistical analysis
Analysis of variance (ANOVA) and Duncan’s Multiple Range Test (MRT) were used to discriminate the means of the chemical composition between treatments using SAS program version 9.4 (SAS Institute, Cary, NC, USA). The results from the sorting technique was processed through the Analysis Multiple Distance Matrices (DISTASIS) [18]–[20] using RStudio version 1.0.136 (The R Project for Statistical Computing).
3 Results and Discussion
3.1 Chemical compositions
The chemical compositions of wines that had undergone different treatment variables (percentage pericarp and yeast strains) were determined at the time of bottling (Figure 1). The alcohol content [Figure 1(a)] of lower percentage pericarp wine samples (0 and
5%) was higher compared to the alcohol content of higher percentage pericarp wine samples regardless of the yeast strain used. Also, the strain of yeast used did not have a significant effect on the alcohol content for all wines with varying pericarp percentages. The results indicate that increasing the percentage of pericarp slightly increase the acidity [Figure 1(b)] of the wine while the application of different yeast strains had no effect. For overall reducing sugar content [Figure 1(c)], wine fermented with S. cerevisiae UCD#522 or Montrachet had lower reducing sugar content. This may be due to the difference of efficiency
Figure 1: The chemical composition of mangosteen wines with different pericarp percentages and yeast strains used: (a) alcohol content, (b) percentage acidity, and (c) reducing sugar content. The same letter indicates that there is no significant difference (p < 0.05, n = 3).

T. D. Shrestha et al., “Impact of Fermentation Conditions on the Extraction of Phenolics and Sensory Characteristics of Mangosteen Wine.”
410 Applied Science and Engineering Progress, Vol. 14, No. 3, pp. 406–416, 2021
of utilization of sugar by Montrachet and Pasteur red yeast. Among the wine samples with different pericarp percentages, 10% pericarp fermented with Montrachet had significantly higher reducing sugar content. The reducing sugar content was significantly different (p < 0.05) between wines with the same pericarp percentages when fermented with different yeast strains. Mangosteen pericarp extract is known for its anti-bacterial and anti-fungal properties which are attributed to its phenolic content [21]. One study reported that with increasing phenolic concentration, the lag phase of yeast growth is elongated and at a certain concentration, phenolic compounds become toxic to yeast cells [22]. This property could possibly explain the high amount of residual reducing sugar left as the inoculated yeast might have been affected, leading to lower sugar conversion. The amount of sugar content remaining in the wine corresponds to the alcohol content of the wine. Wines made from 10% pericarp had the highest reducing sugar content and the lowest alcohol content when fermented with Montrachet yeast. 3.2 Color
The color intensity and hue during active fermentation for each treatment was analyzed using a spectrophotometer. The changes in color intensity and hue are shown in Figures 2 and 3. Color intensity is the sum of absorbance at wavelengths of 420, 520, and 620 nm. Wavelength of 420 nm corresponds to yellow-orange pigments, 520 nm corresponds to red pigments, while 620 nm corresponds to blue pigments. Higher values of color intensity indicate wines with red color while lower values of color intensity indicate white wines. Hue is the ratio of absorbance at 420 and 520 nm (A420/A520). Higher hue values indicated white wine whereas lower hue values indicated red wine. From Figure 2, it was found that color intensity values increased in the beginning for wine samples with pericarp and gradually decreased towards the end of the fermentation period. This decrease in color intensity corresponds to the decrease in anthocyanin content (Figure 6). Generally, the concentration of the main pigment anthocyanin reaches an equilibrium, after which it can no longer be extracted. The decrease in color intensity probably result from the adsorption of anthocyanin extracted on to the cell wall during
fermentation [23]. Moreover, potential degradation reactions of anthocyanin include 3-glycoside hydrolysis, which has an effect in unstable anthocyanin [24]. The destruction of anthocyanin may probably be due to the condensation reactions involving covalent association of anthocyanin with other flavanols present in juice, leading to the formation of a new pyran ring by cycloaddition [25]. Chemical compounds derived from these condensation reactions are responsible for changes in the color of red wine towards brown or orange color [26]. In wine samples with no pericarp, the color intensity decreased in the first few hours, after which it increased slightly and remained stable until the end of the fermentation period. As most of the pigments of mangosteen are present in the pericarp, the color intensity values were higher in wine samples with higher pericarp content while the yeast strain used did
Figure 2: The change in color intensity of mangosteen wines made with different pericarp percentages (0, 5, 7.5, and 10%) and yeast strains used; Montrachet (M) and Pasteur Red (P) during active fermentation (n = 3).
Figure 3: The change in hue of mangosteen wines made with different pericarp percentages (0, 5, 7.5, and 10%) and yeast strains used; Montrachet (M) and Pasteur Red (P) during active fermentation (n = 3).

411
T. D. Shrestha et al., “Impact of Fermentation Conditions on the Extraction of Phenolics and Sensory Characteristics of Mangosteen Wine.”
Applied Science and Engineering Progress, Vol. 14, No. 3, pp. 406–416, 2021
not affect the color intensity of the wines. In case of hue values, Figure 3 indicated that hue values sharply declined in wines with pericarp in the first few hours of fermentation, after which they remained stable throughout the fermentation period. Since hue value is the ratio between absorbance at 420 and 520 nm, this could mean that extraction of both yellow and red pigments increased in the same ratio. It was also seen that in the wines with added pericarp that the addition of pericarp made little or no difference in hue values. However, in wines where no pericarp was added, the hue value slightly increased and remained stable throughout the fermentation period. Figure 3 also indicated that among the four wines of different pericarp content, the highest hue value is that with 0% pericarp which makes it a white wine, while the other three wines would be considered more of red wine than white. Among the samples, the yeast strain used did not affect the hue values. Therefore, in the case of color intensity, varying percentage of pericarp made a significant difference, whereas the presence or absence of the pericarp resulted in the difference in hue values, not the amount of pericarp. Yeast strain used did not affect both color intensity and hue values.
3.3 Total phenolics
Figure 4 indicated a steady increase in the phenolics extracted in the beginning of the fermentation, after which they remained stable with a slight decline towards the end. With increasing pericarp percentage, the extraction rate also increased. The 10% pericarp samples showed the highest amount of total phenolic content, followed by 7.5% and finally 5%. At the beginning of the fermentation period, there was little to no difference in the total phenolic content between wines made with the same pericarp content fermented with different yeast strains. The differences disappeared at the end of the fermentation for wines with 5 and 7.5% pericarp addition. For wines made with 10% pericarp, fermentation using Montrachet showed a slightly higher phenolic content. The highest phenolic content value measured in this experiment was between 4,000–4,500 mg/L catechin equivalent. Chaovanalikit et al. [10] reported the total phenolic content of mangosteen pericarp to be 6,000–6,500 mg gallic acid equivalent (GAE) /100g when extracted
with acetone. In another study where phenolics were extracted using absolute ethanol reported the total phe-nolics content to be 64.3 ± 3.2 mg GAE/g dry matter [27]. The phenolic content extracted in this study is lower than that reported by other studies. This could be attributed to the compared equivalent phenolic which in this study is catechin equivalent and/or the solvent used. The polarity of the solvent could affect the extraction of phenolic compounds. Phenolic compounds are hydrophilic in nature and are extracted more readily in polar solvents. On the other hand, polyphenols are more soluble in organic solvents which are less polar than water [28]. At the beginning of wine fermentation, there is no ethanol. However, ethanol concentration gradually increases as fermentation progresses until it reaches the final concentration of 12–15% alcohol. At the end of fermentation, concentration of ethanol produced is still very low compared to the extraction with acetone and absolute ethanol.
3.4 Tannins
The extraction profile of tannins (Figure 5) shows a steady increase in the tannin content for the first few days, after which the tannin content starts decreasing until the end of the fermentation. Corresponding to the total phenolic content, the tannin content is highest for wine made with 10% pericarp added, followed by 7.5 and 5% pericarp added. The use of different yeast strains did not produce tangible differences in the tannin
Figure 4: The change in total phenolic content of mangosteen wines made with different pericarp percentages (5, 7.5, and 10%) and yeast strains used; Montrachet (M) and Pasteur Red (P) during active fermentation (n = 3). Data for 0M and 0P were not detected.

T. D. Shrestha et al., “Impact of Fermentation Conditions on the Extraction of Phenolics and Sensory Characteristics of Mangosteen Wine.”
412 Applied Science and Engineering Progress, Vol. 14, No. 3, pp. 406–416, 2021
content except in the sample with 10% pericarp where fermentation with Montrachet produced slightly higher amount of tannins. In theory, as fermentation progresses tannins along with anthocyanins and other phenolics are extracted. As anthocyanin concentration increases, the solubility and retention of tannins also increase [29]. The anthocyanins and tannins then polymerize to form polymeric pigments. This phenomenon explains the decrease of tannin concentration towards the end of the fermentation.
3.5 Anthocyanins
The extraction profile of anthocyanins (Figure 6) shows an increase in the first few days of the fermentation period, after which there is a steady decrease in the anthocyanin content until the end of the fermentation period. This result corresponded to the color intensity value which also decreased during the 5–6 day of the fermentation. Similar to phenolics and tannins, fermentation of wines with 10% pericarp had the highest amount of anthocyanins. Figure 6 indicated that the yeast strains did not affect the extraction of anthocyanins. In theory, the anthocyanin content of the wine increased in the beginning of the fermentation until reaching a maximum, after which the anthocyanin content slowly decreased until the end of fermentation [30]. One study suggested that when the anthocyanin content in the wine and in the grapes has reached equilibrium, no more anthocyanin can be extracted into the wine [31]. There is also a
possibility that the anthocyanin is re-adsorbed into the pericarp and yeast cell walls during fermentation. This, along with the formation of polymeric pigment could explain the decrease in anthocyanin levels during the end stages of fermentation. The highest anthocyanin content observed in this experiment was between 30–35 mg/L malvidin-3-glucoside equivalent. Chaovanalikit et al. [10] reported in their study that the total anthocyanin in the mangosteen pericarp to be 180–210 mg cyanindin-3-glucoside/100 g; the method used measured anthocyanin equivalent as cyanidin-3-glucoside while in the current research, anthocyanin equivalent is as malvidin-3-glucoside. Red wine typically contains about 500 mg/L of anthocyanin which is significantly higher than the amount of anthocyanin extracted in mangosteen wine. This could be due to the fact that the method used measured anthocyanin equivalent as malvidin-3-glucoside, but the main anthocyanin in mangosteen is cyanidin-3-glucoside.
3.6 Sorting technique
Sorting task was performed to examine the effect of percentage of mangosteen pericarp and yeast strains used on the sensory characteristics of mangosteen wine. The two-dimensional perceptual map generated by sorting could be used to explained 52% of the variation in the data (dimension one = 43%, dimension two = 9%) (Figure 7). The mangosteen wines could be classified
Figure 5: The change in tannin content of mangosteen wines made with different pericarp percentages (5, 7.5, and 10%) and yeast strains used; Montrachet (M) and Pasteur Red (P) during active fermentation (n = 3). Data for 0M and 0P were not detected.
Figure 6: The change in anthocyanin concentration of mangosteen wines made with different pericarp percentages (5, 7.5, and 10%) and yeast strains used; Montrachet (M) and Pasteur Red (P) during active fermentation (n = 3). Data for 0M and 0P were not detected.

413
T. D. Shrestha et al., “Impact of Fermentation Conditions on the Extraction of Phenolics and Sensory Characteristics of Mangosteen Wine.”
Applied Science and Engineering Progress, Vol. 14, No. 3, pp. 406–416, 2021
into five groups. Overlapping confidence ellipsoids indicated that the samples were not significantly different (α = 0.05). Group one consists of wines made with 0% pericarp with Montrachet and Pasteur Red (0M, 0P). Group two consists of wines made with 5% pericarp with Montrachet and Pasteur Red yeast (5M, 5P). Group three consists of wines made with 7.5 and 10% pericarp with Montrachet (7.5M, 10M). Group four consists of a single wine, 10% Pasteur Red (10P). Lastly, group five consists of wines made with 7.5% pericarp with Pasteur Red (7.5P) and its replicate. Wine sample 7.5P was replicated in order to evaluate the efficiency and reliability of the panelists. For lower pericarp additions (0 and 5%), the groups were based on the amount of pericarp added, whereas the 7.5 and 10% groups were based on the different yeast strains used. The difference in sensory characteristics due to the varying percentages of pericarp added was evident for 0 and 5% mangosteen wines. However, the effect of the different yeast strains used was more apparent in the wines made with higher pericarp concentration (7.5 and 10%). DISTATIS map is a multidimensional scaling (MDS) used to analyze several distance matrices computed on the same set of objects [18]. The proximity between two points reflects their similarity. The resulting DISTATIS map (Figure 8) indicated which characteristics of the wine are more evident, and in which samples. In this map, the attributes that fall
closest to a dimension are explained by that particular dimension. In Figure 8, attributes such as smooth, low pungency, medicinal, tropical fruit characteristics, mangosteen pericarp, mangosteen flesh, and woody, could be explained by dimension one, while attributes like floral aroma, body, and alcoholic aroma could be explained by dimension two. Figure 8 showed that the panelists were able to group the samples with similar characteristics together, which indicated that the panel’s evaluations are reliable. Figure 8 also indicated that 0% pericarp wines (0M, 0P), regardless of yeast strains used, had higher mangosteen flesh-like characteristics and low pungency, while 7.5M, 7.5P, 10M, and 10P wines had more mangosteen pericarp-like characteristics. When no mangosteen pericarp was added to the wine, the wine showed mangosteen flesh characteristics. With the addition of mangosteen pericarp, the pericarp characteristics started to overpower mangosteen flesh characteristics. However, at higher pericarp percentages (7.5M, 7.5P, 10M, and 10P) the differences due to the amount of pericarp was only slightly different, while the sensory differences due to the different yeast strains used was more apparent. Wines with higher pericarp content were also perceived to be more woody and medicinal. This could be attributed to the compounds present in the pericarp. Mangosteen pericarp has high phenolic
Figure 7: Perceptual map of mangosteen wine made with different pericarp percentages and yeast strains used, at 95% confidence interval.
Figure 8: DISTATIS mapping of the sensory characteristics of mangosteen wine samples.

T. D. Shrestha et al., “Impact of Fermentation Conditions on the Extraction of Phenolics and Sensory Characteristics of Mangosteen Wine.”
414 Applied Science and Engineering Progress, Vol. 14, No. 3, pp. 406–416, 2021
content, and the phenolic content of wine is a major contributor to wine flavor and aroma. The Adams-Harbertson assay revealed that mangosteen wine is rich in phenolic content (Figure 4). These compounds react with different yeast metabolites [32] and with each other to form different compounds. Yeast metabolism during fermentation produces not only alcohol and carbon dioxide, but also produces sensorially important volatile metabolites [33]. A notable amount of wine flavor compounds is formed during fermentation, making yeast and other wine related organisms crucial to the development of wine flavor [33]. Tropical fruit and floral aroma characteristics were perceived more in wine with higher pericarp content fermented with Pasteur Red yeast. Pasteur Red yeast is used to make wines that are full-bodied and have fruity flavors along with complex aromas [34]. Zinfandel, Merlot, and Syrah are some wines in which the use of Pasteur Red yeast is suitable. Merlot wines have a fruity characteristic relating to red and black berry aroma [35]. The position of the wine with 10% pericarp and fermented with Pasteur Red yeast on the graph indicated that the sample is not unique; either it consists of all the attributes listed or none of the attributes.
4 Conclusions
This study investigated the impact of varying percentages of pericarp on the extraction profile of phenolics and their effect on the sensory properties of mangosteen wine while using two yeast strains. By adding more pericarp, the phenolic content of the wine subsequently increased regardless of the yeast strain used. The highest amount of total phenolics content at the end of the fermentation period was 4,000 mg/L catechin equivalent, while the lowest was 1,000 mg/L catechin equivalent, and the highest total tannin content was 1,200 mg/L catechin equivalent, while the lowest was 400 mg/L catechin equivalent. The sorting result showed that at low pericarp content, the yeast strain used made no apparent difference to the perceived sensory characteristics. But at higher pericarp content, the difference in sensory characteristics due to different yeast strains used was more apparent. Wines with lower pericarp content also had more characteristics of mangosteen pulp, whereas wines with higher pericarp content had more
mangosteen pericarp characteristics. To summarize, the amount of pericarp added affected the extraction profile of phenolics, whereas the strain of yeast used made no significant difference. The yeast strain used affected sensory characteristics only in wines with higher pericarp content.
Acknowledgement
The authors would like to express their gratitude to Assumption University of Thailand for funding the research.
References
[1] D. Lin, M. Xiao, J. Zhao, Z. Li, B. Xing, X. Li, M. Kong, L. Li, Q. Zhang, Y. Liu, and H. Chen, “An overview of plant phenolic compounds and their importance in human nutrition and management of type 2 diabetes,” Molecules, vol. 21, no. 10, p. 1374, 2016.
[2] J. A. Kennedy, “Grape and wine phenolics: Observations and recent findings,” Ciencia e Investigación Agraria, vol. 35, no. 2, pp. 107–120, 2008.
[3] K. L. Sacchi, L. F. Bisson, and D. O. Adams, “A review of the effect of winemaking techniques on phenolic extraction in red wines,” American Journal of Enology and Viticulture, vol. 56, no. 3, pp. 197–206, 2005.
[4] A. L. Waterhouse, “Wine phenolics,” Annals of the New York Academy of Sciences, vol. 957, no. 1, pp. 21–36, 2002.
[5] R. R. Villamor, “The impact of wine components on the chemical and sensory properties of wines,” Ph.D. dissertation, School of Food Science, Washington State University, USA, 2012.
[6] L. Eisenman, The Home Winemakers Manual. California: The ValleyVintner, 1999, pp. 63–66.
[7] L. V. A. Reddy and O. V. S. Reddy, “Effect of enzymatic maceration on synthesis of higher alcohols during mango wine fermentation,” Journal of Food Quality, vol. 32, no. 1, pp. 34– 47, 2009.
[8] U. B. Jagtap and V. A. Bapat, “Wines from fruits other than grapes: Current status and future prospectus,” Food Bioscience, vol. 9, pp. 80–96, 2015.

415
T. D. Shrestha et al., “Impact of Fermentation Conditions on the Extraction of Phenolics and Sensory Characteristics of Mangosteen Wine.”
Applied Science and Engineering Progress, Vol. 14, No. 3, pp. 406–416, 2021
[9] D. Baidya, I. Chakraborty, and J. Saha, “Table wine from tropical fruits utilizing natural yeast isolates,” Journal of Food Science And Technology, vol. 53, no. 3, pp. 1663–1669, 2016.
[10] A. Chaovanalikit, A. Mingmuang, T. Kitbunluewit, N. Choldumrongkool, J. Sondee, and S. Chupratum, “Anthocyanin and total phenolics content of mangosteen and effect of processing on the quality of mangosteen products,” International Food Research Journal, vol. 19, no. 3, pp. 1047– 1053, 2012.
[11] A. B. Upaganlawar and S. L. Badole, “Mangosteen (Garcinia mangostana linn.): Role in prevention of skin disorders,” in Bioactive Dietary Factors and Plant Extracts in Dermatology. New Jersey: Humana Press, 2013, pp. 451–457.
[12] C. Fu, A. E. K. Loo, F. P. P. Chia, and D. Huang, “Oligomeric proanthocyanidins from mangosteen pericarps,” Journal of Agricultural and Food Chemistry, vol. 55, no.19, pp.7689–7694, 2007.
[13] K. Moosophin, T. Wetthaisong, L. O. Seeratchakot, and W. Kokluecha, “Tannin extraction from mangosteen peel for protein precipitation in wine,” Asia-Pacific Journal of Science and Technology, vol.15, no. 5, pp. 377–385, 2010.
[14] M. F. P. P. M. Castro, V. D. D. A. Anjos, A. C. B. Rezende, E. A. Benato, and S. R. D. T. Valentini, “Postharvest technologies for mangosteen (Garcinia mangostana L.) conservation,” Food Science and Technology, vol. 32, no. 4, pp. 668– 672, 2012.
[15] N. P. Minh, “Optimization of mangosteen wine fermentation,” International Journal of Multidisciplinary Research and Development, vol. 1, pp. 168–172, 2014.
[16] G. L. Miller, “Use of dinitrosalicylic acid reagent for determination of reducing sugar,” Analytical Chemistry, vol. 31, no. 3, pp. 426–428, 1959.
[17] M. Downey, K. Skogerson, and M. Mazza, “Modified Harbertson-Adams Assay,” 2006. [Online]. Available: http://boulton.ucdavis.edu/uvvis/adamsassay.htm
[18] H. Abdi and D. Valentin, “DISTATIS How to analyze multiple distance matrices,” 2007. [Online]. Available: http://citeseerx.ist.psu.edu/viewdoc/summary?doi=10.1.1.80.904
[19] H. Abdi, D. Valentin, S. Cholletand, and C. Chrea, “Analyzing assessors and products in sorting
tasks: DISTATIS, theory and applications,” Food Quality and Preference, vol. 18, no. 4, pp. 627– 640, 2007.
[20] D. Valentin, S. Chollet, M. Lelièvre, and H. Abdi, “Quick and dirty but still pretty good: A review of new descriptive methods in food science,” International Journal of Food Science & Technology, vol. 47, no. 8, pp. 1563–1578, 2012.
[21] A. C. Dweck and F. FRSC, A Review of Mangosteen (Garcinia Mangostana) Linn. England: Personal Care Magazine, 2004, pp.15–18.
[22] P. T. Adeboye, M. Bettiga, and L. Olsson, “The chemical nature of phenolic compounds determines their toxicity and induces distinct physiological responses in Saccharomyces cerevisiae in lignocellulose hydrolysates,” Amb Express, vol. 4, no. 46, pp. 1–10, 2014.
[23] F. He, N. N. Liang, L. Mu, Q. H. Pan, J. Wang, M. J. Reeves, and C. Q. Duan, “Anthocyanins and their variation in red wines I. Monomeric anthocyanins and their color expression,” Molecules, vol. 17, no. 2, pp. 1571–1601, 2012.
[24] G. H. Laleh, H. Frydoonfar, R. Heidary, R. Jameei, and S. Zare, “The effect of light, temperature, pH and species on stability of anthocyanin pigments in four Berberis species,” Pakistan Journal of Nutrition, vol. 5, no.1, pp. 90–92, 2006.
[25] J. C. Rivas-Gonzalo, S. Bravo-Haro, and C. Santos-Buelga, “Detection of compounds formed through the reaction of malvidin 3-monoglucoside and catechin in the presence of acetaldehyde,” Journal of Agricultural and Food Chemistry, vol. 43, no. 6, pp. 1444–1449, 1995.
[26] Y. Hayasaka and R. E. Asenstorfer, “Screening for potential pigments derived from anthocyanins in red wine using nanoelectrospray tandem mass spectrometry,” Journal of Agricultural and Food Chemistry, vol. 50, no. 4, pp. 756–761, 2012.
[27] Z. B. Xiao, J. H. Liu, F. Chen, L. Y. Wang, Y. W. Niu, T. Feng, and J. C. Zhu, “Comparison of aroma-active volatiles and their sensory characteristics of mangosteen wines prepared by Saccharomyces cerevisiae with GC-olfactometry and principal component analysis,” Natural Product Research, vol. 29, no. 7, pp. 656–662, 2015.
[28] C. W. Haminiuk, M. S. Plata-Oviedo, G. de Mattos, S. T. Carpes, and I. G. Branco, “Extraction and

T. D. Shrestha et al., “Impact of Fermentation Conditions on the Extraction of Phenolics and Sensory Characteristics of Mangosteen Wine.”
416 Applied Science and Engineering Progress, Vol. 14, No. 3, pp. 406–416, 2021
quantification of phenolic acids and flavonols from Eugenia pyriformis using different solvents,” Journal of Food Science and Technology, vol. 51, no. 10, pp. 2862–2866, 2012.
[29] V. L. Singleton and E. K. Trousdale, “Anthocyanin- tannin interactions explaining differences in polymeric phenols between white and red wines,” American Journal of Enology and Viticulture, vol. 43, no.1, pp. 63–70, 1992.
[30] A. B. Bautista-Ortín, N. Busse-Valverde, J. I. Fernández-Fernández, E. Gómez-Plaza, and R. Gil-Muñoz, “The extraction kinetics of anthocyanins and proanthocyanidins from grape to wine in three different varieties,” OENO One, vol. 50, no. 2, Jul. 2016, Art. No. 781.
[31] R. Boulton, “The copigmentation of anthocyanins and its role in the color of red wine: a critical review,” American Journal of Enology and
Viticulture, vol. 52, no. 2, pp. 67–87, 2001. [32] A. Caridi, A. Cufari, R. Lovino, R. Palumbo, and
I. Tedesco, “Influence of yeast on polyphenol composition of wine,” Food Technology and Biotechnology, vol. 42, no. 1, pp. 37–40, 2004.
[33] J. H. Swiegers, E. J. Bartowsky, P. A. Henschke, and I. Pretorius, “Yeast and bacterial modulation of wine aroma and flavor,” Australian Journal of Grape and Wine Research, vol. 11, no. 2, pp. 139–173, 2005.
[34] D. Pambianchi, Techniques in Home Winemaking: The Pomprehensive Guide to Making Chateau-Style Wine. Canada: Vehicule Press, 2008.
[35] B. Pineau, J. C. Barbe, C. Van Leeuwen, and D. Dubourdieu, “Contribution of grape skin and fermentation microorganisms to the development or red-and black-berry aroma in Merlot wines,” OENO One, vol. 45, no. 1, pp. 27–37, 2011.