Impact of Engine Oil Properties on Emissions
61
Final Report Impact of Engine Oil Properties on Emissions CRC Project No. E-61 Prepared for: Coordinating Research Council 3650 Mansell Road, Suite 140 Alpharetta, GA 30022 678-795-0506 Submitted: August 2002 Thomas D. Durbin, Principal Investigator J. Wayne Miller, Co-Investigator John T. Pisano Claudia Sauer Sam Rhee Tao Huai Bourns College of Engineering- Center for Environmental Research and Technology University of California Riverside, CA 92521 (909) 781-5791 (909) 781-5790 fax Gervase I. MacKay, Collaborator UNISEARCH Associates Inc. 96 Bradwick Drive Concord, Ontario, Canada, L4K 1K8 02-VE-59971-02-DFR
Transcript of Impact of Engine Oil Properties on Emissions
Final Report
Impact of Engine Oil Properties on Emissions
CRC Project No. E-61
Prepared for: Coordinating Research Council 3650 Mansell Road, Suite 140
Alpharetta, GA 30022 678-795-0506
Submitted:
August 2002
Thomas D. Durbin, Principal Investigator J. Wayne Miller, Co-Investigator
John T. Pisano Claudia Sauer
Sam Rhee Tao Huai
Bourns College of Engineering- Center for Environmental Research and Technology
University of California Riverside, CA 92521
(909) 781-5791 (909) 781-5790 fax
Gervase I. MacKay, Collaborator UNISEARCH Associates Inc.
96 Bradwick Drive Concord, Ontario, Canada, L4K 1K8
02-VE-59971-02-DFR

University of California, Riverside, CE-CERT CRC Project E-61: Oil Property Impacts
i
Table of Contents Executive Summary ......................................................................................................... vi 1. Introduction ........................................................................................................... 1 2. Experimental Procedures ..................................................................................... 2 2.1 Test Vehicles ............................................................................................... 2 2.2 Fuels and Lubricants ................................................................................... 2 2.3 Catalyst and Oxygen Sensor Aging............................................................. 3 2.4 Test Sequence.............................................................................................. 4 2.5 Vehicle Emissions Measurements............................................................... 6 3. Results .................................................................................................................. 10 3.1 FTP Results ............................................................................................... 10 3.2 Steady-State Idle and 50 mph Cruise Results............................................ 21 4. Summary and Conclusions................................................................................. 26 5. Acknowledgments................................................................................................ 27 6. References ............................................................................................................ 28 Appendices
University of California, Riverside, CE-CERT CRC Project E-61: Oil Property Impacts
ii
List of Figures Figure 1. Flowchart for E-61 Testing Protocol ............................................................................. 5 Figure 2. VERL Control Room and Dynamometer Cell ................................................................ 6 Figure 3. Configuration of DOAS Sampling System..................................................................... 8 Figure 4. FTP Emissions for 2001 Ford Windstar ..................................................................... 11 Figure 5. FTP Emissions for 2001 Toyota Camry....................................................................... 12 Figure 6. FTP Emissions for 2001 Dodge Neon ........................................................................ 13 Figure 7. FTP Emissions for 2000 Honda Accord ..................................................................... 14 Figure 8. FTP Emissions for 2001 Nissan Sentra ...................................................................... 15 Figure 9. FTP Emissions for 2001 Buick LeSabre...................................................................... 16 Figure 10. FTP SO2 Emissions ................................................................................................... 19 Figure 11. SO2 Emissions for Buick LeSabre ............................................................................. 24

University of California, Riverside, CE-CERT CRC Project E-61: Oil Property Impacts
iii
List of Tables Table 1. Description of Test Vehicles .......................................................................................... 2 Table 2. Oil Matrix for E-61 Project ............................................................................................ 2 Table 3. Fuel Specifications and Properties ................................................................................. 3 Table 4. Test of Statistical Significance for Regulated Pollutants between the Lowest- and
Highest-Sulfur Oils over the FTP................................................................................... 10 Table 5. Statistical Significance of Emissions Differences for the Buick LeSabre over the FTP .................................................................................................................. 17 Table 6. Test of Statistical Significance for Regulated Pollutants for FTP Bag 2 ...................... 18 Table 7. Test of Statistical Significance for SO2 Emissions for the FTP..................................... 20 Table 8. Test of Statistical Significance for Regulated Pollutants for Idle Tests.......................... 21 Table 9. Test of Statistical Significance for Regulated Pollutants for 50 mph Cruise Tests....................................................................................................... 22 Table 10. Test of Statistical Significance for SO2 Emissions for Idle and 50 mph Cruise Tests.. 23

University of California, Riverside, CE-CERT CRC Project E-61: Oil Property Impacts
iv
List of Appendices Appendix A. Detailed Analyses of the Test Oil Properties ......................................................... 31 Appendix B. Description of Catalyst Aging ................................................................................ 32 Appendix C. Sulfur Removal Protocol ........................................................................................ 34 Appendix D. Methodology for Deconvolution of the Formaldehyde Signal from the SO2 Signal......................................................................................................... 35 Appendix E. Detailed FTP Emissions Results ............................................................................. 37 Appendix F. Test of Statistical Significance for Regulated Pollutants for Individual Bags ........ 44 Appendix G. Calculation of the Fuel Sulfur Equivalent for the Contribution of the Lubricant S to
the Exhaust.............................................................................................................. 46 Appendix H. Detailed Idle and 50 mph Cruise Emissions Results .............................................. 47

University of California, Riverside, CE-CERT CRC Project E-61: Oil Property Impacts
v
Disclaimer The statements and conclusions in this report are those of the Contractor and not necessarily those of the Coordinating Research Council. The mention of commercial products, their source or test use in connection with the material reported herein is not to be construed as either an actual or implied endorsement of such products.
University of California, Riverside, CE-CERT CRC Project E-61: Oil Property Impacts
vi
Executive Summary As fuel sulfur levels have been lowered, the potential for sulfur in lubricants to affect catalyst performance and exhaust emissions has grown. This issue is particularly timely considering the development of International Lubricant Standardization and Approval Committee (ILSAC) GF-4 oil specifications that will be used in conjunction with LEV II and Tier 2 vehicle technologies in 2004.
The objective of the present program was to determine whether sulfur levels in engine oil could have a measurable impact on vehicle emissions. For this study, the emissions impact of oil sulfur was evaluated for 4 ultra-low-emission vehicles (ULEVs) and 2 super-ultra-low-emission vehicles (SULEVs) using oils with sulfur contents ranging from 0.01% to 0.76% and a gasoline with a 0.2 ppmw sulfur content. Vehicles were configured with aged catalysts and tested in triplicate over the Federal Test Procedure (FTP) and at idle and 50 miles per hour (mph) cruise conditions. In addition to the regulated emissions and modal engine-out and tailpipe emissions, engine-out SO2 was measured in near real-time using a novel approach with a differential optical absorption spectrometer (DOAS). A novel instrument was developed to measure engine-out SO2 emissions. This instrument is capable of measuring SO2 emissions with a detection limit of approximately 0.100 mg/mi over the FTP and a noise level of 30 ppbv at one standard deviation. This instrument was capable of measuring the differences in SO2 emissions between the highest-, intermediate-, and lowest-sulfur oils over the range of test conditions and test vehicles in the program. The contribution of SO2 emissions for the highest-sulfur oils ranged from less than 1 to 6 ppm on a fuel sulfur equivalent basis depending on the vehicle and test cycle. The highest SO2 emissions were observed for the two vehicles with the largest displacement engines. Over the FTP, variations between 0.01% to 0.76% in lubricant sulfur level had minimal impact on regulated tailpipe emissions. Observed differences between regulated emissions for test runs with different oil sulfur levels were generally within the experimental variability. For one of the test vehicles, some differences were found between NOx emissions on the lowest- and highest-sulfur oil. Subsequent tests on this vehicle with oils ranging in sulfur content from 0.16 to 0.52% showed NOx emissions were not correlated to oil sulfur level.
Tests conducted under idle and 50 mph cruise conditions showed, similarly to the FTP, that variation in oil sulfur levels between 0.01% and 0.76% had minimal impact on regulated emissions. Under these conditions, emissions were generally lower than the FTP emissions, and for some cases were near the measurement detection levels.

University of California, Riverside, CE-CERT CRC Project E-61: Oil Property Impacts
1
1. Introduction Over the years, gasoline sulfur levels have declined as a result of both Federal and State regulations. A number of studies have measured the impact of fuel sulfur levels on exhaust emissions [1-14]. Additional reductions in sulfur content are anticipated to meet the new United States Environmental Protection Agency (EPA) requirements of average sulfur levels of 30 ppm and the California requirements of average sulfur levels of 15 ppm. As sulfur levels are reduced in gasoline, some have suggested that the issue of lubricant sulfur levels and other properties be further investigated [15]. In a recent study of 1, 30 and 100 ppm sulfur level fuels, it was found that the familiar linear relationship between the logarithm of the emissions and the logarithm of the sulfur level did not extend to the data collected with a 1 ppm sulfur level fuel [8]. One possible explanation for this observation with the 1 ppm sulfur level fuel is that sulfur from engine lubricants affected emissions at these levels. The impending International Lubricant Standardization and Approval Committee (ILSAC) GF-3 engine oil is designed to provide improved fuel efficiency, high temperature deposit protection, and lower volatility, but it currently does not have a requirement for sulfur content in the finished oil. Work has started on the revised ILSAC GF-4 oil specifications for use in conjunction with LEV II and Tier 2 vehicle technologies for 2004. It is important to understand the possible impacts of sulfur in the engine oil on vehicle emissions to determine whether oil sulfur should be added to the other properties that are currently proposed for review.
The goal of the present program was to evaluate the potential impact of the lubricant sulfur levels on emissions for late-model vehicles. For this program, 4 California certified ultra-low-emission vehicles (ULEVs) and 2 California certified super-ultra-low-emission vehicles (SULEVs) were tested on oils with differing sulfur levels. Each of the vehicles was tested on a poly alpha olefin (PAO) base oil with a 0.01% sulfur content and on a 0.76% sulfur content Group 1 base oil. One vehicle was tested on 4 additional oils including 2 PAO base oils with sulfur contents of 0.16% and 0.28% and 2 Group 1 oils with sulfur contents of 0.29 and 0.52%. Vehicles were configured with aged catalysts and tested in triplicate over the FTP and at idle and 50 miles per hour (mph) cruise. For each test, regulated emissions and modal engine-out and tailpipe emissions were measured. Additionally, engine-out modal SO2 emissions were measured using a novel approach, differential optical absorption spectroscopy (DOAS), to determine the contribution of sulfur from the engine oil to the exhaust.

University of California, Riverside, CE-CERT CRC Project E-61: Oil Property Impacts
2
2. Experimental Procedures 2.1 Test Vehicles Six vehicles were recruited and tested for this program: 4 ULEV and 2 SULEV certified California vehicles. The ULEV vehicles were recruited from rental car agencies (Hertz, Enterprise, and Dollar). The 2 SULEV certified vehicles were obtained on loan from an automobile manufacturer. The vehicles were all selected to have sufficiently high mileages to ensure stable emissions. A description of each of the test vehicles is provided in Table 1. Before entering the program, all vehicles were inspected to ensure that they were in sound mechanical and operational condition.
Table 1. Description of Test Vehicles.
MY OEM Model Certification Displacement Mileage Engine Family 2001 Ford Windstar ULEV 3.8 L 20,407 1FMXT03.82JX 2001 Buick LeSabre ULEV 3.8 L 16,308 1GMXV03.8044 2001 Dodge Neon ULEV 2.0 L 17,769 1CRXV0122V40 2001 Toyota Camry ULEV 2.2 L 20,678 1TYXV02.2JJA 2000 Honda Accord SULEV 2.3 L 10,548 YHNXV02.3NL52001 Nissan Sentra CA SULEV 1.8L 5,237 1NSXV01.852A
2.2 Fuels and Lubricants Six engine oil blends were formulated for the E-61 test program and were designed to span the range of current and future oil sulfur levels. These oil blends were evaluated using a tiered testing sequence as discussed below. The basic oil matrix is provided in Table 2. Detailed analyses of each oil are provided in Appendix A. These oils were all obtained from The Lubrizol Corporation, Wickliffe, OH.
Table 2. Oil Matrix for the E-61 Project. (values represent lubricant sulfur levels)
Study PAO Base Group 1 Base
Base Oil Sulfur 0.01% (1) 0.29% (2) Max. Additive Sulfur 0.28% (3) 0.76% (4) Min. Additive Sulfur 0.16% (5) 0.52% (6)
Test oil descriptions: - (1) This oil had a synthetic base containing an ashless, zero-sulfur antiwear and antioxidant.
This oil was designed to provide a zero sulfur baseline condition with adequate engine protection.
- (2) This oil was a solvent-refined Group 1 base oil containing the same ashless zero-sulfur antiwear and antioxidant as in oil (1). A target of 0.2% sulfur base oil was established to

University of California, Riverside, CE-CERT CRC Project E-61: Oil Property Impacts
3
provide the higher sulfur condition for the base oil study. This base oil was designed to match as closely as possible the viscosity of the synthetic base and be of sufficiently low volatility so as to minimize the impact of base oil physical properties on measured emissions.
Maximum additive sulfur - (3) The PAO base oil, minus the ashless additive system, was formulated with a typical
ILSAC GF-2/GF-3 zinc dialkyl dithiophosphate (ZDDP) additive package to provide an oil with a sulfur content of approximately 0.2%.
- (4) The Group 1 base oil, minus the ashless additive system, was formulated with a high level ZDDP additive package. This oil was designed to have 0.7% total sulfur with 0.5% sulfur from the additive plus the 0.2% from the base oil.
Minimum additive sulfur - (5) The PAO base oil (1) was formulated with 50% of the previous ZDDP additive system
and supplemented with a zero sulfur, ashless antiwear and antioxidant to provide adequate engine protection. This was designed to provide a sulfur level of 0.1% similar to that targeted for ILSAC GF-4.
- (6) The Group 1 base oil was formulated with 50% of the previous ZDDP additive system. This was designed to provide 0.25% sulfur from the additive and 0.20% from the base oil for total sulfur of 0.45%.
The fuel for this project was specially blended to have an ultra-low sulfur content. The ultra-low sulfur content of the fuel was a critical parameter in ensuring that the effects of the oil sulfur could readily be distinguished from those of the combustion process of the fuel. The properties of the test fuel are provided in Table 3. Analyses of the fuel sulfur content were performed at 3 separate laboratories indicating fuel sulfur content was near the level of 0.2 ppm. The test fuel was provided by Haltermann Products of Channelview, TX.
Table 3. Fuel Specifications and Properties.
Specification Actual RVP 7.5-8.0 psi 7.9 psi Sulfur <1 ppm ~0.2 ppm Benzene 1.2 vol% max <0.1 vol % Aromatics 30 vol% max 25.1 vol % Olefins 10 vol% max 0.9 vol % T50 220˚F max 194˚F T90 330˚F max 316˚F MTBE 11 vol. % 11.0 vol % Specific Gravity 0.7298 g/l
2.3 Catalyst and Oxygen Sensor Aging For this program, vehicles were tested using bench-aged catalyst systems. New catalyst systems were obtained from local dealerships for each of the test vehicles. This included underfloor

University of California, Riverside, CE-CERT CRC Project E-61: Oil Property Impacts
4
catalyst(s), any close-coupled catalyst(s), and pre- and post-catalyst oxygen sensors. The as-received catalysts were removed from the vehicle for use in a separate program. The catalyst systems were aged for 90 hours (120,000 mile equivalent) using the Rapid Aging Test-A (RAT-A) protocol [16]. All catalyst aging was conducted at the Southwest Research Institute (SwRI) in San Antonio, TX. Catalysts were configured at CE-CERT for the SwRI aging cell before shipment. All catalysts were aged in pairs of two using a single engine with the RAT-A temperature profile maintained for each catalyst. Catalyst systems were aged using the same fuel used for the main testing portion of this program and lowest-sulfur PAO base oil (1) described above. The aging protocol is discussed in greater detail in Appendix B. 2.4 Test Sequence The test sequence for the E-61 test program is provided in Figure 1 and outlined briefly here. Aged systems were placed in the vehicle prior to starting the preconditioning sequence. The preconditioning protocol was designed to ensure that previously used oils and fuels were completely purged from the system and to ensure the vehicle had reached stable operating conditions on each of the specific test oils and the test fuel. Initial tests on the Buick LeSabre using a less rigorous preconditioning procedure provided some evidence that complete purging of the fuel system was important in obtaining repeatable SO2 emissions. Given the importance of minimizing the contribution of fuel sulfur, the first portion of the test sequence incorporated multiple drains and fills to ensure that the fuel in the vehicle’s tank at the time it was received was fully purged from the system [17]. A double drain procedure was also incorporated for the engine oils. Tests on the lowest-sulfur oil configuration indicated essentially no contribution from any residual in-use fuels or oils using this sequence. Test vehicles were operated on each test oil for a period of 10 hours of steady-state driving at 55 mph prior to testing. The oil was changed after the first hour to ensure that most of this mileage accumulation was conducted on the oil actually used for the testing. The driving portion of the preconditioning was performed over the road on open highways east of CE-CERT. To remove residual sulfur from the catalyst surface, a cycle composed of 10 wide-open-throttle events was conducted after 5 hours of driving on each test oil. This cycle is described in greater detail in Appendix C. After the steady-state driving was completed, the vehicle was preconditioned using traditional FTP procedures including an LA4 preconditioning cycle and a 12-36 hour soak. Each vehicle was tested over an FTP followed by steady-state driving cycles at idle and a 50 mph cruise. This test sequence was performed in triplicate, with a fourth test performed in some cases where a data point appeared to be an outlier or where additional test data was needed. Each vehicle was initially tested on the lowest (1) and then the highest (4) sulfur oils. The data were then submitted to CRC for review to evaluate whether emissions differences were observed and whether further testing of intermediate sulfur levels was warranted. Of the six test vehicles, only the results for the Buick LeSabre suggested further testing. The Buick LeSabre was also tested twice on the low-sulfur oil since trends in the SO2 emissions for the initial run indicated the possibility of a sulfur contribution from a residual fuel or oil source. The Buick was tested on the remaining test oils in the following order: oil (6), oil (3), oil (2), and oil (5).

University of California, Riverside, CE-CERT CRC Project E-61: Oil Property Impacts
5
Drain and 100% fill with ~0.2 ppm sulfur fuel
Start Replace as-rec’d catalyst with catalyst and O2 sensor dyno- aged on low sulfur fuel/oil
Drain and fill with 4 gallons of ~0.2 ppm sulfur fuel
Drive 10 miles
No Have 3 valid FTPs and SS tests been run and pass QC?
Drain and 40% fill with ~0.2 ppm sulfur fuel
Run 10-WOT cycles
Drive at 55 mph steady state for 5 hours
Drain and 40% fill with ~0.2 ppm sulfur fuel
Drain and fill with engine oil per test matrix
Drive at 55 mph steady state for 1 hour
Drain and fill engine oil
Drive at 55 mph steady state for 4 hours
Drain and 100% fill with~0.2 ppm sulfur fuel
Refill with ~0.2 ppm sulfur fuel
Perform LA4 precondition cycle
12 – 36 hour soak
Collect fuel and oil sample before first FTP test on vehicle
Run FTP (record tailpipe & engine-out emissions, SO2 before cat.,
fuel/air ratio, and 3WC temp.)
Run steady state tests at idle and 50 mph for 10 minutes
First oil Subsequent oil
Figure 1. Flowchart for E-61 Testing Protocol.
Yes, go to next oil in test matrix
University of California, Riverside, CE-CERT CRC Project E-61: Oil Property Impacts
6
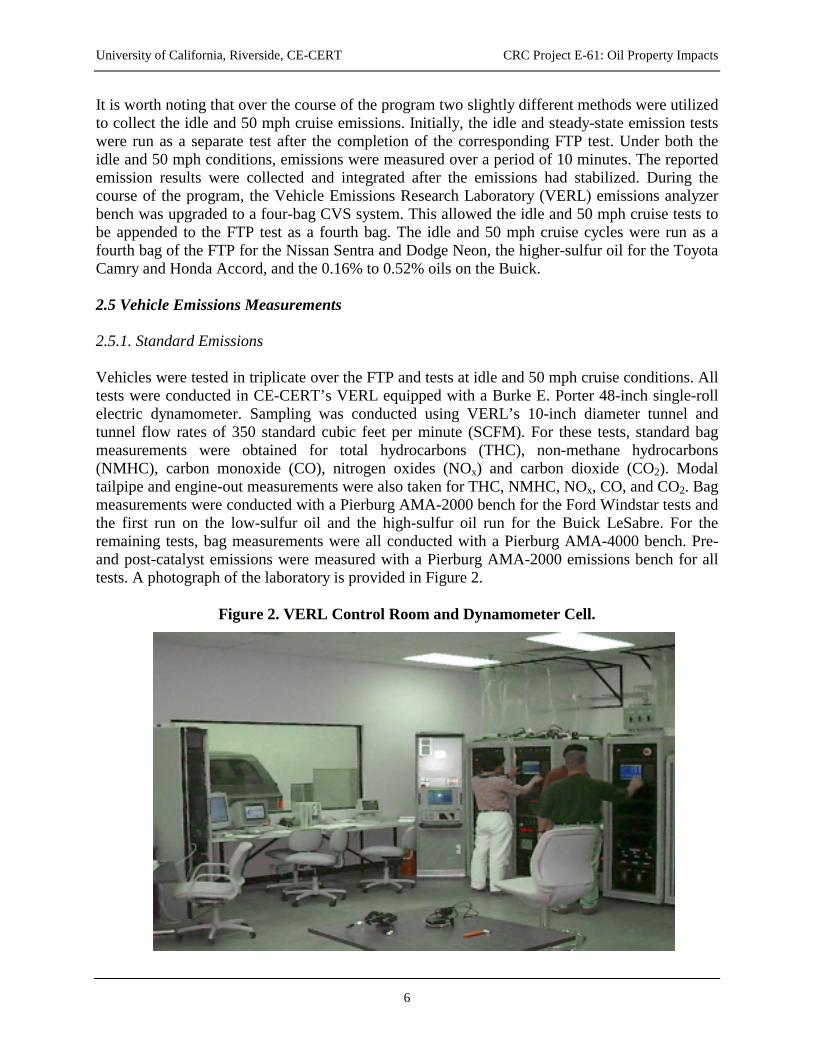
It is worth noting that over the course of the program two slightly different methods were utilized to collect the idle and 50 mph cruise emissions. Initially, the idle and steady-state emission tests were run as a separate test after the completion of the corresponding FTP test. Under both the idle and 50 mph conditions, emissions were measured over a period of 10 minutes. The reported emission results were collected and integrated after the emissions had stabilized. During the course of the program, the Vehicle Emissions Research Laboratory (VERL) emissions analyzer bench was upgraded to a four-bag CVS system. This allowed the idle and 50 mph cruise tests to be appended to the FTP test as a fourth bag. The idle and 50 mph cruise cycles were run as a fourth bag of the FTP for the Nissan Sentra and Dodge Neon, the higher-sulfur oil for the Toyota Camry and Honda Accord, and the 0.16% to 0.52% oils on the Buick. 2.5 Vehicle Emissions Measurements 2.5.1. Standard Emissions Vehicles were tested in triplicate over the FTP and tests at idle and 50 mph cruise conditions. All tests were conducted in CE-CERT’s VERL equipped with a Burke E. Porter 48-inch single-roll electric dynamometer. Sampling was conducted using VERL’s 10-inch diameter tunnel and tunnel flow rates of 350 standard cubic feet per minute (SCFM). For these tests, standard bag measurements were obtained for total hydrocarbons (THC), non-methane hydrocarbons (NMHC), carbon monoxide (CO), nitrogen oxides (NOx) and carbon dioxide (CO2). Modal tailpipe and engine-out measurements were also taken for THC, NMHC, NOx, CO, and CO2. Bag measurements were conducted with a Pierburg AMA-2000 bench for the Ford Windstar tests and the first run on the low-sulfur oil and the high-sulfur oil run for the Buick LeSabre. For the remaining tests, bag measurements were all conducted with a Pierburg AMA-4000 bench. Pre- and post-catalyst emissions were measured with a Pierburg AMA-2000 emissions bench for all tests. A photograph of the laboratory is provided in Figure 2.
Figure 2. VERL Control Room and Dynamometer Cell.

University of California, Riverside, CE-CERT CRC Project E-61: Oil Property Impacts
7
2.5.2. SO2 Emissions In addition to the bag and modal emissions measurements of the standard emissions discussed above, measurements of engine-out SO2 were also conducted. Engine-out SO2 emissions have been utilized in several previous studies as a tracer for oil consumption [18-23]. A number of methods were initially investigated for this portion of the experiment, but most had limitations for this application due to either interferences, time response, or detection limits. A number of techniques have been used over the years for the sampling of SO2 emissions. Collection of SO2 using H2O2 impinger solutions or potassium carbonate coated filters is commonly used with subsequent analysis by either titration methods or ion chromatography [24-26]. These methodologies are useful in obtaining integrated measurements of fixed periods of time. In the present application, however, SO2 emissions measurements were being made from the raw engine-out exhaust. As such, the SO2 emissions as a function of time were necessary to allow the measurements to be correlated with the time-resolved exhaust flow rates to provide SO2 mass emission rates. Bailey and Ariga conducted raw exhaust measurements of SO2 using an Antek pyrofluorescence total sulfur analyzer [22]. This instrument provided detection limits of only 200 ppbv. Based on preliminary calculations, it was determined that detection limits considerably below this would probably be required for the present project. In particular, the average difference in exhaust SO2 concentrations between oil sulfur levels differing by 0.25% would be on the order of 90-120 ppbv for vehicles consuming 1 quart of oil per 10,000 miles and on the order of 60 to 90 ppb for vehicles consuming 1 quart of oil per 15,000 miles. Other pulsed fluorescence methods can provide low level SO2 measurements but sample only once per minute. Flame photometric methods provide more real-time information but suffer from interferences from major exhaust gases. To provide real-time, low-level measurement of engine-out SO2, a differential optical absorption spectrometer (DOAS) was built. This method is used extensively for ambient SO2 measurements and also proved suitable for the exhaust measurements required for this project. The DOAS measures the absorbence of ultraviolet (UV) light as an exhaust sample passes through a sample cell. A sampling system was built to extract the engine-out exhaust gas through heated lines into a heated sampling cell for the UV measurements. A picture of the DOAS sampling system is provided in Figure 3. This sampling cell is equipped with two quartz windows to allow the UV light to enter and exit, and rests within a White cell, or multi-pass mirror system, with a base length of 1.4 meters (m). The mirrors for the sampling system were placed external to the actual sampling cell to eliminate the possibility of them becoming dirty due to exposure to the exhaust. The total volume of the DOAS cell is approximately 4.5 L and the residence time is 19 seconds. The DOAS was configured to provide data once every 3 seconds. Second-by-second SO2 concentrations were obtained from the 3-second DOAS readings using a linear extrapolation. The concentrations were then converted into mass emissions rates by multiplying by the density and the time-aligned exhaust flow rate. Similar procedures have been used previously in analysis of second-by-second data for regulated pollutants for the development of CE-CERT’s Comprehensive Modal Emissions Model (CMEM) [27]. The exhaust flow rate was determined on a second-by-second basis using the CO2 tracer method.

University of California, Riverside, CE-CERT CRC Project E-61: Oil Property Impacts
8
Figure 3. Configuration of DOAS Sampling System.
The wavelength region for which the DOAS spectra are measured was chosen to include the major SO2 absorption structure and avoid wavelength regions where other exhaust components are known to absorb. No interferences were originally anticipated with this technique in the raw exhaust; however, initial tests showed interferences in the spectra. To identify the interferent(s), spectra were collected from a range of potential interferent gases including various aromatic hydrocarbons, nitrogenous species, formaldehyde, and other gases. From the spectral information collected, it was determined that formaldehyde was the major interferent. Other exhaust gas constituents (NO, water, CO, CO2, benzene, toluene, o-, m-, and p-xylene, 1,2,3-, 1,2,4-, and 1,3,5-trimethylbenzene, and acetaldehyde) were tested as possible interferents but proved negative. Nitrogen dioxide (NO2) does absorb in the spectral region used (295–330 nm), but the actual NO2 concentrations in exhaust gas are very low and no contribution of NO2 absorption could be found in the exhaust spectra. Using the spectral information for formaldehyde, the initial DOAS software was modified to subtract formaldehyde from the collected exhaust spectra before determining the SO2 concentration in the residual spectrum. The procedures used by the software program are discussed in detail in Appendix D.
To obtain the low detection limits needed for this project, optical path lengths of 14 or 19.6 m were used. In the development of the DOAS, it was also determined that a quartz lamp with a high output in the UV spectra range was important to provide the necessary detection limits. A lamp with a lower output in the UV range was initially used for the tests conducted on the Ford Windstar and for the 0.76% oil and the first run on the lowest-sulfur oil for the Buick LeSabre. With this lamp, noise levels of 75 ppbv at one standard deviation were obtained. It should be noted this was more than sufficient to characterize the differences between the lowest- and highest-sulfur oils on these 2 vehicles. Thereafter, a lamp with a higher intensity in the UV was
Monochromator and CCD
Cell Heater Control Lamp
Control
Sample Line Heater Control Line Filter
Heater Control
Heated Sample Line
Line to Pump
White Cell Frame (1.4 m Base Length)
Heated Sample Cell
UV Source with Protective Cover
Monochromator and CCD
Cell Heater Control Lamp
Control
Sample Line Heater Control Line Filter
Heater Control
Heated Sample Line
Line to Pump
White Cell Frame (1.4 m Base Length)
Heated Sample Cell
UV Source with Protective Cover

University of California, Riverside, CE-CERT CRC Project E-61: Oil Property Impacts
9
identified from Gilway Technical Lamp, Woburn, MA, and used for the remainder of the testing. With this lamp, the noise level at one standard deviation improved to approximately 30 ppbv. The average detection limit for SO2 over the FTP was approximately 0.100 mg/mi based on three times the standard error of the replicate measurements on the lowest-sulfur oil. The detection limits for the Buick were slightly higher at 0.239 mg/mi based on the combined data for the two separate runs conducted on the low-sulfur oil. This is due in part to somewhat higher SO2 emissions that were observed during the initial tests run on the low-sulfur oil on this vehicle. Verification of the DOAS accuracy was done using a calibration gas. The DOAS SO2 readings were compared with SO2 measurements obtained from potassium carbonate coated filters for SO2 collection followed by ion chromatography analysis. For a 10-minute injection with approximately 500 ppbv of SO2 calibration gas, the methods provided readings within the measurement error, with the filters collecting 120 µg of SO2 and the DOAS collecting 143 µg ± 27 µg of SO2. The uncertainty for the DOAS measurement represents one standard deviation of the noise in the time resolved data. The performance of the DOAS measurements was further verified using raw exhaust from vehicles with differing sulfur levels in the oil and fuel. Initial experiments were conducted using a test vehicle configured with the baseline low-sulfur fuel and the highest-sulfur oil to be used in the first round of testing. The results of this experiment showed that the DOAS was able to identify the oil contribution from the highest-sulfur oil in the exhaust. Another experiment was conducted to ensure that the SO2 measurements from the DOAS were not subject to any additional interferences that had not been identified previously. For this test, a vehicle was configured with the baseline low-sulfur fuel and the 0.01% test oil. In this configuration, 500 ppbv calibration gas was injected into the DOAS sampling line during a test run with the vehicle running. The observed results of the calibration gas during a test cycle indicated that there was no loss of calibration gas and consistency of the DOAS reading to within one standard deviation. Analogous results were also obtained when conducting this experiment during a test run with the higher 30 ppmw sulfur gasoline.
The DOAS was calibrated using SO2 concentrations in the range of 250 to 500 ppbv. A full calibration curve for the instrument is provided in Appendix D. During the course of the typical FTP and idle and 50 mph cruise test cycles, some drift was observed when injecting calibration gas before the test, during the hot soak period, and after the test, and by injecting calibration gas into the raw exhaust stream during actual runs. The concentration levels were corrected for this shift based on calibration injections performed at the beginning of the test, during the hot soak period, and at the end of the test. The cause for this drift was probably related to surface effects inside the DOAS sample cell.

University of California, Riverside, CE-CERT CRC Project E-61: Oil Property Impacts
10
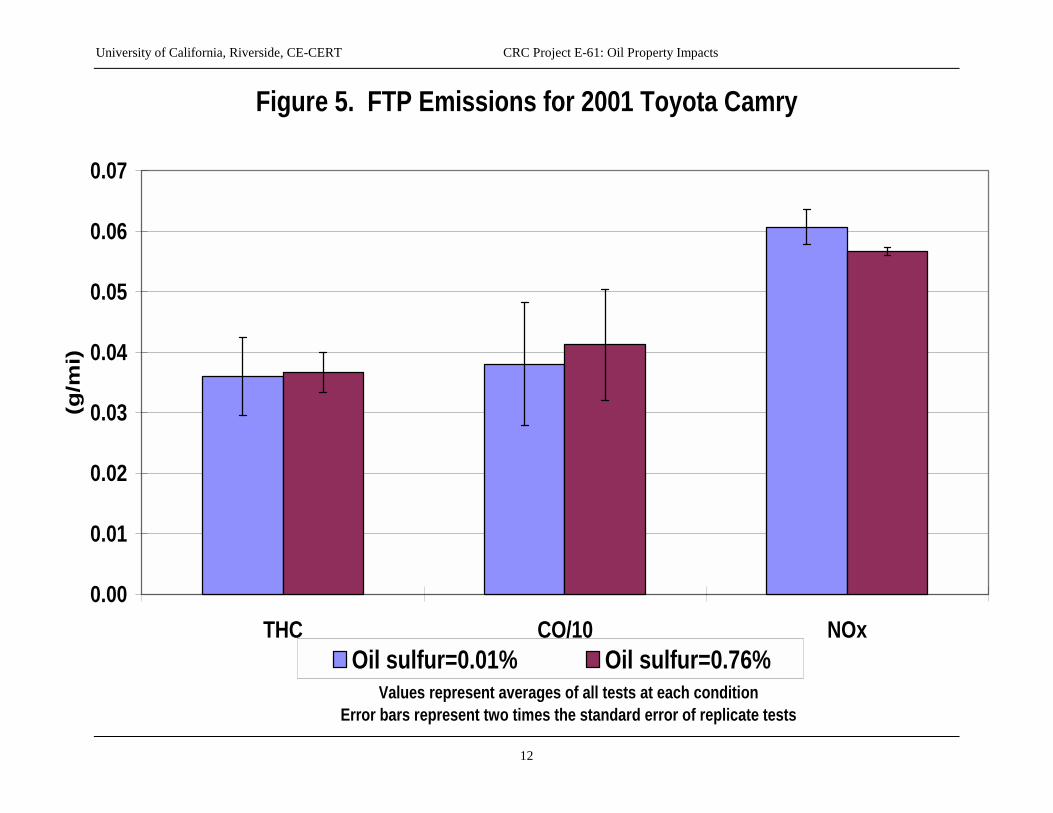
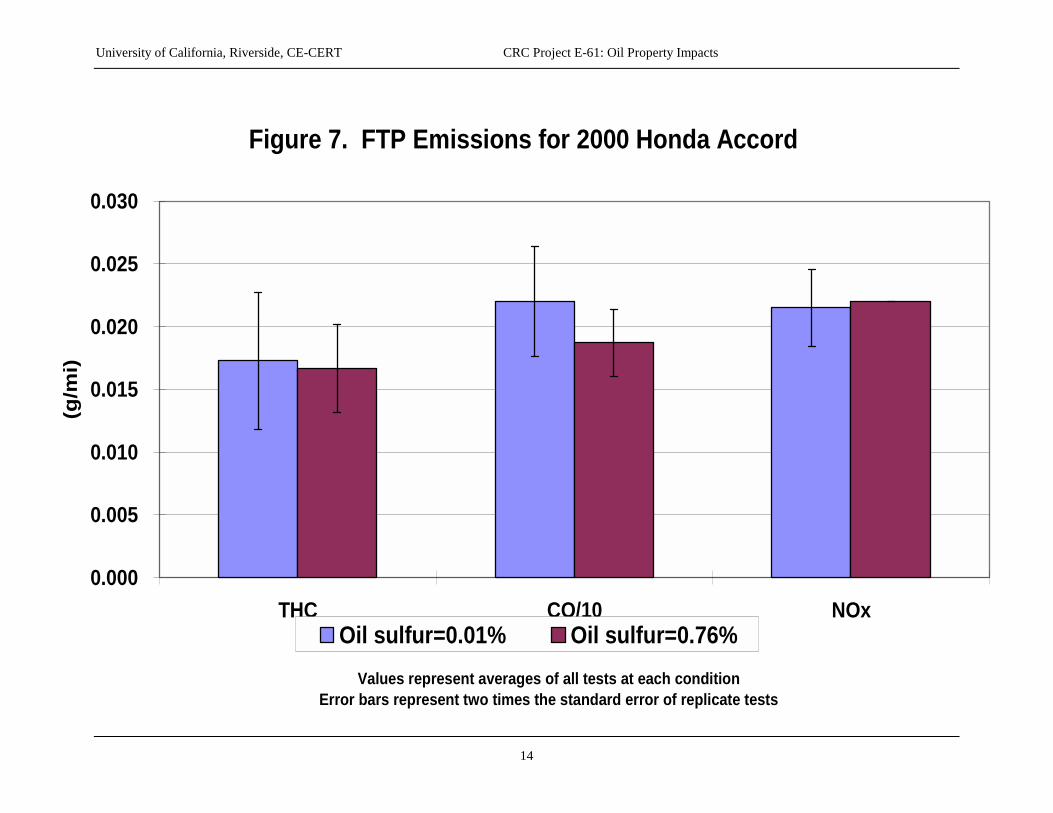
3. Results 3.1 FTP Results The FTP weighted results for each of the test vehicles are presented in Figures 4-9. These figures include THC, CO, and NOx for each of the oils tested on each vehicle. The error bars are presented in the figures as two times the standard error for the replicate tests. More complete test results are provided in Appendix E. The vehicles presented in Figures 4-8 showed very little differences between tests conducted on the lowest- and highest-sulfur oil, and hence were not tested on any further oil sulfur levels. For each of these vehicles, average THC and NOx emissions differed by not more than 2 mg/mi and 4 mg/mi, respectively, for the different oils. The differences for the CO emissions were slightly larger between the oils but were generally within the expected variability of repeated test runs and did not show consistent trends of having higher emissions on the higher-sulfur oil. Analyses were conducted to evaluate the statistical significance of any observed emissions differences between the fuels. These results are presented in Table 4 for the 5 vehicles tested on only the highest and lowest-sulfur oils. These data analyses were all conducted using a one-sided t-test. Over this set of vehicles, essentially no statistically significant differences were observed between different vehicles, consistent with the small differences observed between emissions for the two oil sulfur levels. Table 4. Test of Statistical Significance for Regulated Pollutants between the Lowest- and Highest-Sulfur Oils for the FTP.
Oil sulfur
(ppmw)
THC g/mi
P-value THC
difference
CO g/mi
P-value CO
difference
NOx g/mi
P-value NOx
differenceFord Windstar 0.01% 0.028 0.367 0.036 0.76% 0.028 0.584 0.357 0.681 0.035 0.557 Toyota Camry 0.01% 0.036 0.380 0.061 0.76% 0.037 0.431 0.412 0.333 0.057 0.973 Dodge Neon 0.01% 0.061 0.740 0.011 0.76% 0.059 0.603 0.698 0.684 0.014 0.212 Honda Accord 0.01% 0.017 0.220 0.022 0.76% 0.017 0.570 0.187 0.877 0.022 0.381 Nissan Sentra 0.01% 0.009 0.211 0.007 0.76% 0.010 0.270 0.202 0.600 0.006 0.666
Of the vehicles tested for the E-61 program, only the Buick LeSabre (Figure 9) demonstrated emissions differences worth further investigating with the remaining oils in the sequence. In particular, with the exclusion of one test for low-sulfur oil that was an outlier by more than 5 times the standard deviation of the mean, a statistically significant difference (p=0.003) of approximately 12 mg/mi was observed between the NOx emissions obtained with the lower- and

University of California, Riverside, CE-CERT CRC Project E-61: Oil Property Impacts
11
Figure 4. FTP Emissions for 2001 Ford Windstar
0.00
0.01
0.02
0.03
0.04
0.05
THC CO/10 NOx
Values represent averages of all tests at each conditionError bars represent two times the standard error of replicate tests
(g/m
i)
Oil sulfur=0.01% Oil sulfur=0.76%
University of California, Riverside, CE-CERT CRC Project E-61: Oil Property Impacts
12
Figure 5. FTP Emissions for 2001 Toyota Camry
0.00
0.01
0.02
0.03
0.04
0.05
0.06
0.07
THC CO/10 NOx
Values represent averages of all tests at each condition Error bars represent two times the standard error of replicate tests
(g/m
i)
Oil sulfur=0.01% Oil sulfur=0.76%

University of California, Riverside, CE-CERT CRC Project E-61: Oil Property Impacts
13
Figure 6. FTP Emissions for 2001 Dodge Neon
0.00
0.01
0.02
0.03
0.04
0.05
0.06
0.07
0.08
0.09
THC CO/10 NOx
Values represent averages of all tests at each condition Error bars represent two times the standard error of replicate tests
(g/m
i)
Oil sulfur=0.01% Oil sulfur=0.76%
University of California, Riverside, CE-CERT CRC Project E-61: Oil Property Impacts
14
Figure 7. FTP Emissions for 2000 Honda Accord
0.000
0.005
0.010
0.015
0.020
0.025
0.030
THC CO/10 NOx
Values represent averages of all tests at each condition Error bars represent two times the standard error of replicate tests
(g/m
i)
Oil sulfur=0.01% Oil sulfur=0.76%

University of California, Riverside, CE-CERT CRC Project E-61: Oil Property Impacts
15
Figure 8. FTP Emissions for 2001 Nissan Sentra
0.000
0.005
0.010
0.015
0.020
0.025
0.030
THC CO/10 NOx
Values represent averages of all tests at each condition Error bars represent two times the standard error of replicate tests
(g/m
i)
Oil sulfur=0.01% Oil sulfur=0.76%

University of California, Riverside, CE-CERT CRC Project E-61: Oil Property Impacts
16
Figure 9. FTP Emissions for 2001 Buick LeSabre
0.00
0.01
0.02
0.03
0.04
0.05
0.06
0.07
0.08
0.09
THC CO/10 NOx
Values are averages of all tests at condition (excluding NOx outlier on run 1 0.01% S oil) Error bars represent two times the standard error of replicate tests
(g/m
i)
Oil sulfur=0.01% (Run 1) - no NOx outlier Oil sulfur=0.01% (Run 2)Oil sulfur=0.16% Oil sulfur=0.29%Oil sulfur=0.28% Oil sulfur=0.52%Oil sulfur=0.76%

University of California, Riverside, CE-CERT CRC Project E-61: Oil Property Impacts
17
higher-sulfur oils. The lower NOx emissions for the low-sulfur oil were also consistent over the 2 runs performed on the low-sulfur oil. While lower NOx emissions did appear for the lowest-sulfur oil, in examining the remaining oils it can be seen that no further trends were observed on oils varying from 0.16% to 0.76% in oil sulfur content. In examining the other emissions for the Buick LeSabre, THC emissions were generally within the experimental variability while larger emission differences were observed for CO between the different oil sulfur runs. While differences between CO emissions from run to run were observed, these differences did not show a trend of increasing emissions with increasing oil sulfur level. The run-to-run differences in CO are most likely a measure of the variability of the test vehicle over different runs. It is possible that variability in the vehicle operation from run to run may have also contributed to the observed NOx differences. The results of statistical comparisons for different oil sulfur levels using a one-sided t-test are provided in Table 5 for the Buick LeSabre. In each case, the provided p-values are for comparisons with the lowest-sulfur oil. The statistical analyses show significant differences for NOx emissions. A statistically significant difference was also observed for THC for the 0.28% oil in comparison with the baseline oil. Again, this probably could be attributed to run to run variability rather than differences in the oil sulfur level. In this regard, it is worth noting that the highest THC, CO, and NOx emissions were also obtained for the 0.28% oil. For all these exhaust components, there was no significant trend with respect to lubricant sulfur levels. Table 5. Statistical Significance of Emissions Differences for the Buick LeSabre for the FTP.
Oil
sulfur (ppm)
THC g/mi
P-value THC
difference
CO g/mi
P-value CO
difference
NOx g/mi
P-value* NOx
differenceBuick LeSabre 0.01% 0.039 0.650 0.050* 0.16% 0.042 0.179 0.501 0.984 0.062 0.001 0.29% 0.039 0.595 0.542 0.959 0.061 0.014 0.28% 0.047 0.012 0.682 0.316 0.067 0.007 0.52% 0.041 0.331 0.583 0.897 0.063 0.001 0.76% 0.040 0.395 0.667 0.368 0.062 0.003 Note: the 0.01% oil sulfur results combine the results from two separate test runs Bold values are statistically significant to at least the 90% confidence level *excludes outlier test [I0110029] for the initial run on low-sulfur oil
Statistical analyses of the individual bags were also carried out; the complete results are presented in Appendix F. The results for average bag 2 emissions and the corresponding statistical analyses are presented in Table 6, since previous studies have shown that the effects of sulfur on the catalyst can be stronger during this portion of the FTP [1-3,6]. In general, bag 2 emissions were relatively low over the test fleet and for most vehicle/pollutant combinations no statistically significant oil sulfur effects were found. For the Buick LeSabre, THC bag 2 emissions showed some statistically significant differences between runs conducted at different sulfur levels, but these differences did not indicate any apparent trends with respect to oil sulfur beyond the lowest-sulfur oil. CO bag 2 emissions also showed differences between runs on different sulfur oils, but showed no consistent trend related to the oil sulfur level. Interestingly,

University of California, Riverside, CE-CERT CRC Project E-61: Oil Property Impacts
18
the bag 2 NOx emission results for the Buick LeSabre, in contrast with the FTP weighted results, did not show a strong trend of lower NOx emissions on the lowest-sulfur oil. Statistical analyses of bags 1 and 3 showed similar results, as shown in Appendix F.
Table 6. Test of Statistical Significance for Regulated Pollutants for FTP Bag 2.
Oil sulfur
(ppmw)
THC g/mi
P-value THC
difference
CO g/mi
P-value CO
difference
NOx g/mi
P-value NOx
differenceBuick LeSabre 0.01% 0.008 0.038 0.002* 0.16% 0.011 0.022 0.027 0.919 0.003 0.178 0.29% 0.014 0.001 0.025 0.959 0.003 0.258 0.28% 0.011 0.022 0.029 0.882 0.004 0.055 0.52% 0.013 0.005 0.024 0.981 0.003 0.168 0.76% 0.014 0.034 0.058 0.013 0.001 0.708 Ford Windstar 0.01% 0.003 0.091 0.000 0.76% 0.004 0.039 0.074 0.980 0.001 0.031 Toyota Camry 0.01% 0.006 0.022 0.010 0.76% 0.005 0.597 0.014 0.987 0.011 0.174 Dodge Neon 0.01% 0.004 0.047 0.001 0.76% 0.003 0.719 0.051 0.429 0.003 0.029 Honda Accord 0.01% 0.003 0.208 0.000 0.76% 0.004 0.039 0.210 0.455 0.000 - Nissan Sentra 0.01% 0.002 0.051 0.000 0.76% 0.003 0.187 0.044 0.842 0.000 -
Bold values are statistically significant to at least the 90% confidence level *excludes outlier test [I0110029] for the initial run on low-sulfur oil To better understand the results obtained for the regulated pollutants in the context of fuel and lubricant sulfur effects, it is important to understand the contribution of the oil sulfur to the exhaust stream. The results of the engine-out DOAS SO2 measurements are presented in Figure 10 for each of the test vehicles. In contrast to the regulated pollutants, engine-out SO2 emissions showed significant differences for the different oils indicating measurable effects from the contribution of the oil sulfur. For each vehicle, the DOAS was capable of differentiating between the oil sulfur contribution for the lowest- and highest-sulfur oils. The SO2 emissions for the lowest-sulfur oil were essentially at or below the detection limits for each of the test vehicles. For the Buick LeSabre, the DOAS was also capable of differentiating between the intermediate sulfur oils and the highest and lowest-sulfur oils, although the 0.52% oil was slightly higher than that for the 0.76% oil. For the Buick, SO2 emissions for both the 0.01 and 0.16% oils were below the detection limit of 0.239 mg/mi for this vehicle. Some differences also were observed among the SO2 emission rates of different vehicles, with the larger displacement Ford Windstar and Buick LeSabre having slightly higher SO2 emission rates compared to other vehicles.

University of California, Riverside, CE-CERT CRC Project E-61: Oil Property Impacts
19
Figure 10. FTP SO2 Emissions
-0.1
0.3
0.7
1.1
1.5
2001 BuickLeSabre
2001 FordWindstar
2001 ToyotaCamry
2000 HondaAccord
2001 NissanSentra
2001 DodgeNeon
Values represent averages of all tests at each conditionError bars represent two times the standard error of replicate tests
(mg/
mi)
Oil sulfur=0.01% Oil sulfur=0.16% Oil sulfur=0.29%Oil sulfur=0.28% Oil sulfur=0.52% Oil sulfur=0.76%
2.7 ppm fuel sulfurequivalent 2.2 ppm
fuel sulfurequivalent
0.8 ppm fuel sulfurequivalent
0.9 ppm fuel sulfurequivalent
2.6 ppm fuel sulfurequivalent
3.0 ppm fuel sulfur0.76% oil
4.2 ppm fuel sulfur0.52% oil

University of California, Riverside, CE-CERT CRC Project E-61: Oil Property Impacts
20
A one-sided t-test was conducted to evaluate the statistical significance of the differences observed in SO2 emissions for different test oils. The results of these analyses are presented in Table 7. The statistical analyses indicated that the measured SO2 emissions differences between the highest- and lowest-sulfur oils were statistically significant for all vehicles. The differences between the lowest- and highest-sulfur oils for the Dodge Neon and Honda Accord were statistically significant at the 90% confidence level, while these differences for the other vehicles were statistically significant at the 95% confidence level. For the Buick LeSabre, statistically significant differences in SO2 emissions also were found between the lowest sulfur oil and oils with sulfur levels of 0.29%, 0.28%, and 0.52%. The SO2 emissions for the 0.01% and 0.16% oils for the Buick LeSabre were the only not statistically significant differences, as both measurements were at the detection limit of the instrument.
Table 7. Test of Statistical Significance for SO2 Emissions for the FTP.
Oil sulfur
(ppmw)
SO2 mg/mi
P-value SO2
differenceBuick LeSabre 0.01% 0.144 0.16% 0.156 0.462 0.29% 0.496 0.023 0.28% 0.494 0.010 0.52% 1.165 <0.0001 0.76% 0.854 0.002 Ford Windstar 0.01% 0.008 <0.0001 0.76% 0.868 Toyota Camry 0.01% 0.052 0.005 0.76% 0.541 Dodge Neon 0.01% 0.004 0.092 0.76% 0.225 Honda Accord 0.01% 0.085 0.078 0.76% 0.220 Nissan Sentra 0.01% 0.031 0.004 0.76% 0.578
Bold values are statistically significant to at least the 90% confidence level To provide a context for the evaluation of the SO2 emissions, the SO2 oil emission levels are presented on an equivalent fuel sulfur level basis in Figure 10 for the higher oil sulfur levels. The equivalent fuel sulfur is the amount of sulfur in the fuel that would produce SO2 emissions equivalent to those produced by the sulfur from the oil. The equivalent fuel sulfur ppm levels were calculated based on the fuel economy obtained during the tests on each vehicle. These calculations are shown in more detail in Appendix G. The fuel sulfur equivalent values provided in Figure 10 also account for the contribution from the 0.2 ppm base fuel (0.04-0.06 mg/mi), and as such represent the contribution from the oil sulfur only. In general, the oil sulfur contribution ranged between approximately 1 and 4 ppm fuel sulfur equivalent for the highest-sulfur oils over the FTP.

University of California, Riverside, CE-CERT CRC Project E-61: Oil Property Impacts
21
3.2 Steady-State Idle and 50 mph Cruise Results The steady-state idle and 50 mph cruise results for each of the test vehicles are presented in Tables 8 and 9, respectively. These tables include the mean values on each vehicle/oil combination and the p-values indicating the statistical significance of the differences in emissions for each oil compared with the base low-sulfur oil. Complete test results for the idle and 50 mph cruise testing are provided in Appendix H. The idle results shown in Table 8 indicate that the idle emissions were relatively low for nearly all vehicle/oil combinations. Overall, the data also indicate that oil sulfur level had minimal impact on the emissions for the different vehicle/oil combinations, consistent with the FTP results. In some cases, differences were observed between different oils for the same test vehicle. These differences probably can be attributed to differences in the operation of the vehicle over the course of the different test runs rather than an oil sulfur effect. The Buick LeSabre, for example, had higher THC and lower CO emissions for the 0.01% and 0.76% sulfur oils, in comparison with the tests run on the 0.16% to 0.52% oils. This probably can be attributed to subtle differences in running the idle tests as a 4th bag immediately following the FTP (oils 0.16% to 0.52%) and as a separate test (0.01% and 0.76%). The Toyota Camry exhibited higher THC, CO, and NOx emissions for the lowest-sulfur oil in comparison with the higher-sulfur oil that could also be attributed to the different testing sequence. The Ford Windstar also showed higher emissions of THC, CO, and NOx for the lower-sulfur oil in comparison with the higher-sulfur oil. This is most likely due to run-to-run variability.
Table 8. Test of Statistical Significance for Regulated Pollutants for Idle Tests.
Oil sulfur
(ppmw)
THC g/min.
P-value THC
difference
CO g/min.
P-value CO
difference
NOx g/min,
P-value NOx
differenceBuick LeSabre 0.01% 0.008 0.004 0.000 0.16% 0.003 0.932 0.021 0.060 0.000 - 0.29% 0.001 0.975 0.016 0.005 0.000 - 0.28% 0.002 0.970 0.015 0.040 0.000 - 0.52% 0.002 0.986 0.016 0.003 0.000 - 0.76% 0.007 0.562 0.002 0.761 0.001 0.106 Ford Windstar 0.01% 0.057 0.039 0.001 0.76% 0.042 >0.9999 0.036 0.691 0.000 0.878 Toyota Camry 0.01% 0.011 0.004 0.006 0.76% 0.001 0.992 0.001 0.955 0.002 0.740 Dodge Neon 0.01% 0.001 0.011 0.002 0.76% 0.001 - 0.005 0791 0.000 0.812 Honda Accord 0.01% 0.002 0.003 0.005 0.76% 0.003 0.062 0.001 0.895 0.005 - Nissan Sentra 0.01% 0.000 0.001 0.000 0.76% 0.000 - 0.001 - 0.000 -
Bold values are statistically significant to at least the 90% confidence level “-” = mean difference is zero and not statistically significant

University of California, Riverside, CE-CERT CRC Project E-61: Oil Property Impacts
22
The trends for the 50 mph cruise tests are similar to those observed for the idle tests, i.e., relatively low emissions with no consistent oil sulfur effect. Although some of the THC emission differences were statistically significant, these were all on the order of 0.003 g/mi or less and did not show any trends attributable to oil sulfur level differences. Similarly to the idle tests, some vehicles demonstrated slightly higher emissions on the lower-sulfur oil compared with the higher-sulfur oil, including the CO emissions for the Honda Accord and Dodge Neon. Again, this probably can be attributed to subtle differences in vehicle operation between the two test runs. For the Toyota Camry, some differences in the test methodology also may have resulted in lower emissions for the higher sulfur oil. With regard to the steady-state emissions results, it is also interesting to note that the highest CO emissions were observed for the two SULEV certified vehicles. Table 9. Test of Statistical Significance for Regulated Pollutants for 50 mph Cruise Tests.
Oil sulfur
(ppmw)
THC g/mi
P-value THC
difference
CO g/mi
P-value CO
difference
NOx g/mi
P-value NOx
differenceBuick LeSabre 0.01% 0.001 0.009 0.000 0.16% 0.002 0.0005 0.002 0.999 0.001 0.007 0.29% 0.003 0.0008 0.006 0.964 0.000 - 0.28% 0.002 0.0047 0.005 0.997 0.000 - 0.52% 0.003 0.0002 0.005 0.996 0.001 0.022 0.76% 0.004 <0.0001 0.009 - 0.000 - Ford Windstar 0.01% 0.001 0.016 0.007 0.76% 0.001 - 0.012 0.993 0.010 0.002 Toyota Camry 0.01% 0.002 0.014 0.011 0.76% 0.001 0.998 0.010 0.989 0.004 0.985 Dodge Neon 0.01% 0.001 0.053 0.028 0.76% 0.001 - 0.019 0.762 0.028 0.519 Honda Accord 0.01% 0.001 0.136 0.000 0.76% 0.001 - 0.103 0.994 0.000 - Nissan Sentra 0.01% 0.001 0.118 0.000 0.76% 0.001 - 0.119 0.483 0.000 -
Bold values are statistically significant to at least the 90% confidence level “-” = mean difference is zero and not statistically significant Similarly to the FTP, SO2 emissions for the idle and 50 mph cycles showed generally measurable and significant differences between the high-, low- and intermediate-oils. Average SO2 emissions for the idle and steady-state cycles are presented in Table 10. These results show that statistically significant differences between the lowest- and highest-sulfur oils were observed for nearly all vehicle/fuel combinations. For the Buick LeSabre, the SO2 emissions showed trends consistent with the oil sulfur content for both the idle and steady-state tests. On an equivalent fuel sulfur level basis, the vehicles showed oil sulfur emissions ranging from approximately 0.4 to 5.8 ppm for the highest-sulfur oil for the idle cycle. The Ford Windstar and

University of California, Riverside, CE-CERT CRC Project E-61: Oil Property Impacts
23
Buick LeSabre had the highest SO2 emission rates during representing a fuel sulfur equivalent of about 5.8 ppm. The Honda and Dodge each had idle SO2 emissions that were near the average detection limits of 0.016 mg/min. and fuel sulfur equivalent values of less than 1 ppm. The Nissan Sentra and Toyota Camry were only slightly above the SO2 detection limits for the idle cycle with equivalent fuel sulfur emissions between 1.5 and 2.1 ppm. The trends in SO2 emissions from vehicle to vehicle were similar to those observed over the FTP. For the 50 mph cruise cycle, SO2 emissions on a fuel sulfur equivalent ranged from approximately 0.0 to 4.2 ppm. The vehicles showed similar trends to those observed over the idle cycle. The Ford Windstar and Buick LeSabre had the highest SO2 emissions rates representing a fuel sulfur equivalent of about 3.4 to 4.2 ppm. The SO2 emissions for the Honda and Dodge were again near the average detection limits of the instrument of 0.038 mg/mi over the steady-state 50 mph cycle. The Toyota and Nissan exhibited SO2 oil sulfur emissions consistent with about 1.3 to 1.5 ppm fuel sulfur equivalent.
Table 10. Test of Statistical Significance for SO2 Emissions for Idle and 50 mph Cruise Tests.
Idle 50 mph Oil
sulfur (ppmw)
SO2 mg/min.
P-value SO2
difference
SO2 mg/mi
P-value SO2
difference Buick LeSabre 0.01% -0.009 -0.023 0.16% 0.019 0.037 0.027 0.108 0.29% 0.076 0.002 0.153 0.008 0.28% 0.084 0.0004 0.189 0.003 0.52% 0.169 <0.0001 0.314 0.0005 0.76% 0.229 0.0002 0.577 0.001 Ford Windstar 0.01% 0.019 0.036 0.76% 0.222 0.003 0.622 <0.0001 Toyota Camry 0.01% 0.018 0.062 0.76% 0.053 0.056 0.210 0.022 Dodge Neon 0.01% -0.001 -0.004 0.76% 0.023 0.116 0.107 0.112 Honda Accord 0.01% 0.002 0.041 0.76% 0.015 0.074 0.024 0.675 Nissan Sentra 0.01% -0.002 0.001 0.76% 0.056 0.002 0.189 0.003
The trend in SO2 emissions over the range of oil sulfur levels was examined for the Buick LeSabre for each of the three test cycles (FTP, idle, and 50 mph cruise). The results are plotted in Figure 11. For this figure, the idle and 50 mph cruise SO2 emissions were multiplied by 5 and 2.5, respectively, to make the results from each test cycle more comparable in the figure. Overall, the SO2 emissions levels show a relatively consistent linear trend of increasing

University of California, Riverside, CE-CERT CRC Project E-61: Oil Property Impacts
24
Figure 11. SO2 Emissions for Buick LeSabre
-0.5
0.0
0.5
1.0
1.5
2.0
0.00% 0.10% 0.20% 0.30% 0.40% 0.50% 0.60% 0.70% 0.80%
Oil Sulfur Content (ppmw)
SO
2 E
mis
sio
ns (m
g/m
i;idl
e m
g/m
in)
FTP SO2 Emissions
Idle SO2 Emissions x 5
Steady State SO2 Emissions x 2.5
Values represent averages of all tests at each conditionError bars represent two times the standard error of replicate tests

University of California, Riverside, CE-CERT CRC Project E-61: Oil Property Impacts
25
emissions with increasing oil sulfur levels over the idle and 50 mph cruise cycles. The SO2 emissions for the FTP also show a general trend of higher SO2 emissions with increasing oil sulfur levels although there is greater divergence from the linear trend line.

University of California, Riverside, CE-CERT CRC Project E-61: Oil Property Impacts
26
4. Summary and Conclusions The properties of engine oil and their effect on emission control systems are of great interest as emissions standards are reduced. For this study, the emissions impact of the sulfur level in the lubricant was evaluated for 4 ULEV and 2 SULEV vehicles using oils with sulfur contents ranging from 0.01% to 0.76% and a gasoline with a 0.2 ppmw sulfur content. Vehicles were configured with aged catalysts and tested in triplicate over the FTP and at steady-state idle and 50 mph cruise conditions. In addition to the regulated emissions and modal engine-out and tailpipe emissions, engine-out SO2 was measured using a novel approach with a differential optical absorption spectrometer (DOAS). The major results of this study are:
• A novel instrument was designed and built to measure engine-out SO2 emissions. This instrument measured SO2 emissions with a detection limit of approximately 0.100 mg/mi over the FTP and a noise level of 30 ppbv at one standard deviation. The instrument measured the differences in SO2 emissions between the highest-, intermediate-, and lowest-sulfur oils over the range of test conditions in the program.
• The contribution of SO2 emissions for the highest-sulfur oils ranged from less than 1 to 6 ppm on a fuel sulfur equivalent basis over the range of vehicles and test cycles used in the program. The highest SO2 emissions were observed for the two vehicles with the largest displacement engines.
• Over the FTP, THC, CO, and NOx emissions were not affected by variation in sulfur levels in the lubricant between 0.01% and 0.76%. Observed differences between regulated emissions for test runs with different oil sulfur levels were generally within the experimental variability.
• For one of the test vehicles, differences were found between NOx emissions on the lowest- and highest-sulfur oil. Subsequent tests on oils ranging in sulfur content from 0.16% to 0.52% showed NOx emissions were not correlated to oil sulfur level.
• Tests conducted under idle and 50 mph cruise conditions showed, similarly to the FTP, that variation in oil sulfur levels between 0.01% and 0.76% had minimal impact on the emissions of regulated emissions. Under these conditions, emissions were lower than the FTP emissions, and for some cases were near the measurement limits.

University of California, Riverside, CE-CERT CRC Project E-61: Oil Property Impacts
27
5. Acknowledgments The authors acknowledge the contribution and support of the following individuals during the course of this project. Dave Martis, Joseph Calhoun, Ross Rettig, Joe Gil, and Joe Valdez of the Vehicle Emissions Research Laboratory (CE-CERT) performed the emissions testing on the vehicles. We thank John Robbins and Heather Gamble of Unisearch for the development of the DOAS instrument. We thank Honda R&D Americas, Inc., for providing two test vehicles for this program. We thank the Coordinating Research Council for its financial support of this program under project E-61.

University of California, Riverside, CE-CERT CRC Project E-61: Oil Property Impacts
28
6. References
1. Benson, J.D.; Burns, V.; Gorse, R.A.; Hochhauser, A.M.; Koehl, W.J.; Painter, L.J.; and Reuter, R.M. (1991) Effects of Gasoline Sulfur Level on Mass Exhaust Emissions – Auto/Oil Air Quality Improvement Research Program. SAE Paper 912323. Society of Automotive Engineers, Warrendale, PA.
2. Koehl, W.J.; Gorse, R.A. Jr.; Knepper, J.C.; Rapp, L.A.; Benson, J.D.; Hochhauser, A.M.;
Leppard, W.R.; Reuter, R.M.; Burns, V.R.; Painter, L.J.; and Rutherford, J.A. (1993) Effects of Gasoline Sulfur Level on Exhaust Mass and Speciated Emissions: The Question of Linearity-Auto/Oil Air Quality Improvement Program, SAE Paper No. 932727. Society of Automotive Engineers, Warrendale, PA.
3. Leppard, W.R.; Burns, V.R.; Painter, L.J.; Reuter, R.M.; Koehl, W.J.; Hochhauser, A.M.;
Rapp, L.A.; Rutherford, J.A.; Benson, J.D.; Knepper, J.C.; and Ribbon, B.H. (1995) Effects of Gasoline Properties (T50, T90, and Sulfur) on Exhaust Hydrocarbon Emissions of Current and Future Vehicles: Modal Analysis – The Auto/Oil Air Quality Improvement Research Program. SAE Paper No. 952504. Society of Automotive Engineers, Warrendale, PA.
4. Leppard, W.R.; Burns, V.R.; Painter, L.J.; Reuter, R.M.; Koehl, W.J.; Hochhauser, A.M.;
Rapp, L.A.; Rutherford, J.A.; Benson, J.D.; Knepper, J.C.; and Ribbon, B.H. (1995) Effects of Gasoline Properties (T50, T90, and Sulfur) on Exhaust Hydrocarbon Emissions of Current and Future Vehicles: Speciation Analysis – The Auto/Oil Air Quality Improvement Research Program. SAE Paper No. 952505. Society of Automotive Engineers, Warrendale, PA.
5. Rutherford, J.A.; Burns, V.R.; Leppard, W.R.; Ribbon, B.H.; Koehl, W.J.; Hochhauser,
A.M.; Painter, L.J.; Reuter, R.M.; Benson, J.D.; Knepper, J.C.; and Rapp, L.A. (1995) Effects of Gasoline Properties on Emissions of Current and Future Vehicles –T50, T90, and Sulfur– The Auto/Oil Air Quality Improvement Research Program. SAE Paper No. 952510. Society of Automotive Engineers, Warrendale, PA.
6. AAMA/AIAM (1997) AAMA/AIAM Study on the Effects of Fuel Sulfur on Low Emission Vehicle Criteria Pollutants. Report by the American Automobile Manufacturers Association (AAMA) and the Association of International Automobile Manufacturers (AIAM), December.
7. Schleyer, C.H.; Gunst, R.F.; Eckstrom, J.; Freel, J.; Gorse, R.A.; Barnes, G.J.; Eng, K.D.;
Natarajan, M.; and Schlenker, A.M. (1998) Effect of Fuel Sulfur on Emissions in California Low Emission Vehicles. SAE Paper No. 982726. Society of Automotive Engineers, Warrendale, PA.
8. AAM/AIAM (2001) Industry Low-Sulfur Test Program. Presented to the California Air
Resources Board by the Alliance of Automobile Manufacturers (AAM) and the Association

University of California, Riverside, CE-CERT CRC Project E-61: Oil Property Impacts
29
of International Automobile Manufacturers (AIAM), ww.arb.ca.gov/cbg/meeting/2001/mtg2001.htm, September.
9. Mayotte, S.G., et al. (1994) Reformulated Gasoline Effects on Exhaust Emissions: Phase 1;
Initial Investigation of Oxygenate, Volatility, Distillation, and Sulfur Effects. SAE Paper No. 941973. Society of Automotive Engineers, Warrendale, PA.
10. Mayotte, S.G., et al. (1994) Reformulated Gasoline Effects on Exhaust Emissions: Phase II;
Continued Investigation of Oxygenate Content, Oxygenate Type, Sulfur Olefins, and Distillation Parameters. SAE Paper No. 941974. Society of Automotive Engineers, Warrendale, PA.
11. Korotney, D.J.; Rao, V.; Lindhjem, C.E.; and Sklar, M.S. (1995) Reformulated Gasoline
Effects on Exhaust Emissions: Phase III; Investigation on the Effects of Sulfur Olefins, Volatility, and Aromatics and the Interactions Between Olefins and Volatility or Sulfur. SAE Paper No. 950782. Society of Automotive Engineers, Warrendale, PA.
12. Lindhjem, C.E. (1995) The Effect of Gasoline Reformulation and Sulfur Reduction on
Exhaust Emissions from Post-1983 but Pre-1990. SAE Paper No. 950778. Society of Automotive Engineers, Warrendale, PA.
13. Sztenderowicz, M.L.; Bandy, W.J.; Most, W.J.; Jetter, S.; Sprik, T.L.; Doherty, H.; and
Eng, K.D. (1995) Effects of Fuel Sulfur on Emissions from Transitional Low Emission Vehicles. SAE Paper No. 952561. Society of Automotive Engineers, Warrendale, PA.
14. Palmer, F.; et al. (1995) Outcome of the European Programme on Emissions, Fuels, and
Engine Technologies (EPEFE). SAE Paper No. SP-1024. Society of Automotive Engineers, Warrendale, PA.
15. ASTM Oil Protection of Emissions Systems Test (OPEST II) Task Force.
16. Sims, G.S. and Johri, S. (1988) SAE Technical Paper 881589. Society of Automotive Engineers, Warrendale, PA.
17. Shoffner, B. (2001) A Vehicle Fuel Tank Flush Effectiveness Evaluation Program. Final
Report by the Southwest Research Institute, San Antonio, TX, for the Coordinating Research Council under contract no. CM-138-01/1, August.
18. Hanaoka, M., et al. (1979) New Method for Measurement of Engine Oil Consumption (S-
Tracer Method) SAE Technical Paper 790936. Society of Automotive Engineers, Warrendale, PA.
19. Maeda, Y., et al. (1986) Investigation of the Transient Oil Consumption of Engine by the
Newly Developed Oil Consumption Meter. SAE Technical Paper 860544, Society of Automotive Engineers, Warrendale, PA.

University of California, Riverside, CE-CERT CRC Project E-61: Oil Property Impacts
30
20. Lizumi, S., and Koyama, T. (1986) Measurement of Oil Consumption of Diesel Engine by S-Trace Method. SAE Technical Paper 860545, Society of Automotive Engineers, Warrendale, PA.
21. Butler, J.W.; Korniski, T.J.; Colvin, A.D.; and Jary, E.H. (1988) Real-time Oil
Consumption. Automotive Engineering vol. 96, p. 57. 22. Bailey, B.K., and Ariga, S. (1990) On-Line Diesel Oil Consumption Measurement. SAE
Technical Paper 902113. Society of Automotive Engineers, Warrendale, PA. 23. Bailey, B.K., and Ariga, S. (1992) On-Line Oil Consumption Measurement and
Characterization of an Automotive Gasoline Engine by SO2 Method. SAE Technical Paper 920652. Society of Automotive Engineers, Warrendale, PA.
24. Ingalls, M.N., and Springer, K.J. (1976) Measurement of Sulfate and Sulfur Dioxide in
Automotive Exhaust. Final report prepared by the Southwest Research Institute, San Antonio, TX, for the U.S. Environmental Protection Agency, EPA report no. EPA-460/3-76-015.
25. Watson, J.C.; Chow, J.C.; Lowenthal, D.H.; Pritchett, L.C.; and Frazier, C.A. (1994)
Differences in the Carbon Composition of Source Profiles for Diesel- and Gasoline-Powered Vehicles. Atmospheric Environment, vol. 28, p. 2493-2505.
26. Graham, L. (1999) Gaseous and Particulate Matter Emissions from In-Use Light-Duty
Gasoline Motor Vehicles. Report no. 99-67. Environment Canada, Ottawa, Ontario, Canada.
27. Barth, M.; An, F.; Younglove, T.; Scora, G.; Levine, C.; Ross, M.; and Wenzel, T. (2000)
Development of a Comprehensive Modal Emissions Model. Final Report by the University of California’s College of Engineering-Center for Environmental Research and Technology, Riverside, CA for the National Cooperative Highway Research Program under contract NCHRP 25-11.

University of California, Riverside, CE-CERT CRC Project E-61: Oil Property Impacts
31
Appendix A. Detailed Analyses of the Test Oil Properties.
Oil Number 1 2 3 4 5 6
Base PAO Group I PAO Group I PAO Group I
Oil Identification Number OS163792 OS163793 OS163794 OS163567AOS163566AOS163568A
#1270 B
CALCIUM 0.172 0.1623 0.1989 0.2029 0.193 0.1912
PHOSPHORUS 0.1003 0.2077 0.051 0.0952
SULFUR 0.0144 0.2916 0.2796 0.7643 0.1628 0.5211
ZINC 0.112 0.228 0.0564 0.1069
D2270
VISC AT 40`C
VISC@40 66.91 62.825 64.682 65.824 63.837 60.575
VISC AT 100`C
VISC@100 11.16 10.652 10.767 11.01 10.656 10.143
CALC VISC INDEX
VI 160 160 157 160 157 155
D4683
DETERMINE DYNAMIC VISCOSITY
VISC DYN 3.2 2.98 3.12 3.06 3.12 2.88
D5293
DYNAMIC VISCOSITY OF SAMPLE - CPS
TEMPERATURE (test #1) -25 -25 -25 -25 -25 -25
(test #2) -30 -30 -30 -30 -30 -30
VISC APPARENT (test #1) 2550 2977 2632 3056 2576 2810
(test #2) 4260 5813 4320 5969 4201 5960
D5800
DETERMINE VOLATILITY
EVAP LOSS % 5.5 22.1 6.3 23 5.9 21.8

University of California, Riverside, CE-CERT CRC Project E-61: Oil Property Impacts
32
Appendix B. Description of Catalyst Aging. Catalyst aging was conducted on catalytic systems (including pre- and post oxygen sensors) for the 14 test vehicles associated with the E-60 and E-61 projects. This includes 2 European vehicles to be tested under the E-60 program. In total, 8 catalyst pairs were aged for a period of 90 hours (generic 120K miles) using the RAT-A cycle. The aging was conducted using a synthetic low-sulfur oil and a California Phase 2 gasoline with a 1 ppm sulfur level. Catalyst aging was conducted at the Southwest Research Institute (SwRI). Table B-1 describes the RAT-A aging cycle. The general steps used in the catalyst aging process are provided below.
Table B-1. RAT-A Aging Protocol. Step Description
1 Duration=40 seconds. Stoichiometric, closed loop exhaust conditions (A/F=14.3). Catalyst inlet temperature ~ 800°C.
2 Duration= 6 seconds. Open loop, fuel injector pulse width same as used in Step 3.
3 Duration= 10 seconds. Open loop, fuel injection pulse width increased from Step 1 to achieve 2.9 percent CO at catalyst inlet with secondary air source supplying additional air to achieve an oxygen concentration of 3.0 percent at the catalyst inlet. Typical catalyst bed temperature= 975 - 1020°C (catalyst bed temperature measured one inch downstream of catalyst front face).
4 Duration= 4 seconds. Fuel control returned to closed-loop (stoichiometric conditions). Air injection from Step 3 continues for duration (air injection point is located downstream of oxygen sensor used to control the engine).
Step Description 1 CE-CERT provided SwRI with 8 sets of catalyst systems to age (i.e, 8 pair of catalysts).
Each catalyst was fabricated to make inlet and outlet inline, with 2.5" marmon flanges on inlet and outlet.
2 SwRI installed thermocouples in the first catalyst substrate, and installed on test stand (no
fabrication or modification included).
3 The engine oil was drained and synthetic lubricating oil with low-sulfur (Lube 1 identified in the oil matrix) was used.
4 The RAT-A aging cycle was set up and cycle specifications were verified. If more than one converter was in a system, then setup was performed on the first catalyst only. Flows were adjusted to provide equal flows through each of the two catalyst systems being simultaneously aged. Aging was conducted with a fuel with an ultra-low sulfur fuel provided by CRC. Raw exhaust concentrations were monitored at the start of the aging (zero hours).
5 After 24 hours of aging, the inlet exhaust conditions were verified to insure correct and
stable operating conditions.

University of California, Riverside, CE-CERT CRC Project E-61: Oil Property Impacts
33
6 After 48 hours of aging, the inlet exhaust conditions were verified and the test parts were
rotated between the banks of the engine. 7 After 72 hours of aging, the inlet exhaust conditions were verified to insure correct and
stable operating conditions. 8 After 90 hours of aging, a final emissions verification was made and the parts were
removed from the test stand. 9 Steps 3 through 8 were repeated for the next seven (7) sets of catalysts. 10 The catalyst were labeled and repackaged for return to CE-CERT.

University of California, Riverside, CE-CERT CRC Project E-61: Oil Property Impacts
34
Appendix C. Sulfur Removal Protocol.
This procedure is designed to cause the vehicle to transiently run rich at high catalyst temperature, to remove accumulated sulfur from the catalyst, via hydrogen sulfide formation. The drive trace is shown below the descriptive protocol. The catalyst inlet temperature and the exhaust A/F ratio must be monitored during this procedure. It is required to demonstrate that the catalyst inlet temperature must exceed 700°C during the WOT accelerations and that rich fuel/air mixtures are achieved during WOT. If these parameters are not achieved, increased loading on the dynamometer should be added for this protocol (but not during the emissions test). 1. Drive the vehicle from idle to 55 mph and hold speed for 5 minutes (to bring catalyst to full
working temperature). 2. Reduce vehicle speed to 30 mph and hold speed for one minute. 3. Accelerate at WOT (wide-open throttle) for a minimum of 5 seconds, to achieve a speed in
excess of 70 mph. Continue WOT above 70 mph, if necessary to achieve 5-second acceleration duration. Hold the peak speed for 15 seconds and then decelerate to 30 mph.
4. Maintain 30 mph for one minute. 5. Repeat steps 3 and 4 to achieve 5 WOT excursions. 6. One sulfur removal cycle has been completed. 7. Repeat steps 1 to 5 for the second sulfur removal cycle. 8. The protocol is complete if the necessary parameters have been achieved.
WOT Acceleration must exceed 5 seconds duration, extended by peak speed greater than 70 mph.
01020304050607080
0 5 10 15 20 25
Test Time, minutes
Vehi
cle
Spee
d, m
ph
Monitor Catalyst inlet Temperature and Exhause A/F Ratio Demonstrate that Cat. In. Temp > 700C
and A/F Ratio goes rich.

University of California, Riverside, CE-CERT CRC Project E-61: Oil Property Impacts
35
Appendix D. DOAS Calibration Curve and Methodology for Deconvolution of the Formaldehyde Signal from the SO2 DOAS Signal.
1. Calibration Curve for DOAS
Notes: x-error bars are derived via error propagation from uncertainties in the cal gas cylinder concentration and the dilution flows.
y-error bars are 1 standard deviation over 20 measurements.
2. Methodology for Deconvolution of the Formaldehyde Signal from the SO2 DOAS Signal
Using the spectral information for HCHO, the software was modified to include a subtraction program for the DOAS. This software essentially deconvolutes the signal from the formaldehyde to provide the data for the SO2. The figure on the next page demonstrates how this subtraction routine works.
1) Spectrum A shows a typical near UV differential absorption spectrum of engine-out raw exhaust gas as recorded by the Differential Optical Absorption Spectrometer (DOAS). Obviously there is little resemblance to a spectrum of pure sulfur dioxide (Spectrum D).
2) Separately conducted experiments showed that the additional features can be attributed to formaldehyde (Spectrum B). HCHO is known to be one of the resulting products
y = (1.02±0.03)x + (5.6±7.1)errors are 1sigma of linear regression
R2 = 0.9896
0
100
200
300
400
500
0 100 200 300 400 500
target SO2 conc. [ppb]
mea
sure
d SO
2 con
c. [p
pb]

University of California, Riverside, CE-CERT CRC Project E-61: Oil Property Impacts
36
from gasoline combustion. The DOAS software, therefore, was changed to deconvolute the formaldehyde contribution out of the exhaust spectra by using a reference spectrum of pure formaldehyde (Spectrum B, for illustration purposes the actually used reference spectrum was divided by 10).
3) Spectrum C shows the exhaust spectrum after subtracting the formaldehyde contribution, which was 0.1435 times the reference spectrum. The SO2 features stand out clearly now and compare to 0.0765 times the intensity of the used SO2 reference spectrum (Spectrum D, for illustration purposes the actually used reference spectrum was divided by 10).
4) Knowing the concentration of the SO2 reference spectrum of 10 ppmV, the SO2 content in the exhaust gas is 765 ppbV.
5) Subtracting the SO2 contribution from the exhaust spectrum finally yields the residual Spectrum E. In the ideal case this residual spectrum should be a straight line. In practice, instrument noise always results in at least some random structure.
T yp ic a l D O A S S p e c tra
2 9 5 3 0 0 3 0 5 3 1 0 3 1 5 3 2 0 3 2 5 3 3 0
w ave leng th (nm )
diffe
rent
ial a
bsor
ptio
n
S p e c tru m A : R a w E xh a u s t
S p e c tru m B : H C H O /1 0
S p e c tru m C : A - 1 .4 3 5 x B
S p e c tru m D : S O 2 /1 0
S p e c tru m E : C - 0 .7 6 5 x D

University of California, Riverside, CE-CERT CRC Project E-61: Oil Property Impacts
37
Appendix E. Detailed FTP Emissions Results. THC CO NOx CO2 SO2
Vehicle Test Date Mileage Oil sulfur Oil Base Bag 1 Bag 2 Bag 3 Total Bag 1 Bag 2 Bag 3 Total Bag 1 Bag 2 Bag 3 Total Bag 1 Bag 2 Bag 3 Total Bag 1 Bag 2 Bag 3 Total
ppm g/mi g/mi g/mi g/mi g/mi g/mi g/mi g/mi g/mi g/mi g/mi g/mi g/mi g/mi g/mi g/mi mg/mi mg/mi mg/mi mg/mi 2001 Buick LeSabre I0110023 10/24/2001 16,308 0.01% PAO Base 0.148 0.010 0.017 0.041 2.295 0.034 0.252 0.563 0.146 0.003 0.067 0.050 435.4 441.7 367.5 420.0 No DOAS data available
I0110028 10/25/2001 16,327 0.01% PAO Base 0.127 0.007 0.014 0.034 2.805 0.055 0.239 0.676 0.164 0.000 0.067 0.053 435.8 441.8 367.9 420.2 0.749 0.294 0.246 0.375
I0110029 10/26/2001 16,338 0.01% PAO Base 0.122 0.007 0.018 0.034 2.249 0.036 0.293 0.566 0.162 0.020 0.114 0.076 441.9 456.1 378.9 431.9 0.555 0.258 0.132 0.285
I0110034 10/27/2001 16,366 0.01% PAO Base 0.147 0.006 0.014 0.038 2.617 0.050 0.131 0.605 0.130 0.000 0.077 0.048 438.7 457.6 379.5 432.2 0.042 -0.047 -0.039 -0.027
Average 0.136 0.008 0.016 0.037 2.492 0.044 0.229 0.603 0.151 0.006 0.081 0.057 437.9 449.3 373.4 426.1 0.449 0.168 0.113 0.211
Stdev 0.003 0.053 0.013 6.9 0.211
COV 9.3% 8.7% 22.9% 1.6% 99.8%
I0112020 12/13/2001 17,554 0.01% PAO Base 0.143 0.011 0.018 0.041 2.886 0.038 0.122 0.652 0.119 0.003 0.067 0.045 454.8 460.1 377.4 436.3 -0.080 0.008 0.046 0.000
I0112023 12/14/2001 17,569 0.01% PAO Base 0.162 0.008 0.018 0.043 3.382 0.025 0.253 0.784 0.090 0.002 0.092 0.045 458.7 453.1 376.1 433.1No DOAS data available
I0112025 12/18/2001 17,587 0.01% PAO Base 0.170 0.009 0.014 0.044 3.188 0.030 0.111 0.707 0.153 0.005 0.084 0.057 484.6 479.0 381.0 453.2 0.207 0.028 0.111 0.088
Average 0.158 0.009 0.017 0.043 3.152 0.031 0.162 0.714 0.121 0.003 0.081 0.049 466.0 464.1 378.2 440.9 0.064 0.018 0.078 0.044
Stdev 0.002 0.066 0.007 10.8 0.062
COV 3.6% 9.3% 14.1% 2.5% 141.4%
I0202035 2/14/2002 19,972 0.16% PAO Base 0.144 0.012 0.019 0.042 1.732 0.018 0.095 0.395 0.192 0.004 0.079 0.063 452.5 451.7 373.1 430.3 -0.030 0.071 0.015 0.035
I0202039 2/15/2002 19,992 0.16% PAO Base 0.146 0.011 0.019 0.041 2.623 0.028 0.069 0.577 0.177 0.003 0.085 0.062 445.7 451.4 374.1 429.0 -0.023 0.221 0.179 0.159
I0202042 2/20/2002 20,020 0.16% PAO Base 0.156 0.010 0.016 0.042 2.357 0.036 0.083 0.531 0.184 0.003 0.082 0.062 446.3 454.5 374.8 430.9 0.174 0.371 0.169 0.274
Average 0.149 0.011 0.018 0.042 2.237 0.027 0.082 0.501 0.184 0.003 0.082 0.062 448.2 452.5 374.0 430.0 0.040 0.221 0.121 0.156
Stdev 0.001 0.095 0.001 1.0 0.120
COV 1.4% 18.9% 0.9% 0.2% 76.9%
I0202010 2/5/2002 19,371 0.29% Group 1 0.125 0.015 0.021 0.040 1.945 0.028 0.151 0.459 0.203 0.003 0.094 0.069 454.9 456.3 378.6 434.7 -0.026 0.419 0.144 0.251
I0202015 2/7/2002 19,399 0.29% Group 1 0.126 0.015 0.020 0.039 2.628 0.027 0.191 0.612 0.143 0.002 0.083 0.053 454.8 457.7 370.8 433.2 0.848 0.722 0.440 0.671
I0202019 2/8/2002 19,420 0.29% Group 1 0.120 0.012 0.020 0.037 2.436 0.021 0.135 0.554 0.163 0.004 0.089 0.061 451.4 454.0 371.5 430.8 0.520 0.636 0.472 0.567
Average 0.124 0.014 0.020 0.039 2.336 0.025 0.159 0.542 0.170 0.003 0.089 0.061 453.7 456.0 373.7 432.9 0.448 0.592 0.352 0.496
Stdev 0.002 0.077 0.008 2.0 0.219
COV 4.0% 14.3% 13.1% 0.5% 44.1%

University of California, Riverside, CE-CERT CRC Project E-61: Oil Property Impacts
38
Appendix E. Detailed FTP Emissions Results. THC CO NOx CO2 SO2
Vehicle Test Date Mileage Oil sulfur Oil Base Bag 1 Bag 2 Bag 3 Total Bag 1 Bag 2 Bag 3 Total Bag 1 Bag 2 Bag 3 Total Bag 1 Bag 2 Bag 3 Total Bag 1 Bag 2 Bag 3 Total
ppm g/mi g/mi g/mi g/mi g/mi g/mi g/mi g/mi g/mi g/mi g/mi g/mi g/mi g/mi g/mi g/mi mg/mi mg/mi mg/mi mg/mi 2001 Buick LeSabre I0201040 1/29/2002 18,769 0.28% PAO Base 0.176 0.011 0.017 0.047 3.024 0.035 0.126 0.681 0.166 0.004 0.091 0.062 470.6 464.2 377.5 441.7 0.255 0.483 0.378 0.407
I0201042 1/30/2002 18,790 0.28% PAO Base 0.155 0.012 0.017 0.043 2.348 0.033 0.199 0.559 0.200 0.005 0.130 0.080 475.8 507.6 393.5 469.6 0.547 0.654 0.455 0.577
I0201043 1/31/2002
18,810 0.28% PAO Base 0.201 0.010 0.018 0.052 3.624 0.020 0.164 0.807 0.150 0.004 0.090 0.058 458.0 466.0 377.0 439.9 0.299 0.524 0.594 0.497
Average 0.177 0.011 0.017 0.047 2.999 0.029 0.163 0.682 0.172 0.004 0.104 0.067 468.1 479.3 382.7 450.4 0.367 0.554 0.476 0.494
Stdev 0.005 0.124 0.012 16.7 0.085
COV 9.5% 18.2% 17.6% 3.7% 17.2%
I0201015 1/9/2002 18,138 0.52% Group 1 0.141 0.016 0.023 0.044 3.062 0.017 0.195 0.697 0.158 0.004 0.097 0.061 456.2 455.6 378.2 434.5 0.176 1.103 1.077 0.904
I0201016 1/10/2002 18,159 0.52% Group 1 0.154 0.014 0.020 0.045 2.392 0.030 0.173 0.560 0.187 0.003 0.101 0.068 453.1 460.0 379.6 436.4 1.810 1.196 0.798 1.214
I0201020 1/11/2002 18,179 0.52% Group 1 0.126 0.010 0.016 0.036 2.424 0.019 0.078 0.535 0.163 0.002 0.081 0.058 449.7 455.5 374.9 432.1 0.691 1.991 0.988 1.445
I0201023 1/15/2002 18,210 0.52% Group 1 0.127 0.011 0.018 0.037 2.416 0.029 0.081 0.539 0.165 0.004 0.107 0.066 449.0 453.1 375.7 430.9 0.198 1.493 1.035 1.098
Average 0.137 0.013 0.019 0.041 2.574 0.024 0.132 0.583 0.168 0.003 0.097 0.063 452.0 456.0 377.1 433.5 0.892 1.430 0.954 1.165
Stdev 0.005 0.077 0.005 2.461 0.226
COV 11.5% 13.2% 7.2% 0.6% 19.4%
I0110048 10/31/2001 16,919 0.76% Group 1 0.131 0.020 0.021 0.043 2.921 0.055 0.197 0.688 0.125 0.000 0.126 0.060 464.3 507.4 406.1 470.7 0.327 0.830 0.599 0.662
I0111002 11/1/2001 16,940 0.76% Group 1 0.118 0.016 0.022 0.039 2.607 0.070 0.299 0.659 0.170 0.004 0.104 0.066 444.2 467.8 386.3 440.5 0.514 1.585 0.934 1.184
I0111010 11/3/2001 16,968 0.76% Group 1 0.124 0.006 0.014 0.038 2.000 0.050 0.131 0.655 0.130 0.000 0.077 0.060 438.7 457.6 379.5 432.2 0.410 0.837 0.716 0.715
Average 0.124 0.014 0.019 0.040 2.509 0.058 0.209 0.667 0.142 0.001 0.102 0.062 449.0 477.6 390.6 447.8 0.417 1.084 0.750 0.854
Stdev 0.003 0.018 0.003 20.2 0.287
COV 6.6% 2.7% 5.6% 4.5% 33.6%

University of California, Riverside, CE-CERT CRC Project E-61: Oil Property Impacts
39
Appendix E. Detailed FTP Emissions Results. THC CO NOx CO2 SO2
Vehicle Test Date Mileage Oil sulfur Oil Base Bag 1 Bag 2 Bag 3 Total Bag 1 Bag 2 Bag 3 Total Bag 1 Bag 2 Bag 3 Total Bag 1 Bag 2 Bag 3 Total Bag 1 Bag 2 Bag 3 Total
ppm g/mi g/mi g/mi g/mi g/mi g/mi g/mi g/mi g/mi g/mi g/mi g/mi g/mi g/mi g/mi g/mi mg/mi mg/mi mg/mi mg/mi 2001 Ford Windstar I0110026 10/25/2001 20,407 0.01% PAO 0.117 0.003 0.013 0.029 1.285 0.085 0.139 0.349 0.169 0.000 0.012 0.038 462.1 478.5 418.7 458.6
No DOAS data available
I0110032 10/26/2001 20,427 0.01% PAO 0.112 0.003 0.010 0.027 1.202 0.085 0.152 0.335 0.154 0.000 0.013 0.035 480.2 497.5 427.7 474.7 0.039 0.000 0.176 0.056
I0110036 10/27/2001 20,448 0.01% PAO 0.119 0.003 0.012 0.029 1.363 0.104 0.197 0.390 0.147 0.000 0.003 0.031 477.2 498.5 431.5 475.7 0.106 -0.060 -0.044 -0.021
I0110044 10/30/2001 20,476 0.01% PAO 0.116 0.002 0.011 0.028 1.362 0.091 0.233 0.393 0.168 0.000 0.011 0.038 472.5 495.7 408.6 466.9 -0.076 0.005 0.002 -0.013
Average 0.116 0.003 0.012 0.028 1.303 0.091 0.180 0.367 0.160 0.000 0.010 0.036 473.0 492.5 421.6 469.0 0.023 -0.018 0.045 0.008
Stdev 0.001 0.029 0.003 7.9 0.043
COV 3.4% 8.0% 9.3% 1.7% 563.7%
I0111004 11/1/2001 21,027 0.76% Group 1 0.111 0.004 0.012 0.028 1.436 0.078 0.154 0.380 0.178 0.001 0.011 0.040 475.0 497.9 432.8 475.3 0.717 1.060 0.723 0.896
I0111006 11/2/2001 21,048 0.76% Group 1 0.104 0.003 0.011 0.026 1.283 0.065 0.141 0.338 0.166 0.000 0.005 0.036 471.3 499.0 432.6 475.0 1.187 0.862 0.547 0.843
I0111007 11/3/2001 21,059 0.76% Group 1 0.110 0.005 0.015 0.030 1.314 0.078 0.142 0.352 0.128 0.001 0.006 0.029 478.8 504.5 435.4 480.2 0.978 1.250 0.057 0.866
Average 0.108 0.004 0.013 0.028 1.344 0.074 0.146 0.357 0.157 0.001 0.007 0.035 475.0 500.5 433.6 476.8 0.961 1.057 0.442 0.868
Stdev 0.002 0.021 0.006 2.9 0.027
COV 7.1% 6.0% 15.9% 0.6% 3.1%

University of California, Riverside, CE-CERT CRC Project E-61: Oil Property Impacts
40
Appendix E. Detailed FTP Emissions Results. THC CO NOx CO2 SO2
Vehicle Test Date Mileage Oil sulfur Oil Base Bag 1 Bag 2 Bag 3 Total Bag 1 Bag 2 Bag 3 Total Bag 1 Bag 2 Bag 3 Total Bag 1 Bag 2 Bag 3 Total Bag 1 Bag 2 Bag 3 Total
ppm g/mi g/mi g/mi g/mi g/mi g/mi g/mi g/mi g/mi g/mi g/mi g/mi g/mi g/mi g/mi g/mi mg/mi mg/mi mg/mi mg/mi 2001 Toyota Camry I0112026 12/18/2001 20,678 0.01% PAO 0.123 0.003 0.012 0.031 1.240 0.019 0.042 0.279 0.131 0.008 0.114 0.063 396.8 373.9 319.2 364.5 0.009 0.041 0.095 0.050
I0112030 12/19/2001 20,698 0.01% PAO 0.140 0.004 0.013 0.035 1.905 0.023 0.047 0.421 0.134 0.011 0.100 0.061 394.7 372.3 315.4 362.4 0.087 0.096 0.061 0.085
I0112034 12/20/2001 20,718 0.01% PAO 0.153 0.011 0.016 0.042 1.988 0.024 0.057 0.440 0.114 0.010 0.108 0.058 399.5 372.9 316.5 362.9 0.039 0.005 0.036 0.020
Average 0.139 0.006 0.014 0.036 1.711 0.022 0.049 0.380 0.126 0.010 0.107 0.061 397.0 373.1 317.0 363.3 0.045 0.048 0.064 0.052
Stdev 0.006 0.088 0.003 1.1 0.032
COV 15.5% 23.2% 4.1% 0.3% 62.4%
I0201024 1/15/2002 21,859 0.76% Group 1 0.156 0.006 0.016 0.040 2.310 0.011 0.058 0.501 0.111 0.011 0.102 0.057 392.1 382.6 323.1 368.2 0.570 0.351 0.205 0.356
I0201026 1/16/2002 21,879 0.76% Group 1 0.139 0.005 0.014 0.035 1.751 0.017 0.057 0.388 0.125 0.011 0.092 0.057 395.9 379.3 322.6 367.2 0.361 0.656 0.525 0.559
I0201027 1/17/2002 21,898 0.76% Group 1 0.137 0.005 0.013 0.035 1.543 0.014 0.071 0.347 0.131 0.010 0.087 0.056 399.0 383.0 326.1 370.7 0.431 0.979 0.408 0.708
Average 0.144 0.005 0.014 0.037 1.868 0.014 0.062 0.412 0.122 0.011 0.094 0.057 395.7 381.6 323.9 368.7 0.454 0.662 0.379 0.541
Stdev 0.003 0.080 0.001 1.8 0.177
COV 7.9% 19.4% 1.0% 0.5% 32.7%
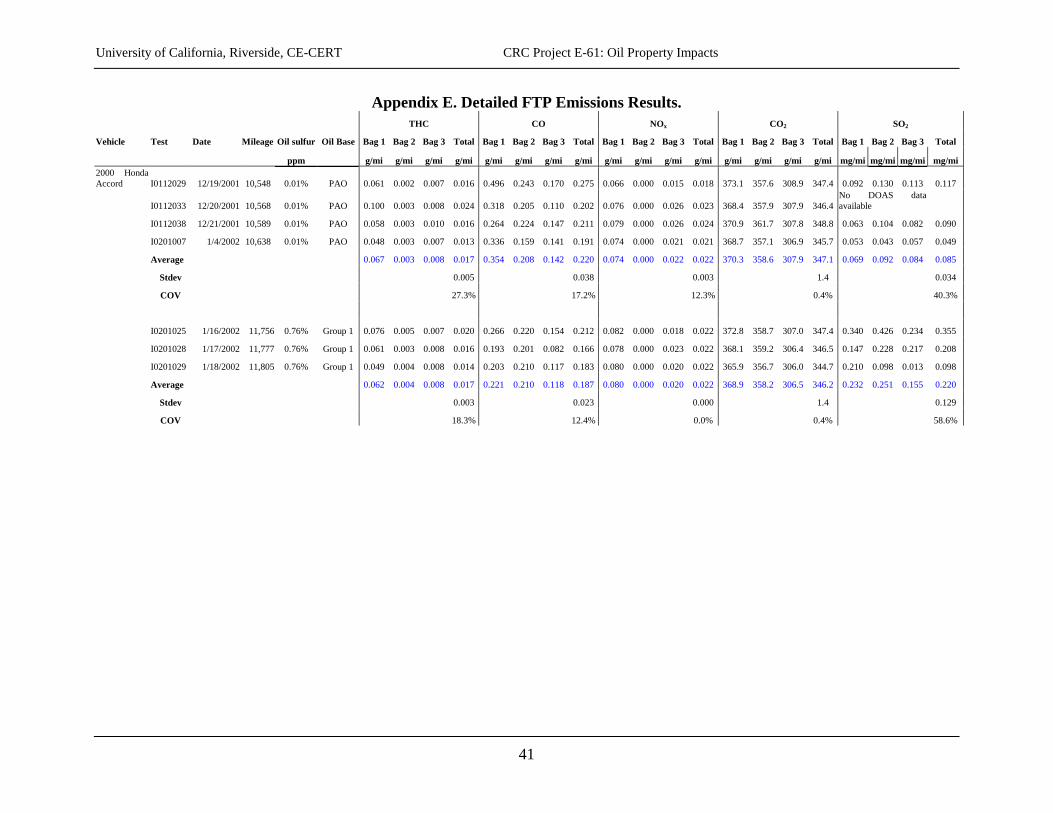
University of California, Riverside, CE-CERT CRC Project E-61: Oil Property Impacts
41
Appendix E. Detailed FTP Emissions Results. THC CO NOx CO2 SO2
Vehicle Test Date Mileage Oil sulfur Oil Base Bag 1 Bag 2 Bag 3 Total Bag 1 Bag 2 Bag 3 Total Bag 1 Bag 2 Bag 3 Total Bag 1 Bag 2 Bag 3 Total Bag 1 Bag 2 Bag 3 Total
ppm g/mi g/mi g/mi g/mi g/mi g/mi g/mi g/mi g/mi g/mi g/mi g/mi g/mi g/mi g/mi g/mi mg/mi mg/mi mg/mi mg/mi 2000 Honda Accord I0112029 12/19/2001 10,548 0.01% PAO 0.061 0.002 0.007 0.016 0.496 0.243 0.170 0.275 0.066 0.000 0.015 0.018 373.1 357.6 308.9 347.4 0.092 0.130 0.113 0.117
I0112033 12/20/2001 10,568 0.01% PAO 0.100 0.003 0.008 0.024 0.318 0.205 0.110 0.202 0.076 0.000 0.026 0.023 368.4 357.9 307.9 346.4No DOAS data available
I0112038 12/21/2001 10,589 0.01% PAO 0.058 0.003 0.010 0.016 0.264 0.224 0.147 0.211 0.079 0.000 0.026 0.024 370.9 361.7 307.8 348.8 0.063 0.104 0.082 0.090
I0201007 1/4/2002 10,638 0.01% PAO 0.048 0.003 0.007 0.013 0.336 0.159 0.141 0.191 0.074 0.000 0.021 0.021 368.7 357.1 306.9 345.7 0.053 0.043 0.057 0.049
Average 0.067 0.003 0.008 0.017 0.354 0.208 0.142 0.220 0.074 0.000 0.022 0.022 370.3 358.6 307.9 347.1 0.069 0.092 0.084 0.085
Stdev 0.005 0.038 0.003 1.4 0.034
COV 27.3% 17.2% 12.3% 0.4% 40.3%
I0201025 1/16/2002 11,756 0.76% Group 1 0.076 0.005 0.007 0.020 0.266 0.220 0.154 0.212 0.082 0.000 0.018 0.022 372.8 358.7 307.0 347.4 0.340 0.426 0.234 0.355
I0201028 1/17/2002 11,777 0.76% Group 1 0.061 0.003 0.008 0.016 0.193 0.201 0.082 0.166 0.078 0.000 0.023 0.022 368.1 359.2 306.4 346.5 0.147 0.228 0.217 0.208
I0201029 1/18/2002 11,805 0.76% Group 1 0.049 0.004 0.008 0.014 0.203 0.210 0.117 0.183 0.080 0.000 0.020 0.022 365.9 356.7 306.0 344.7 0.210 0.098 0.013 0.098
Average 0.062 0.004 0.008 0.017 0.221 0.210 0.118 0.187 0.080 0.000 0.020 0.022 368.9 358.2 306.5 346.2 0.232 0.251 0.155 0.220
Stdev 0.003 0.023 0.000 1.4 0.129
COV 18.3% 12.4% 0.0% 0.4% 58.6%
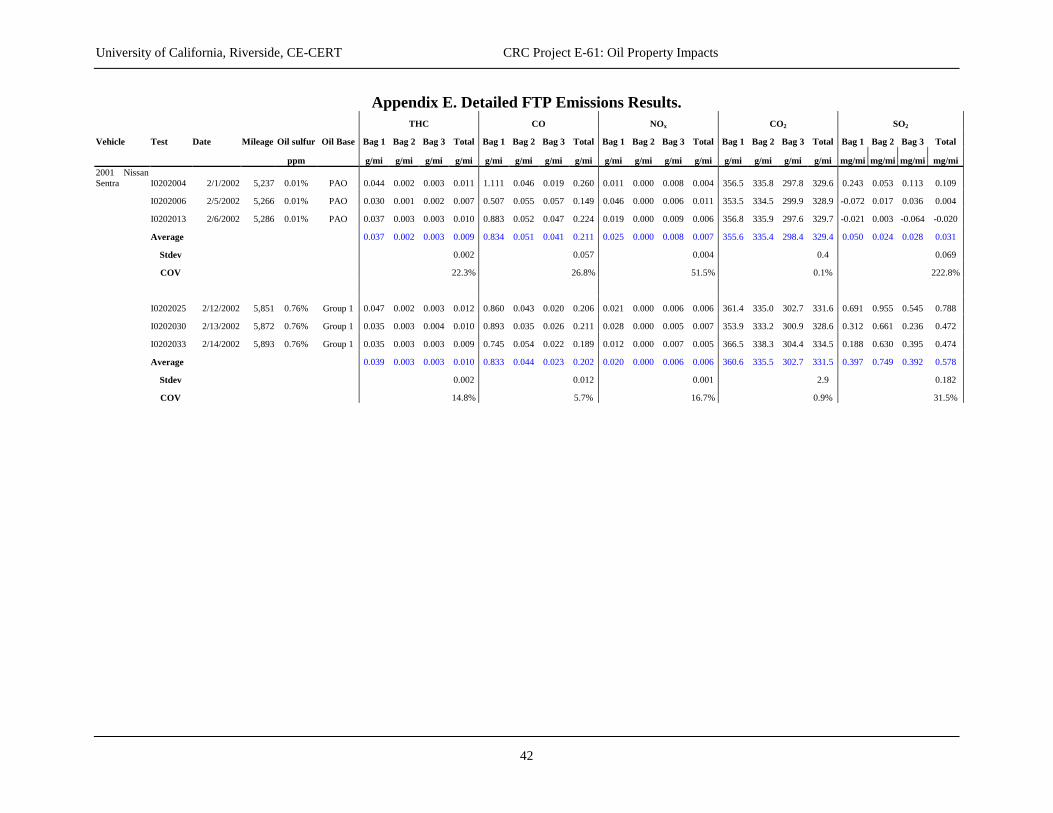
University of California, Riverside, CE-CERT CRC Project E-61: Oil Property Impacts
42
Appendix E. Detailed FTP Emissions Results. THC CO NOx CO2 SO2
Vehicle Test Date Mileage Oil sulfur Oil Base Bag 1 Bag 2 Bag 3 Total Bag 1 Bag 2 Bag 3 Total Bag 1 Bag 2 Bag 3 Total Bag 1 Bag 2 Bag 3 Total Bag 1 Bag 2 Bag 3 Total
ppm g/mi g/mi g/mi g/mi g/mi g/mi g/mi g/mi g/mi g/mi g/mi g/mi g/mi g/mi g/mi g/mi mg/mi mg/mi mg/mi mg/mi 2001 Nissan Sentra I0202004 2/1/2002 5,237 0.01% PAO 0.044 0.002 0.003 0.011 1.111 0.046 0.019 0.260 0.011 0.000 0.008 0.004 356.5 335.8 297.8 329.6 0.243 0.053 0.113 0.109
I0202006 2/5/2002 5,266 0.01% PAO 0.030 0.001 0.002 0.007 0.507 0.055 0.057 0.149 0.046 0.000 0.006 0.011 353.5 334.5 299.9 328.9 -0.072 0.017 0.036 0.004
I0202013 2/6/2002 5,286 0.01% PAO 0.037 0.003 0.003 0.010 0.883 0.052 0.047 0.224 0.019 0.000 0.009 0.006 356.8 335.9 297.6 329.7 -0.021 0.003 -0.064 -0.020
Average 0.037 0.002 0.003 0.009 0.834 0.051 0.041 0.211 0.025 0.000 0.008 0.007 355.6 335.4 298.4 329.4 0.050 0.024 0.028 0.031
Stdev 0.002 0.057 0.004 0.4 0.069
COV 22.3% 26.8% 51.5% 0.1% 222.8%
I0202025 2/12/2002 5,851 0.76% Group 1 0.047 0.002 0.003 0.012 0.860 0.043 0.020 0.206 0.021 0.000 0.006 0.006 361.4 335.0 302.7 331.6 0.691 0.955 0.545 0.788
I0202030 2/13/2002 5,872 0.76% Group 1 0.035 0.003 0.004 0.010 0.893 0.035 0.026 0.211 0.028 0.000 0.005 0.007 353.9 333.2 300.9 328.6 0.312 0.661 0.236 0.472
I0202033 2/14/2002 5,893 0.76% Group 1 0.035 0.003 0.003 0.009 0.745 0.054 0.022 0.189 0.012 0.000 0.007 0.005 366.5 338.3 304.4 334.5 0.188 0.630 0.395 0.474
Average 0.039 0.003 0.003 0.010 0.833 0.044 0.023 0.202 0.020 0.000 0.006 0.006 360.6 335.5 302.7 331.5 0.397 0.749 0.392 0.578
Stdev 0.002 0.012 0.001 2.9 0.182
COV 14.8% 5.7% 16.7% 0.9% 31.5%

University of California, Riverside, CE-CERT CRC Project E-61: Oil Property Impacts
43
Appendix E. Detailed FTP Emissions Results. THC CO NOx CO2 SO2
Vehicle Test Date Mileage Oil sulfur Oil Base Bag 1 Bag 2 Bag 3 Total Bag 1 Bag 2 Bag 3 Total Bag 1 Bag 2 Bag 3 Total Bag 1 Bag 2 Bag 3 Total Bag 1 Bag 2 Bag 3 Total
ppm g/mi g/mi g/mi g/mi g/mi g/mi g/mi g/mi g/mi g/mi g/mi g/mi g/mi g/mi g/mi g/mi mg/mi mg/mi mg/mi mg/mi 2001 Dodge Neon I0202003 2/1/2002 17,769 0.01% PAO 0.292 0.005 0.004 0.064 3.709 0.036 0.003 0.789 0.057 0.002 0.011 0.016 337.4 339.8 290.7 325.8 0.103 0.086 0.026 0.073
I0202007 2/5/2002 17,798 0.01% PAO 0.270 0.002 0.003 0.058 3.433 0.052 0.001 0.739 0.022 0.000 0.007 0.007 336.0 339.9 294.0 326.5 -0.118 -0.051 -0.008 -0.053
I0202012 2/6/2002 17,819 0.01% PAO 0.281 0.005 0.005 0.062 3.176 0.054 0.020 0.693 0.045 0.000 0.001 0.010 337.4 340.0 289.7 325.6 -0.006 -0.005 -0.010 -0.007
Average 0.281 0.004 0.004 0.061 3.439 0.047 0.008 0.740 0.041 0.001 0.006 0.011 336.9 339.9 291.5 326.0 -0.007 0.010 0.003 0.004
Stdev 0.003 0.048 0.005 0.5 0.064
COV 5.0% 6.5% 41.7% 0.1% 1434.7%
I0202026 2/12/2002 18,448 0.76% Group 1 0.331 0.003 0.004 0.072 3.687 0.020 0.004 0.814 0.030 0.004 0.030 0.017 329.3 339.9 293.1 324.8 0.217 0.662 0.352 0.484
I0202031 2/13/2002 18,470 0.76% Group 1 0.198 0.003 0.004 0.044 2.437 0.089 0.002 0.553 0.039 0.002 0.005 0.010 331.7 342.2 289.3 325.4 0.133 0.127 0.194 0.147
I0202034 2/14/2002 18,491 0.76% Group 1 0.277 0.004 0.006 0.061 3.389 0.045 0.001 0.727 0.027 0.003 0.027 0.015 333.4 343.0 289.5 326.3 0.077 0.045 0.021 0.045
Average 0.269 0.003 0.005 0.059 3.171 0.051 0.002 0.698 0.032 0.003 0.021 0.014 331.5 341.7 290.6 325.5 0.142 0.278 0.189 0.225
Stdev 0.014 0.133 0.004 0.8 0.230
COV 23.9% 19.0% 25.8% 0.2% 102.0%

University of California, Riverside, CE-CERT CRC Project E-61: Oil Property Impacts
44
Appendix F. Test of Statistical Significance for Regulated Pollutants for Individual Bags.
FTP Bag 1 Results Oil
sulfur (ppm)
THC g/mi
P-value THC
difference
CO g/mi
P-value CO
difference
NOx g/mi
P-value NOx
differenceBuick LeSabre 0.01% 0.146 2.775 0.134 0.16% 0.149 0.388 2.237 0.945 0.184 0.008 0.29% 0.124 0.966 2.336 0.921 0.170 0.055 0.28% 0.177 0.020 2.999 0.262 0.172 0.040 0.52% 0.137 0.792 2.574 0.781 0.168 0.023 0.76% 0.124 0.961 2.509 0.798 0.142 0.339 Ford Windstar 0.01% 0.116 1.303 0.157 0.76% 0.108 0.986 1.344 0.260 0.160 0.558 Toyota Camry 0.01% 0.139 1.711 0.126 0.76% 0.144 0.320 1.868 0.329 0.122 0.667 Dodge Neon 0.01% 0.281 3.439 0.041 0.76% 0.269 0.616 3.171 0.727 0.032 0.780 Honda Accord 0.01% 0.067 0.354 0.074 0.76% 0.062 0.618 0.221 0.957 0.080 0.064 Nissan Sentra 0.01% 0.037 0.834 0.025 0.76% 0.039 0.371 0.833 0.502 0.020 0.656
FTP Bag 2 Results
Oil sulfur (ppm)
THC g/mi
P-value THC
difference
CO g/mi
P-value CO
difference
NOx g/mi
P-value NOx
differenceBuick LeSabre 0.01% 0.008 0.038 0.002* 0.16% 0.011 0.022 0.027 0.919 0.003 0.178 0.29% 0.014 0.001 0.025 0.959 0.003 0.258 0.28% 0.011 0.022 0.029 0.882 0.004 0.055 0.52% 0.013 0.005 0.024 0.981 0.003 0.168 0.76% 0.014 0.034 0.058 0.013 0.001 0.708 Ford Windstar 0.01% 0.003 0.091 0.000 0.76% 0.004 0.039 0.074 0.980 0.001 0.031 Toyota Camry 0.01% 0.006 0.022 0.010 0.76% 0.005 0.597 0.014 0.987 0.011 0.174 Dodge Neon 0.01% 0.004 0.047 0.001 0.76% 0.003 0.719 0.051 0.429 0.003 0.029 Honda Accord 0.01% 0.003 0.208 0.000 0.76% 0.004 0.039 0.210 0.455 0.000 - Nissan Sentra 0.01% 0.002 0.051 0.000 0.76% 0.003 0.187 0.044 0.842 0.000 -
Bold values are statistically significant to at least the 90% confidence level *excludes outlier test [I0110029] for the initial run on low-sulfur oil “-” = mean difference is zero and not statistically significant

University of California, Riverside, CE-CERT CRC Project E-61: Oil Property Impacts
45
FTP Bag 3 Results Oil
sulfur (ppm)
THC g/mi
P-value THC
difference
CO g/mi
P-value CO
difference
NOx g/mi
P-value NOx
differenceBuick LeSabre 0.01% 0.016 0.200 0.076 0.16% 0.018 0.104 0.082 0.984 0.082 0.358 0.29% 0.020 0.005 0.159 0.800 0.089 0.049 0.28% 0.017 0.181 0.163 0.774 0.104 0.035 0.52% 0.019 0.034 0.132 0.920 0.097 0.017 0.76% 0.019 0.089 0.209 0.437 0.102 0.049 Ford Windstar 0.01% 0.012 0.180 0.010 0.76% 0.013 0.199 0.146 0.882 0.070 0.763 Toyota Camry 0.01% 0.014 0.049 0.107 0.76% 0.014 - 0.062 0.051 0.094 0.958 Dodge Neon 0.01% 0.004 0.008 0.006 0.76% 0.005 0.246 0.002 0.798 0.021 0.082 Honda Accord 0.01% 0.008 0.142 0.022 0.76% 0.008 - 0.118 0.833 0.020 0.681 Nissan Sentra 0.01% 0.003 0.041 0.008 0.76% 0.003 - 0.023 0.907 0.006 0.906
Bold values are statistically significant to at least the 90% confidence level *excludes outlier test [I0110029] for the initial run on low-sulfur oil “-” = mean difference is zero and not statistically significant

University of California, Riverside, CE-CERT CRC Project E-61: Oil Property Impacts
46
Appendix G. Calculation of the Fuel Sulfur Equivalent for the Contribution of the Lubricant S to the Exhaust.
The calculation of the equivalent fuel sulfur contribution from the lubricant is obtained using the total SO2 mass emission rate, the calculated mass emission rate for the contribution of the test fuel used in the vehicles, the fuel density, and the fuel economy of the vehicle. The calculation is performed as follows:
The total mass of fuel utilized per mile by the vehicle is given as
X =(fuel density [g/l])*(3.785 [l/gal.])/(fuel economy [miles/gal.])
The total contribution of S emissions from 0.2 ppmw S test fuel per mile
Y =(0.2 10-6)*(fuel density [g/l])*(3.785 [l/gal.])/(fuel economy [miles/gal.])
Fuel sulfur equivalent contribution of lubricant in ppmw per mile is then equal to:
=((measured SO2 [g/,mi])*(32.064 [mass sulfur]/64.052 [mass of SO2]) – Y[g/mi])/X[g/mi]

University of California, Riverside, CE-CERT CRC Project E-61: Oil Property Impacts
47
Appendix H. Detailed Idle and 50 mph Cruise Emissions Results. THC NOx CO CO2 SO2 vehicle test Date mileage Oil sulfur Oil Base Idle 50 mph Idle 50 mph Idle 50 mph Idle 50 mph Idle 50 mph
ppm g/min g/mi g/min g/mi g/min g/mi g/min g/mi mg/min mg/mi
2001 Buick LeSabre I0110024 10/24/2002 16,319 0.01% PAO Base 0.009 0.001 0.000 0.000 0.001 0.010 62.9 210.0 I0110030 10/26/2002 16,349 0.01% PAO Base 0.008 0.001 0.000 0.000 0.002 0.008 59.3 205.3 0.005 0.030
I0110031 10/26/2002 16,358 0.01% PAO Base 0.012 0.001 0.000 0.000 0.001 0.009 60.5 208.7 -0.020 -0.049
I0110035 10/27/2002 16,378 0.01% PAO Base 0.002 0.001 0.000 0.000 0.010 0.007 58.6 207.6 -0.011 -0.052
Average 0.008 0.001 0.000 0.000 0.004 0.009 60.3 207.9 -0.009 -0.023
Stdev 0.004 0.000 0.000 0.000 0.004 0.001 1.9 2.0 0.012 0.046
COV 54.2% 21.2% -207.3 194.6% 112.8% 13.7% 3.1% 1% -1.445 -1.992
I0202035 2/14/2002 19,972 0.16% PAO Base 0.003 0.002 0.000 0.001 0.029 0.003 57.8 201.4 0.002 -0.001
I0202039 2/15/2002 19,992 0.16% PAO Base 0.005 0.002 0.000 0.001 0.033 0.003 58.2 200.6 0.023 0.014
I0202042 2/20/2002 20,020 0.16% PAO Base 0.001 0.002 0.001 0.001 0.000 0.001 58.9 201.1 0.032 0.069
Average 0.003 0.002 0.000 0.001 0.021 0.002 58.3 201.0 0.019 0.027
Stdev 0.002 0.000 0.001 0.000 0.018 0.002 0.572 0.415 0.015 0.037
COV 53% 5.0% 122.9% 19.5% 86.4% 61.0% 1.0% 0% 0.817 1.360
I0202010 2/5/2002 19,371 0.29% Group 1 0.002 0.004 0.000 0.001 0.019 0.005 57.1 204.5 0.055 0.085
I0202015 2/7/2002 19,399 0.29% Group 1 0.001 0.003 0.000 0.001 0.014 0.007 58.2 199.4 0.096 0.195
I0202019 2/8/2002 19,420 0.29% Group 1 0.001 0.003 0.000 0.000 0.014 0.007 58.9 201.8 0.076 0.178
Average 0.001 0.003 0.000 0.000 0.016 0.006 58.1 201.9 0.076 0.153
Stdev 0.000 0.001 0.000 0.000 0.003 0.001 0.923 2.521 0.021 0.059
COV 12% 19.4% 89.0% 45.5% 16.9% 19.7% 1.6% 1% 0.271 0.387
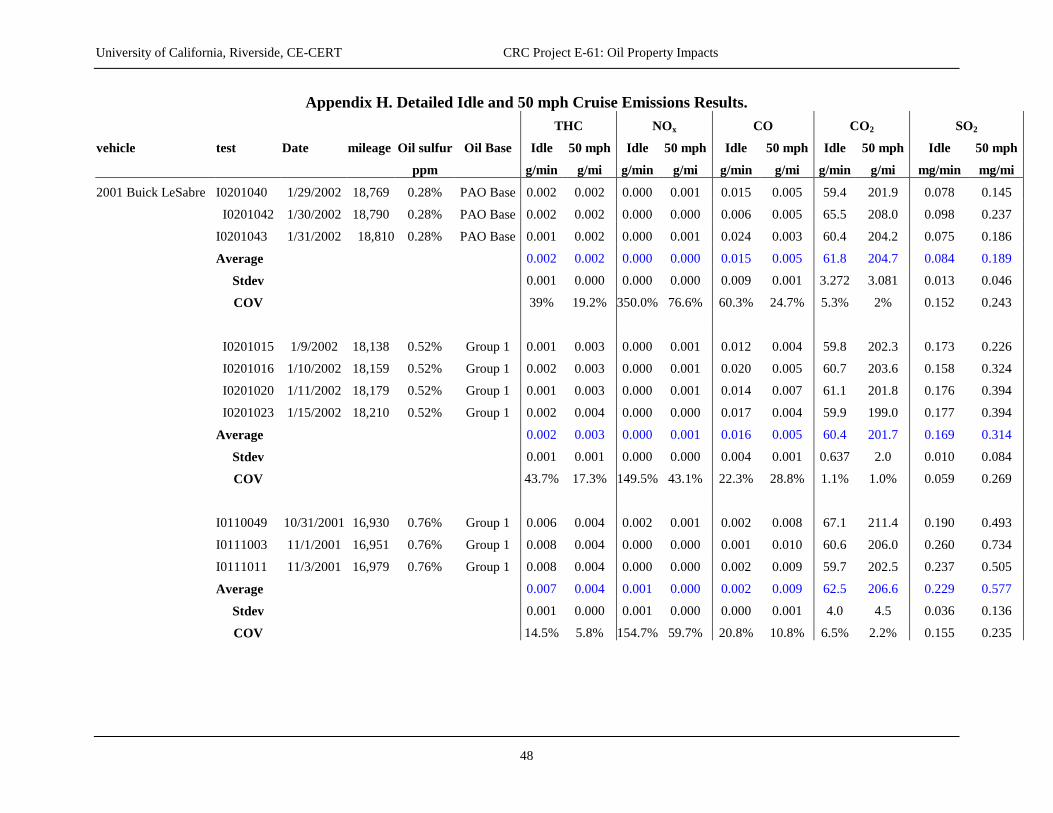
University of California, Riverside, CE-CERT CRC Project E-61: Oil Property Impacts
48
Appendix H. Detailed Idle and 50 mph Cruise Emissions Results. THC NOx CO CO2 SO2 vehicle test Date mileage Oil sulfur Oil Base Idle 50 mph Idle 50 mph Idle 50 mph Idle 50 mph Idle 50 mph ppm g/min g/mi g/min g/mi g/min g/mi g/min g/mi mg/min mg/mi
2001 Buick LeSabre I0201040 1/29/2002 18,769 0.28% PAO Base 0.002 0.002 0.000 0.001 0.015 0.005 59.4 201.9 0.078 0.145
I0201042 1/30/2002 18,790 0.28% PAO Base 0.002 0.002 0.000 0.000 0.006 0.005 65.5 208.0 0.098 0.237
I0201043 1/31/2002 18,810 0.28% PAO Base 0.001 0.002 0.000 0.001 0.024 0.003 60.4 204.2 0.075 0.186
Average 0.002 0.002 0.000 0.000 0.015 0.005 61.8 204.7 0.084 0.189
Stdev 0.001 0.000 0.000 0.000 0.009 0.001 3.272 3.081 0.013 0.046
COV 39% 19.2% 350.0% 76.6% 60.3% 24.7% 5.3% 2% 0.152 0.243
I0201015 1/9/2002 18,138 0.52% Group 1 0.001 0.003 0.000 0.001 0.012 0.004 59.8 202.3 0.173 0.226
I0201016 1/10/2002 18,159 0.52% Group 1 0.002 0.003 0.000 0.001 0.020 0.005 60.7 203.6 0.158 0.324
I0201020 1/11/2002 18,179 0.52% Group 1 0.001 0.003 0.000 0.001 0.014 0.007 61.1 201.8 0.176 0.394
I0201023 1/15/2002 18,210 0.52% Group 1 0.002 0.004 0.000 0.000 0.017 0.004 59.9 199.0 0.177 0.394
Average 0.002 0.003 0.000 0.001 0.016 0.005 60.4 201.7 0.169 0.314
Stdev 0.001 0.001 0.000 0.000 0.004 0.001 0.637 2.0 0.010 0.084
COV 43.7% 17.3% 149.5% 43.1% 22.3% 28.8% 1.1% 1.0% 0.059 0.269
I0110049 10/31/2001 16,930 0.76% Group 1 0.006 0.004 0.002 0.001 0.002 0.008 67.1 211.4 0.190 0.493
I0111003 11/1/2001 16,951 0.76% Group 1 0.008 0.004 0.000 0.000 0.001 0.010 60.6 206.0 0.260 0.734
I0111011 11/3/2001 16,979 0.76% Group 1 0.008 0.004 0.000 0.000 0.002 0.009 59.7 202.5 0.237 0.505
Average 0.007 0.004 0.001 0.000 0.002 0.009 62.5 206.6 0.229 0.577
Stdev 0.001 0.000 0.001 0.000 0.000 0.001 4.0 4.5 0.036 0.136
COV 14.5% 5.8% 154.7% 59.7% 20.8% 10.8% 6.5% 2.2% 0.155 0.235

University of California, Riverside, CE-CERT CRC Project E-61: Oil Property Impacts
49
Appendix H. Detailed Idle and 50 mph Cruise Emissions Results. THC NOx CO CO2 SO2 vehicle test Date mileage Oil sulfur Oil Base Idle 50 mph Idle 50 mph Idle 50 mph Idle 50 mph Idle 50 mph
ppm g/min g/mi g/min g/mi g/min g/mi g/min g/mi mg/min mg/mi
2001 Ford Windstar I0110027 10/25/2002 20,438 0.01% PAO 0.056 0.001 0.003 0.008 0.029 0.015 63.0 277.6 No DOAS data available for SO2
I0110033 10/26/2002 20,438 0.01% PAO 0.061 0.001 0.000 0.008 0.039 0.015 56.7 277.7 0.007 0.036
I0110037 10/27/2002 20,459 0.01% PAO 0.056 0.001 0.001 0.007 0.039 0.015 57.1 275.5 0.009 0.032
I0110045 10/30/2002 20,487 0.01% PAO 0.057 0.001 0.001 0.006 0.049 0.018 57.6 276.2 0.043 0.039
Average 0.057 0.001 0.001 0.007 0.039 0.016 58.6 276.8 0.019 0.036
Stdev 0.002 0.000 0.001 0.001 0.008 0.002 2.9 1.1 0.020 0.003
COV 0.039 0.189 1.047 0.106 0.209 0.099 5.0% 0.4% 1.037 0.087
I0111005 11/1/2001 21,038 0.76% Group 1 0.042 0.001 0.000 0.010 0.040 0.012 56.4 279.0 0.187 0.557
I0111008 11/3/2001 21,070 0.76% Group 1 0.042 0.001 0.000 0.011 0.039 0.011 57.4 278.2 0.235 0.657
I0111009 11/3/2001 21,080 0.76% Group 1 0.042 0.001 0.000 0.011 0.029 0.013 56.5 276.9 0.244 0.653
Average 0.042 0.001 0.000 0.010 0.036 0.012 56.8 278.1 0.222 0.622
Stdev 0.000 0.000 0.000 0.001 0.006 0.001 0.6 1.1 0.031 0.057
COV 0.5% 20.2% 46.1% 7.6% 17.8% 5.0% 1.0% 0.4% 0.138 0.092

University of California, Riverside, CE-CERT CRC Project E-61: Oil Property Impacts
50
Appendix H. Detailed Idle and 50 mph Cruise Emissions Results. THC NOx CO CO2 SO2 vehicle test Date mileage Oil sulfur Oil Base Idle 50 mph Idle 50 mph Idle 50 mph Idle 50 mph Idle 50 mph
ppm g/min g/mi g/min g/mi g/min g/mi g/min g/mi mg/min mg/mi
2001 Toyota Camry I0201004 1/3/2002 20,738 0.01% PAO 0.015 0.001 0.000 0.013 0.007 0.015 48.8 199.8 0.028 0.090
I0201005 1/4/2002 20,750 0.01% PAO 0.009 0.002 0.000 0.013 0.002 0.014 49.5 199.2 0.017 0.060
I0201006 1/4/2002 20,761 0.01% PAO 0.008 0.002 0.019 0.007 0.003 0.014 47.1 194.1 0.008 0.036
Average 0.011 0.002 0.006 0.011 0.004 0.014 48.5 197.7 0.018 0.062
Stdev 0.004 0.000 0.011 0.003 0.002 0.000 1.2 3.1 0.010 0.027
COV 37.9% 10.1% 172.2% 29.5% 54.4% 3.5% 2.5% 1.6% 0.553 0.437
I0201024 1/15/2002 21,859 0.76% Group 1 0.001 0.001 0.004 0.004 0.002 0.010 46.1 192.2 0.042 0.160
I0201026 1/16/2002 21,879 0.76% Group 1 0.001 0.001 0.001 0.006 0.001 0.011 44.8 192.0 0.084 0.307
I0201027 1/17/2002 21,898 0.76% Group 1 0.001 0.001 0.001 0.002 0.001 0.007 49.5 173.7 0.032 0.164
Average 0.001 0.001 0.002 0.004 0.001 0.010 46.8 185.9 0.053 0.210
Stdev 0.000 0.000 0.002 0.002 0.001 0.002 2.4 10.6 0.028 0.084
COV 21.4% 9.6% 80.0% 49.6% 45.9% 21.5% 5.2% 5.7% 0.532 0.399

University of California, Riverside, CE-CERT CRC Project E-61: Oil Property Impacts
51
Appendix H. Detailed Idle and 50 mph Cruise Emissions Results. THC NOx CO CO2 SO2 vehicle test Date mileage Oil sulfur Oil Base Idle 50 mph Idle 50 mph Idle 50 mph Idle 50 mph Idle 50 mph
ppm g/min g/mi g/min g/mi g/min g/mi g/min g/mi mg/min mg/mi
2000 Honda Accord I0201002 1/3/2002 10,619 0.01% PAO 0.003 0.002 0.014 0.000 0.003 0.141 43.9 198.9 0.009 0.074
I0201003 1/3/2002 10,628 0.01% PAO 0.002 0.001 0.000 0.000 0.001 0.130 42.7 195.5 -0.003 0.039
I0201007 1/4/2002 10,638 0.01% PAO 0.001 0.001 0.000 0.000 0.005 0.135 40.8 192.3 0.001 0.009
Average 0.002 0.001 0.005 0.000 0.003 0.136 42.4 195.6 0.002 0.041
Stdev 0.001 0.001 0.008 0.000 0.002 0.006 1.6 3.3 0.006 0.032
COV 72.6% 39.0% 170.8% -647.9% 74.2% 4.1% 3.7% 1.7% 2.787 0.796
I0201025 1/16/2002 11,756 0.76% Group 1 0.003 0.001 0.006 0.000 0.001 0.091 36.4 195.0 0.026 0.069
I0201028 1/17/2002 11,765 0.76% Group 1 0.003 0.001 0.004 0.000 0.001 0.105 36.3 192.2 0.017 0.034
I0201029 1/18/2002 11,805 0.76% Group 1 0.003 0.001 0.004 0.000 0.001 0.113 36.3 193.9 0.004 -0.031
Average 0.003 0.001 0.005 0.000 0.001 0.103 36.3 193.7 0.015 0.024
Stdev 0.000 0.000 0.001 0.000 0.000 0.011 0.1 1.4 0.011 0.051
COV 3.2% 22.1% 25.7% 85.9% 9.8% 11.0% 0.2% 0.7% 72% 215%

University of California, Riverside, CE-CERT CRC Project E-61: Oil Property Impacts
52
Appendix H. Detailed Idle and 50 mph Cruise Emissions Results. THC NOx CO CO2 SO2 vehicle test Date mileage Oil sulfur Oil Base Idle 50 mph Idle 50 mph Idle 50 mph Idle 50 mph Idle 50 mph
ppm g/min g/mi g/min g/mi g/min g/mi g/min g/mi mg/min mg/mi
2001 Nissan Sentra I0202004 2/1/2002 5,237 0.01% PAO 0.000 0.001 0.000 0.000 0.001 0.115 39.5 198.8 0.000 -0.006
I0202006 2/5/2002 5,266 0.01% PAO 0.000 0.001 0.000 0.000 0.001 0.120 39.7 200.9 0.000 0.010
I0202013 2/6/2002 5,286 0.01% PAO 0.000 0.001 0.000 0.000 0.001 0.121 39.5 200.2 -0.007 -0.002
Average 0.000 0.001 0.000 0.000 0.001 0.118 39.6 200.0 -0.002 0.001
Stdev 0.000 0.000 0.000 0.000 0.000 0.003 0.1 1.0 0.004 0.009
COV 4.2% 5.2% 303.4% 188.9% 13.2% 2.6% 0.3% 0.5% -1.795 12.932
I0202025 2/12/2002 5,851 0.76% Group 1 0.000 0.001 0.000 0.000 0.001 0.115 39.2 197.8 0.074 0.257
I0202030 2/13/2002 5,872 0.76% Group 1 0.000 0.001 0.000 0.001 0.001 0.118 38.9 200.5 0.044 0.136
I0202033 2/14/2002 5,893 0.76% Group 1 0.000 0.001 0.000 0.000 0.001 0.122 39.3 204.8 0.049 0.173
Average 0.000 0.001 0.000 0.000 0.001 0.119 39.2 201.0 0.056 0.189
Stdev 0.000 0.000 0.000 0.000 0.000 0.004 0.2 3.6 0.016 0.062
COV 6.1% 9.8% 38.7% 25.2% 21.5% 3.0% 0.5% 1.8% 0.281 0.327

University of California, Riverside, CE-CERT CRC Project E-61: Oil Property Impacts
53
Appendix H. Detailed Idle and 50 mph Cruise Emissions Results. THC NOx CO CO2 SO2 vehicle test Date mileage Oil sulfur Oil Base Idle 50 mph Idle 50 mph Idle 50 mph Idle 50 mph Idle 50 mph
ppm g/min g/mi g/min g/mi g/min g/mi g/min g/mi mg/min mg/mi
2001 Dodge Neon I0202003 2/1/2002 17,769 0.01% PAO 0.001 0.001 0.000 0.031 0.023 0.012 39.6 176.7 0.004 0.011
I0202007 2/5/2002 17,798 0.01% PAO 0.002 0.001 0.007 0.000 0.002 0.138 40.6 192.0 -0.005 -0.020
I0202012 2/6/2002 17,819 0.01% PAO 0.000 0.001 0.000 0.054 0.008 0.009 39.7 178.1 -0.002 -0.003
Average 0.001 0.001 0.002 0.028 0.011 0.053 40.0 182.3 -0.001 -0.004
Stdev 0.001 0.000 0.004 0.027 0.011 0.073 0.5 8.5 0.004 0.015
COV 65.1% 10.8% 171.3% 94.7% 100.9% 138.5% 1.4% 4.6% -4.101 -3.950
I0202026 2/12/2002 18,448 0.76% Group 1 0.000 0.001 0.000 0.045 0.003 0.005 39.0 173.8 0.057 0.252
I0202031 2/13/2002 18,470 0.76% Group 1 0.001 0.001 0.000 0.021 0.009 0.037 38.9 175.2 0.014 0.080
I0202034 2/14/2002 18,491 0.76% Group 1 0.000 0.001 0.000 0.017 0.002 0.014 39.3 177.6 -0.001 -0.010
Average 0.001 0.001 0.000 0.028 0.005 0.019 39.1 175.5 0.023 0.107
Stdev 0.000 0.000 0.000 0.015 0.004 0.016 0.2 1.9 0.030 0.133
COV 69.3% 15.5% 103.3% 56.3% 82.3% 87.2% 0.5% 1.1% 1.274 1.242