Impact of degree of substitution of acetylated Ofada rice...
13
Impact of degree of substitution of acetylated Ofada rice starch polymer on the release properties of nimesulide microspheres . Adenike Okunlola * , Temitope Owojori Department of Pharmaceutics and Industrial Pharmacy, University of Ibadan, Ibadan, Nigeria Received: January 22, 2016; Accepted: February 13, 2016 Original Article ABSTRACT Nimesulide microspheres were prepared by the quasi-emulsion solvent diffusion method, using acetylated starches of the indigenous Ofada rice (Oryza glaberrima Steud) with degrees of substitution (DS) 1.42 and 2.62. A full 2 3 factorial experimental design was performed using DS (X 1 ), drug:polymer ratio (X 2 ) and polymer concentration (X 3 ) as independent factors; size, entrapment, swelling and time taken for 80% drug release (t 80 ) were the dependent variables. Contour plots were generated and data from the in vitro release studies were fitted to various kinetic models. Nimesulide microspheres were near-spherical, sizes varying from 50.91±16.22 to 74.24±24.73 μm for microspheres containing starch DS 1.42 and from 21.05±4.25 to 46.10±3.85 μm for starch DS 2.62. Drug entrapment was 56.75±0.45 to 98.28±2.30%. DS had the greatest effect on the size, swelling and dissolution time (p = 0.01) which was confirmed by the contour plots. The interaction between factors DS and drug:polymer ratio (X 1 X 2 ) had the greatest effect on the microsphere properties (p = 0.04). Drug release was fitted into the First Order, Higuchi and Korsmeyer models. Acetylated starch of Ofada rice DS 2.62 was found more suitable for the formulation of microspheres because of reduced size and swelling, higher entrapment and prolonged drug release. KEY WORDS: Acetylation, degree of substitution, factorial design, Nimesulide, Ofada rice starch INTRODUCTION The coating polymer materials used for micro- encapsulation determines the physical and chemical properties of the resultant microspheres. Such polymers should be chemically compatible, non-reactive with the core material and provide the desired coating properties such as strength, flexibility, impermeability, optical properties and stability (1). The use of natural biodegradable polymers as coating materials in microsphere formulations has received considerable attention (1, 2). They remain attractive primarily because they are readily available, relatively inexpensive, biodegradable and capable of a large number of chemical modifications. A * Corresponding author: Adenike Okunlola, Department of Pharmaceutics and Industrial Pharmacy, Faculty of Pharmacy, University of Ibadan, Ibadan, Nigeria, Tel: 234 8023351064, E-mails: [email protected], [email protected] This Journal is © IPEC-Americas Inc March 2016 J. Excipients and Food Chem. 7 (1) 2016 - 4 DOWNLOAD FREE FROM HTTP://OJS.ABO.FI/JEFC This material MAY NOT be used for commercial purposes see Creative Commons Attribution NonCommercial‐NoDerivatives 4.0 International UNIVERSITY OF IBADAN LIBRARY
Transcript of Impact of degree of substitution of acetylated Ofada rice...

Impact of degree of substitution of acetylated Ofada rice starchpolymer on the release properties of nimesulide microspheres .
Adenike Okunlola*, Temitope Owojori
Department of Pharmaceutics and Industrial Pharmacy, University of Ibadan, Ibadan, Nigeria
Received: January 22, 2016; Accepted: February 13, 2016 Original Article
ABSTRACT
Nimesulide microspheres were prepared by the quasi-emulsion solvent diffusion method, using acetylatedstarches of the indigenous Ofada rice (Oryza glaberrima Steud) with degrees of substitution (DS) 1.42 and 2.62.A full 23 factorial experimental design was performed using DS (X1), drug:polymer ratio (X2) and polymerconcentration (X3) as independent factors; size, entrapment, swelling and time taken for 80% drug release (t80)were the dependent variables. Contour plots were generated and data from the in vitro release studies werefitted to various kinetic models. Nimesulide microspheres were near-spherical, sizes varying from50.91±16.22 to 74.24±24.73 µm for microspheres containing starch DS 1.42 and from 21.05±4.25 to46.10±3.85 µm for starch DS 2.62. Drug entrapment was 56.75±0.45 to 98.28±2.30%. DS had the greatesteffect on the size, swelling and dissolution time (p = 0.01) which was confirmed by the contour plots. Theinteraction between factors DS and drug:polymer ratio (X1X2) had the greatest effect on the microsphereproperties (p = 0.04). Drug release was fitted into the First Order, Higuchi and Korsmeyer models. Acetylatedstarch of Ofada rice DS 2.62 was found more suitable for the formulation of microspheres because ofreduced size and swelling, higher entrapment and prolonged drug release.
KEY WORDS: Acetylation, degree of substitution, factorial design, Nimesulide, Ofada rice starch
INTRODUCTION
The coating polymer materials used for micro-encapsulation determines the physical andchemical properties of the resultantmicrospheres. Such polymers should be
chemically compatible, non-reactive with thecore material and provide the desired coatingproperties such as strength, flexibility,impermeability, optical properties and stability(1). The use of natural biodegradable polymersas coating materials in microsphereformulations has received considerableattention (1, 2). They remain attractive primarilybecause they are readily available, relativelyinexpensive, biodegradable and capable of alarge number of chemical modifications. A
*Corresponding author: Adenike Okunlola, Department of Pharmaceutics and Industrial Pharmacy, Faculty of Pharmacy, University of Ibadan, Ibadan, Nigeria, Tel: 234 8023351064, E-mails: [email protected], [email protected]
This Journal is © IPEC-Americas Inc March 2016 J. Excipients and Food Chem. 7 (1) 2016 - 4 DOWNLOAD FREE FROM HTTP://OJS.ABO.FI/JEFCThis material MAY NOT be used for commercial purposessee Creative Commons Attribution NonCommercial‐NoDerivatives 4.0 International
UNIVERSITY
OF I
BADAN LIBRARY

Original Article
majority of investigations of natural polymersas matrices in drug delivery systems havecentered on proteins and polysaccharidesincluding starches (2). Unmodified nativestarches, irrespective of their source, areundesirable for many applications because oftheir inability to withstand processing such asextreme temperature, extreme pH, high shearrate or freeze/thaw variation. To overcomethis, modifications are usually carried out tointroduce desirable properties, to repressinherent properties that are undesirable or toimpart new properties to meet a requirementfor a specific application. The three commonapproaches for modifying starches arechemical, physical or enzymatic modification.
Chemical modification is generally achieved byetherification, esterification, crosslinking,oxidation, cationization or grafting of starches.In the acetylation reaction, the number of acetylgroups incorporated onto the starch molecule,and the rate and efficiency, depends on thereagent type and concentration, pH, presenceof catalyst, reaction time, botanical origin of thestarch and on the size and structuralcharacteristics of the native granule (3, 4). Theacetylation of starch results in a considerablymore hydrophobic material which has beenshown to have better retention of tensileproperties in aqueous environments (5). Whenstarch reacts with acid, it loses the hydroxylgroup and the free hydroxyl groups on C2, C3
and C6 of the starch molecule are substitutedwith acetyl groups. As the degree ofsubstitution (DS) increases, the nature of theacetylated starch changes to hydrophobic andinterparticular bonding capacity increases (6).They form flexible, water insoluble films thatare acid and heat-resistant and can substantiallyretard drug release (7).
Oryza glaberrima Steud (family Poaceae) alsoknown as Ofada rice is a particular delicacy inNigeria where it is largely cultivated andprocessed in the southwestern rice producing
communities (8). The rice grain’s high starchcontent makes it a less expensive source ofstarch which render it a cost effectivepharmaceutical excipient. The modification ofOfada rice starch by acetylation with varyingdegrees of substitution (DS 1.42; DS 2.62) wascarried out to produce polymers which werethen used to formulate nimesulide.
Nimesulide (4'-nitro-2'-phenoxy methanesulfonanilide) was introduced in 1985 as one ofa number of potent nonsteroidal anti-inflammatory drugs (NSAIDs) useful fortreating various inflammatory conditions (9). Itis a weakly acidic drug and differs from othernonsteroidal anti- inflammatory drugs(NSAIDs) in that its chemical structurecontains a sulfonanilide moiety, rather than acarboxylic group, as the acidic group. However,as with other non-steroidal anti-inflammatorydrugs, nimesulide is fairly insoluble in water (.0.01 mg/ml). This low aqueous solubility andwettability of the drug makes it morechallenging to formulate for oral or parenteralpharmaceutical dosage forms, which may resultin variable bioavailability. To overcome someof these drawbacks, in this study nimesulidewas encapsulated and formulated intomicrospheres using acetylated Ofada starchwith DS 1.42 and DS 2.62 for sustained drugrelease. The microspheres were prepared by thequasi-emulsion solvent diffusion method. A full23 factorial experimental design was alsoperformed using the degree of substitution ofstarch (X1), ratio of drug to polymer (X2) andpolymer concentration (X3) as the independentvariables. The effects of variation of thesefactors on some properties of nimesulidemicrospheres were then determined.
MATERIALS AND METHODS
Starch extraction and acetylation
Starch was extracted from the Ofada rice grainsaccording to a procedure previously reportedby Okunlola et. al., (10) and the modification
This Journal is © IPEC-Americas Inc March 2016 J. Excipients and Food Chem. 7 (1) 2016 - 5 DOWNLOAD FREE FROM HTTP://OJS.ABO.FI/JEFCThis material MAY NOT be used for commercial purposessee Creative Commons Attribution NonCommercial‐NoDerivatives 4.0 International
UNIVERSITY
OF I
BADAN LIBRARY

Original Article
was carried out by acetylation according to themethod by Singh and Nath, 2012 (11). Briefly,fifty grams of native starch was suspended in550 ml of de-ionized water in a 1000 ml conicalflask. The suspension was gelatinized by stirringat a temperature above 65EC, which is thegelatinization temperature of Ofada starch, for30 minutes on a hotplate (MS 400 Hot PlateMagnetic Stirrer, LIDA Instrument, ShanhgaiChina). The gelatinized starch was precipitatedusing 1 litre of anhydrous ethanol. Theprecipitated material was filtered and theresidue washed with acetone, filtered again anddried at 50°C (GallenKamp MoistureE x t r a c t i o n O v e n - M o d e l : B S 2 5 0 ,GallenKamp Co., UK)
The dried powder was screened (sieve size125 µm). Twentyfive grams of thepregelatinized starch was dispersed in200 grams of pyridine in a 1-liter round-bottomflask. One hundred grams of acetic anhydridewas added to the dispersion. The flask wasplaced into an oil bath and maintained at 100ECrotating at low speed inside a fume hood. Toprepare acetylated starches with DS 1.42 and2.62, the reaction was carried out for 3 and 4.5hours respectively with continuous stirring. Atthe end of the reaction, the mixture wastransferred to a beaker and cooled to roomtemperature and the product was precipitatedfrom 1300 ml of ethanol under high shearhomogenization. The precipitate was filtered,washed thoroughly with ethanol to remove theresidual pyridine in the precipitate and, thenfiltered again, before drying in an oven at 40EC(GallenKamp Moisture Extraction Oven-Model:BS 250 GallenKamp Co., UK) (12).
Determination of degree of substitution
One gram of acetylated starch and 50 ml of75% ethanol were mixed in a flask with a loosestopper. The mixture was stirred in a water bathat 50EC for 30 minutes. After cooling to roomtemperature, 40 ml of 0.5 N potassium
hydroxide (KOH) solution was added. Theflask was fitted with a tight stopper and kept atroom temperature for 72 hours shakingoccasionally for complete saponification. Theexcess of alkali in the solution was titrated with0.5 N HCl solution using phenolphthalein asthe indicator. A blank test was performedfollowing the same procedure. The percent ofacetyl group and degree of substitution (DS)were calculated using Equations 1 and 2 (13):
Eq. 1 Acetyl group (%) = V - V x M x 0.043 x 100
S
b s
w
where, Vb is the blank titration volume in ml, Vs
is the sample titration volume in ml, M is themolarity of HCl and Sw is the sample weight ingrams.
Eq. 2Degree of Substitution = 162 x % Acetyl group
4300 - (42 x % Acetyl group)
where, 162 is the molecular weight of theanhydroglucose unit, 42 is the molecular weightof the replaceable acetyl group and 4300 is themolecular weight of the acetyl groups attachedto 100 anhydroglucose units.
Morphology
The shape and size of the native and modifiedstarch granules were determined using ascanning electron microscope (Hitachi SU8030FE-SEM Tokyo, Japan) at an acceleratingpotential of 5.0 kV. All the samples weresputter-coated with Au/Pd prior toexamination.
Fourier Transform Infrared SpectroscopyAnalysis
Starch powder (1% of the KBr amount) wasmixed with the KBr powder and trituration wascarried out using an agate mortar for 5 minutes.The die-set was assembled and the powder-
This Journal is © IPEC-Americas Inc March 2016 J. Excipients and Food Chem. 7 (1) 2016 - 6 DOWNLOAD FREE FROM HTTP://OJS.ABO.FI/JEFCThis material MAY NOT be used for commercial purposessee Creative Commons Attribution NonCommercial‐NoDerivatives 4.0 International
UNIVERSITY
OF I
BADAN LIBRARY
Original Article
mixture was transferred into it. The powderwas pressed for 2 minutes (Thermo QwikHandi-Press P/N 0016-125) to form a thin andtransparent KBr disc. The starches wereanalyzed using a Fourier Transform InfraredSpectroscopy (FTIR) (FT-IR-Thermo NicoletNexus 870 Madison, WI, USA) in transmissionmode. Transmission spectra were recordedusing at least 64 scans with 8 cm-1 resolution inthe spectral range 4000–400 cm-1.
Preparation of the nimesulide microspheres
The nimesulide microspheres were preparedusing the quasi-emulsion solvent diffusionmethod of spherical crystallization. One gramof nimesulide and 2 grams of acetylated Ofadastarch were dissolved completely in 100 ml ofchloroform. In the drug-polymer mixture,1 gram of Aerosil was suspended uniformly byvigorous agitation. The resultant drug-polymer-Aerosil suspension was poured into distilledwater (750 ml) containing 0.08% of SodiumDodecyl Sulphate contained in a 2-liter beakerunder moderate agitation 450-750 RPM(Talboys Laboratory Stirrer Model No: 102USA) and thermally controlled at 38EC(Maplelab Scientific Stirrer-Hotplate SHC-11,UK). Using agitation the suspension wasimmediately dispersed into fine quasi-emulsiondroplets and the drug and polymers co-precipitated in the emulsion droplets. Afteragitating the system for 20 minutes, 750 ml ofSDS was added slowly to promote the diffusionof the chloroform from emulsion droplets intoSDS thereby enhancing the solidification of thequasi-emulsion droplets. Agitation wascontinued for another 40 minutes until thetranslucent quasi-emulsion droplets turned intoopaque microspheres. The solidifiedmicrospheres were recovered by filtration andwashed with water, and the resultant productswere dried in a Gallenkamp BS Oven 250 at50EC for 6 hours. This procedure producedmicrospheres with a varying ratio of drug topolymer and polymer concentrations (1:2 and1:4; 2 and 4 % w/v respectively). The variousbatches and their composition are presented inTable 1.
Table 1 Composition of nimesulide microsphereformulations
INGREDIENTS B1 B2 B3 B4 B5 B6 B7 B8
DRUG (g) 1.0 0.5 2.0 1.0 0.5 1.0 2.0 1.0
ACETYLATED STARCHDS 1.42 (g)
2.0 2.0 4.0 4.0 - - - -
ACETYLATED STARCHDS 2.62 (g)
- - - - 2.0 2.0 4.0 4.0
AEROSIL (g) 1.0 0.5 2.0 1.0 0.5 1.0 2.0 1.0
CHLOROFORM (ml) 100 100 100 100 100 100 100 100
0.08 %w/v SDS SOLUTION(ml)
1500 1500 1500 1500 1500 1500 1500 1500
DRUG:POLYMER 1:2 1:4 1:2 1:4 1:4 1:2 1:2 1:4
POLYMER CONC(% w/v)
2 2 4 4 2 2 4 4
Experimental design
A full 23 factorial experimental design wasperformed using three factors, each at twolevels. The eight possible combinations areshown in Table 2. The degree of substitutionDS (X1), ratio of drug to polymer (X2) andpolymer concentration (X3) were chosen asindependent variables while microsphere size,swelling, entrapment and time taken for 80%drug release (t80) were selected as dependentvariables. The main effects (X1, X2 and X3)represent the average result of changing onefactor at a time from its low to high value.
Characterization of Microspheres
Size and morphology
The morphology and surface characteristics ofthe microspheres were observed using aScanning Electron Microscope (HitachiSU8030 FE-SEM Tokyo, Japan) at anaccelerating potential of 5.0 kV. All the sampleswere sputter-coated with Osmium tetra oxideprior to examination using the Osmium plasmacoater (OPC 60 X1, Japan). The particle sizesof 100 microbeads were determined by opticalmicroscopy.
Swelling index
Exactly 1 ml of microsphere bed was soaked inphosphate buffer (pH 7.4) inside a 10 mlmeasuring cylinder for 12 hours and the swel-
This Journal is © IPEC-Americas Inc March 2016 J. Excipients and Food Chem. 7 (1) 2016 - 7 DOWNLOAD FREE FROM HTTP://OJS.ABO.FI/JEFCThis material MAY NOT be used for commercial purposessee Creative Commons Attribution NonCommercial‐NoDerivatives 4.0 International
UNIVERSITY
OF I
BADAN LIBRARY

Original Article
Table 2 Factorial Design for the formulation and evaluation of batches
BATCHCODE
CODEDLEVELS
REAL VALUESParticle
size (µm)
Swelling
(v/v)
Entrapment (%)
t80
(h)X1 X2 X3
X1
Degree ofsubstitution
X2
Drug : Polymer
X3
Polymerconcentration %
w/v
B1 -1 -1 -1 1.42 1:2 2 50.91 ± 16.22 1.35 ± 0.05 56.75 ± 0.45 2.00 ± 0.21
B2 -1 +1 -1 1.42 1:4 2 57.98 ± 20.15 1.30 ± 0.02 71.60 ± 2.36 3.10 ± 0.30
B3 -1 -1 +1 1.42 1:2 4 54.59 ± 19.67 1.42 ± 0.00 76.75 ± 0.45 3.40 ± 0.18
B4 -1 +1 +1 1.42 1:4 4 74.24 ± 24.73 1.20 ± 0.00 88.02 ± 3.01 4.60 ± 0.36
B5 +1 +1 -1 2.62 1:4 2 21.05 ± 4.25 1.15 ± 0.01 65.48 ± 4.80 5.00 ± 0.50
B6 +1 -1 -1 2.62 1:2 2 30.10 ± 5.33 1.10 ± 0.05 95.80 ± 2.58 5.40 ± 0.40
B7 +1 -1 +1 2.62 1:2 4 40.55 ± 3.85 1.22 ± 0.00 96.65 ± 0.07 7.00 ± 0.45
B8 +1 +1 +1 2.62 1:4 4 46.10 ± 3.85 1.20 ± 0.03 98.28 ± 2.30 7.10 ± 0.96
ling index was calculated as the ratio of thevolume to the original volume after 12 hours.
Entrapment Efficiency
A quantity of microspheres containing 50 mgof drug was accurately weighed and crushedusing a glass mortar and pestle and thensuspended in 50 ml of phosphate buffer, pH7.4. After 24 hours, the solution was filteredand the filtrate was analyzed for drug using aSpectrumlab 752s UV-VIS spectrophotometer(Ningbo Biocotek Scientific Instruments Co.,Ltd, Zheijang, China) at 295 nm. The drugentrapment efficiency (E) was calculated usingEquation 3:
Eq. 3 E (%) = Practical drug content
Theoretical drug content x 100
Drug release study
The in vitro dissolution studies were carried outusing the paddle method (USP XXI), rotated at50 RPM in 900 ml of phosphate buffer, pH 7.4,maintained at 37 ± 0.5EC. The microspheres(containing 100 mg drug) were placed in thedissolution medium. Samples (5 ml) werewithdrawn at different intervals and replacedwith equal amounts of fresh medium. Theamount of nimesulide released was determinedat wavelength of 295 nm, using the
Spectrumlab 752s UV-VIS spectrophotometer.Determinations were done in triplicate.
Modelling and comparison of release profiles
Data obtained from the in vitro release studieswere fitted to various kinetic equations todetermine the kinetics and mechanisms of drugrelease from the microspheres. The results ofthe drug release from the formulations werefitted to Zero Order, First Order, Higuchi (14),Hixon-Crowell (15) and Korsemeyer-Peppasmodels (16). The model of best fit wasidentified by comparing the values ofcorrelation coefficients.
RESULTS AND DISCUSSIONS
Characterization of starches
Acetylated Ofada starches with degrees ofsubstitution of 1.42 ± 0.02 and 2.62 ± 0.07were obtained. The acetyl content of themodified starches were 27.52 ± 0.23% and41.93 ± 0.90 %, respectively.
Scanning Electron Microscopy
The scanning electron micrographs are shownin Figure 1. Native Ofada starch in its nativeform had polyhedral granules with mean
This Journal is © IPEC-Americas Inc March 2016 J. Excipients and Food Chem. 7 (1) 2016 - 8 DOWNLOAD FREE FROM HTTP://OJS.ABO.FI/JEFCThis material MAY NOT be used for commercial purposessee Creative Commons Attribution NonCommercial‐NoDerivatives 4.0 International
UNIVERSITY
OF I
BADAN LIBRARY

Original Article
Figure 2 FTIR spectra for (a) native and (b) acetylatedOfada rice starches.
Figure 3 Scanning Electron Micrograph of nimesulidemicrospheres containing acetylated Ofada rice starch Mg x500.
Figure 1 Scanning electron micrographs of (a) nativeOfada rice starch and (b) acetylated Ofada rice starch Mgx 800.
particle sizes of 2.20 ± 0.05 μm. Acetylation ofstarch disrupted the granular structure of thenative starches and the acetylated starchesshowed significantly (p<0.01) larger, fibrous,irregular aggregates with a mean size of 17.80 ±0.75 μm.
FTIR analysis
The FTIR spectra of native and acetylatedstarches are presented in Figure 2. FTIRspectroscopic analysis showed that thecharacteristic absorption intensities of esterifiedstarch increased with increase in the degree ofsubstitution, and the characterized peak of
hydroxyl group almost disappeared in thespectrum of DS 2.62 acetylated starch. Newbands at 1700 cm-1 (Stretching C=O), 1375 cm-
1(Stretching C-CH3) were observed for theacetylated starches. FTIR bands at 3400cm-1
(Stretching O–H) and 1083cm-1 (C-O-C bondstretching) were weakened, confirming thereplacement of the hydroxyl groups in thestarch molecules with acetyl group (10, 17).
Characterization of microspheres
Microspheres of nimesulide were formulatedusing the acetylated Ofada rice starch aspolymers by the quasi-emulsion solventdiffusion method. Compared with the solventevaporation method for microspherepreparation, the solidification of the liquiddroplet in this process is much faster.Furthermore, the method did not require theuse of antiadhesion agents, such as talc, whichare often used in the evaporation method. Thesize of the micospheres, the entrapment, andrelease characteristics of drugs have beenreported to be dependent on the method usedto prepare the microspheres (18). The scanningelectron micrographs of the nimesulidemicrospheres containing the acetylated starch
This Journal is © IPEC-Americas Inc March 2016 J. Excipients and Food Chem. 7 (1) 2016 - 9 DOWNLOAD FREE FROM HTTP://OJS.ABO.FI/JEFCThis material MAY NOT be used for commercial purposessee Creative Commons Attribution NonCommercial‐NoDerivatives 4.0 International
UNIVERSITY
OF I
BADAN LIBRARY
Original Article
Figure 4 FTIR spectra of nimesulide, acetylated Ofada ricestarch and acetylated starch based nimesulide microspheres.
are shown in Figure 3. The microspheres werediscrete particles that were near-spherical inshape and no drug crystals were observed. Theparticle size analysis revealed that the meandiameter of the microspheres containing starch DS 1.42 was larger than that of DS 2.62.(50.91±16.22 to 74.24±24.73 µm and21.05±4.25 to 46.10±3.85 µm, respectively).Furthermore, as the concentration of starchincreased, the size of the microspheres alsoincreased. Formulations with higherconcentrations of starch produce viscouspolymer solutions which may be difficult tobreakdown into smaller droplets, thus resultingin larger microspheres. The observed increasein surface smoothness with decreasing polymerconcentration could be attributed to the rapid
diffusion of the solvents from the formulationshaving low polymer concentration (19). TheFTIR spectra shown in Figure 4 showed thatthe drug was well entrapped into the polymers.
The characteristic peaks for microspheres in theFTIR spectra was found to be super-imposableto that of the pure drug. There were no extrapeaks, band shift and broadening compared tothe pure drug and polymers, which showed thatthere was no drug polymer interaction.
Experimental design
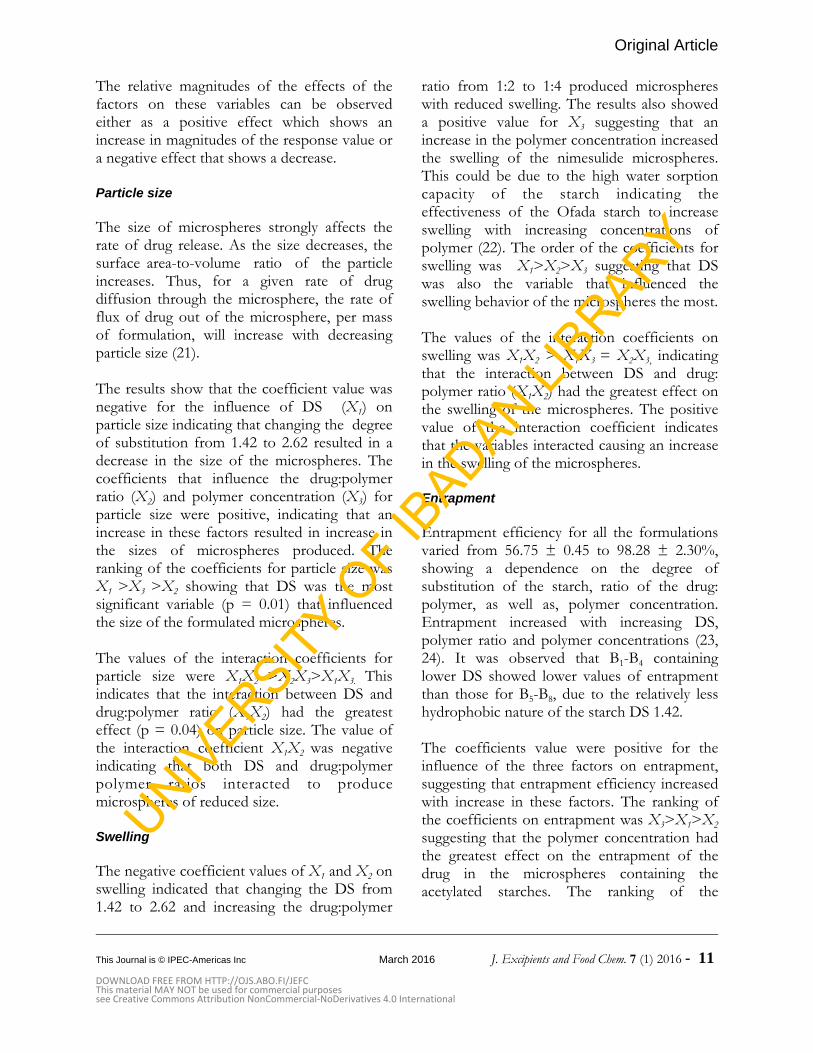
The 23 full factorial experimental design wascarried out using Minitab 16 Statistical Software(Minitab Inc., USA). The experimental designprovides a clear indication of the quantitativeeffects of the three parameters, the degree ofsubstitution of starch polymer (X1), drug:polymer ratio (X2) and polymer concentration(X3) on particle size, swelling, entrapmentefficiency and dissolution time. This allows thethree factors to be varied simultaneously, thusenabling evaluation of the effects of eachvariable at each level as well as showing theinterrelationships among them (20). The codedand real values of the factors and responsevariables are presented in Table 2 while thevalues of the individual and interactioncoefficients are presented in Table 3.
Table 3 Summary of the individual and interaction coefficients of the variables on the particle size, swelling, entrapmentand dissolution time of nimesulide microspheres
FACTOR COEFFICIENTPARTICLE
SIZE(µm)
SWELLINGENTRAPMENT
(%)t80 (h)
X1Effect -12.49 -0.08 7.89 1.43
p-value 0.01 0.33 0.33 0.02
X2Effect 2.90 -0.03 0.32 0.25
p-value 0.06 0.25 0.95 0.13
X3Effect 6.93 0.02 8.76 0.85
p-value 0.02 0.40 0.30 0.04
X1 X2Effect -3.78 0.04 -6.85 0.33
p-value 0.04 0.21 0.37 0.10
X1X3Effect 1.94 0.03 -0.35 0.10
p-value 0.08 0.30 0.95 0.29
X2X3Effect 3.40 -0.03 3.55 0.08
p-value 0.05 0.25 0.57 0.37
This Journal is © IPEC-Americas Inc March 2016 J. Excipients and Food Chem. 7 (1) 2016 - 10 DOWNLOAD FREE FROM HTTP://OJS.ABO.FI/JEFCThis material MAY NOT be used for commercial purposessee Creative Commons Attribution NonCommercial‐NoDerivatives 4.0 International
UNIVERSITY
OF I
BADAN LIBRARY
Original Article
The relative magnitudes of the effects of thefactors on these variables can be observedeither as a positive effect which shows anincrease in magnitudes of the response value ora negative effect that shows a decrease.
Particle size
The size of microspheres strongly affects therate of drug release. As the size decreases, thesurface area-to-volume ratio of the particleincreases. Thus, for a given rate of drugdiffusion through the microsphere, the rate offlux of drug out of the microsphere, per massof formulation, will increase with decreasingparticle size (21).
The results show that the coefficient value wasnegative for the influence of DS (X1) onparticle size indicating that changing the degreeof substitution from 1.42 to 2.62 resulted in adecrease in the size of the microspheres. Thecoefficients that influence the drug:polymerratio (X2) and polymer concentration (X3) forparticle size were positive, indicating that anincrease in these factors resulted in increase inthe sizes of microspheres produced. Theranking of the coefficients for particle size was X1 >X3 >X2 showing that DS was the mostsignificant variable (p = 0.01) that influencedthe size of the formulated microspheres.
The values of the interaction coefficients forparticle size were X1X2 >X2X3>X1X3. Thisindicates that the interaction between DS anddrug:polymer ratio (X1X2) had the greatesteffect (p = 0.04) on particle size. The value ofthe interaction coefficient X1X2 was negativeindicating that both DS and drug:polymerpolymer ratios interacted to producemicrospheres of reduced size.
Swelling
The negative coefficient values of X1 and X2 onswelling indicated that changing the DS from1.42 to 2.62 and increasing the drug:polymer
ratio from 1:2 to 1:4 produced microsphereswith reduced swelling. The results also showeda positive value for X3 suggesting that anincrease in the polymer concentration increasedthe swelling of the nimesulide microspheres.This could be due to the high water sorptioncapacity of the starch indicating theeffectiveness of the Ofada starch to increaseswelling with increasing concentrations ofpolymer (22). The order of the coefficients forswelling was X1>X2>X3 suggesting that DSwas also the variable that influenced theswelling behavior of the microspheres the most.
The values of the interaction coefficients onswelling was X1X2 > X1X3 = X2X3, indicatingthat the interaction between DS and drug:polymer ratio (X1X2) had the greatest effect onthe swelling of the microspheres. The positivevalue of the interaction coefficient indicatesthat the variables interacted causing an increasein the swelling of the microspheres.
Entrapment
Entrapment efficiency for all the formulationsvaried from 56.75 ± 0.45 to 98.28 ± 2.30%,showing a dependence on the degree ofsubstitution of the starch, ratio of the drug:polymer, as well as, polymer concentration.Entrapment increased with increasing DS,polymer ratio and polymer concentrations (23,24). It was observed that B1-B4 containinglower DS showed lower values of entrapmentthan those for B5-B8, due to the relatively lesshydrophobic nature of the starch DS 1.42.
The coefficients value were positive for theinfluence of the three factors on entrapment,suggesting that entrapment efficiency increasedwith increase in these factors. The ranking ofthe coefficients on entrapment was X3>X1>X2
suggesting that the polymer concentration hadthe greatest effect on the entrapment of thedrug in the microspheres containing theacetylated starches. The ranking of the
This Journal is © IPEC-Americas Inc March 2016 J. Excipients and Food Chem. 7 (1) 2016 - 11 DOWNLOAD FREE FROM HTTP://OJS.ABO.FI/JEFCThis material MAY NOT be used for commercial purposessee Creative Commons Attribution NonCommercial‐NoDerivatives 4.0 International
UNIVERSITY
OF I
BADAN LIBRARY

Original Article
Figure 5 Dissolution profile of nimesulide microspheres.
interaction coefficients on entrapment wasX1X2>X2X3>X1X3. The interaction betweenDS and drug:polymer ratio (X1X2) had thegreatest effect on the percentage entrapment ofnimesulide in the microspheres.
Dissolution
The in vitro release of nimesulide from thestarch-based microspheres was carried out in apH 6.8 phosphate buffer media to simulate thephysiological condition. The dissolution profilefor all the batches are shown in Figure 5. Thepercentage cumulative release was lower for theB5-B8 containing starch DS 2.62 than for the B1-B4 containing starch DS 1.42. Microspherescontaining higher polymer ratio and higherpolymer concentration showed a similar trendof cumulative release.
The coefficient values of X1, X2 and X3 on thedissolution time (t80) were positive indicating
the increase in the three factors that producedmicrospheres with longer dissolution times.The ranking of the coefficients on t80 was X1>X3>X2 indicating that the DS had the greatesteffect (p = 0.02) on the time of the release ofnimesulide from the microspheres. The valuesof the interaction coefficients for t80 wereranked as X1X2 >X1X3 >X2X3 showing that DSand drug:polymer ratio (X1X2) interactedsynergistically to prolong the time taken for therelease of nimesulide from the microspheres.
Contour plots were developed by coding thevalues of the degree of substitution and drug:polymer ratio and are shown in Figure 6. Acontour plot is a graphical representation of therelationships among three numeric variables intwo dimensions (25). The contour plots can beused to predict the relevant responses as theyreveal the relative effects of the variables on theresponses. Figures 6 (a), (b), (c) and (d) showthe influence of the DS and the drug:polymer
This Journal is © IPEC-Americas Inc March 2016 J. Excipients and Food Chem. 7 (1) 2016 - 12 DOWNLOAD FREE FROM HTTP://OJS.ABO.FI/JEFCThis material MAY NOT be used for commercial purposessee Creative Commons Attribution NonCommercial‐NoDerivatives 4.0 International
UNIVERSITY
OF I
BADAN LIBRARY

Original Article
Figure 6 Contour plots of (a) size, (b) swelling, (c) entrapment and (d) dissolution time (t80)if nimesulide microspheres as a function of the degree of substitution of starch and theconcentration of starch.
ratio on the size, swelling, entrapment and t80
respectively. The darker region of the plotsshows that the degree of substitution exerted ahigher effect on the entrapment and dissolutiontime than drug:polymer ratio in the acetylatedOfada starch-based nimesulide microsphereformulations. The contour plots show that theacetylated Ofada rice starch with DS 2.62 wassuitable for the microsphere formulationsbecause they were capable of high entrapmentefficiency and sustained release.
Drug Release Kinetics and Models
Drug release from polymeric microspheres canoccur in 3 phases. First, through rapid release(burst release) that is attributed to drug that isadhered to the wall of the microspheres.Second, through slow release, which dependson the degradation kinetics of the polymer usedin the microspheres and third throughaccelerated delayed release, which depends onthe diameter of the microsphere (18, 19). Thetwo main factors that influence drug release
This Journal is © IPEC-Americas Inc March 2016 J. Excipients and Food Chem. 7 (1) 2016 - 13 DOWNLOAD FREE FROM HTTP://OJS.ABO.FI/JEFCThis material MAY NOT be used for commercial purposessee Creative Commons Attribution NonCommercial‐NoDerivatives 4.0 International
UNIVERSITY
OF I
BADAN LIBRARY

Original Article
from polymeric microspheres are thedegradation of the polymer matrix anddiffusion, both of which are influenced by thepolymer morphology (18).
Acetylated Ofada rice starch used in this studyis an amorphous and biodegradable material inwhich acetylation of the starch reduces itsenzymatic degradation, thereby improving itspotential as a carrier system. Thebiodegradation of acetylated starch is known tobe inversely proportional to its degree ofsubstitution (26). At the initial stage of drugrelease from the starch-based microspheres,nimesulide loosely bound on the surface of themicrospheres is released by a mechanism ofdiffusion through the surface due to wateruptake immediately after exposure. At the laterstage, the drug releases more slowly, the ratebeing determined by the diffusion through thepolymer matrix. The diffusion of thenimesulide occurs through the amorphousregion of the starch polymer. Simulating thedrug kinetics using different models (Zeroorder, First order, Higuchi, Hixon-Crowell andKorsemeyer-Peppas) as presented in Table 4, itwas observed that generally, drug release for themicrospheres containing acetylated Ofada ricestarch with DS 1.42 (Formulations B1, B2 andB3) fitted the First Order kinetic model with theexception of B4 which fitted the Korsmeyer-Peppas model (n= 0.3997).
Table 4 Correlation coefficients obtained for release ofnimesulide from microspheres using different kineticmodels (n = 3)
FORMULATIONZERO
ORDERFIRST
ORDERHIGUCHI
HIXSON-CROWELL
KORSMEYER
R2 n
B1 0.6461 0.9785 0.8768 0.8722 0.8472 0.3116
B2 0.6786 0.9296 0.8990 0.9258 0.9203 0.3187
B3 0.7547 0.9812 0.9389 0.9356 0.9152 0.4048
B4 0.8407 0.9176 0.9783 0.9783 0.9823 0.3997
B5 0.9130 0.9644 0.9829 0.9846 0.9652 0.6446
B6 0.9363 0.9718 0.9793 0.9905 0.9775 0.2727
B7 0.9936 0.9006 0.9540 0.9848 0.9975 0.7727
B8 0.9961 0.8846 0.9315 0.9821 0.9964 0.8716
In a First Order model, drug release isdependent on the remaining concentration of
drug in the microspheres. The microspherescontaining acetylated Ofada rice starch withthe DS 2.62 in B5 and B6 fitted the Higuchimodels as indicated by their correlationcoefficients. Higuchi developed theoreticalmodels to study the release of highly andminimally water-soluble drugs incorporated inan insoluble matrix. According to this model,drug release was a diffusion process that wasdependent on the square root of time. Higuchiproposed this model of drug release based onthe assumptions that the initial concentration ofdrug in the matrix is much higher than the drugsolubility; matrix swelling and dissolution arenegligible (14). Formulations B7 and B8 showedsimilar drug release kinetics to B4 i.e., theKorsmeyer-Peppas model (n = 0.7727 and0.8716 respectively). In this model, the value ofn characterizes the release mechanism of thedrug. When 0.45 # n, this corresponds to aFickian mechanism, 0.45 < n < 0.89 to nonFickian transport, n = 0.89 to case II(relaxational transport) and n > 0.89 to supercase II transport (16, 27). From the values ofthe slopes, the drug release mechanism fromthe formulation B4 containing the acetylatedOfada starch DS 1.42 is considered Fickianwhile those of B7 and B8 are non-Fickian.
CONCLUSION
Acetylated Ofada starches with degrees ofsubstitution of 1.42 ± 0.02 and 2.62 ± 0.07were used in the formulation of nimesulidemicrospheres at varying drug:polymer ratiosand polymer concentrations. Microspherescontaining acetylated Ofada rice starch DS 2.62showed significantly smaller particle size,reduced swelling, higher entrapment and longerdissolution times. The degree of substitutionwas the most significant variable that influencedthe size, swelling and dissolution time ofnimesulide microspheres while polymerconcentration had the most influence onentrapment. The drug release fitted mainly intothe Korsmeyer kinetic models, as well as, First
This Journal is © IPEC-Americas Inc March 2016 J. Excipients and Food Chem. 7 (1) 2016 - 14 DOWNLOAD FREE FROM HTTP://OJS.ABO.FI/JEFCThis material MAY NOT be used for commercial purposessee Creative Commons Attribution NonCommercial‐NoDerivatives 4.0 International
UNIVERSITY
OF I
BADAN LIBRARY
Original Article
Order and Higuchi kinetic models. This studysuggests the usefulness of acetylated Ofada ricestarches with the DS 2.62 for the formulationof microspheres with high entrapment andprolonged drug release which can serve as asuitable substitute to synthetic polymers in drugdelivery.
DECLARATION OF CONFLICT OF INTEREST
The authors hereby declare that there is noconflict of interest.
REFERENCES
1 Singh MN, K.S.Y. Hemant KSY, Ram M, andShivakumar HG. Microencapsulation: A promisingtechnique for controlled drug delivery. Res PharmSci.5(2): 65 - 77, 2010.
2 Sam M, Gayathri D, Prasanth V, Vinod B. NSAIDs asmicrospheres, The Internet J. Pharmacol, 6(1): 4194-4200, 2008.
3 Huber KC, BeMiller JN. Channels of maize andsorghum starch granules. Carbohydr. Polym. 41:269 –276, 2000.
4 Huang J, Schols HA, Klaver R, Jin Z, Voragen AGJ.Acetyl substitution patterns of amylose andamylopectin populations in cowpea starch modifiedwith acetic anhydride and vinyl acetate. CarbohyrPolym., 67: 542 – 550, 2007.
5 Rutenberg, M; Solarek, D., Cereals in: .Whistler RL,Bemiller JN, Paschall EF (eds), Starch: Chemistry andTechnology 2nd ed., Academic Press, New York, pp.311-351, 1984.
6 Korhonen O, Raatikainen P, Harjunen P, Nakari J,Suihko E, Peltonen S, Vidgren M, Paronen P. Starchacetates-multifunctional direct compressionexcipients, Pharm. Res, 17(9): 1138-1143, 2000.
7 Tuovinen L, PeltonenS, Järvinen K, Drug releasefrom starch-acetate films, J. Control. Rel. 91 (3): 345-354, 2003.
8 Danbaba N, Anounye J, Gana AS, Abo ME,Ukwungwu MN. Grain quality characteristics ofOfada rice (Oryza sativa L): Cooking and eatingquality, Int. Food Res. J. 18: 629-634, 2011.
9 Davis N, Brogden RN, Nimesulide: an update of itspharmacodynamic and pharmacokinetic propertiesand its therapeutic efficacy, Drugs 48: 431-454, 1994.
10 Okunlola A, Adebayo SA, Adeyeye MC. Solid StateCharacterization of Two Tropical Starches Modifiedby Pregelatinization and Acetylation: Potential asExcipients in Pharmaceutical Formulations. British J.Pharm. Res. 5 (1):58-71, 2015.
11 Singh A, Nath L., Evaluation of acetylated moth beanstarch as a carrier for controlled drug delivery. Int. J.Bio. Macromol. 50(2):362-368, 2012.
12 Okunlola A, T.O. Ogunkoya TO. Acetylated starch ofOfada rice as a sustained release polymer inmicrosphere formulations of repaglinide, Nigerian J.Pharm. Res. 11 (1): In press, 2015.
13 Ogawa K, Hirai L, Shimasaki C, Yoshimura T, Ono S,Rengakuji S, Nakamura Y, Yamazaki I. Simpledetermination method of degree of substitution forstarch acetate. Bull. Chem. Soc. Japan, 72: 2785-2790,1999.
14 Higuchi T. Rate of release of medicaments fromointment bases containing drugs in suspension, JPharm Sci., 50 (10): 874-875, 1961.
15 Hixson A, Crowell J. Dependence of reaction velocityupon surface and agitation, Ind. Eng. Chem., 23: 923-931, 1931.
16 Korsemeyer R, Gurny R, Doelker E, Buri P, PeppasN. Mechanism of solute release from poroushydrophilic polymers, Int. J Pharm., 15: 25-35, 1985.
17 Zhigang L, Zidan L. Homogeneous synthesis andcharacterization of starch acetates in ionic liquidwithout catalysts, Starch/Starke, 64:37-49, 2012.
18 Martins FK, Messias DA, Leite FL, Eliana AR, DuekAR. Preparation and characterization of paclitaxel-loaded PLDLA microspheres. Mat. Res, 17(3), 2014dx.doi.org/10.1590/S1516-14392014005000028
19 Jagtap, YM, Bhujbal RK, Ranade AN, Ranpise NS.Effect of Various Polymers Concentrations onPhysicochemical Properties of Floating Microspheres.Indian J. Pharm, 74(6): 512–520, 2012. doi: 10.4103/0250-474X.110578
20 Okunlola A, Akingbala O. Characterization andevaluation of acid-modified starch of Dioscoreaoppositifolia (Chinese yam) as a binder in chloroquinephosphate tablets. Brazilian J. Pharm. Sci., 49 (4): 699-
This Journal is © IPEC-Americas Inc March 2016 J. Excipients and Food Chem. 7 (1) 2016 - 15 DOWNLOAD FREE FROM HTTP://OJS.ABO.FI/JEFCThis material MAY NOT be used for commercial purposessee Creative Commons Attribution NonCommercial‐NoDerivatives 4.0 International
UNIVERSITY
OF I
BADAN LIBRARY
Original Article
708, 2013.
21 Kim KK, Pack DW. Microspheres for drug deliveryin: Ferrari M; Lee A; Lee J. (eds.), BioMEMs andBiomedical Nanotechnology Springer bookPublishing Company USA (2006) 19 – 50.
22 Okunlola A, Patel RP, Odeku OA. Formulationoptimization of floating microbeads containingmodified Chinese yam starch using factorial design. J.Excip.Food Chem. 3(1):17-25, 2012.
23 Re, M.I.; Biscans, B., Preparation of microspheres ofketoprofen with acrylic polymers by a quasi-emulsionsolvent diffusion method, Powder Technology,Volume 101, Number 120-133(14), 1999.
24 Dhanaraju DM, Sathyamoorthy N, Sundar VD,
Suresh C. Preparation of poly (epsilon-caprolactone)microspheres containing etoposide by solventevaporation method. J. Pharm.Sci, 5(3): 114-122,2010.
25 Okunlola A, Odeku OA, Lamprecht A, OyagbemiAA, Oridupa OA, Aina OO. Design ofcissus–alginate microbeads revealing mucoprotectionproperties in anti-inflammatory therapy. Int. J. BioMacromol, 79: 226–234, 2015.
26 Seal KJ. Chemistry and Technology of biodegradablepolymers. GJL Griffin (Ed.), Blackie Academic andProfessional 116-134, 1994.
27 Siepmann J, Peppas NA. Modeling of drug releasefrom delivery systems based on hydroxypropylmethylcellulose (HPMC). Adv. Drug Del. Rev.,48:139 -157, 2001.
This Journal is © IPEC-Americas Inc March 2016 J. Excipients and Food Chem. 7 (1) 2016 - 16 DOWNLOAD FREE FROM HTTP://OJS.ABO.FI/JEFCThis material MAY NOT be used for commercial purposessee Creative Commons Attribution NonCommercial‐NoDerivatives 4.0 International
UNIVERSITY
OF I
BADAN LIBRARY