Impact of Confining Stress on Capillary Pressure Behavior ...
13
Impact of Confining Stress on Capillary Pressure Behavior During Drainage Through Rough Fractures Josimar A. da Silva 1 , Peter K. Kang 2 , Zhibing Yang 3 , Luis Cueto-Felgueroso 4,5 , and Ruben Juanes 1,5 1 Department of Earth, Atmospheric, and Planetary Sciences, Massachusetts Institute of Technology, Cambridge, MA, USA, 2 Department of Earth Sciences, University of Minnesota, Twin Cities, Minneapolis, MN, USA, 3 State Key Laboratory of Water Resources and Hydropower Engineering Science, Wuhan University, Wuhan, China, 4 School of Civil and Environmental Engineering, Technical University of Madrid, Madrid, Spain, 5 Department of Civil and Environmental Engineering, Massachusetts Institute of Technology, Cambridge, MA, USA Abstract We study, numerically, the behavior of capillary pressure (P c ) during slow immiscible displacement in a rough fracture as a function of the degree of fracture aperture heterogeneity that results from two distinct mechanisms: normal confining stress and fracture surface correlation. We generate synthetic self-affine rough fractures at different correlation scales, solve the elastic contact problem to model the effect of confining stress, and simulate slow immiscible displacement of a wetting fluid by a nonwetting one using a modified invasion percolation model that accounts for in-plane curvature of the fluid-fluid interface. Our modeling results indicate that the power spectral density, S(f), of P c , can be used to qualitatively characterize fracture aperture heterogeneity. We show that the distribution of forward avalanche sizes follows a power law N (S )∝ S − , with exponent = 2, in agreement with previously reported values for porous media and equal to the expected theoretical exponent for a self-organized criticality process. 1. Introduction The slow immiscible displacement of a wetting fluid by a nonwetting one in porous media, a process known as drainage, is governed by capillary forces (Holtzman et al., 2012; Lenormand et al., 1983, 1988; Måløy et al., 1992; Wilkinson & Willemsen, 1983). This flow regime has a number of important practical applications, such as geological CO 2 storage (Pruess, 2008), underground nuclear waste disposal (Nuske et al., 2010), and secondary oil migration (Meakin et al., 1992). During slow drainage in porous media, the invasion process is marked by intermittency with bursts of fluid invasion, or avalanches, in which capillary pressure fluctu- ates rapidly, followed by quiescent periods with no interface motion (Berg et al., 2013; Biswas et al., 2018; Furuberg et al., 1996; Haines, 1930; Måløy et al., 1992; Moebius & Or, 2014). Experiments and numerical sim- ulations have shown that these rapid capillary pressure fluctuations depend on the degree of organization of the porous medium (Biswas et al., 2018; Moura et al., 2017). While porous rocks account for the bulk of fluid volume in the subsurface, in low permeability media most of the fluid flow may take place through networks of interconnected fractures. Natural fractures differ sig- nificantly from porous media because they consist of rough surfaces with variable degree of roughness and a distinct self-affine correlation structure (Brown, 1995; Brown & Scholz, 1985a; Power & Tullis, 1991). Another key difference is that, in its natural setting, a single fracture is subject to large geological confin- ing stresses that compress the two sides of the rough fracture and reduce the available space for fluid flow (Brown & Scholz, 1985b; Jaeger & Cook, 1979; Kang et al., 2016; Pyrak-Nolte & Nolte, 2016; Pyrak-Nolte & Morris, 2000; Wang & Cardenas, 2016; Zimmerman & Bodvarsson, 1996). Thus, given these differences rela- tive to porous media, it is unclear whether capillary pressure during slow drainage through a rough fracture, at different confining stresses, behaves similarly to its porous media counterpart. Previous investigations of drainage through rough fractures have focused on the impact of confining stress on macroscopic properties such as relative permeability and pressure-saturation relations. Experiments and numerical modeling have shown that increasing confining stress increases fracture roughness and fracture RESEARCH LETTER 10.1029/2019GL082744 Key Points: • In-plane interface curvature impacts signature of capillary pressure during drainage in rough fractures • Hierarchical avalanche size distribution is consistent with a system that exhibits self-organized criticality • Power spectrum of capillary pressure suggests increased self-organization as confining stress increases Supporting Information: • Supporting Information S1 Correspondence to: R. Juanes, [email protected] Citation: da Silva, J. A., Kang, P. K., Yang, Z., Cueto-Felgueroso, L., & Juanes, R. (2019). Impact of confining stress on capillary pressure behavior during drainage through rough fractures. Geophysical Research Letters, 46, 7424–7436. https://doi.org/10.1029/ 2019GL082744 Received 7 MAR 2019 Accepted 21 JUN 2019 Accepted article online 3 JUL 2019 Published online 15 JUL 2019 ©2019. American Geophysical Union. All Rights Reserved. DA SILVA ET AL. 7424
Transcript of Impact of Confining Stress on Capillary Pressure Behavior ...

Impact of Confining Stress on Capillary PressureBehavior During Drainage ThroughRough Fractures
Josimar A. da Silva1 , Peter K. Kang2 , Zhibing Yang3 , Luis Cueto-Felgueroso4,5 ,and Ruben Juanes1,5
1Department of Earth, Atmospheric, and Planetary Sciences, Massachusetts Institute of Technology, Cambridge, MA,USA, 2Department of Earth Sciences, University of Minnesota, Twin Cities, Minneapolis, MN, USA, 3State KeyLaboratory of Water Resources and Hydropower Engineering Science, Wuhan University, Wuhan, China, 4School ofCivil and Environmental Engineering, Technical University of Madrid, Madrid, Spain, 5Department of Civil andEnvironmental Engineering, Massachusetts Institute of Technology, Cambridge, MA, USA
Abstract We study, numerically, the behavior of capillary pressure (Pc) during slow immiscibledisplacement in a rough fracture as a function of the degree of fracture aperture heterogeneity that resultsfrom two distinct mechanisms: normal confining stress and fracture surface correlation. We generatesynthetic self-affine rough fractures at different correlation scales, solve the elastic contact problem tomodel the effect of confining stress, and simulate slow immiscible displacement of a wetting fluid by anonwetting one using a modified invasion percolation model that accounts for in-plane curvature of thefluid-fluid interface. Our modeling results indicate that the power spectral density, S(f), of Pc, can be usedto qualitatively characterize fracture aperture heterogeneity. We show that the distribution of forwardavalanche sizes follows a power law N𝑓 (S𝑓 ) ∝ S−𝛼
𝑓, with exponent 𝛼 = 2, in agreement with previously
reported values for porous media and equal to the expected theoretical exponent for a self-organizedcriticality process.
1. IntroductionThe slow immiscible displacement of a wetting fluid by a nonwetting one in porous media, a process knownas drainage, is governed by capillary forces (Holtzman et al., 2012; Lenormand et al., 1983, 1988; Måløy et al.,1992; Wilkinson & Willemsen, 1983). This flow regime has a number of important practical applications,such as geological CO2 storage (Pruess, 2008), underground nuclear waste disposal (Nuske et al., 2010), andsecondary oil migration (Meakin et al., 1992). During slow drainage in porous media, the invasion processis marked by intermittency with bursts of fluid invasion, or avalanches, in which capillary pressure fluctu-ates rapidly, followed by quiescent periods with no interface motion (Berg et al., 2013; Biswas et al., 2018;Furuberg et al., 1996; Haines, 1930; Måløy et al., 1992; Moebius & Or, 2014). Experiments and numerical sim-ulations have shown that these rapid capillary pressure fluctuations depend on the degree of organizationof the porous medium (Biswas et al., 2018; Moura et al., 2017).
While porous rocks account for the bulk of fluid volume in the subsurface, in low permeability media mostof the fluid flow may take place through networks of interconnected fractures. Natural fractures differ sig-nificantly from porous media because they consist of rough surfaces with variable degree of roughness anda distinct self-affine correlation structure (Brown, 1995; Brown & Scholz, 1985a; Power & Tullis, 1991).Another key difference is that, in its natural setting, a single fracture is subject to large geological confin-ing stresses that compress the two sides of the rough fracture and reduce the available space for fluid flow(Brown & Scholz, 1985b; Jaeger & Cook, 1979; Kang et al., 2016; Pyrak-Nolte & Nolte, 2016; Pyrak-Nolte &Morris, 2000; Wang & Cardenas, 2016; Zimmerman & Bodvarsson, 1996). Thus, given these differences rela-tive to porous media, it is unclear whether capillary pressure during slow drainage through a rough fracture,at different confining stresses, behaves similarly to its porous media counterpart.
Previous investigations of drainage through rough fractures have focused on the impact of confining stresson macroscopic properties such as relative permeability and pressure-saturation relations. Experiments andnumerical modeling have shown that increasing confining stress increases fracture roughness and fracture
RESEARCH LETTER10.1029/2019GL082744
Key Points:• In-plane interface curvature impacts
signature of capillary pressure duringdrainage in rough fractures
• Hierarchical avalanche sizedistribution is consistent with asystem that exhibits self-organizedcriticality
• Power spectrum of capillary pressuresuggests increased self-organizationas confining stress increases
Supporting Information:• Supporting Information S1
Correspondence to:R. Juanes,[email protected]
Citation:da Silva, J. A., Kang, P. K., Yang, Z.,Cueto-Felgueroso, L., & Juanes, R.(2019). Impact of confining stress oncapillary pressure behavior duringdrainage through rough fractures.Geophysical Research Letters, 46,7424–7436. https://doi.org/10.1029/2019GL082744
Received 7 MAR 2019Accepted 21 JUN 2019Accepted article online 3 JUL 2019Published online 15 JUL 2019
©2019. American Geophysical Union.All Rights Reserved.
DA SILVA ET AL. 7424

Geophysical Research Letters 10.1029/2019GL082744
contact area, resulting in lower relative permeability values and a reduction in displacement efficiency(Bertels et al., 2001; Huo & Benson, 2016; Lian & Cheng, 2012; McDonald et al., 1991; Pyrak-Nolte et al., 1990;Watanabe et al., 2015). Similarly, the capillary pressure-saturation relation for slow drainage through roughfractures has been modeled using empirical and semianalytic models obtained for porous media, such asBrooks-Corey (Brooks & Corey, 1964), van Genuchten (van Genuchten, 1980), and 𝜈-type models (Watanabeet al., 2015). Measurements of the capillary pressure-saturation relationship during slow drainage througha natural rough fracture have shown good agreement with the Brooks-Corey function (Reitsma & Kueper,1994), whereas numerical simulations using a continuum-based model indicates that both Brooks-Coreyand van Genuchten models yield similar results (Yang et al., 2013). These experiments and numerical simu-lations were conducted under prescribed pressure, which is slowly increased in order to force invasion intothe fracture. Here, in contrast, we are interested in the capillary pressure behavior for a flow rate controlledboundary condition, which allows capillary pressure to vary as the invasion into the fracture proceeds.
Measurements and simulations of capillary pressure (Pc) during slow drainage have been extensivelyreported for the case of imposed flow rate in porous media (Aker et al., 2000; Biswas et al., 2018; Furuberget al., 1996; Måløy et al., 1992; Moebius & Or, 2014; Moura et al., 2015, 2017). Similar measurements for arough fracture are scarce. Persoff and Pruess (1995) were the first ones to report, experimentally, Pc vari-ations during slow drainage through a rough fracture. In their experimental configuration, the fractureaperture structure was kept constant and the boundary conditions were changed. They observed strongphase interference and cyclical pressure variations, associated with flow instabilities, that were interpretedas the interaction between capillary pressure and pressure drop due to viscous flow. Auradou et al. (2003)numerically modeled Pc in a vertical gouge-filled fracture but did not investigate the sensitivity of Pc to thedegree of fracture aperture heterogeneity. Other studies of drainage through rough fractures have focused,for example, in the quantification of amount of trapping of the defending phase (Yang et al., 2016) andcrossover from capillary fingering to viscous fingering (Chen et al., 2017; Chen, Guo, Wu, et al., 2018; Chen,Wu, Fang, et al., 2018).
In addition to characterizing Pc variations, we are interested in characterizing avalanches, or invasionbursts, associated with the rapid capillary pressure fluctuations in rough fractures. The scaling behavior ofavalanche size is well known for drainage in porous media (Aker et al., 2000; Biswas et al., 2018; Maslov,1995), but it is unclear whether such scaling extends to slow drainage through a rough fracture.
In our numerical simulations, we first generate self-affine fracture surfaces with different degrees of spatialcorrelation (Brown, 1995), solve the elastic contact problem between both surfaces to model the impact ofconfining stress (Kang et al., 2016), and then perform simulations of slow drainage using both the originalinvasion percolation algorithm (Wilkinson & Willemsen, 1983) and a modified invasion percolation methodthat accounts for the fluid-fluid in-plane curvature (Glass et al., 1998, 2003 ; Yang et al., 2012). Here, wedesign our numerical experiment to mimic a condition of controlled volume (constant flow rate). The ideabehind “volume control” is that the displacement—assumed to be quasi-static—is conducted one pixel ata time, which permits in turn to track the minimum capillary entry pressure (or, simply, the capillary pres-sure) at each single-pixel invasion event. This capillary pressure record exhibits positive and negative jumpsthrough the displacement process. This differs from “pressure control,” a protocol in which, even if the dis-placement is assumed to be quasi-static, the capillary pressure is monotonically increasing, with associatedavalanches in the volume of fluid displaced. We then analyze the behavior of the capillary pressure as a func-tion of the degree of heterogeneity in the aperture field that results from different confining stresses anddifferent fracture aperture correlation lengths.
2. Rough Fracture Generation and Flow Modeling2.1. Fracture Aperture GenerationWe construct synthetic rough-walled fractures using the spectral synthesis method (Brown, 1995; Kang et al.,2016). In this method, each fracture surface is decomposed into its power spectral density function and aphase spectrum. The power spectral density G(k) exhibits a power law decay with wavenumber k = 2𝜋∕𝜆,where 𝜆 is wavelength, as
G(k) = Ck−𝜉 , (1)
where the exponent 𝜉 is related to the fractal dimension D of the fracture surface as D = (7 − 𝜉)∕2 andthe intercept C is determined by the standard deviation of surface heights 𝜎f . Measurements of surface
DA SILVA ET AL. 7425

Geophysical Research Letters 10.1029/2019GL082744
Figure 1. (a) Example of fracture aperture at low confining stress, 𝜎n = 0.02 MPa. Here, we show an aperture fieldgenerated from self-affine fracture surfaces with mismatch length scale Lc = L∕8. (b) Same as (a) but for a largerconfining stress, 𝜎n = 0.15 MPa. The white arrows indicate the flow direction. (c) Cumulative aperture distribution,FB(b∕b̄), at different confining stresses. Each line corresponds to the average of 20 fracture aperture fields. (d) Averagecoefficient of variation, 𝛿 = 𝜎b∕b̄, where 𝜎b is the aperture standard deviation and b̄ is the mean fracture aperture, as afunction of confining stress.
roughness in several rock fractures have shown that D tends to fall in the range 2 ≤ D ≤ 2.5 (Brown &Scholz, 1985a). Values of D close to 2 and 2.5 result in smoother and rougher surfaces, respectively (Brown& Scholz, 1985a; Power & Tullis, 1991). Here we fix D = 2.5 to construct rough surfaces.
The phase spectrum of an individual fracture surface is assumed to be a random process independent ofthe frequency. Thus, different fracture surfaces can be generated by changing the seed used in the randomnumber generator. Measurements of the fracture surface heights have shown that they are uncorrelated atsmall wavelengths and correlated at long wavelengths (Brown & Scholz, 1985a). To model this process, Kanget al. (2016) introduced a phase correlation function 𝛾 = 1
2[1 + erf(− k−kc
𝜇)], where 𝜇 is a model parameter
that determines the rate of correlation decay, here fixed at 𝜇 = 6. kc = 1∕Lc is the wavenumber at which thephase correlation between top and bottom surfaces is 0.5, and Lc is the mismatch length scale, beyond whichthe fracture surfaces are correlated. Here we choose Lc = L∕8, L∕16, L∕32, L∕64, where L is the domainsize, to investigate also the impact of the fracture correlation length, along with confining stresses, on thecapillary pressure behavior.
Based on previous work, we construct a numerical model of a synthetic fracture with dimensions of0.65 m × 0.65 m (Neuweiler et al., 2004; Yang et al., 2012). We discretize the fracture surface using1, 024×1, 024 pixels, where each pixel has dimensions dx = dy = 0.63 mm, and generate several fracture sur-faces using different seeds for the random number generator. Figure 1a shows an example of the resultingfracture aperture field.
DA SILVA ET AL. 7426
Geophysical Research Letters 10.1029/2019GL082744
2.2. Modeling the Impact of Confining Stress on Fracture ApertureWe consider fracture apertures generated from self-affine fracture surfaces with different correlation lengths.To model the impact of confining stress on the fracture aperture, we assume a linear elastic medium andfollow the procedure described in Kang et al. (2016). The fracture aperture is represented by its compositetopography (Brown, 1995), which is given by the sum of the fracture surface heights relative to a parallelreference plate.
We model the deformation of the aperture field, represented by its composite topography, as a flat rigidsurface makes contact with it. The deformation of the composite topography is constrained such that thereis no interpenetration between the two surfaces. In the areas where interpenetration occurs, resulting inan aperture less than or equal to zero, the compressive normal stress S(x, y) is positive and the compositetopography surface deforms elastically. In areas where the aperture is greater than zero, the compressivestress is zero. This is a mixed boundary value problem, where displacements are defined over parts of thesurface and normal stress over the remainder of the surface.
To model the elastic displacement of the composite topography due to an applied normal stress S(x, y),we use the analytical solution for normal displacement due to a point force on an elastic half-spaceknown as Boussinesq solution, B(r) = (1−𝜈)
2𝜋G1r
, where r is the distance to where the point load is applied,r =
√(x − x′)2 + (𝑦 − 𝑦′)2, 𝜈 is the Poisson ratio, and G is the shear modulus. The normal displace-
ment w(x, y) due to stress field S(x, y) is obtained by convolution of the Boussinesq solution: w(x, 𝑦) =∫∫ S(x′, 𝑦′)B(r)dx′d𝑦′ (Andrews, 1988; Unger & Mase, 1993) . The solution to the mixed boundary valueproblem is obtained using the two-dimensional Fast Fourier Transform (FFT), which makes the solutionbiperiodic (Kang et al., 2016). In our simulations, we used G = 20 GPa and 𝜈 = 0.25, which are valuescorresponding to Berea sandstone under confining stress around 30 MPa (Mavko et al., 2009).
The elastic deformation is controlled by the effective stress, which is the difference between confining totalstress and fluid pressure. Because we assume quasi-static displacements, the viscous pressure drop is zero,and the only contribution to pressure differences within the fracture is the capillary pressure. Values ofcapillary pressure in our system are ∼1 kPa, several orders of magnitude smaller than confining stresses∼1 MPa (Figure 1d). Thus, it is reasonable to assume that the influence of fluid pressure variations withinthe fracture can be neglected.
The solution is obtained by iteratively updating S(x, y) until the stress field satisfies the zero-interpenetrationcondition everywhere. During the iteration, where there is an overlap (negative fracture aperture), thenormal stress is changed to be more compressive. The normal stress is used to recalculate the elastic displace-ment, the aperture is then recalculated, and the procedure is repeated until a threshold value is met. Solvingthe elastic deformation problem does lead to different fracture geometry compared with simply removingthe overlaps between the two surfaces, especially at high normal stress.
As expected, a high confining stress leads to large contact area between the fracture surfaces, while a lowconfining stress results in almost no contact area. This behavior can be synthesized by computing variationsin the cumulative fracture aperture, FB(b), with the confining stress (Figure 1c). Increasing the confiningstress causes the mean fracture aperture to decrease and the standard deviation to increase. We have verifiedthat the shape of FB is nearly independent of the fracture correlation length scale, indicating that variationsin the confining stress exert the main control in the cumulative fracture aperture distribution.
2.3. Modified Invasion Percolation (MIP)Invasion Percolation (IP) was introduced by Wilkinson and Willemsen (1983) as an extension of ordinarypercolation (Broadbent & Hammersley, 1957) to model the slow immiscible displacement of a wetting fluidby a nonwetting one in porous media. In the IP model, it is assumed that flow is quasi-static, and therefore,viscous forces vanish and flow is controlled by the capillary pressure at the interface between the two fluids.
To simulate slow drainage through horizontal rough fractures shown in Figure 1, we use the original IPmodel (Wilkinson & Willemsen, 1983) and a MIP model to account for the fluid-fluid interface curvatureon the plane of the fracture (Glass et al., 1998, 2003; Yang et al., 2012). In both IP models, we allow for trap-ping of the defending fluid. The MIP model was originally proposed by Glass et al. (1998)—they introduceda “curvature number” C controlling the influence of the in-plane curvature relative to the aperture-inducedcurvature. Later, this approach to account for the in-plane curvature was modified by Yang et al. (2012),who proposed local fitting of a circle to estimate the in-plane curvature along the fluid-fluid interface. These
DA SILVA ET AL. 7427

Geophysical Research Letters 10.1029/2019GL082744
studies have shown that in-plane curvature can significantly influence the predictions of fluid trapping(Glass et al., 2003; Yang et al., 2016).
We conceptualize the fracture aperture as a square lattice where each pixel has a fourfold connectivity to theneighbor pixels on the lattice. Flow occurs from the left boundary to the right boundary of the fracture, withno flow through the top and bottom boundaries (Figure 1b). The threshold invading pressure for each site onthe fracture plane is calculated according to aperture and interface geometries. The site which is connectedto the invasion boundary (nonwetting fluid) and has the smallest threshold invading pressure is identifiedand invaded. This event modifies the list of available sites connected to the nonwetting phase, and again,available sites are sorted and the site with the smallest pressure is invaded, and so on. We take into accountdefending phase trapping; that is, the sites that are surrounded by the invading fluid are removed from thelist of available sites.
The threshold invading pressure, assuming that the pressure in the defending phase is negligible, iscalculated according to the Young-Laplace equation as
Pc = 2𝛾H = 𝛾(k1 + k2) = 𝛾
(1r1
+ 1r2
), (2)
where 𝛾 is the interfacial tension (here taken to be 𝛾 = 72 mN/m, considering an air-water system at atemperature of 25 ◦C), H is the mean curvature, k1 = 1∕r1 and k2 = 1∕r2 are the two principal curvatureswith radii r1 and r2, respectively. k1 is termed the out-of-plane or aperture-induced curvature, and k2 is thein-plane curvature. Assuming that the fracture walls are symmetric about a mean plane, r1 is related to thelocal aperture b and the contact angle 𝜃 as r1 = b∕(2 cos 𝜃). The aperture-induced radius r1 is always positivesince b is always positive and for strong drainage we have 0 ≤ 𝜃 ≪ 90◦. To compute the in-plane curvaturek2, we use the adaptive circle-fitting method proposed by Yang et al. (2012). In this method, the in-planeradius of curvature r2 is adaptively computed by fitting a circle using the coordinates of the neighboringinterfaces sites to a local point (Figure S1 in the supporting information [SI]). Note that, in contrast to r1,the radius of curvature r2 can be either positive or negative, depending on whether the fluid-fluid interfaceis convex or concave, respectively (Figure S1 in the SI).
When the fracture aperture is very small, the in-plane curvature k2 can be neglected by assuming it to bemuch smaller than k1 (or r1 much smaller than r2). If this assumption is valid, then the invading pressurecan be approximated as Pinv ≈ 2𝛾 cos 𝜃∕b. This assumption has been invoked in modeling multiphase flowthrough rough fractures (Wagner et al., 1997, 1999; Ye et al., 2015, 2017). Here we investigate also the extentto which neglecting the in-plane curvature is a valid assumption.
3. Impact of Aperture Heterogeneity on Capillary Pressure Behavior3.1. Capillary Pressure Behavior in a Random FractureIt is useful to first consider the behavior of Pc for a spatially uncorrelated random aperture field, in theabsence of confining stress. This case is an end-member case for later comparison with aperture fields gen-erated from self-affine fracture surfaces. We generate 60 random uniformly distributed fracture aperturefields with mean b = 1.5 mm and coefficient of variation 𝛿 = 0.57. Here, the fracture dimension is the sameas the one described previously (0.65 m × 0.65 m).
We run simulations of capillary invasion using the standard IP and the MIP models and track the localcapillary pressure, Pc, by reporting for each invaded location the threshold pressure required for an invasionto occur. The threshold capillary pressure for a given pixel changes as the invasion front advances and isupdated according to equation (2). We apply a spatial medium filter with a distance of 2 pixels (on eachside of the invaded location) to remove numerical artifacts brought by the jagged numerical interface. Ourrecord of Pc is a measure of the minimum capillary pressure required for an invasion to occur at each menisciconfiguration. Similar measurements in porous media have been obtained experimentally (Aker et al., 2000;Biswas et al., 2018; Moebius & Or, 2014; Moura et al., 2017). These experiments were conducted at very lowflow rates, where it was assumed that the measured capillary pressure is the local capillary pressure. Recentnumerical simulations in porous media have also used the local capillary pressure from the IP invasion toinvestigate pressure and saturation relations for different sample sizes (Moura et al., 2015).
As an example, we show, in Figure 2a, Pc records from IP simulations with and without in-plane curvaturefor a completely uncorrelated uniformly distributed fracture aperture field. As expected, Pc values in both
DA SILVA ET AL. 7428

Geophysical Research Letters 10.1029/2019GL082744
Figure 2. Behavior of capillary pressure (Pc) during invasion percolation (IP) invasion in a uniform-distributed randomfracture aperture field. (a) Pc variation for IP with (blue) and without (red) in-plane curvature. Pc is normalized by thecapillary pressure computed using the average fracture aperture. (b) Average power spectral density of the normalizedPc for IP with and without in-plane curvature. The black dashed lines are linear fits to the data and have slopes𝛽 ≈ 0.07 and 𝛽 ≈ 0.51 for IP models with and without in-plane curvature, respectively. (c) Definition of hierarchicalavalanches according to Maslov (1995) and Furuberg et al. (1996). (d) Distribution of hierarchical avalanche sizes for arandom fracture for IP with and without in-plane curvature. Both follow a power law distribution with exponent 𝛼 = 2,in agreement with the theoretical exponent for self-organized criticality (Maslov, 1995).
cases appear uncorrelated and without any macroscopic structure. The minimum value of the normalizedPc without in-plane curvature is not a constant of 0.5 but instead shows variations that can be observed whena narrow range of invaded volumes is shown. Invasion percolation with in-plane curvature results in largerPc. This result of larger Pc is consistent with displacement processes where the invading fluid flows throughsmall aperture areas inaccessible to invasion in the case of IP without in-plane curvature, thus reducing theamount of trapping of the defending fluid (Yang et al., 2016).
The power spectral density, S(f), of the capillary pressure record reveals the connection between Pc and thestructure of the aperture field. It also elucidates the impact of considering the in-plane curvature in our IPsimulations. To compute S(f), we use the Welch method (Welch, 1967). Our results suggest that S(f) followsa power law S(f) ∝ f−𝛽 , with 𝛽 ≈ 0.38 and 𝛽 ≈ 0.51 for IP model with and without in-plane curvature,respectively (Figure 2b). Thus, despite our random uncorrelated fracture aperture structure, the invasionprocess self-organizes, although weakly, resulting in nonflat S(f).
To further validate the Pc records from our numerical simulations, we use well-established scaling lawsfor the occurrence of hierarchical forward avalanches, Nf (Sf ), which have been employed to character-ize drainage in porous media (Aker et al., 2000; Biswas et al., 2018; Furuberg et al., 1996; Maslov, 1995)(Figures 2c and 2d). The scaling behavior of Nf (Sf ) is valid for a broad class of models that are knownto self-organize in critical states (self-organized criticality model), such as IP in porous media (Maslov,1995; Paczuski et al., 1996), landslide and forest fire occurrence (Turcotte et al., 2002), and earthquake
DA SILVA ET AL. 7429

Geophysical Research Letters 10.1029/2019GL082744
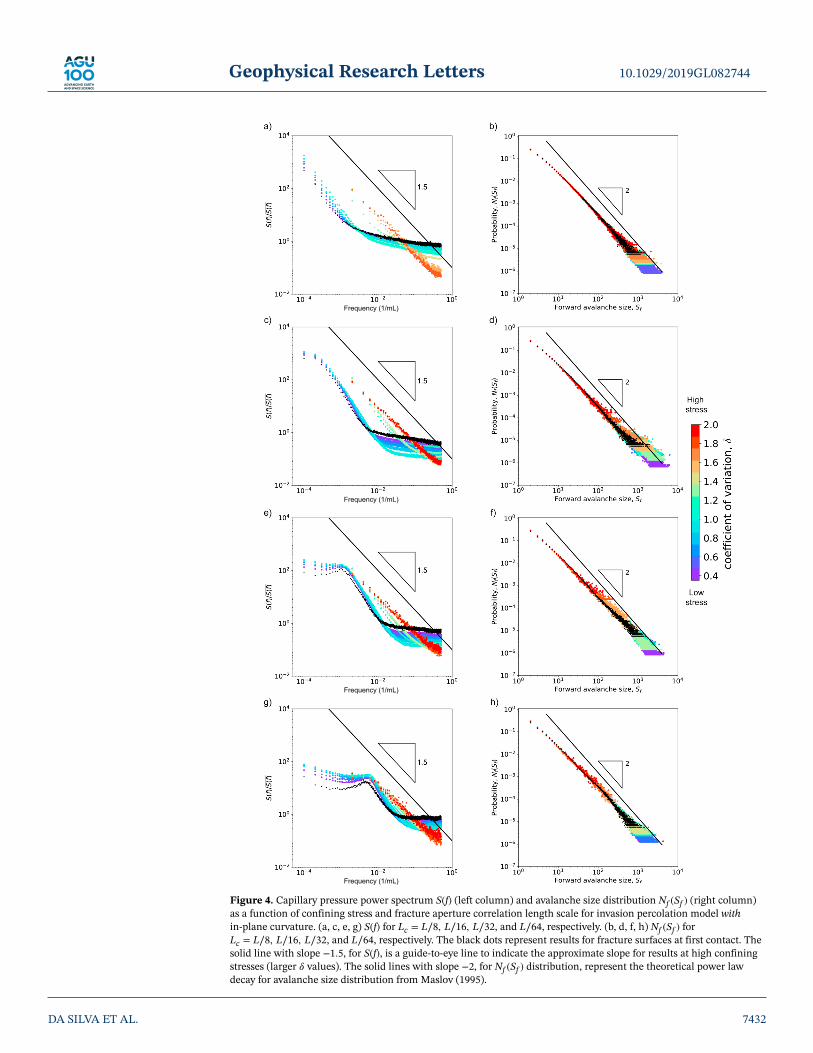
Figure 3. Behavior of capillary pressure (Pc) for invasion percolation (IP) models with and without in-plane curvatureand for self-affine fracture surfaces at two different confining stresses. In these two cases, the mismatch length scale isfixed at Lc = L∕8. (a) Pc for IP with and without in-plane curvature for fracture aperture fields containing one locationof contact (𝛿 = 0.23, first contact). (b) Same as (a) but for a confining stress of 𝜎n = 0.4 MPa (𝛿 = 1.33). In both cases Pcis normalized by the capillary pressure computed using the respective average fracture aperture. (c) Distribution ofavalanche sizes, Nf (Sf ), for IP without in-plane curvature and different confining stresses. (d) Same as (c) but for IPwith in-plane curvature. (e) Power spectral density, S(f), of Pc for IP without in-plane curvature and different confiningstresses. (f) Same as (e) but for IP with in-plane curvature.
DA SILVA ET AL. 7430

Geophysical Research Letters 10.1029/2019GL082744
frequency-magnitude scaling (Bak & Tang, 1989). In the context of drainage in porous and fractured media,the distribution of avalanches informs whether the invasion occurs via events of relatively homogeneoussizes (narrow avalanche size distribution) or, instead, via events of very disparate sizes (e.g., a wide powerlaw distribution for which one cannot define a standard deviation).
Thus, similar to the drainage processes in porous media, the rapid capillary pressure fluctuations observedin our numerical simulations are associated with avalanches or bursts of activity (Måløy et al., 1992). Anavalanche starts when Pc drops suddenly and stops when Pc increases to a value above the pressure thatinitiated the burst (Figure 2c). Therefore, an avalanche may consist of a large pressure valley containinga hierarchical distribution of smaller pressure jumps within it (Figure 2c). Avalanches are associated withfluid advancement through areas of larger fracture apertures, associated with low capillary entry pressurevalues, up to the point where its advancement stops at an area of small fracture aperture, which requires thecapillary pressure to increase in order to overcome the new barrier.
For a broad class of models with intermittent behavior, under the condition that the measured capillarypressure is the local capillary pressure, Maslov (1995) showed that the probability distribution of forwardavalanches, Nf (Sf ), follows a power law
N𝑓 (S𝑓 ) = S−𝛼𝑓, (3)
where Sf is the forward avalanche size, defined as the number of invaded sites during an avalanche. Thepower law exponent 𝛼 was predicted to be 𝛼 = 2 for all invasion models showing intermittent behavior ofactivity (Maslov, 1995). For our completely random fracture aperture, our measurements of the distributionof avalanche sizes, using both IP models, are in good agreement with the theoretical exponent predicted byMaslov (1995; Figure 2d). Our results are also consistent with previous numerical simulations performedby Furuberg et al. (1996), who obtained 𝛼 = 2.00 ± 0.01 for a porous media case, experiments performed by(Aker et al., 2000), using a porous media composed of glass beads, where 𝛼 = 1.9 ± 0.1, and drying experi-ments reported by Biswas et al. (2018), where 𝛼 = 1.99 ± 0.05. This agreement points to the validity of thePc records from our simulations of quasi-static drainage in rough fractures, which we analyze further next.
3.2. Capillary Pressure Behavior in a Self-Affine FractureWe now explore the behavior of the local capillary pressure, Pc, during slow drainage through fractureaperture fields generated from self-affine fracture surfaces.
For fracture surfaces at first contact (no confining stress), Pc for IP with and without in-plane curvatureshow similar mean variations that are proportional to the mean fracture aperture (Figure 3a). As expected,IP without in-plane curvature does not invade small aperture areas, resulting in smaller invading phasesaturation (Yang et al., 2012). For highly stressed fracture surfaces, the standard and modified IP modelsshow large drops in Pc that occur when the invading fluid reaches an area of large fracture aperture, asrevealed by the records of local Pc fluctuations during invasion (Figure 3b). The capillary pressure thenincreases gradually as the invading fluid moves into the small fracture aperture areas. The invading fluidthen breaks into another area of large fracture aperture and the process repeats. This process is more evidentfor very heterogeneous fracture apertures, as is the case for high confining stress (Figure 3b). In this case,the large Pc variations are related to the increase in fracture surface contact area and the reduction of themean aperture when a confining stress is applied (Figure 1b).
The local coefficient of variation (𝛿 = 𝜎b∕b̄), which quantifies the degree of variability of the aperture fieldrelative to the mean aperture, controls whether IP with and without in-plane curvature, and for fractureaperture at any confining stress amount, will yield similar results. The coefficient of variation controls theroughening and smoothing of the fluid-fluid interface and consequently the degree to which the in-planecurvature can impact Pc. For a self-affine fracture surface with nearly constant 𝜎b throughout the domain,locally large 𝛿 values will result from locally small aperture values, a situation that leads to small differencesbetween the two IP models. Smaller 𝛿 values, on the contrary, correspond to larger mean aperture values,where the in-plane curvature has larger impact on Pc, resulting in larger differences between the two IPmodels.
We quantify the avalanche behavior during invasion, using the standard and modified IP models, by com-puting the probability distribution of forward avalanche sizes, Nf (Sf ) (equation (3)). We find that, for thestandard IP model where in-plane curvature is neglected, the probability of forward avalanches follows a
DA SILVA ET AL. 7431
Geophysical Research Letters 10.1029/2019GL082744
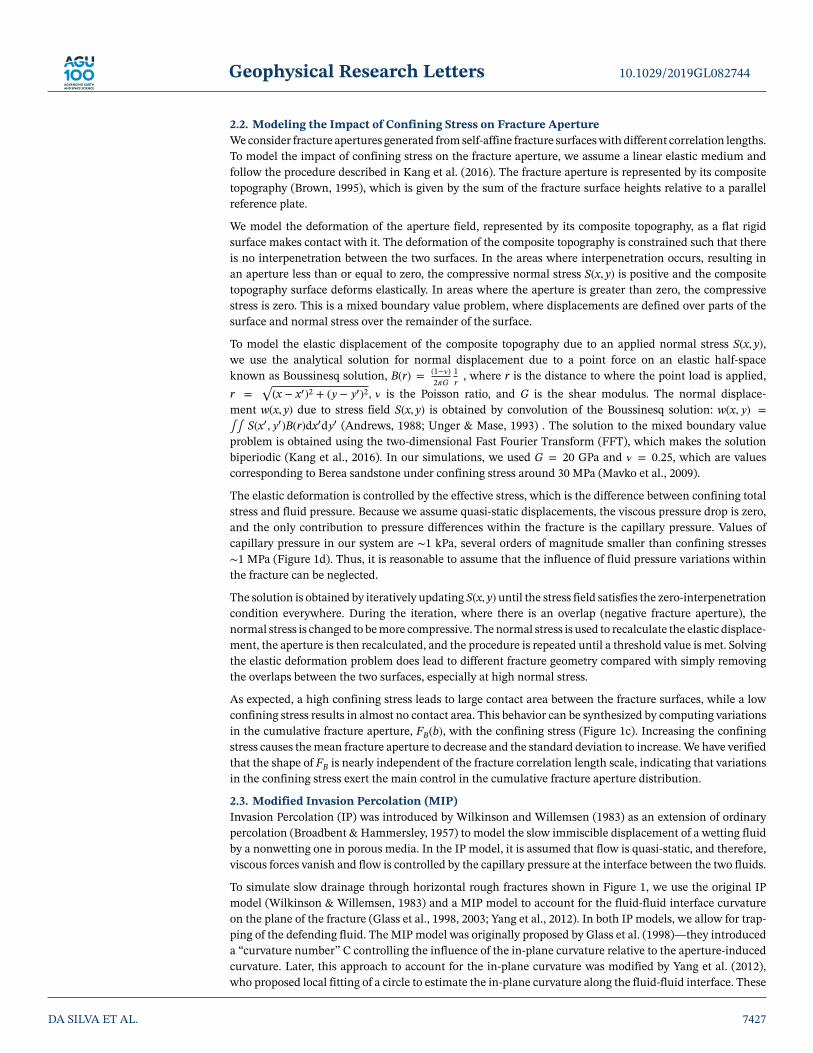
Figure 4. Capillary pressure power spectrum S(f) (left column) and avalanche size distribution Nf (Sf ) (right column)as a function of confining stress and fracture aperture correlation length scale for invasion percolation model within-plane curvature. (a, c, e, g) S(f) for Lc = L∕8, L∕16, L∕32, and L∕64, respectively. (b, d, f, h) Nf (Sf ) forLc = L∕8, L∕16, L∕32, and L∕64, respectively. The black dots represent results for fracture surfaces at first contact. Thesolid line with slope −1.5, for S(f), is a guide-to-eye line to indicate the approximate slope for results at high confiningstresses (larger 𝛿 values). The solid lines with slope −2, for Nf (Sf ) distribution, represent the theoretical power lawdecay for avalanche size distribution from Maslov (1995).
DA SILVA ET AL. 7432
Geophysical Research Letters 10.1029/2019GL082744
power law N𝑓 (S𝑓 ) ∝ S−𝛼𝑓
, with 𝛼 ≈ 1.55 (Figure 3c). In contrast, for the modified IP model where in-planecurvature is accounted for, the same avalanche size distribution also follows a power law but with 𝛼 ≈ 2(Figure 3d). In both cases, the power law exponent 𝛼 does not change as the fracture aperture changes fromfirst contact case to the highly stressed case. Our expectation for 𝛼 = 2 exponent is due to (1) the theoreticalresults for SOC processes (Maslov, 1995), (2) the fact that a similar exponent is observed for porous mediadisplacements (Aker et al., 2000; Biswas et al., 2018; Furuberg et al., 1996), and most importantly (3) the factthat this is the exponent observed for purely random fractures with no spatial correlation in the fracture gap(Figure 2). The fact that the distribution of avalanche sizes for IP without in-plane curvature deviates fromthe theoretical power law with exponent 𝛼 = 2 (Figure 3c) suggests that it lacks the necessary physics toproperly model the invasion process through a self-affine rough fracture. Therefore, our results support thevalidity of the MIP model with in-plane curvature as the rough fracture analogue of the IP model in porousmedia, even for very highly stressed fracture surfaces.
To further quantify the differences between the capillary pressure behavior during invasion for IP modelswith and without in-plane curvature, we computed the power spectral density, S(f), of Pc. For IP model with-out in-plane curvature, S(f) decays as a power law for nearly all frequencies (Figure 3e). IP with in-planecurvature, in contrast, exhibits a decay in S(f) at low frequencies but a stagnation at high frequencies(Figure 3f). Thus, our results indicate a decrease of self-organization when in-plane curvature is included.This decrease in self-organization appears to be larger for fracture surfaces at first contact, in agreement withthe notion that in-plane curvature dominates the Pc behavior for very large fracture apertures (1∕r2 ≫ 1∕r1in equation (3)).
Finally, for a self-affine surface at first contact, we have verified that the scaling exponent for the distributionof avalanche sizes, 𝛼, and the behavior of S(f) of Pc are almost insensitive to the grid size (see Figures S2 andS3 in the SI). Thus, in the remainder of the paper, we use a grid of 1, 024 × 1, 024 pixels.
3.3. Impact of Confining Stress on Capillary Pressure BehaviorWe focus on a self-affine fracture, with different correlation lengths, and we now investigate the impact ofconfining stress on the capillary pressure behavior. Here, we concentrate on results with the MIP modelwhere in-plane curvature is used, since this model incorporates the necessary physics to reproduce theexpected scaling of forward avalanches. The results shown in this section were produced by averaging, foreach stress level, the results of 20 statistically similar fracture apertures generated using different randomnumber seeds.
At high confining stresses, S(f) follows a power law as S(f) ∝ f−𝛽 , with 𝛽 ≈ 1.5, for the entire frequency rangeand for all fracture correlation length scales, Lc (Figures 4a, 4c, 4e, and 4g). As the confining stress decreases,and for all Lc cases shown here, S(f) tends to nearly white noise at high frequencies. At low frequencies, S(f)tends to flatten as the fracture aperture correlation length scale decreases from Lc = L∕8 to Lc = L∕64. Thus,our numerical simulations indicate a decrease in self-organization of the invasion process as the confiningstress decreases and when fracture aperture correlation becomes smaller. It is interesting that the impact ofthese sources of fracture aperture heterogeneity in the S(f) of Pc is in separate ranges of the power spectrum:a decrease in stress flattens the high frequencies, whereas a decrease in correlation length flattens the lowfrequencies.
Finally, we have verified that the distribution of avalanche sizes decays as a power law N(s) ∝ s−𝛼 , withthe exponent 𝛼 = 2 being independent of the applied confining stress and the fracture correlation length(Figures 4b, 4d, 4f, and 4h). This result points to the validity of the Pc measurements reported in our numeri-cal simulations for different confining stresses, and for different aperture correlation lengths, using the MIPmodel that accounts for fluid-fluid curvature. In contrast, the distribution of avalanche sizes for IP withoutin-plane curvature does not follow a power law decay with 𝛼 = 2, suggesting that the theoretical universalscaling is only recovered in the modified IP model (Figure S4 of the SI).
4. Discussion and ConclusionsMoura et al. (2017) observed a transition in the power spectrum of Pc during drainage in porous media,from 1∕f at low frequencies to 1∕f2 at higher frequencies, which they could explain due to the exponentialviscous relaxation following a burst in their experimental system. As our system is strictly quasi-static withno viscous dissipation, we suspect that the origin of self-organization in our model is intimately related to
DA SILVA ET AL. 7433
Geophysical Research Letters 10.1029/2019GL082744
the coefficient of variation of the fracture aperture, 𝛿 = 𝜎b∕b̄, and that the transition we observe is relatedto spatial organization, rather than to temporal organization. For 𝛿 < 1 (low stress), the in-plane curvaturedominates the aperture-induced curvature (1∕r1 ≪ 1∕r2 in equation (2)), since the average fracture apertureis larger than the aperture standard deviation. For 𝛿 > 1, the opposite occurs (1∕r2 ≪ 1∕r1), since theaverage fracture aperture is smaller than the aperture standard deviation, and thus, the in-plane curvaturehas a smaller impact on Pc. We hypothesize that the departure from self-organization at high frequenciescan be attributed to the preponderance of negative in-plane curvatures at high stress, where the low-apertureregions act as “pinning sites” for the evolution of the interface (Jung et al., 2016; Primkulov et al., 2018).
The observation that our recorded distribution of forward avalanche sizes, Nf (Sf ), decays as a power law,N𝑓 (S𝑓 ) ∝ S−2
𝑓, is new for the MIP model in rough fractures. This broad property of the MIP model suggests
that it may embody the key physics for simulating slow immiscible displacement through rough fractures,in contrast with the original IP model. Since the MIP model is quasi-static, however, it does not permitinvestigating the cumulative distribution of Haines jumps (Haines, 1930), a phenomenon that has beenextensively studied, accompanied by avalanches, in similar investigations in porous media (Berg et al., 2013;Furuberg et al., 1996; Måløy et al., 1992; Moebius & Or, 2014; Moura et al., 2015, 2017).
We have shown that a key parameter controlling the behavior of Pc in a rough fracture is the coefficient ofvariation 𝛿 = 𝜎b∕b̄. For a self-affine fracture, we observe the evolution of Pc from a weakly self-organizedstate at low 𝛿 values, at low confining stress and for fracture surfaces with large correlation length, to astrongly self-organized state at large 𝛿 values, at high confining stress and fracture surfaces with small cor-relation length. Here, we have employed a global 𝛿 value and assumed that it is representative of the entirefracture. It is likely that local 𝛿 variations are also relevant, because in the evaluation of Pc only a few sitesnear the would-be-invaded location are used in the computation of the in-plane curvature, suggesting that Pcmay be sensitive to 𝛿 changes throughout the fracture domain, as, for example, in the case of correlated frac-ture surfaces (Yang et al., 2016). Further numerical investigation is required to fully understand the impactof heterogeneous 𝛿 on the behavior of Pc.
While the impact of in-plane curvature on slow drainage in rough fractures was not considered in several ear-lier studies (e.g., Amundsen et al., 1999; Murphy & Thomson, 1993; Wagner et al., 1997, 1999; Ye et al., 2015,2017), our comparison between IP with and without in-plane curvature shows that the original IP modeldeviates from the theoretical scaling of hierarchical avalanche sizes, supporting the notion that in-planecurvature is an important mechanism in modeling immiscible flow displacement, even at large confiningstresses and large degrees of fracture aperture correlation.
Correlated fracture aperture fields and variations in the normal confining stress are distinct mechanismsthat can result in different degrees of fracture aperture heterogeneity. Interestingly, our results indicate thateach mechanism impacts the capillary pressure during slow drainage in a different range of the Pc powerspectrum. In both cases, we show that the slow drainage behavior becomes less self-organized when boththe fracture aperture correlation length and the confining stress decrease. These observations, which areabsent from the avalanche size distribution, point to the additional information encoded in the Pc powerspectrum. In particular, our results show that an increase in confining stress is responsible for a shift of thecutoff frequency for self-organized behavior to higher frequencies (Figures 4a, 4c, 4e, and 4g). This transitionfrequency has been ascribed to physical properties of porous media (Moura et al., 2017) and could also beindicative of flow properties of a rough fracture (e.g., permeability-to-porosity ratio). In solving the contactproblem, we have not accounted for shear stress along the fracture surfaces, the presence of gouge in thefracture aperture, and additionally, we assumed elastic deformation of the fracture surfaces. Despite thesesimplifications, our model indicates that the degree of heterogeneity in the fracture aperture field can becharacterized using the power spectrum of Pc.
Measurements of Pc during slow drainage through porous media are reported routinely (Biswas et al., 2018;Furuberg et al., 1996; Måløy et al., 1992; Moebius & Or, 2014; Moura et al., 2015, 2017; Ramstad & Hansen,2006). However, to the best of our knowledge, Pc measurements during slow drainage through a roughfracture, for a flow rate controlled boundary condition, have only been reported in the pioneer experimen-tal work of Persoff and Pruess (1995). Although we recognize that measuring Pc variations at very slowflow rates can be challenging due to low signal-to-noise ratio, we hope that our numerical results will raisescientific interest to investigate experimentally Pc variations during drainage through rough fractures.
DA SILVA ET AL. 7434

Geophysical Research Letters 10.1029/2019GL082744
References
Aker, E., Måløy, K. J., Hansen, A., & Basak, S. (2000). Burst dynamics during drainage displacements in porous media: Simulations andexperiments. Europhysics Letters, 51(1), 55–61. https://doi.org/10.1209/epl/i2000-00331-2
Amundsen, H., Wagner, G., Oxaal, U., Meakin, P., Feder, J., & Jøssang, T. (1999). Slow two-phase flow in artificial fractures: Experimentsand simulations. Water Resources Research, 35(9), 2619–2626. https://doi.org/10.1029/1999WR900147
Andrews, D. (1988). On modeling closure of rough surfaces in contact. Eos, Transactions of the American Geophysical Union, 69, 1426–1427.Auradou, H., Måløy, K. J., Schmittbuhl, J., & Hansen, A. (2003). Drainage in a rough gouge-filled fracture. Transport in Porous Media, 50(3),
267–305. https://doi.org/10.1023/A:1021164109061Bak, P., & Tang, C. (1989). Earthquakes as a self-organized critical phenomenon. Journal of Geophysical Research, 94(B11), 15,635–15,637.
https://doi.org/10.1029/JB094iB11p15635Berg, S., Ott, H., Klapp, S. A., Schwing, A., Neiteler, R., Brussee, N., et al. (2013). Real-time 3D imaging of Haines jumps in porous media
flow. Proceedings of the National Academy of Sciences, 110(10), 3755–3759. https://doi.org/10.1073/pnas.1221373110Bertels, S. P., DiCarlo, D. A., & Blunt, M. J. (2001). Measurement of aperture distribution, capillary pressure, relative permeability, and in
situ saturation in a rock fracture using computed tomography scanning. Water Resources Research, 37(3), 649–662. https://doi.org/10.1029/2000WR900316
Biswas, S., Fantinel, P., Borgman, O., Holtzman, R., & Goehring, L. (2018). Drying and percolation in correlated porous media. PhysicalReview Fluids, 3(12), 124–307. https://doi.org/10.1103/PhysRevFluids.3.124307
Broadbent, S., & Hammersley, J. (1957). Percolation processes. I. Crystals and mazes. Proceedings of the Cambridge Philosophical Society,53(3), 629–641.
Brooks, R. H., & Corey, A. T. (1964). Hydraulic properties of porous media. Hydrology Papers, 3(3), 27.Brown, S. (1995). Simple mathematical model of a rough fracture. Journal of Geophysical Research, 100(B4), 5941–5952. https://doi.org/10.
1029/94JB03262Brown, S., & Scholz, C. (1985a). Broad bandwidth study of the topography of natural rock surfaces. Journal of Geophysical Research, 90(B14),
2575–2582. https://doi.org/10.1029/JB090iB14p12575Brown, S., & Scholz, C. (1985b). Closure of random elastic surfaces in contact. Journal of Geophysical Research, 90(NB7), 5531–5545. https://
doi.org/10.1029/JB090iB07p05531Chen, Y.-F., Fang, S., Wu, D.-S., & Hu, R. (2017). Visualizing and quantifying the crossover from capillary fingering to viscous fingering in
a rough fracture. Water Resources Research, 53, 7756–7772. https://doi.org/10.1002/2017WR021051Chen, Y.-F., Guo, N., Wu, D.-S., & Hu, R. (2018). Numerical investigation on immiscible displacement in 3D rough fracture: Compari-
son with experiments and the role of viscous and capillary forces. Advances in Water Resources, 118, 39–48. https://doi.org/10.1016/j.advwatres.2018.05.016
Chen, Y.-F., Wu, D.-S., Fang, S., & Hu, R. (2018). Experimental study on two-phase flow in rough fracture: Phase diagram and localizedflow channel. International Journal of Heat and Mass Transfer, 122, 1298–1307. https://doi.org/10.1016/j.ijheatmasstransfer.2018.02.031
Furuberg, L., Måløy, K. J., & Feder, J. (1996). Intermittent behavior in slow drainage. Physical Review E, 53(1), 966–977. https://doi.org/10.1103/PhysRevE.53.966
Glass, R. J., Nicholl, M. J., & Yarrington, L. (1998). A modified invasion percolation model for low-capillary number immiscible displace-ments in horizontal rough-walled fractures: Influence of local in-plane curvature. Water Resources Research, 34(12), 3215–3234. https://doi.org/10.1029/98WR02224
Glass, R. J., Rajaram, H., & Detwiler, R. L. (2003). Immiscible displacements in rough-walled fractures: Competition between rougheningby random aperture variations and smoothing by in-plane curvature. Physical Review E, 68(6), 61110. https://doi.org/10.1103/PhysRevE.68.061110
Haines, W. B. (1930). Studies in the physical properties of soil. V. The hysteresis effect in capillary properties, and the modes of moisturedistribution associated therewith. The Journal of Agricultural Science, 20(01), 97–116. https://doi.org/10.1017/S002185960008864X
Holtzman, R., Szulczewski, M. L., & Juanes, R. (2012). Capillary fracturing in granular media. Physical Review Letters, 108(26), 264–504.https://doi.org/10.1103/PhysRevLett.108.264504
Huo, D., & Benson, S. M. (2016). Experimental investigation of stress-dependency of relative permeability in rock fractures. Transport inPorous Media, 113(3), 567–590. https://doi.org/10.1007/s11242-016-0713-z
Jaeger, J. C., & Cook, N. G. W. (1979). Fundamentals of rock mechanics. London: Chapman and Hall.Jung, M., Brinkmann, M., Seemann, R., Hiller, T., Sanchez de La Lama, M., & Herminghaus, S. (2016). Wettability controls slow immiscible
displacement through local interfacial instabilities. Physical Review Fluids, 1(7), 74,202. https://doi.org/10.1103/PhysRevFluids.1.074202Kang, P. K., Brown, S., & Juanes, R. (2016). Emergence of anomalous transport in stressed rough fractures. Earth and Planetary Science
Letters, 454, 46–54.Lenormand, R., Touboul, E., & Zarcone, C. (1988). Numerical models and experiments on immiscible displacements in porous media.
Journal of Fluid Mechanics, 189, 165–187. https://doi.org/10.1017/S0022112088000953Lenormand, R., Zarcone, C., & Sarr, A. (1983). Mechanisms of the displacement of one fluid by another in a network of capillary ducts.
Journal of Fluid Mechanics, 135(-1), 337–353. https://doi.org/10.1017/S0022112083003110Lian, P., & Cheng, L. (2012). The characteristics of relative permeability curves in naturally fractured carbonate reservoirs. Journal of
Canadian Petroleum Technology, 51(02), 137–142. https://doi.org/10.2118/154814-PAMåløy, K., Furuberg, L., Feder, J., & Jøssang, T. (1992). Dynamics of slow drainage in porous media. Physical Review Letters, 68(14),
2161–2164. https://doi.org/10.1103/PhysRevLett.68.2161Maslov, S. (1995). Time directed avalanches in invasion models. Physical Review Letters, 74(4), 562. https://doi.org/10.1103/PhysRevLett.
74.562Mavko, G., Mukerji, T., & Dvorkin, J. (2009). The rock physics handbook: Tools for seismic analysis of porous media (2nd ed.). Cambridge,K:
Cambridge University Press.McDonald, A., Beckner, B., Chan, H., Jones, T., & Wooten, S. (1991). Some important considerations in the simulation of naturally fractured
reservoirs. Dallas, TX: Society of Petroleum Engineers. https://doi.org/10.2118/21814-MSMeakin, P., Feder, J., Frette, V., & T. Jøssang (1992). Invasion percolation in a destabilizing gradient. Physical Review A, 46(6), 3357–3368.
https://doi.org/10.1103/PhysRevA.46.3357Moebius, F., & Or, D. (2014). Pore scale dynamics underlying the motion of drainage fronts in porous media. Water Resources Research, 50,
8441–8457. https://doi.org/10.1002/2014WR015916
AcknowledgmentsThis work was funded in part by theU.S. Department of Energy (GrantDE-SC0018357 to R. J.). P. K. K.acknowledges a grant from KoreaEnvironment Industry and TechnologyInstitute (KEITI) through SubsurfaceEnvironmental Management(SEM) Project, funded by the KoreaMinistry of Environment (MOE)(2018002440003). Z. Y. acknowledgesfinancial support from the NationalNatural Science Foundation of China(41877203). No data were used inproducing this manuscript.
DA SILVA ET AL. 7435
Geophysical Research Letters 10.1029/2019GL082744
Moura, M., Fiorentino, E.-A., Måløy, K. J., Schäfer, G., & Toussaint, R. (2015). Impact of sample geometry on the measurementof pressure-saturation curves: Experiments, and simulations. Water Resources Research, 51, 8900–8926. https://doi.org/10.1002/2015WR017196
Moura, M., Måløy, K. J., & Toussaint, R. (2017). Critical behavior in porous media flow. EPL, 118(1), 14,004. https://doi.org/10.1209/0295-5075/118/14004
Murphy, J. R., & Thomson, N. R. (1993). Two-phase flow in a variable aperture fracture. Water Resources Research, 29(10), 3453–3476.https://doi.org/10.1029/93WR01285
Neuweiler, I., Sorensen, I., & Kinzelbach, W. (2004). Experimental and theoretical investigations of drainage in horizontal rough-walledfractures with different correlation structures. Advances in Water Resources, 27(12), 1217–1231. https://doi.org/10.1016/j.advwatres.2004.07.005
Nuske, P., Faigle, B., Helmig, R., Niessner, J., & Neuweiler, I. (2010). Modeling gas-water processes in fractures with fracture flow propertiesobtained through upscaling. Water Resources Research, 46, W09528. https://doi.org/10.1029/2009WR008076
Paczuski, M., Maslov, S., & Bak, P. (1996). Avalanche dynamics in evolution, growth, and depinning models. Physical Review E, 53(1),414–443. https://doi.org/10.1103/PhysRevE.53.414
Persoff, P., & Pruess, K. (1995). Two-phase flow visualization and relative permeability measurement in natural rough-walled rock fractures.Water Resources Research, 31(5), 1175–1186. https://doi.org/10.1029/95WR00171
Power, W., & Tullis, T. (1991). Euclidean and fractal models for the description of rock surface-roughness. Journal of Geophysical Research,96(B1), 415–424. https://doi.org/10.1029/90JB02107
Primkulov, B. K., Talman, S., Khaleghi, K., Rangriz Shokri, A., Chalaturnyk, R., Zhao, B., et al. (2018). Quasistatic fluid-fluid displace-ment in porous media: Invasion-percolation through a wetting transition. Physical Review Fluids, 3(10), 104001. https://doi.org/10.1103/PhysRevFluids.3.104001
Pruess, K. (2008). Leakage of CO2 from geologic storage: Role of secondary accumulation at shallow depth. International Journal ofGreenhouse Gas Control, 2(1), 37–46. https://doi.org/10.1016/S1750-5836(07)00095-3
Pyrak-Nolte, L. J., Cook, N., & Myer, L. (1990). A stratified percolation model for saturated and unsaturated flow through natural fractures.Amer Nuclear Soc.
Pyrak-Nolte, L. J., & Morris, J. P. (2000). Single fractures under normal stress: The relation between fracture specific stiffness and fluidflow. International Journal of Rock Mechanics and Mining Sciences, 37(1-2), 245–262. https://doi.org/10.1016/S1365-1609(99)00104-5
Pyrak-Nolte, L. J., & Nolte, D. D. (2016). Approaching a universal scaling relationship between fracture stiffness and fluid flow. NaturalComputing, 7(10), 663. https://doi.org/10.1038/ncomms10663
Ramstad, T., & Hansen, A. (2006). Cluster evolution in steady-state two-phase flow in porous media. Physical Review E, 73(2), 26,306.https://doi.org/10.1103/PhysRevE.73.026306
Reitsma, S., & Kueper, B. H. (1994). Laboratory measurement of capillary pressure-saturation relationships in a rock fracture. WaterResources Research, 30(4), 865–878. https://doi.org/10.1029/93WR03451
Turcotte, D. L., Malamud, B. D., Guzzetti, F., & Reichenbach, P. (2002). Self-organization, the cascade model, and natural hazards.Proceedings of the National Academy of Sciences, 99(suppl 1), 2530–2537. https://doi.org/10.1073/pnas.012582199
Unger, A. J. A., & Mase, C. W. (1993). Numerical study of the hydromechanical behavior of two rough fracture surfaces in contact. WaterResources Research, 29(7), 2101–2114. https://doi.org/10.1029/93WR00516
van Genuchten, M. T. (1980). A closed-form equation for predicting the hydraulic conductivity of unsaturated soils. Soil Science Society ofAmerica Journal, 44(5), 892–898. https://doi.org/10.2136/sssaj1980.03615995004400050002x
Wagner, G., Meakin, P., Feder, J., & Jøssang, T. (1997). Invasion percolation on self-affine topographies. Physical Review E, 55(2), 1698–1703.https://doi.org/10.1103/PhysRevE.55.1698
Wagner, G., Meakin, P., Feder, J., & Jøssang, T. (1999). Invasion percolation in fractal fractures. Physica A, 264(3–4), 321–337. https://doi.org/10.1016/S0378-4371(98)00463-4
Wang, L., & Cardenas, M. B. (2016). Development of an empirical model relating permeability and specific stiffness for rough frac-tures from numerical deformation experiments. Journal of Geophysical Research: Solid Earth, 121, 4977–4989. https://doi.org/10.1002/2016JB013004
Watanabe, N., Sakurai, K., Ishibashi, T., Ohsaki, Y., Tamagawa, T., Yagi, M., & Tsuchiya, N. (2015). New v-type relative permeability curvesfor two-phase flows through subsurface fractures. Water Resources Research, 51, 2807–2824. https://doi.org/0.1002/2014WR016515
Welch, P. (1967). The use of fast Fourier transform for the estimation of power spectra: A method based on time averaging over short,modified periodograms. IEEE Transactions on Audio and Electroacoustics, 15(2), 70–73. https://doi.org/10.1109/TAU.1967.1161901
Wilkinson, D., & Willemsen, J. (1983). Invasion percolation: A new form of percolation theory. Journal of Physics A (Mathematical andGeneral), 16(14), 3365–3376. https://doi.org/10.1088/0305-4470/16/14/028
Yang, Z., Neuweiler, I., Méheust, Y., Fagerlund, F., & Niemi, A. (2016). Fluid trapping during capillary displacement in fractures. Advancesin Water Resources, 95, 264–275. https://doi.org/10.1016/j.advwatres.2015.07.015
Yang, Z., Niemi, A., Fagerlund, F., & Illangasekare, T. (2012). A generalized approach for estimation of in-plane curvature in invasionpercolation models for drainage in fractures. Water Resources Research, 48, W09507. https://doi.org/10.1029/2012WR011829
Yang, Z., Niemi, A., Fagerlund, F., & Illangasekare, T. (2013). Two-phase flow in rough-walled fractures: Comparison of continuum andinvasion-percolation models. Water Resources Research, 49, 993–1002. https://doi.org/10.1002/wrcr.20111
Ye, Z., Liu, H.-H., Jiang, Q., Liu, Y., & Cheng, A. (2017). Two-phase flow properties in aperture-based fractures under normal deformationconditions: Analytical approach and numerical simulation. Journal of Hydrology, 545, 72–87. https://doi.org/10.1016/j.jhydrol.2016.12.017
Ye, Z., Liu, H.-H., Jiang, Q., & Zhou, C. (2015). Two-phase flow properties of a horizontal fracture: The effect of aperture distribution.Advances in Water Resources, 76, 43–54. https://doi.org/10.1016/j.advwatres.2014.12.001
Zimmerman, R. W., & Bodvarsson, G. S. (1996). Hydraulic conductivity of rock fractures. Transport in Porous Media, 23(1), 1–30. https://doi.org/10.1007/BF00145263
DA SILVA ET AL. 7436