Impact of Climatic Shocks on Child Human Capital: Evidence ... · Gaps in literature and...
96
Impact of Climatic Shocks on Child Human Capital: Evidence from Ethiopia, India, Peru and Vietnam, Using Young Lives Data Mina Zamand Student Paper www.younglives.org.uk JULY 2014 Paper submitted in part fulfilment of the requirements for the degree of Master in Economics at the National University of Sciences and Technology (NUST), Pakistan. The data used come from Young Lives, a longitudinal study of childhood poverty that is tracking the lives of 12,000 children in Ethiopia, India (Andhra Pradesh), Peru and Vietnam over a 15-year period.. www.younglives.org.uk Young Lives is funded by UK aid from the Department for International Development (DFID) and co-funded by the Netherlands Ministry of Foreign Affairs from 2010 to 2014 and by Irish Aid from 2014 to 2015. The views expressed here are those of the author. They are not necessarily those of the Young Lives project, the University of Oxford, DFID or other funders.
-
Upload
nguyenthuy -
Category
Documents
-
view
216 -
download
2
Transcript of Impact of Climatic Shocks on Child Human Capital: Evidence ... · Gaps in literature and...

Impact of Climatic Shocks on Child Human Capital:
Evidence from Ethiopia, India, Peru and Vietnam,
Using Young Lives Data
Mina Zamand
Stu
den
t Pap
er
www.younglives.org.uk JULY 2014
Paper submitted in part fulfilment of the requirements for the degree of Master in Economics at the National University of Sciences and Technology (NUST), Pakistan.
The data used come from Young Lives, a longitudinal study of childhood poverty that is tracking the lives of 12,000 children in Ethiopia, India (Andhra Pradesh), Peru and Vietnam over a 15-year period.. www.younglives.org.uk
Young Lives is funded by UK aid from the Department for International Development (DFID) and co-funded by the Netherlands Ministry of Foreign Affairs from 2010 to 2014 and by Irish Aid from 2014 to 2015.
The views expressed here are those of the author. They are not necessarily those of the Young Lives project, the University of Oxford, DFID or other funders.
IMPACT OF CLIMATIC SHOCKS ON CHILD HUMAN
CAPITAL: EVIDENCE FROM ETHIOPIA, INDIA, PERU
AND VIETNAM, USING YOUNG LIVES DATA
MINA ZAMAND
SUPERVISED BY
ASMA HYDER BALOCH
SUBMITTED IN PARTIAL FULFILMENT OF THE REQUIREMENTS OF THE MS ECONOMICS DEGREE AT THE
NATIONAL UNIVERSITY OF SCIENCES AND TECHNOLOGY (NUST), PAKISTAN
NATIONAL UNIVERSITY OF SCIENCES AND TECHNOLOGY (NUST), PAKISTAN
JULY 10, 2014

i
I declare that this thesis, which I submit to the School of Social Sciences and Humanities (S3H), National
University of Sciences and Technology (NUST) Pakistan for examination, in consideration of the award
of the degree of MS in Economics, is my own personal effort. Where any of the content presented is the
result of input or data from a related study this is duly acknowledged in the text such that it is possible to
ascertain how much of the work is my own. I have not already obtained a degree in NUST or elsewhere
on the basis of this work. Furthermore, I took reasonable care to ensure that the work is original, and, to
the best of my knowledge, does not breach copyright law, and has not been taken from other sources
except where such work has been cited and acknowledged within the text.
Signature:
Date: 10/07/2015

ii
Acknowledgements
This study is for all the nameless and faceless children in the developing world, an acknowledgment of
their daily efforts in facing and fighting myriad risks and vulnerabilities for mere survival, their continued
struggles to overcome multiple deprivations – a humble tribute to their resilience.
This paper has benefited from the help and support of various people. Foremost among them is my thesis
supervisor Dr Asma Hyder Baloch. Her patience through the entire thesis project cannot be appreciated
enough. From guiding me through the subtle intricacies of micro-data handling to answering a stream of
queries and providing helpful comments at every stage, Dr Asma has been a constant source of help and
guidance. I am also grateful for the technical assistance on data related issues provided by Anne Solon,
Data Manager, Young Lives Project. I would also like to take this opportunity to thank Dr Zafar
Mehmood and Dr Verda Salman for their valuable comments and suggestions.
This thesis would not have been possible without help from family. I would like to express my sincerest
thanks to my parents and sister who have been bastions of support throughout my life, pushing me to try
harder and strive for more. This thesis was no exception. I am grateful to my partner Junaid for believing
in me and encouraging me to do the same. A special thanks to my aunt for welcoming me to her home
and hearth during the course of this MS degree. Finally, huge thanks to my cousins Mehreen and
Shahbano for their invaluable help in editing this paper.
Young Lives is core-funded by the Department for International Development (DFID) for the benefit of developing
countries, and co-funded by the Netherlands Ministry of Foreign Affairs from 2010 to 2014 and co-funded by Irish
Aid from 2014 to 2015. The views expressed here are those of the author. They are not necessarily those of the
Young Lives project, the University of Oxford, DFID or any other funders.

iii
Table of Contents
Abstract ..................................................................................................................................................................... viii
Section 1: Introduction ................................................................................................................................................. 1
Section 2: Review of Literature .................................................................................................................................... 4
2.1. Theoretical Motivations ..................................................................................................................................... 4
2.1.1. Framework for schooling outcomes ..................................................................................................... 4
2.1.2. Framework for health outcomes ........................................................................................................... 8
2.2. Review of Empirical Literature ....................................................................................................................... 10
2.2.1. Negative effect of shock on educational outcomes ............................................................................. 12
2.2.2. Positive impact of shock on educational outcomes ............................................................................ 15
2.2.3. Negative impact of shock on health outcomes .................................................................................... 18
2.2.4. Positive effect of shock on health outcomes ........................................................................................ 23
2.2.5. Ambiguous or no impact associated with shock ................................................................................. 24
2.2.6. Main finding from the review of empirical literature ......................................................................... 29
2.2. Gaps in literature and justification for the study.............................................................................................. 31
Section 3: Data and Descriptive Statistics .................................................................................................................. 32
3.1. Data Background ............................................................................................................................................. 32
3.2. Sampling and Data Collection ......................................................................................................................... 33
3.3. Variable descriptions ....................................................................................................................................... 34
3.4. Summary Statistics .......................................................................................................................................... 41
Section 4: Methodology .............................................................................................................................................. 49
Section 5: Results and Discussion .............................................................................................................................. 51
5.1. Discussion of results for Ethiopia .................................................................................................................... 52
5.2. Discussion of Results for India ........................................................................................................................ 58
5.3. Discussion of Results for Peru ......................................................................................................................... 65
5.4. Discussion of Results for Vietnam .................................................................................................................. 70
Section 6: Conclusion and Policy Implications .......................................................................................................... 74
References ................................................................................................................................................................. viii

iv
Table of Figures
FIGURE 1: EQUILIBRIUM INVESTMENT IN SCHOOLING ........................................................................................ 5
FIGURE 2: ADVERSE SHOCK AND INVESTMENT IN CHILD SCHOOLING (IF SUBSTITUTION EFFECT DOMINATES) ....... 6
FIGURE 3: ADVERSE SHOCK AND INVESTMENT IN CHILD SCHOOLING (IF INCOME EFFECT DOMINATES)................. 7
FIGURE 4: ADVERSE SHOCK AND CHILD HEALTH OUTCOME .............................................................................. 9
Table of Tables
TABLE 1: ANTHROPOMETRIC INDICATORS OF HEALTH ................................................................................. 38
TABLE 2: REGIONS INCLUDED IN THE STUDY ............................................................................................... 40
TABLE 3: SUMMARY STATISTICS .................................................................................................................. 42
TABLE 4: RESULTS FOR ETHIOPIA ................................................................................................................. 55
TABLE 5: RESULTS FOR INDIA ....................................................................................................................... 61
TABLE 6: RESULTS FOR PERU ...................................................................................................................... 68
TABLE 7: RESULTS FOR VIETNAM ................................................................................................................. 72
TABLE 8: SUMMARY TABLE OF DROUGHT IMPACTS ON CHILD OUTCOMES .................................................. 74
TABLE 9: SUMMARY TABLE OF TOO MUCH RAIN/FLOOD IMPACTS ON CHILD OUTCOMES ........................... 75

v
List of Abbreviations and Acronyms
AIDS- AUTO-IMMUNE DEFICIENCY SYNDROME
ASER - ANNUAL STATUS OF EDUCATION REPORT
ASS - AGRICULTURE SAMPLE SURVEY
ATT - AVERAGE TREATMENT EFFECTS
BFA - BODY MASS INDEX FOR AGE
BFA-Z - BODY MASS INDEX FOR AGE Z – SCORE
BMI - BODY MASS INDEX
CCT - CONDITION CASH TRANSFER
CDC - CENTRES FOR DISEASE CONTROL
CDI - CONSUMER DURABLES INDEX
CLSS - COTE D’IVOIRE LIVING STANDARDS SURVEY
CTT - CLASSICAL TEST THEORY
DFID - DEPARTMENT FOR INTERNATIONAL DEVELOPMENT
DHS - DEMOGRAPHIC HOUSEHOLD SURVEY
EMDAT - EMERGENCY DISASTER DATABASE
ENEU - ENCUESTA NACIONAL DE EMPLEO URBANO
ENN - ENCUESTA NATIONAL DE NUTRICION
FIML - FULL INFORMATION MAXIMUM LIKELIHOOD
FONCODES - FONDO NACIONAL DE COMPENSACIÓN Y DESARROLLO SOCIAL
FSS - FOOD SECURITY SURVEY
GDP – GROSS DOMESTIC PRODUCT
GRADE - GROUP FOR THE ANALYSIS OF DEVELOPMENT
HDR – HUMAN DEVELOPMENT REPORT
HFA - HEIGHT FOR AGE
HFA-Z - HEIGHT FOR AGE Z – SCORE

vi
HIV - HUMAN IMMUNODEFICIENCY VIRUS
HQI - HOUSING QUALITY INDEX
ICDDRB - INTERNATIONAL CENTRE FOR DIARRHOEAL DISEASE RESEARCH BANGLADESH
ICRISAT - INTERNATIONAL CROPS RESEARCH INSTITUTE FOR THE SEMI - ARID TROPICS
IFLS - INDONESIA FAMILY LIVE SURVEY
IMF - INTERNATIONAL MONETARY FUND
IMTA - INSTITUTO MEXICANO DE TECNOLOGIA DEL AGUA
IPCC - INTERGOVERNMENTAL PANEL FOR CLIMATE CHANGE
IRT - ITEM RESPONSE THEORY
IV - INSTRUMENTAL VARIABLE
LSMS - LIVING STANDARDS MEASUREMENT STUDIES
MDGS - MILLENNIUM DEVELOPMENT GOALS
MLSFH - MALAWI LONGITUDINAL STUDY OF FAMILIES AND HEALTH
MOA - MINISTRY OF AGRICULTURE
MOFED - MINISTRY OF FINANCE AND ECONOMIC DEVELOPMENT
MPB - MARGINAL PRIVATE BENEFIT
MPC - MARGINAL PRIVATE COST
NCHS - NATIONAL CENTRE FOR HEALTH STATISTICS
NFHS - NATIONAL FAMILY AND HEALTH SURVEY
NUST- NATIONAL UNIVERSITY OF SCIENCES AND TECHNOLOGY
OECD - ORGANISATION FOR ECONOMIC CO-OPERATION AND DEVELOPMENT
OLS - ORDINARY LEAST SQUARES
PISA - PROGRAMME FOR INTERNATIONAL STUDENT ASSESSMENT
PME - PESQUISA MESNAL DE EMPREGO
PPVT - PEABODY PICTURE VOCABULARY TEST
PSNP - PRODUCTIVE SAFETY NET PROGRAMME

vii
RIHSP - RURAL INTEGRATED HOUSEHOLD SURVEY PROGRAM
SNNP - SOUTHERN NATIONS, NATIONALITIES, AND PEOPLES' REGION
SQI - SERVICES QUALITY INDEX
TIMMS - TRENDS IN INTERNATIONAL MATHEMATICS AND SCIENCE STUDY
UN - UNITED NATIONS
UNDP - UNITED NATIONS DEVELOPMENT PROGRAMME
UNICEF - UNITED NATIONS INTERNATIONAL CHILDREN'S EMERGENCY FUND
VLS - VILLAGE LEVEL STUDIES
WFA- WEIGHT FOR AGE
WFH - WEIGHT FOR HEIGHT
WHO - WORLD HEALTH ORGANISATION

viii
Abstract
This study analyses the impact of two different climatic shocks drought and excessive rainfall/flood, as
perceived by households on child human capital across four countries – Ethiopia, India, Peru and
Vietnam; countries with diverse socio-economic backgrounds. Human capital, in this context, subsumes
both child learning and health outcomes. The data source is the Young Lives Study and cross-sectional
household data is utilized for the year 2009. The study examines the data on the older cohort of children,
14 – 16 years of age, and covers both urban and rural areas. The enrolment rate, Peabody Picture
Vocabulary Test (PPVT), Cloze test and Mathematics test scores are used as proxies for child learning
outcomes. The health outcome variables being studied are the WHO defined Body Mass Index for Age
(BFA) z-scores and Height for Age (HFA) z-scores.
The overall objective is to underscore both the vulnerability of children to the vagaries of nature and the
pressing need to develop policies and welfare programs to protect children against such shocks.
Additionally, the study aims to analyse the role of institutional help and household characteristics in
buffering these climatic shocks. We find that broad categorization of the impact of climate shocks ignores
heterogeneity and coping strategies across children and households. Theory and empirics both point out
to the existence of positive and negative outcomes associated with climate shocks. Our results support
theory and find different positive and negative impacts on educational and health measures in the group
of countries considered, with negative impacts being more common. On the policy front the importance
of improving access to credit, effective targeting and reducing the disincentive effects of employment
guarantee schemes is emphasized.
Keywords: climatic shock, human capital, cognitive ability, schooling, health outcomes, Ethiopia, India,
Peru, Vietnam
1
Section 1: Introduction
“Vulnerability has multiple causes and consequences. Reducing vulnerability is a key ingredient in any
agenda for improving human development. But if we are to succeed in reducing vulnerability, we need to
approach it from a broad systemic perspective.”
—Nobel Laureate Joseph Stiglitz in Chapter 4, Sustaining Human Progress: Reducing Vulnerabilities and
Building Resilience, Human Development Report (HDR), 2014
Child vulnerability has been a major area of concern for countries all over the world, especially among
developing nations. Improving child welfare has widely been recognized as the most effective mechanism
in bringing long term change. On the global front, the well-being and prosperity of children have been
widely discussed. The 1989 UN Convention on the Rights of the Child saw the first major attempt to
address concerns over child welfare. It was followed by the World Summit for Children, in 1990, under
which a Plan of Action, comprising 27 specific goals was devised, which was to target children’s
survival, health, nutrition, education and protection. A decade later, the Millennium Declaration was
signed, and eradicating poverty, including child poverty and providing universal primary education were
touted as part of the Millennium Development Goals (MDGs). In May 2002, these commitments were
reaffirmed at the 27th
Special Session of the UN General Assembly, which focused exclusively on child
welfare. It was concluded that participating countries were still short of meeting the MDG targets, and so
a new agenda known as “A World Fit for Children” was adopted. The document lists 21 targets in four
priority areas of child welfare: “promoting health and nutrition; providing quality education; protecting
against abuse, exploitation and violence; and combating HIV/AIDS”.
The developing world is still a long way from achieving the targets set by the “A World Fit for Children”
agenda. As per UNICEF estimates, one billion children, all over the world live in poverty. Poverty
entails multiple deprivations for children – often children lack the necessary resources to survive and
develop to their full potential. Poverty makes children vulnerable to exploitation, discrimination and
violence. It can also have profound implication for future generations – poor children are more likely to
transfer poverty to their own children – engendering a vicious cycle of poverty. Thus childhood poverty
can have massive human and economic costs, and an understanding of child poverty and vulnerability is
essential.

2
A major strand of literature on child poverty has focused on the exposure of children to various harmful
shocks experienced by the household. Such shocks include socio-economic shocks such as divorce, death
of parent etc; economic shocks such as parental unemployment and loss of livestock and climatic shocks
such as drought, flood etc. They affect children’s wellbeing in the short run through fluctuations in the
current income of the household. Moreover, when occurring at critical stages of a child’s development
they also affect the development of child human capital (Alderman Hoddinott and Kinsey, 2006;
Hoddinott and Dercon, 2004).
As the most common type of natural disaster climatic shocks have the potential to adversely affect the
lives of millions of children. Global warming is no longer an abstract phenomenon; the emission of
greenhouse gases and environmental degradation has very real consequences. Some of these effects
include precipitation, rising sea levels, reduced soil moisture, severe floods and droughts. According to
the Intergovernmental Panel for Climate Change (IPCC) 2007, it is projected that average annual global
temperature will rise by around 0.2°C per decade between the period 2007 to 2027. The average sea level
is expected to increase by 0.1 to 0.2 meters between 2090 and 2099, relative to the period 1980-1999.
Consequently, the frequency and impact of climate shocks is expected to increase in the next century.
These shocks have adverse economic consequences for both developed and developing nations. However,
the economic costs are far greater in developing nations which face greater risks and vulnerabilities due to
climate change (UNDP, 2007; World Bank, 2010). The UNDP 2007, presents some interesting figures -
during the period 2000-2004, 1 out of every 19 people affected by a climate shock were living in a
developing country. For OECD countries the corresponding figure is 1 in 1,500 people. Typically the
poor occupy fragile dwelling in vulnerable locations such as river banks, flood plain, steep slopes without
requisite access to safety nets and emergency systems. Thus they face a greater danger of losing their
income and assets. Secondly, in low-income countries, a high percentage of the population still depends
on agriculture as its primary source of income. Climate shocks can destroy crops and have a negative
impact on people’s incomes, savings and assets, and consequently their health, nutrition and well-being.
Moreover, such effects cannot be easily mitigated for the poor who lack access to formal credit markets
and hence face added challenges in smoothing consumption. Climate shocks have the potential of keeping
affected households in poverty as well as pushing non-poor households into poverty.
Children in the developing world, especially those from poor households, are among the groups most at
risk due to the effects of climatic shocks. Specifically, some of the risks include separation from families,
deprivation in terms of schooling, adverse impacts on children’s nutrition and health status, and increased
susceptibility to abuse and exploitation. Floods, droughts and other agricultural shocks, through the effect

3
on agricultural output and income have the potential to significantly reduce investment in child nutrition,
compromising their calorie intake. Also poor households may resort to sub-optimal coping mechanisms
like taking children out of school, reducing expenditure on schooling or deferring healthcare in response
to such temporary shocks. In turn, changes in early life investments in nutrition, health and education
have long term consequences for outcomes in adulthood, such as wage earnings etc. If climate shocks do
indeed affect child outcomes negatively, this implies that children will have fewer opportunities to
overcome their current living conditions, and they cycle of poverty may be transmitted across
generations.
Thus, understanding the links between climatic shocks and human capital becomes important, especially
when designing policies aimed at reducing child vulnerability, enhancing child welfare and resilience.
According to Glewwe and Kremer (2006), given the state of education in developing countries the issue
of natural disasters becomes even more relevant to the study of human capital in these countries. If
climatic shocks affect educational outcomes negatively, this implies that convergence of these countries
to the developing world in terms of educational outcomes becomes even more difficult.
However, judging the impact of climatic shocks on children is neither straightforward. A host of factor
influence the extent to which shocks affect child outcomes. Such factors include, but are not limited to,
the nature and magnitude of the shock, child characteristics, parental preferences, the level of household
wealth and assets that can help in buffering the impact of the shock, the credit constraints faced by the
household etc. As we discuss in Section II, empirical evidence on the impact of shocks on child outcomes
is mixed.
With this background in mind, the particular focus of this study is on child human capital and climate
shocks. This study investigates the impact of two climatic shocks: droughts and floods on human capital –
divided into educational outcomes and health outcomes- for children 14 to 16 years old, across four
countries, Ethiopia, India, Peru and Vietnam. Comparison of outcomes across four developing countries
with different socio-economic backgrounds provides us with rich insights into different factors that
influence investment in human capital. While our empirical analysis is conducted for these countries it
must be noted that the implications extend to other developing countries as well.
The rest of the study is structured as follows. Section II presents the theoretical framework and an
extensive review of the literature on shocks and their impact on child education and health outcomes, with
a particular focus on climatic shocks. This is followed by a summary of key findings in literature is also
presented, an outline of gaps in literature and a justification for the present study. Section III discusses the
4
Young Lives data set and summary statistics. Section IV explains the empirical methodology and the
results are discussed in Section V. Section VI concludes with some key findings and policy implications.
Section 2: Review of Literature
The last two decades have seen a notable increase in the number of studies investigating the impact of
adverse shocks – both idiosyncratic and aggregate – on child human capital. Early work in this area was
based on the premise that adverse shocks have a negative impact on child human capital. However,
deeper analysis of the theories behind human capital investment and a review of the empirical literature
lend no support to this broad generalisation. In this section we discuss the basic theoretical motivations
behind undertaking this study. Then, in light of this framework we review and assess the available
empirical literature on the effects of shocks on child education and health, with a particular focus on
climatic shocks. Our aim is to generate a coherent synthesis among existing findings and to shed light on
any knowledge gaps that become apparent.
2.1. Theoretical Motivations
In this section we discuss the theoretical motivations behind our econometric methodology and analysis
in the rest of the paper. We also utilize this framework in the proceeding review of empirical literature.
We present two models, the first on investment in schooling and the second on investment in health and
nutrition.
2.1.1. Framework for schooling outcomes
Our schooling investment decision framework is drawn from Becker’s acclaimed Woytinsky lecture
(Becker, 1967) on the determinants of human capital and its extension to incorporate changes in
aggregate conditions in Behrman, Duryea and Szekely (1999). According to Becker’s model of human
capital, the individual is a profit maximiser, and schooling (as well as other human capital) investments
are made so as to equate the private marginal benefit of the investment with the private marginal cost. The
marginal private benefit measures the increase in the discounted expected private stream of earning
(wages/salaries etc), resulting from an additional year of schooling. The marginal private benefit curve
slopes downward due to the existence of diminishing returns to fixed genetic endowments and pre-school
investments.

5
On the other hand, marginal private cost is given by the opportunity cost of another year of schooling (in
terms of income foregone and other time use options) as well as the direct private costs associated with
schooling (e.g. tuition, transportation, cost of supplies etc). The marginal cost slopes upward because net
foregone earnings and/or tuition increase with years of schooling. Under this framework, credit
constraints may serve as an added cost of schooling, because they prevent smoothing of consumption.
This is particularly relevant for poor households, who face borrowing constraints as well as lack personal
finances for investment in schooling. Figure 1 below shows the schooling investment decision for the
individual. The individual invests in schooling up to point so where the MPB exactly equals the MPC.
FIGURE 1: EQUILIBRIUM INVESTMENT IN SCHOOLING
Behrman et al., (1999) extend Becker’s basic model to show how shocks (or any change in aggregate
conditions) can impact the schooling investment decision. It should be noted that under Becker’s model
schooling is seen as an investment rather than consumption good. An adverse shock can shift the MPC
curve either to the left or right, depending on whether the income effect or substitution effect resulting
from the change in conditions, dominates. The two effects basically oppose each other; the income effect
having a negative impact on schooling investment and the substitution effect having a positive impact on
schooling investment. Adverse shocks imply a reduction in the household’s available resources; hence (in
the absence of perfectly functioning credit markets) individuals have to reallocate resources to buffer the
Expec
ted p
rivat
e m
argin
al b
enef
its
and c
ost
*
MPB
Investment in child schooling

6
shock. Thus the negative shock raises the opportunity cost of schooling and the income effect will have a
negative impact on schooling investment. On the other hand, the substitution effect reflects the
opportunity cost of studying versus working. In general, a negative shock depresses current employment
and wage prospects; hence the opportunity cost of attending school versus other time use options falls.
The substitution effect is positive.
If the household has access to a perfectly functioning credit market, we would observe no income effect1.
The household would be able to borrow in order to smooth out the income shock. This is consistent with
Becker’s original model, where investment decisions do not depend on the family’s current income in
perfect credit markets; access to credit allows the family to separate the schooling investment decision
from the inter-temporal consumption decision. Hence the positive substitution effect dominates, shifting
the MPC curve down. Equilibrium schooling investment increases from S to S1. This can be seen in
Figure 2.
FIGURE 2: ADVERSE SHOCK AND INVESTMENT IN CHILD SCHOOLING (IF SUBSTITUTION EFFECT
DOMINATES)
1 In investment models of schooling if credit markets function perfectly, schooling will be unaffected by changes in parental
income (Becker, 1964; and Heckman, 1976)
Ex
pec
ted
pri
vat
e m
argin
al b
enef
its
and c
ost
Investment in child schooling
MPB
*

7
However, if access to credit is imperfect and depends on parental income, then an adverse shock will
make borrowing constraints binding. A decline in current family income will affect schooling decisions
because assets cannot be drawn down. Thus when access to credit becomes conditional on family income,
an adverse shock may mean that schooling must be family financed. The income effect is negative, and if
it dominates the positive substitution effect, the marginal cost curve shifts up and schooling investment
falls from So to S1, as depicted in Figure 3.
A second channel through which investments may be affected is if households are risk averse and
insurance is costly. Then the greater uncertainty associated with adverse shocks can lead to a fall in he
marginal benefit in utility terms, thereby shifting the marginal benefit curve downward. This is illustrated
by a movement from So to S2 in Figure 3, equilibrium schooling investment falls further.
FIGURE 3: ADVERSE SHOCK AND INVESTMENT IN CHILD SCHOOLING (IF INCOME EFFECT DOMINATES)
Thus the direction of investment in schooling is theoretically ambiguous, depending on which of the
effects is larger. Ferreira and Schady (2008) point out four factors that determine the relative importance
of income and substitution effects.
i) When access to credit is imperfect, the initial level of income matters.
Expec
ted p
rivat
e m
argin
al b
enef
its
and c
ost
Investment in child schooling

8
ii) The degree of imperfection in credit markets is an important factor. The more imperfect the
market the greater is the income effect.
iii) The magnitude and duration of the shock matters; the deeper the shock the greater will be its
impact on employment and wages and hence the greater the substitution effect.
iv) If shocks are accompanied by large reductions in public spending on education (for example if
assistance expenditures take precedence, a negative “quality effect” may be observed, which
serves to reinforce the income effect.
Escobal, Saavedra and Suarez (2005) point out that the existence of quality effects suggests that human
capital investment may be affected, even if there is no effect on enrolment. For instance a child may have
to make adjustments between time spent studying at home and time spent in household activities, parental
time allocation may be cut back as a result of the adverse shock, child leisure time may be cut drastically,
there may be a reduction in expenditure on school supplies. All these coping measures imply that the
intensity of schooling and hence investment in schooling is affected, even if enrolment is unchanged in
the immediate aftermath of the shocks.
2.1.2. Framework for health outcomes
The above framework can also be used to understand how shocks impact health outcomes, with a few
adaptations for the underlying differences between investments in health outcomes versus investments in
schooling. Ferriera and Schady (2008) provide such a framework. They provide comprehensive examples
to illustrate the point. They suggest that the opportunity cost of schooling in terms of forgone earnings is
much higher than the opportunity cost of health investments in terms of forgone earning. For instance
going to school on a daily basis requires a greater input of time than visiting a health-care centre/hospital
for preventive care. Also parental time allocation to the health-care of a child is highly important for the
production function of child health, whereas it matters less for the production function of education (when
it comes to the education production function, the child’s time is a much more important input). For
instance cooking healthy meals and collecting clean water require parental time investment.
In light of these differences they put forward a production function for child health, which comprises the
following arguments: private allocation of time to health-promoting activities (t); private expenditures on
health-promoting goods (x); and public expenditures on health care (g). The framework allows for the
existence of other arguments in the function, but uses only the afore-mentioned ones for simplicity. The
three arguments are positively associated with child heath, but contribute with decreasing marginal
productivity as diminishing returns set in. Hence the production function is concave for each of the three
9
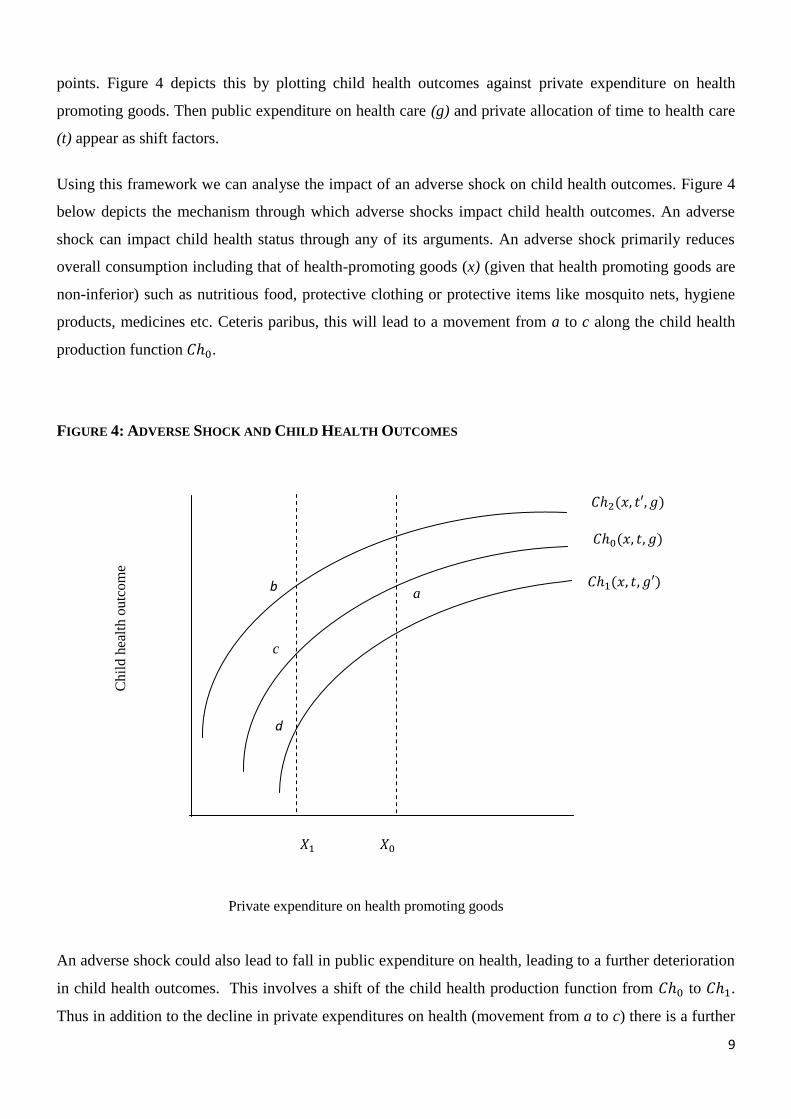
points. Figure 4 depicts this by plotting child health outcomes against private expenditure on health
promoting goods. Then public expenditure on health care (g) and private allocation of time to health care
(t) appear as shift factors.
Using this framework we can analyse the impact of an adverse shock on child health outcomes. Figure 4
below depicts the mechanism through which adverse shocks impact child health outcomes. An adverse
shock can impact child health status through any of its arguments. An adverse shock primarily reduces
overall consumption including that of health-promoting goods (x) (given that health promoting goods are
non-inferior) such as nutritious food, protective clothing or protective items like mosquito nets, hygiene
products, medicines etc. Ceteris paribus, this will lead to a movement from a to c along the child health
production function .
FIGURE 4: ADVERSE SHOCK AND CHILD HEALTH OUTCOMES
An adverse shock could also lead to fall in public expenditure on health, leading to a further deterioration
in child health outcomes. This involves a shift of the child health production function from to .
Thus in addition to the decline in private expenditures on health (movement from a to c) there is a further
Chil
d h
ealt
h o
utc
om
e
c
a
b
d
Private expenditure on health promoting goods

10
deterioration in the child’s health status, as a result of the fall in public expenditure (movement from c to
d).
However the decline in child health outcomes as a result of the decline in (x) and (g), could be offset by
an increase in parental/caregivers time allocation (t). An adverse shock depresses employment and wage
opportunities, freeing up parental/caregivers time, which could be utilized for child care activities. If this
increase dominates the negative impact on health outcomes resulting from a decline in x, this shifts the
production function upward to , and child health outcomes rise from a to b.
Thus the effect of an adverse shock on child health status is theoretically ambiguous. As in the case of
educational outcomes, Ferreira and Schady discuss three factors that determine the relative importance of
the opposing forces on child health outcomes.
i) Given the diminishing marginal productivity of consumption for health-promoting goods, the
initial level of income matters. A reduction in income levels will have a large impact on health
in poorer societies than in richer societies.
ii) Large decreases in public expenditure on health will strengthen the negative impact of an
adverse economic shock.
iii) The effect of parental time reallocation may be stronger in richer societies, where the marginal
utility of consumption is relatively lower and the opportunity cost of time higher.
In light of this framework, we develop our empirical model on the impact of climatic shocks on child
educational and health outcomes. We also use this framework to gain better insights into the results found
in existing empirical literature.
2.2. Review of Empirical Literature
Before proceeding to an analysis of empirical literature on the impact of shocks on child human capital,
we discuss two influential review studies, Baez, de la Fuente and Santos (2009) and Ferreira and Schady
(2009) briefly.
Baez et al., (2009) review studies on the impact of natural disasters, focusing on ex-post consequences
and provide a separate treatment to short and long-term consequences. On the theoretical front they point
out that that the effects of natural disasters on child human capital are ambiguous. Direct effects such as
11
death and destruction of schools, hospitals and infrastructure have a negative impact on chid human
capital. However indirect effects such as depressed wages and changes in parental time availability can
either reinforce or mitigate the negative impact of natural disasters. This ambiguity intensifies when
heterogeneity in individual and household exposure to risk and coping strategies is considered. In light of
this framework, they review existing studies and present a number of key findings. Disasters result in
substantial loss of human capital in terms of death, retardation of the income generating process and the
detrimental impact on nutrition, health and education. They impact educational outcomes negatively by
affecting infrastructure complementary to education, destroying physical assets, reducing the incentive of
parents to send children to school and increasing the opportunity cost of going to school. Because
educational achievement is “path-dependent” (dropping out as a consequence of a shock decreases the
likelihood of a child coming back to school), disasters may have long-term consequences. When
considering nutritional outcomes, they find that as a consequence of disasters, families with imperfect
access to credit and insurance markets have lower consumption expenditure, particularly that on food, and
move close to subsistence levels. In such a scenario food insecurity and malnutrition become more likely.
Secondly, although there is substantial variation in the extent to which natural disasters affect individuals
from various socio-economic groups, the negative direction of the effects remains clear. A key finding is
that the poor are most vulnerable and carry the heaviest burden in terms of the impact on human capital.
On the policy front they emphasize that there is room, on the part of government, to minimize the impact
of disasters on child human capital through ensuring flexible safety nets and assistance programs are in
place and accurate identification of the impact on particular households.
Ferriera and Schady (2009) review studies on the impact of aggregate economic shocks on human capital
on the basis of the income and substitution effect framework discussed in the previous section. They
categorize studies on the basis of whether they reported a positive or negative impact on educational and
health outcomes respectively. Their main findings are that in highly developed economies and middle
income countries such as in Latin America aggregate shocks have a counter-cyclical impact on child
outcomes, with educational and health outcomes improving during recessionary periods. The exceptions
are Peru and Costa Rica. However for low income countries in Asia and Africa aggregate shocks in
general impact health and educational outcomes negatively. They explain this in terms of a larger income
effect arising from the high marginal utility of consumption in poor countries. Like Baez et al., (2009),
they conclude that variation in responses arises out of differences in regions, gender, occupations, socio-
economic status, ethnicity etc. The poor suffer disproportionately more as a result of aggregate shocks.

12
The review of empirical literature below is organized broadly on the categorization of the outcomes by
Ferreira and Schady i.e. i) negative effects of shocks on educational outcomes ii) positive effects of
shocks on educational outcomes iii) negative effects of shocks on health outcomes and iv) positive
effects of shock on health outcomes. Given increasing findings of ambiguous results, we also introduce a
new category to the Ferreira and Schady framework – iv) mixed effects or no effect of shocks on
educational and health outcomes. Secondly, while Ferreira and Schady focus exclusively on literature on
aggregate shocks, we include a review literature on both aggregate and idiosyncratic shocks. Given the
scope of this study, there is a marked focus on studies of natural disasters and climatic variability.
2.2.1. Negative effect of shock on educational outcomes
A number of studies have investigated the impact of economic shocks on schooling outcomes. In this
section we discuss studies that reported a positive impact of shocks on educational outcomes. While most
studies focus on enrolment and school attendance, others have analysed the impact of shocks on grade
attainment as well.
Flug, Spilimbergo, and Wachtenheim (1998) examine secondary school enrolment rates using cross
country panel data from 88 countries from 1970–92. The dependent variable employed is secondary
school enrolment as a proportion of secondary school-age population. This focus reflects the generalized
finding that primary schooling is compulsory in most countries and the opportunity costs are relatively
low. After controlling for each country’s initial income (in per capita terms) and average educational
attainment of the adult population they report that income and employment volatility had a significant
negative effect on school enrolment in low-income countries. The lack of financial markets also impacts
enrolment negatively. Their findings are robust to various specifications of volatility, inclusion of public
expenditure, and alternative sets of independent variables.
Guarcello, Mealli and Rosatti (2002) investigate the impacts of shocks and credit rationing on child work
and educational outcomes in Guatemala. Using propensity scores, Average Treatment Effects (ATT)
methodology and a bivariate probit model, they showed that school enrolment decreases and child labour
increases in response to broadly defined income shocks (loss of employment, death of a family member,
droughts in the region etcetera.) and credit rationing. Their study shows that borrowing constraints have a
major impact on households’ human capital investment decisions but are less relevant to households’
supply of child labour. The likelihood of withdrawing children from school is greater in credit-rationed
households; however parents are not necessarily more likely to send children to work. Shock-affected
households tend to make their children do more work while keeping them in school, in order to

13
compensate for unexpected income losses. Behrman et al., (2006) report similar adverse effects. They
examine cognitive skills and determinants of grade attainment among adults born in four villages in
eastern Guatemala, using a rich longitudinal data set. They conclude that the 1976 earthquake in that
country adversely affected grade attainment and cognitive outcomes, by affecting early child health.
Numerous studies have investigated the impact of droughts on schooling outcomes in Africa. Jensen
(2000) analyses the effects of drought on school enrolment in Cote d’Ivoire. He employs a difference in
differences approach using panel data from the Cote d’Ivoire Living Standards Survey (CLSS), for 1986–
87, to compare outcomes for children in drought affected and drought-free villages. Drought affected
households constituted 20 percent of the sample in the study. He finds that in drought-affected villages,
the school enrolment of boys fell by 14 percentage points, whereas it increased by 5 percentage points for
boys in non-drought areas. For girls in drought-affected areas enrolment fell by 11 percentage points
compared to a growth in enrolment by 10 percentage points for girls in drought free areas. Otherwise put,
enrolment rates declined by about 20 percentage points for children in drought-affected areas, relative to
children living in drought free areas. Lack of, or imperfect access to credit increases the likelihood of
children dropping out from school earlier.
Beegle, Dehejia and Gatti (2003) examine the links between income shocks, child labour, school
enrolment and borrowing constraints, using four rounds of household survey data from the Kagera region
of Tanzania. In this region, households use almost no purchased inputs and the most rudimentary
technology (no tractors are used for instance); also the use of wage labour is very limited. They show that
transitory income shocks — measured in terms of accidental crop loss due to pests and other disasters —
leads to significantly increased use of child labour, typically by having children substitute adult labour in
household activities such as gathering water and firewood. In parallel, they show a decrease in school
attendance. They also report that asset ownership enables households to buffer such shocks. However
wealthier households draw upon their assets to a lesser extent, indicating that they may be borrowing to
buffer such shocks.
For Malawi in 1994–95, World Bank (2007) reports that a negative rainfall shock, ten percentage points
below the long-run average results in a 23 percent rise in the fraction of students who missed two or more
consecutive weeks of classes in the past year. The strongest effects were documented for children in the
poorest households. Hyder, Behrman and Kohler (2011) investigate the impacts of negative economic
shocks on child schooling outcomes in households of rural Malawi, a poor country in Sub-Saharan
Africa. The study employs two waves of household panel data from the Malawi Longitudinal Study of
Families and Health (MLSFH), for the years 2006 and 2008. The panel comprised children between the

14
ages of 6 and 15 in the year 2009. Two types of schooling outcomes are studied: child enrolment and
child school attainment gap. Probit estimators are used for the former, whereas OLS (Ordinary Least
Squares) estimators are used for the latter, with dummy variables for individually-reported or community
level shocks and controls for heterogeneity. Their finding indicates a significant negative impact of
adverse economic shocks on school enrolment and grade attainment. Community shocks have a greater
and more pervasive impact as compared to idiosyncratic shocks.
Berhane, Abay and Woldehanna (2015) investigate the impact of shocks of exposure to drought, food
price shocks and social shocks such as divorce on the cognitive scores of children, as measured by the
Peabody Picture Vocabulary Test (PPVT) score, in Ethiopia. They utilize panel data from two rounds of
the Young Lives Survey for the younger cohort of children (aged 4-6 years in 2006) and employ a
difference-in-differences analysis with controls for child, household and village characteristics, and show
that exposure to shocks has a significant negative impact on child cognitive skills. Drought reduces child
PPVT scores by 0.18 standard deviations whereas the food price inflation shocks reduce PPVT scores by
more than one standard deviation. Divorce results in a fall in PPVT scores by 0.39 standard deviations.
However, they find that the Productive Safety Net Programme (PSNP) mitigates the reduction in PPVT
scores by 0.18 standard deviations.
De Vreyer, Guilbert and Mesple-Somps (2015) investigate the long run impact of the adverse income
shock resulting from the 1987-89 locust invasion in Mali. Thet employ population census data and use a
difference-in-differences approach by comparing children born and living in the years and villages
affected by locust plagues with children born in unaffected areas and years. For children born in the
invasion years: 1988-1989, and children who were less than 7 years old at the time of the invasion,
education outcomes were found to be impacted. They show a strong negative impact on enrolment for
children living in rural areas but no impact on children living in urban areas. The adverse impact on
enrolment of boys is greater than that for girls, although girls living in rural areas had a lower level of
school attainment than boys.
Turning to Asia, Sawada and Lokshin (2003) use field surveys conducted in twenty-five villages to
identify obstacles in educational progression in Pakistan. Using a full-information maximum likelihood
(FIML) estimation of sequential schooling decision model, they find that negative income shocks,
sickness of household members and the sudden death of an adult member have an adverse effect on the
continuation and completion at the primary as well as secondary school level, and encourage dropouts.
Secondary school dropout is smaller than primary school dropout. They attribute it to the absence of
formal and informal credit and insurance markets in rural areas in Pakistan.

15
Thomas et al., (2004), utilize data from the Indonesian Family Life survey to study the impact of the 1998
financial crisis, in Indonesia, on enrolment and expenditure on schooling. They report that the crisis led to
a decline in enrolment especially for younger children. They interpret this as evidence that families focus
on keeping older children enrolled in school, at the expense of the schooling of younger children.
Dung (2013) uses panel data on rural households from two rounds of the Young Lives survey, conducted
in 2006 and 2009 to examine the effects of crop and health shocks on child schooling in rural Vietnam.
The use a fixed effect model which explicitly incorporates borrowing constrains in order to compare the
impact of shocks on constrained and non-constrained households. They report that in non-constrained
households educational outcomes are not significantly affected. However, in borrowing constrained
households the probability of dropping out increases whereas expenditure on child education and
children’s study time out of school decreases. This may affect performance and grade attainment at
school.
For Latin America, Duryea, Lam and Levison (2007) employ longitudinal data from Brazil’s Monthly
Employment Survey: the Pesquisa Mensal de Emprego (PME) from 1982-199, to analyse how household
economic shocks impact the schooling and employment decision of children between the ages of 10 and
16. They employ probit regression to compare the parental decision making process in households in
which the male household head become unemployed for a period of four months with households in
which the head is continuously employed. They show that an unemployment shock occurring during the
school year has a significant positive impact on the probability of the child entering the labour force,
dropping out of school and failing to advance in school. In contrast, shocks taking place after the school
year do not impact schooling outcomes significantly.
2.2.2. Positive impact of shock on educational outcomes
A number of studies on the United States report a positive impact of shocks on educational outcomes.
Goldin (1999) analyses secondary enrolment and graduation rates in the United States, during the Great
Depression. He reports that the largest increase in enrolment and graduation rates, in secondary schools,
took place between 1928 and 1938. During this period the states that saw the highest increase in
unemployment – Delaware, New Jersey, New York, and Pennsylvania – experienced a marked rise in
their enrolment and graduation rates, compared to other states in the United States. Black and Sokoloff
(2006) also report a similar countercyclical pattern of investment in schooling, in a qualitative analysis of
the history and conditions of the education system in the United States.
16
Studies on the United States, for more recent periods of time, also report similar findings. Betts and
McFarland (1995) examine how business cycles during the late 1960s to mid-1980s affected enrolment at
community colleges. They report that a one percent rise in the overall adult unemployment rate is
associated with a four percent rise in community college attendance. A rise in the unemployment rate of
recent high school graduates results in a half percentage point increase in attendance. Kane (1994)
employs panel data for 18-19 year old individuals, during the period 1973 to 1988, and reports a negative
association between college enrolment and average weekly earnings in manufacturing. He also shows that
this counter-cyclical effect is stronger in the case of enrolment decisions by African-Americans, who are
on average poorer than white Americans.
The positive impact of macroeconomic shocks on educational outcomes has also been reported for some
middle income countries too. In evaluating the impact of the Asian financial crisis on schooling outcomes
in Thailand, Behrman, Deolalikar and Tinakorn (2007) report that a decline in wage rates in the public
sector is associated with increased average schooling. In the case of Latin America, Binder (1999)
examines the relationship between changes in school retention and continuation rates and changes in GDP
to estimate the income-elasticity of schooling. The study employs data across two recessions in Mexico:
1982-83 and 1986. School retention rates are calculated by dividing school enrolment at the onset of the
academic year by enrolment at the close of the academic year. School continuation rates are measured by
the ratio of the number of students commencing a given grade to the number of students who graduated
from an earlier grade in the previous academic year. The results indicate a strong counter-cyclical pattern
of both school retention and continuation rates. Moreover sharp positive hikes in rates corresponded to
periods of economic contraction.
McKenzie (2003) investigates the impact of the Mexican Peso crisis of 1995–96 on school enrolment and
various other outcomes, using the Encuesta Nacional de Ingresos y Gastos de los Hogares household
surveys for four different survey years: 1992, 1994, 1996 and 1998. The Peso crisis led to a sharp fall in
per capita GDP and a contraction in real wages of 21.7 percentage points. The study employs a
differences-in-differences approach to test for changes in school enrolment before, during and after the
crisis. The key finding is that enrolment grew faster during the crisis period (1994-96) than either before
the crisis (1992-94) or after the crisis (1996-98). This counter-cyclical effect was particularly apparent
among boys aged 15-20.
Schady (2004) analyses the impact of the Peruvian recession of 1988-92, during which GDP per capita
fell by almost three percentage points, on three outcome variables: schooling, mean number of grades

17
completed and employment of urban school-age children in Peru. He pools data from three household
Living Standard Measurement Surveys (LSMS) for the years: 1985/86, 1991 and 1997. In the first part of
the analysis, the methodology employed is probit regressions for the probability of attending school and
being employed, with the inclusion of binary choice variables for the non crisis years (1985/86 and 1997)
and controls for household characteristics. In the second part of the analysis, he uses OLS regression for
cumulative number of grades passed, with binary choice variables for the non-crisis survey years. He
finds that the probability of attendance was lower during the crisis year of 1991, compared to the post-
crisis survey year (although the magnitude of this difference was small). There was no significant
difference in the probability of attendance during the pre-crisis and crisis years. More importantly, the
probability of children employed in work was also lower during the crisis. In other words children were
far more likely to combine schooling and worked in the non-crisis years compared to the crisis year of
1991, thereby suggesting that perhaps children who are not working have more time available and may be
putting greater effort in school. The results for the cumulative number of grades completed suggest that
an additional year of exposure to the crisis leads to a 0.04 to 0.05 increase in the number of grades
completed. Alternatively put, four out of five children exposed to the crisis completed an additional year
of schooling compared to children who were not exposed to the crisis.
Duryea and Arends-Kuenning (2003) examine the effects of two macroeconomic contractions: the 1981-
83 recession (following adoption of the IMF austerity plan) and the 1990-92 recessions (owing to
inflation reduction policies) on schooling in urban Brazil. They estimate bivariate probit models using the
independent variables: propensity to attend school and employment, so as to examine the correlation
between the error terms in the school attendance and employment equations. For each equation they add a
dummy variable indicating crises years, to test for the impact of the crises on parents investment in
schooling. They also employ controls for the demographic characteristics of the child and her family, as
well as controls for labour market conditions across states. They report evidence that higher state level
wages for low-skilled workers are associated with a lower likelihood of the child attending school.
However they go on to show that there is no evidence that school enrolment rates changed substantially
for children during crisis years. Deterioration of labour market conditions that lower family income do
not increase the probability of the child stepping into the labour force at the expense of school, primarily
because the effect is offset by declining opportunity costs of schooling for children.
Neri and Thomas (2001) use a difference in difference analysis on panel data from Brazil’s Monthly
Household Employment Survey, the PME, to investigate the effects of income and employment shocks
on children’s schooling and participation in the labour market. They combine the analysis of both
aggregate and idiosyncratic shocks and report a similar countercyclical pattern of child schooling.

18
Dropout rates for both girls and boys and subsequently repeating the school year are higher during
upturns than during downturns. However, for children who stay in school, the probability of the child
repeating the school years rises during recession, although not during periods of growth.
Maluccio (2005) studies the effects of the dramatic reduction in the price of coffee between 2000 and
2002 on schooling outcomes, in Nicaragua. He uses data from the Social Protection Network - Red de
Proteccio’n Social (RPS) – a pilot condition cash transfer (CCT) programme, in select rural areas. For the
control group (those that were randomly assigned not to receive transfers under the CCT programme), per
capita consumption fell by an average of 10 percent in non coffee-growing areas whereas it fell by
roughly 27 percent in coffee-growing areas. This reduction in consumption was accompanied by an
increase in the enrolment of children between 7 to 12 years of age. The increase was particularly marked
in coffee-growing areas. School enrolment increased by 15 percent for boys, thereby suggesting that the
opportunity cost of attending school fell sharply.
2.2.3. Negative impact of shock on health outcomes
We now progress to reviewing studies of the impact of shocks on health outcomes. The nutrition and food
security literature have widely documented the effect that short-term damage to nutrition could have on
children’s short and long-run health outcomes. In this respect studies on the impact of drought on the
health of young pre-school children in Africa abound. Jensen (2000) examines the impact of rainfall
shocks in Cote d’Ivoire on the health and schooling outcomes of children. Using a difference-in-
differences approach, he compares the practice of consulting a health practitioner in drought-affected and
non-drought areas, before and after the shock. His results show that prior to the shock, both groups had
almost similar consultation percentages of about 50 percent. However, post-drought consultation declined
dramatically to about one third for children in households affected by the drought, and increased slightly
for boys in areas with normal rainfall (there was no recorded difference in the prevalence of disease and
illness in both areas). Using World Health Organisation (WHO) defined Weight for Height (WFH) z-
scores, he shows that malnutrition increased for both groups, but the increase was more marked in
drought affected areas. An additional 3 to 4 percent of children were moved into malnutrition in regions
affected by the drought (in the case of girls, this effect was found to be statistically insignificant).
For rural Ethiopia, Yamano, Alderman and Christiaensen (2006) study the impact of drought shocks
(expressed through crop damage) on child health, over the period 1995/96. They use data, for the year
1995-96, from three distinct surveys on Ethiopia: the Rural Integrated Household Survey Program
(RIHSP), the Food Security Survey (FSS) and the Annual Agricultural Sample Survey (ASS). They show

19
that the shock had a substantial adverse effect on child health. Children aged 6-24 months experienced
about a 0.9 cm growth loss over a period of six months, when half of their crop area was damaged
compared to communities whose percentage of damaged crop area was less than fifty percent. Stated
otherwise, a ten percent point increase in damaged crop area corresponded to a reduction in child growth
by 0.12 cm over a period of six months. They also study the impact of food aid in mitigating the adverse
effects of the shocks, and find that it has a substantial effect on improving the growth of children in this
age group.
Hoddinott and Kinsey (2001), used rive rounds of panel data to investigate the impact of rainfall shocks
on child height in rural Zimbabwe. They show that children, who were 12 to 24 months old, during a
drought in 1995-6, grew by 1.5-2 centimetres less than children living in non-affected areas. They also
show that older children do not appear to experience a similar retardation in growth. The authors point out
that this slowdown is consistent with previous literature on nutrition which suggests that children show
marked vulnerability to nutritional setbacks between weaning and two years of age. They also show that
the loss in growth is unequally distributed, with children from poorer households owning little livestock
and female children being more adversely affected.
Alderman et al,. (2006) found similar results, when studying the impact of a previous drought between
1982-84 and the 1980 civil war in Zimbabwe, on child nutritional outcomes. They find that the temporary
hunger, at the time of drought, resulted in stunting of children between 12 and 24 months of age
(recognised as the most critical time for child growth). These children had lower growth in late
adolescence (2.3 centimetres less) compared to other children, as well as delays in school enrolment (3.7
months) and reduction in grade completion (0.4 grades) 13 to 16 years after the droughts.
In the case of Kenya, Cord, et al., (2008) report similar findings – children born during drought years
have a 36 percent greater likelihood of being undernourished. For the Kegara region in Tanzania,
Alderman, Hoogeveen, and Rossi (2009) use a rich panel data set covering a period of over ten years and
show that children who experienced weather shocks in the early stages of childhood have a greater
likelihood of developing low height for age (HFA) and joining school late. Moreover, it is also more
likely that children in affected areas complete fewer years of schooling, in adolescence.
Maluccio (2005) investigates the impact of the reduction in the price of coffee between 2000 and 2002 on
child growth in coffee-growing areas in Nicaragua. The results indicate that the coffee price shock was
associated with a decline in the HFA z-score of children between the ages of six months and four years,
by 0.15 standard deviations, although the coefficient was only borderline significant.

20
Baez and Santos (2007) analyse the impact of a hurricane shock, and in Nicaragua. Their results indicate
that the children aged 0-15 years in affected areas are 30 percent less likely to be taken for medical
consultation conditional on being sick, even though there was no significant difference in the incidence of
illness between affected and non-affected children. Furthermore in the sample of children aged 0-4 years,
the likelihood of being undernourished among children in exposed regions almost quadrupled (8.7
percentage points increase). The overall distribution of nutritional status for exposed children –especially
those in the tail– worsened substantially as a result of the hurricane.
Pradoc (2009) investigates the impact of natural disasters on children’s nutrition in the case of
Mozambique. Their main finding is that natural disasters negatively affect children’s height-for-age for
children between one and three years old. In the case of Mali, according to De Vreyer, Guilbert and
Mesple Somps (2011), early life shocks, like the locust plague experienced by Malians in the period
1987-1989, have a long-lasting effect on nutrition and, thus, on educational enrolment and completion.
The study shows a differential effect on girls and boys, confirming the gender discrimination prevalent in
Mali, and a lack of insurance mechanisms that could have helped in smoothing consumption.
In the case of Latin America, Cutler et al., (2002) explore the impact of economic crisis on health in
Mexico between 1980 and 1988, using registration data. They focus on three different periods of
economic contractions (1982-84, 1985-89, and 1994-96), and employ a difference in differences
estimation procedure to compare the impact of crisis on mortality before and after the crisis. They find
that mortality rates for the very young and the elderly increase or decline at a slower rate in crisis years as
compared with non-crisis years. For children between the ages of 0 and 4, mortality rates were roughly
seven percent higher – translating into approximately 7000 additional deaths among the children.
Rocha and Soares (2012) analyse the impact of rainfall fluctuations in Brazil, during the gestational
period, on health at birth. They concentrate on the semiarid region of north-eastern Brazil to underscore
the role of water availability as a determinant of early childhood health. They find that negative rainfall
shocks are associated with higher infant mortality, lower birth weight, and shorter gestation periods.
Mortality effects result primarily from malnutrition and intestinal infections and are greatly minimized
when the local public health infrastructure is well-developed. Unlike other studies, their findings are
driven by water scarcity per se, rather than through the channel of reduced agricultural productivity..
Their results suggest that expansion of the public health infrastructure would be a cost-effective way of
reducing the responsiveness of infant mortality to rainfall shocks.

21
Skoufias and Vinha (2012) have analysed the health impacts of climatic variability on children (aged 12-
47 months) in rural Mexico. They employ data on nutrition from the 1999 National Nutrition Survey:
Encuesta Nacional de Nutrición (ENN). The Instituto Mexicano de Tecnología del Agua (IMTA) served
as the source for the meteorological data. The research attempts to quantify the extent to which unusual
weather negatively affects children’s height-for-age. The principal finding is that unusual weather
conditions affect children’s long and short term health and productivity adversely. However, it is unclear
whether the effect results from decreased income (and hence consumption) or from the high rates of
communicable diseases and ailments under these conditions. They emphasize that both these pathways
are important.
Bustelo, Arends-Kuenning and Lucchetti (2012) study the effects of the 1999 Colombian earthquake on
child schooling and nutrition outcomes. The paper uses the data from four surveys of the Colombian
Demographic Household Surveys (DHS): two surveys prior to the earthquake and two surveys after the
earthquake. The nutritional status and schooling outcomes of children in affected and non affected
departments are studied and compared before and after the earthquake, so as to analyse both short and
medium term impacts. Findings report a significant negative impact of the earthquake on child schooling
and nutritional outcomes in the short-term. They show that the HFA z-score falls by 0.182 standard
deviations for children living in affected departments, immediately after the earthquake. Their results also
show that these results vanish in the next year, indicating that earthquake relief may have played a role in
mitigating the negative impact on nutrition.
Rossel (2008) studies the impacts of different type of shocks on anthropometric measures for one year old
children in Peru. He employs data from Round 1 and Round 2 of the Young Lives survey. Using OLS and
Instrumental Variable (IV) estimation technique he shows that death of a parent reduces the HFA z-score
of the child by around 1.7 standard deviations. Agricultural losses reduce the HFA z-score by 0.28
standard deviations whereas climatic shocks reduce the HFA z-score of the child by 0.17 standard
deviations. The latter is equivalent to 10 percent of the initial HFA z-score, and the reduction represents a
quarter of the total retardation observed in HFA during the period under consideration. He also
investigates the impact of government aid in buffering climatic shocks. The coefficient estimate of
government aid received is negative but insignificant.
In the Asian continent, Madhu et al., (2005) study the impact of drought on nutritional outcomes of 914
pre-school children, under five years of age, in 24 villages in Rajasthan, India. They show that stunting
was observed in 53 percent of children, whereas wasting was present in 28 percent of children. Moreover
wasting was greater than the WHO cut off point of 15 percent, indicating that malnutrition is of critical

22
concern. The prevalence of wasting was high, greater than the cut-off point of 15% stated by the WHO.
Gender differences in the prevalence of malnutrition were also found, with girls having a greater
likelihood of being malnourished, as a result of being affected by the drought.
Datar et al., (2013) investigate the impact of various natural disasters on indicators of childhood health
including morbidity, physical growth, and immunizations by pooling household data from three waves of
the Indian National Family And Health survey (NFHS) and the Emergency Disasters Database (EM-
DAT). They employ a fixed effects panel regressions for indicators of health, with a dummy variable for
whether a natural disaster took place or not, and controls for heterogeneity (gender, birth order, quadratic
in mother's age at the time of birth, parental education, religion, scheduled cast etc). The results show that
exposure to a natural disaster in the past month leads to an increase in the probability of acute illnesses
such as fever, diarrhoea and respiratory problem , in children under 5 years of age by 9-18 percent. In a
household affected by natural disaster in the past year, Height for Age (HFA) and Weight for Age (WFA)
z-scores drop by 0.12 – 0.15 standard deviations – a seven percent increase in the likelihood of stunting
and being underweight. The disaster also reduces the probability of having complete age-appropriate
immunization by almost 18 percent. The effects of the disaster vary significantly by age, gender and other
socio-economic characteristics; for instance the negative impact on HFA is much smaller among boys and
infants. With respect to maternal education, they find that children of uneducated mothers are more likely
to be stunted and thin, as a result of exposure to shocks. Finally, children in the southern states of India
weigh significantly more and are more likely to be vaccinated than those in the rest of the country
following a disaster, which is consistent with relatively greater economic development among southern
states.
Foster (1995) examines the impact of a major destructive flood in 1988 on children’s weight in
Bangladesh, using survey data collected by the International Centre for Diarrhoeal Disease Research in
Bangladesh (ICDDRB). He reports significant negative effects on the weight of children in credit-
constrained households affected by the flood. The incidence of infant malnutrition rose by over three
times, among households exposed to intense rainfall. For households with access to credit, the effect on
nutrition was mitigated, though not completely.
Del Ninno and Lundeberg (2004) investigate the impact of the 1998 flood in Bangladesh on children’s
health status. They employ data from three rounds of a household survey in seven flood affected areas,
and restrict their analysis to children less than 45 months old at the time of the flood. The flood had no
significant impact on the heights of infants. However exposure to flood reduces heights by roughly 0.5
standard deviations, for children over two years of age. This implies a substantial impact of 5 centimetres

23
for a 3 year old child. Within the households exposed to the flood, the percentage of stunted children in
the bottom 40th
percentile (by consumption distribution) was substantially higher than that of households
in the top 20th
percentile, a year after the flood. They report no significant impact of the flood on the
weight-for-height indicator. Finally, they suggest that ex-ante government intervention programs are more
effective in protecting child health outcomes as compared to ex-post government intervention.
Studying the case of rural Vietnam, Thai and Falaris (2011) find that negative climate shocks (during
gestation and early life) destroy crop production and affect households’ income leading to an indirect
effect on children’s nutrition and schooling. HFA is used as a proxy for nutrition, and enrolment and
grade attainment are used as proxies for schooling. They find evidence of stunting and delayed entry to
school and slower progress. The effects vary by region; in regions where households face greater
difficulties to smooth consumption the adverse effects of the shock are most prevalent.
2.2.4. Positive effect of shock on health outcomes
In the case of developed countries, many studies report an improvement in health outcomes as a result of
economic shocks. Wagstaff (1985) reports a counter-cyclical pattern of health outcomes during the Great
Depression. Ruhm (2000) estimates a fixed effects model of the effect of unemployment on adult
mortality between 1972 and 1991, using longitudinal state level data. He shows how the adult health
status tends to improve during recessions in the United States, perhaps as a result of an increase in
exercise and a decreasing in excessive drinking and smoking during recessions.
Deaton and Paxson (2001) employ data on birth cohorts in the US, from 1975-1995, and find that
increases in income during recovery periods increases mortality. They argue that this may be a result of
increases risk-taking behaviour during upturns. Chay and Greenstone (2003) report that infant mortality
behaves counter-cyclically: a greater number of babies die during recovery periods. Dehejia and Lleras-
Muney (2004), employ data for US states to examine the behaviour of infant mortality and health status
during recessions. They report a fall in the number of low birth-weight babies and a decline in the
incidence of infant mortality during recessions. On further analysis they attribute this to two factors: a
change in the composition of mothers (there is a reduction in the number of black high-school dropouts
who chose to have children during recessions) and behavioural changes among mothers (mothers have
more prenatal care visits during recessions).
In the case of developing countries, positive impacts of shocks on health outcomes have been seldom
reported. Miller and Urdinola (2007) utilize a difference-in-differences estimation approach on population

24
census data to analyse changes in infant mortality following coffee price shocks in Colombia in 1975,
1985 and 1989-9. They show that infant mortality increases when there are positive price shocks (i.e.
higher incomes in coffee growing areas) and decreases when coffee shocks are negative. They report a
0.4% – 2.0% decrease (increase) in cohort size following a coffee price increase (decrease) shock.
However, Ferriera and Schady (2009) are sceptical about the magnitude of the coefficient.
Evidence of a positive association between health outcomes and climatic shocks or natural disasters is
thin. However, many studies report evidence of no significant impact and are discussed in the subsequent
section.
2.2.5. Ambiguous or no impact associated with shock
While most studies report either positive or negative impact of shocks on educational and health
outcomes, there are a few studies which find either no significant impact on human capital or report
different impacts on the basis of the type of outcome variable employed. Some of these studies are
discussed below, and serve as a caveat that over-simplification of results and generalisation into the broad
‘positive’ and ‘negative’ categories is not always possible in the investigation of the impact of shocks on
human capital, particularly in the case of individually reported shocks, which reflect differences in the
ability of households to cope with shocks.
Jacoby and Skoufias (1997) explore how child school attendance responds to fluctuations in the income
of agrarian households resulting from the variability of monsoons across rural India and the impact of
financial market imperfections on the investment in human capital decision. They use panel data from
Village Level Studies (VLS) survey, conducted by the International Crops Research Institute for the
Semi- Arid Tropics (ICRISAT). They employ data on children between the ages of 5 and 18 from six
villages in the survey, including two villages in Andhra Pradesh and four villages in Maharashtra. Given
that rainfall surprises affect farmers differently, responses to both aggregate and idiosyncratic and in
addition anticipated and unanticipated income shocks are studied. This is done by incorporating child
labour in the framework and estimating a structural model of human capital investment that quantifies the
cost of using child labour as self insurance. Their principal finding is that seasonal fluctuations in school
attendance are a form of self insurance but do not result in any substantial loss of human capital on
average. In light of their results they posit that, as a policy, an expansion of educational opportunities for
the poor, without an understanding of their income constraints will not result in a complete success.
Policies must understand relevant economic risks and constraints and recognize that compulsory
schooling laws may conversely lower household welfare. Secondly, policies promoting short-term credit
and insurance may affect economic growth by affecting human capital investment decisions.

25
Another influential study is that of Shah and Steinberg (2013). They utilize rainfall fluctuations in rural
India in order to measure the effect of productivity changes on human capital investment at all ages of a
child’s life. The study exploits fluctuations in monsoon rainfall over time and across districts. ASER data
from 2005-09 is used to test the hypothesis; approximately two million rural children from almost all
states of India were taken. The data includes four distinct measures of literacy and numeracy as well as
more standard educational measures such as school enrolment and age for grade. They find that children
who are in-utero during droughts score significantly worse on math and reading tests, are less likely to
attend school, and less likely to be “on track” (age for grade). The income effect dominates in the foetal
stages because the time input of parents (and children) is limited during this stage and nutrition and other
prenatal inputs are especially crucial for development. By contrast, the substitution effect will become
relatively more important as children age. Time inputs become relatively more important as children start
attending school, spending time on homework, etc. Agricultural productivity increases could cause both
children and parents to substitute away from human capital investment toward productive activities
(either in or out of the home). Under certain conditions the substitution effect could dominate, and
negative rainfall shocks could increase human capital attainment. The analysis found that during drought
years, children reported higher school attendance; by contrast, during high rainfall years when children
were more likely to report having dropped out. For the children in the sample, the substitution effect of
higher wages dominates the income effect for human capital investment, and higher rainfall is associated
with lower school attainment. They also emphasize an important policy implication - higher wages for
low education jobs could have the counterintuitive effect of lowering human capital investments in
children.
Galab and Outes-Leon (2011) explore the effect of drought in India, on the schooling and work patterns
of children aged 11 to 12, using the Young Lives dataset. The empirical analysis suggests an increase in
the probability of dropping out and fewer hours spent at school, for children from households involved in
farming land. By contrast, enrolment is not affected for children belonging to landless rural households.
They employ controls for gender and birth order, and show that ignoring child heterogeneity
underestimates the effect of a drought on schooling outcomes. Paradoxically, for eldest sons in drought-
exposed households, the likelihood of remaining in school rises and so does time spent at school, as
compared to children in unaffected households (for whom both outcomes are negatively affected as a
result of the drought). They also study the impact on a cognitive measure of attainment, namely the PPVT
test. Their results indicate that for irrigation-farming households PPVT scores show an improvement in
drought-affected households (owing to the increased time spent at school). Thus they caution about the
effect of heterogeneity on estimates of climatic shock impacts.
26
Cunningham and Maloney (2000) use the Mexico National Urban Employment Survey: Encuesta
Nacional de Empleo Urbano (ENEU), which follows households over five consecutive quarters, to
analyse how per capita income changes affect households and the coping strategies they employ, across
the period 1994-1997. They use quantile analysis to characterize families on the basis of the magnitude of
their fall in come. They find weak evidence that parental job loss causes children to leave school and
enter employment. The evidence also suggests that girls are more adversely affected than boys.
Baez and Santos (2007) provide evidence that the quality of school attainment could also be compromised
by child labour. They report no evidence of changes in enrolment, as a result of exposure to Hurricane
Mitch in 1998. However enrolment rates increased markedly for children belonging to households in
shock-affected, as well as non-affected areas. However, the rise was proportionally greater for shock-
affected children. However, they show that this owes to documented efforts to increase school enrolment
in rural areas during this time. Once municipality fixed effects and pre-shock public programs are taken
into account, the difference in school enrolment between affected an unaffected areas disappears. They
also find that labour force participation increased by over fifty percent among children in areas affected
by the hurricane. Similarly, the proportion of children simultaneously enrolled in school and working
more than doubled, going from 7.5% to 15.6%.
Dillon (2008) examines the impact of different shocks on the probability of dropping out in Northern
Mali. He reports that crop shocks and sickness in adult females significantly increase the likelihood of
dropping out. He shows that the effect on schooling outcomes and child labour varies for different types
of shocks. Ownership of livestock can act as a buffer against shocks; households with large livestock
holdings have a smaller likelihood of pulling children out of school in the face of crop shocks. However,
their children tend to do more paid work as well as participate in home production activities. On the other
hand, households with greater agricultural capital are more likely to withdraw children from school when
they face a large crop shock; school attendees from these households tend to do less paid and unpaid
work.
Colmer (2013) examines how school enrolment and allocation of child labour to home and outside
activities is affected by income uncertainty arising out of rainfall variability in rural Ethiopia. He employs
two rounds of panel data from 2004 to 2009, from the Ethiopian Rural Household Survey, covering 15
communities in rural Ethiopia, and village level meteorological data. The aim is to examine the impact of
rainfall variability on time allocation decision at the intensive margin (between labour in the home to
labour on the farm) and at the extensive margin (between educational attainment and labour
27
participation). He employs a fixed effects regression approach, so as to capture village fixed effects and
heterogeneity and shows that an increase in rainfall variability results in a substitution away from child
labour in the home to labour on the farm. However, unlike prior research on the area, there is no effect of
climate shocks on school enrolment or grade attainment. At the extensive margin, the only significant
effect is that children have a greater likelihood of participating in child labour on the farm.
For the case of Indonesian adults, Maccini and Yang (2009) investigate the impact of early-life shocks
(higher rainfall) on economic development variables, including health, education, and household’s assets.
They use data on rural areas from the third wave of the Indonesia Family Live Survey (IFLS). Their
results point out that higher early-life rainfall has a positive effect on women’s variables (resulting in
higher socioeconomic status), but not on men’s, stressing the gender discrimination issues of the
Indonesian society. The channel through which higher rainfall influences the future socioeconomic status
of women is through its impact on agricultural production, which, in turn, will increase household’s
income, improving their health status and schooling attainment, later in life.
Another study on Indonesia, Sharma (2014) uses data on 7-15 year-olds from three waves of the
Indonesian Family Life Survey (IFLS), to study the impact of the Indonesian financial crisis of schooling
outcomes in urban areas. The crisis was characterised by soaring inflation and an extraordinary drop in
real wages of over forty percent over the course of a year. There was a rapid increase in the price of rice,
which constitutes the single most important expenditure in the budget of the average Indonesian family.
Thus Sharma (2014) exploits the variation in rice prices, based on the premise that communities with the
greatest increase in rice prices were those where real wages declined the most. They discover that higher
rice price increases are associated with small declines in school enrolment and time spent in school. For
younger children (7-12 years of age) the impact on school attendance is more marked, although there is
no significant impact on labour market participation. However, for older children (13-15 years of age),
school enrolment is not significant affected by rice prices, whereas labour market participation declined
sharply in the worst-hit communities. She then uses data from a follow up survey in 2007, and shows that
the crisis does not have a longer-term negative impact on human capital formation. In fact, children in
communities with the greatest rice price increases were more likely to undergo an additional year of
schooling.
Tiwari and Skoufias (2013) study the impact of monsoon rainfall shocks on child health status in rural
Nepal. They utilize three rounds of the Demographic and Health Survey (DHS) conducted in Nepal over
the last decade, along with data on precipitation from rainfall stations. They show that a 10 percent
increase in rainfall from the historical average, after a recently completed monsoon season results in an
28
increase in WFA by 0.15 standard deviations, for children between 0-36 months. They refer to this effect
as the positive ‘income effect’. However, for a rainfall shock occurring during the current monsoon
season, there is a reduction in weight-for-age by 0.02 standard deviations. This is referred to as the
negative ‘disease environment effect’. They also examine the impact on child height, and find that excess
monsoon rainfall enhances child stature, if the shock is experienced in the second year of the child’s life
(Maccini and Yang, 2009 report a similar finding). However this effect is only transitory and disappears
completely by the age of five.
Hyder and Behrman (2014) have examined the impact of four different climatic shocks (drought, floods,
hailstorms/land erosion, crop failure and the death of livestock) on child school enrolment and children’s
abilities and learning processes, after controlling for characteristics particular to the child, household or
the community. The study employs data on the older cohort of children, from Rounds 2 and 3 of the
Young Lives data set. Climatic shocks are expressed in terms of individual as well as community wide
perception of these shocks. To study educational outcomes they employ school enrolment rates, raw
scores on the PPVT and mathematics test. Health outcomes are studied using two measures the Body
Mass Index for age (BFA) z-score and HFA z-scores. They find two significant effects of community-
level shocks on school enrolment: negative for drought shocks (community-level) and positive for
hailstorm/ erosion. No significant effects of individual reported shocks are found. With respect to the
indicator PPVT scores, droughts and hailstorms/erosion have significant negative effects on PPVT scores,
regardless of whether the shocks are perceived by individuals or the community. The negative sign for
community-informant-reported hailstorms/erosion is in contrast to the significant positive effect of this
variable on school enrolment. However, the coefficient estimates for community-respondent-reported
flood and livestock/crop disease shocks are both positive, suggesting that the price effects of lessened
labour market alternatives dominate so that learning increases due to more time studying. The only
significant shock coefficient shown in mathematics test scores is for community perceived
hailstorms/erosion, which is negative as is the case for PPVT. They also discover that physical assets
(wealth index) and household human capital (parent’s education) play a positive and significant role in
buffering the shock in all equations for learning outcomes which include school enrolment, PPVT test
score and mathematics test score. With respect to the BMI for age z-score short term health indicators,
there is a significant negative association with individually perceived droughts and hailstorm/erosion
shocks. However the community perceived shock is significantly positively associated for the
hailstorm/erosion shock. Community perceived shocks are significant for crop/livestock pest/disease
shock. Individual and community perceived drought and hailstorm/erosion shocks are all significantly
negatively associated with the HFA measure of long-term nutritional status, thus implying long-term
negative effects on health and nutritional status resulting from climate shocks. In sum, the authors report

29
both positive and negative associations of different indicators of human capital attainment to climate
shocks. While negative shocks dominate, the existence of positive associations suggests a dominance of
price over income effects. Their results lend confirmation to the argument developed by Ferreira and
Schady (2009) that the economics of idiosyncratic and aggregate shocks is different.
Dornan, Portela, And Pells (2014) study the impact of floods on food security in Ethiopia, India, Peru and
Vietnam, using data from three rounds of the Young Lives survey. They report that flood experiences are
strongly associated with worsening food security in Peru and Vietnam. No such association was found in
the case of Ethiopia and Andhra Pradesh However, the association between climatic shocks and HFA is
less clear cut. They report a clear association between drought and stunting among the older cohort of
children in Ethiopia, although no such effect was found in eight year olds. In Andhra Pradesh an
association was found between droughts and ‘reduced’ stunting in the young cohort, although the
association was not significant. For all countries it was found that previous HFA is a strong predictor of
subsequent height among children, suggesting that early life experiences can have a crucial impact on
future health outcomes.
Escobal et al., (2005) analyse the impacts of economic shocks on the quantity and quality of child
education in Peru. They use information on a panel of 6 to 14 year old children studied in the Peruvian
Living Standard Measurements Studies (LSMS) - Instituto Cuanto (2001), the 1998 School Census
(Ministerio de Educacion’, 1999) and the Cooperation Fund for Social Development (FONCODES)
(2000) poverty map data. This study focuses on the impact of different short-term economic shocks on the
quality of education as well as school attendance. Using various measures of short-term shocks in an
ordered logit estimation, they show that negative shocks have no significant effect on the additional
overage (i.e., children at least one year older than the age expected for their grade) and drop-out rates–
which the study refers to as the ‘quantity’ of education. However, short-term shocks can result in a
significant reduction in household education expenditure in both urban and rural areas, thereby affecting
the quality of education adversely. Results are significant both when a short-term shock is brought about
by changes in household income or expenses and when it is brought about by changes in employment
status.
2.2.6. Main finding from the review of empirical literature
Our extensive review of the impact of shocks (aggregate as well as idiosyncratic) on human capital, leads
to some key insights. Overall, our analysis indicates that for developed countries like the United States,
the substitution effect of a shock dominates the income effect on educational status. In other words,

30
economic shocks have a positive association with schooling outcomes. For middle income countries in
Latin America, Ferreira and Schady (2009) reported a similar positive association in the case of aggregate
shocks: schooling outcomes improved in crisis years. However, we analyse both aggregate and
idiosyncratic shocks and find that for middle income countries in Latin America, the association is less
than clear cut, with positive and negative outcomes both being reported, especially with respect to
educational outcomes. This departure from the Ferreira Schady results stems perhaps from the fact that
the present review of literature has considered idiosyncratic shocks as well as aggregate shocks.
Moreover, many of the studies we considered here examined data on rural areas, where people living are
typically poorer and more credit constrained.
For poor countries, while we do find substitution between schooling and child work, we do not find that
the income effect dominates in all cases. Many studies report either no impact or a positive impact on
enrolment, for children in low income countries. We find the distinction between work at the intensive
and work at the extensive margin useful here. Children in poor regions may be substituting between work
at home and work at farm and paid labour. For this reason, it becomes necessary to focus on the quality of
education rather than simply enrolment. Relatively few studies have focused on grade attainment and the
quality of education, compared to studies on enrolment and attendance rates. Furthermore empirical
studies that focus on cognitive measures of schooling attainment are rarer still (e.g. Hyder and Behrman
2014, Galab and Outes-Leon, 2012). This owes to the lack of data availability on measures of cognitive
abilities.
Coming to health outcomes, infant mortality and health indicators exhibit a positive association with
shocks for developed countries like the US. We do not find any such reliable positive association in the
case of middle or low income countries. Studies on poorer countries reveal either negative associations
between shocks and health indicators for very young children, or report no significant impacts. This may
reflect decreased food expenditure and/or decreased expenditure on health care. Only a small number of
studies address how shocks impact growth and weight for older children and adolescents.
Finally, relatively few studies have evaluated the impact of climatic shocks across a group of countries.
This owes perhaps to the lack of comparable data-sets that can be used to assess the impact of these
shocks on child outcomes. In light of these findings, the next section discusses the justification for the
study.
31
2.2. Gaps in literature and justification for the study
This article advances existing literature in a number of important ways. First we examine the impact of
climatic shocks on human capital for a group of four countries at one and the same time. These countries
span four different economic regions of the world, thus not only enabling cross-country comparisons of
our selected variables, but in a manner cross-continent comparisons are also made possible. Moreover,
the variability across regions will enable us to gain deeper insights into the factors that contribute to
differences in the impact of climate shocks on human capital. For instance the incidence of poverty is
much higher in Ethiopia and India, compared to Peru and Vietnam. In sum, this study will lead to a
generalization of results found in existing strands of literature.
In this respect it must be emphasized that analysing the impact of climatic shocks on child nutrition and
educational outcomes is not a simple task since it requires information on shocks and child nutritional and
schooling indicators for the same group of households. The Young Lives dataset is unique, in this respect.
It gathers self reported information on climatic shocks, health and cognitive indicators for children. In a
manner, self-reported information is richer than meterological data, in that it provides richer insights into
households’ decision and risk-coping mechanisms (which influence the household member’s perception
and decision to report the shock). Also self-reporting ensures enough variation within a community to
allow for a distinction between the effects of a shock and other characteristics of the community.
As discussed in the previous section, empirical literature on the impact of climate shocks on human
capital has focused on schooling and grade attainment and cognitive measures of achievement have been
largely ignored. However, in many developing countries, particularly in sub-Saharan Africa school
enrolment is high and hence not a reliable measure as a schooling outcome. Grade attainment also reflects
differences in instructional and examination procedures and hence cannot be relied on. The present study
uses three international tests of cognitive ability that have been tailored to the specific language and
cultural settings of children in each country, yet still maintain international comparability. In this also, our
dataset is unique; uniform tests of cognitive ability for a group of countries have not been found in
previous datasets. All three tests (discussed in the next section) measure different aspects of cognition,
and enable us to pinpoint the exact nature of the impact on educational attainment and cognition. To the
best of our knowledge, there is no previous study using as comprehensive a group of indicators of
educational and health performance in analyzing the impact of climatic shocks.
32
Fifth, most studies analyse the impact of a single climatic shock on child human capital. This study
explores the effects of both droughts and floods on child human capital attainment. This is particularly
important, given the susceptibility of some regions to only one of the two shocks, in the year under
consideration. For instance floods are more common in Peru and Vietnam, whereas droughts are
prevalent in Ethiopia and Andhra Pradesh. Also the analysis of idiosyncratic shocks means we take
important note of the fact that even though on the covariate level the event may not constitute as a shock,
given a particular household’s vulnerability and ability to cope, a shock is reported.
Another contribution is studying the impact of climate-shocks on adolescents. Studies of child nutritional
and health status have focused on infants and children under the age of five. Only a handful of studies
have analysed malnutrition in adolescents, in the face of adverse shocks. This study will contribute to this
important and relatively untrammelled body of research. Finally, although the empirical analyses does not
go into the exact causal mechanisms behind the impacts of negative climatic shocks, the substitution and
income effects resulting from the climatic shock are examined for six different measures of human capital
attainment.
In sum, this study adds to what we know about the impact of drought and floods on schooling and the
quality of educational attainment as well as long term and short-term anthropometric measures, for a
group of four diverse countries.
Section 3: Data and Descriptive Statistics
3.1. Data Background
The study utilizes data from the Young Lives Project (www.younglives.org.uk), a 15 year longitudinal
study of childhood poverty at the University of Oxford’s Department of International Development.
Commencing in 2000, the study examines the lives of children in four developing countries: Ethiopia,
India, Peru and Vietnam. The project tracks 12,000 children, made of a roughly equal number of boys and
girls. For each of these four countries, 3000 children are studied, approximately 2000 aged 6-18 months
old and approximately 1000 aged 7.5-8.5 years in 2002. The overall objective of the project is to promote
a broad-based and multi-dimensional understanding of child development, poverty and welfare in these
countries, and in turn inform the development of policies that will reduce poverty. To fulfil these

33
objectives, the Young Lives study collects information on various social, economic and environmental
phenomena through both quantitative and qualitative surveys.
The longitudinal quantitative survey collects data on the 12000 children, their primary caregivers,
siblings, teachers and other community representatives, otherwise referred to as the ‘cohort survey’. This
data comes from three different questionnaires: a) a child questionnaire, b) a household questionnaire and
c) a community questionnaire. The questionnaires cover a wide array of subjects including composition of
the household, source of livelihood, wealth and assets, expenditure, socio-economic status, daily
activities, access to healthcare and education, and parental background including parental education. It
also gathers data on the child’s weight, height and cognitive skills including mathematical and literary
aptitude. The household questionnaire contains information on shocks – economic, climatic and social-
reported by the household. The availability of such information makes the Young Lives dataset ideal for
the current analysis.
3.2. Sampling and Data Collection
The Young Lives defines its objectives as investigating “the causes and consequences of childhood
poverty, the impact of pro-poor policies and the means by which poverty is transmitted across
generations”. According to its sampling guide, these objectives have played a major role in shaping the
approach towards sampling.
Firstly, the four countries hail from four major belts of the developing world, each possessing different
socio-political, geographic, economic and political characteristics; for instance India is a middle income
country and Ethiopia is a low income country. Secondly, in light of logistical considerations, within these
countries, a sentinel monitoring method (a method widely employed in public health studies) has been
adopted. It entails the deliberate sampling of a small number of sites which represent a particular type of
population or area. These sites are then studied consistently over a long period of time.
In each country 20 sentinel sites, across five regions were selected non-randomly (hence samples are not
nationally representative), with rich areas excluded from the sample and poor areas deliberately over-
sampled. Including a higher proportion of poor children is in tandem with the overall objective of
studying child poverty. However, the inclusion of richer areas ensures that the sample is representative
and enables meaningful comparisons between children from poor, less poor and rich households. In
addition, to ensure multi-dimensional analysis of child poverty and welfare, the sentinel sites were
selected to reflect diversity in inter-country characteristics, including ethnicity, religion and urban versus

34
rural location. In each of the four countries, somewhat different processes were used in the selection of
sentinel sites. Finally, children in the right age group in the selected sites were sampled randomly. These
processes are described in further detail in the Escobal and Flores (2008) for Peru; Kumra (2008) for
Andhra Pradesh, India; Nguyen (2008) for Vietnam; and Outes-Leon and Sanchez (2008) for Ethiopia.
3.3. Variable descriptions
The present study utilizes data from the second (2006) and third (2009) round surveys on the older cohort
of children for Ethiopia, India, Peru and Vietnam. The particular focus on the older cohort of children
owes to the fact that this particular age provides a valuable snapshot of a child’s schooling status and
schooling outcomes at a time when the child is also involved in household, farm and outside work
activities. In poor households, the opportunity cost of child schooling are considerable. Children in the
14-16 age groups are at a critical juncture of decision-making in terms of their time-use as well as the
allocation of resources – the decision having significant implications for the development of their human
capital. Furthermore, this is the age “when parents will arguably assume that children are physically and
mentally maturing to be able to commence and increasingly engage in household and/or outside work”
(Dendir, 2014). Secondly, educational progress is typically slow across poor households in these
countries, so taking an older cohort will enable a more effective analysis of the impact of shocks on
educational outcomes.
i) Educational Outcomes
We use four measures of schooling outcomes in the study, one quantitative measure of ability: school
enrolment and three measures of cognitive ability: i) PPVT score ii) Mathematics test score and iii) Cloze
test score. This approach is informed by recent trends in literature, which focus more on qualitative
measures of education attainment such as cognitive skills rather than exclusively on quantitative measures
such as enrolment, years of schooling, attendance rates etc. This is because, in the developing world, even
after several years of schooling a vast number of children are unable to read, write and handle basic math
operations. Also qualitative measures seem to be better predictors of economic growth and income
distribution, but also of individual’s future career success and productivity (Orazem 2007). Moreover,
cognitive tests results account for differences in the quality of education.
Enrolment is a categorical variable, for whether or not the child is enrolled in school. While time in
schooling as reflected in enrolment is probably an indication of learning, it is not learning per se. Also

35
there may be little variation in enrolments for the young adolescents in the considered sample, for
instance in Ethiopia the enrolment rate was very high 97 % in 2006 and 90 % in 2009 (Hyder and
Behrman, 2014). Hence the latter three measures are likely to lead to a more holistic picture of cognitive
achievement.
The PPVT, which was adopted for rounds 2 and 3, is a widely employed test measuring verbal ability and
general cognitive development, according to age. Many studies have reported a strong positive correlation
between the PPVT and other commonly used measures of intelligence such as the Wechsler Intelligence
scales (see Campbell, 1998; Campbel, Bell and Keith, 2001). The test is untimed, individually
administered, does not require reading on the part of the respondent and can be completed in about half an
hour. In each question, the child has to choose from four pictures the one that, she thinks, matches a word
verbally expressed by the interviewer. Children of age 11–12 years in Round 2 and age 14–15 years in
Round 3 took the PPVT in the language in which they felt most comfortable; the purpose being to ensure
that they perform to their maximum capability. Since its inception in 1959, the test has undergone many
revisions over time and the PPVT-III (Dunn and Dunn, 1997) version has been employed in the Young
Lives Rounds 2 and 3 for Ethiopia, India and Vietnam. For Peru, The Spanish version of the test, the
PPVT_R has been adapted (Dunn, Lugo and Dunn 1986), and a Quechua version was developed for
children preferring to answer in that language. The PPVT-III contains 17 sets of 12 items each whereas
the PPVT-R contains 125 items, arranged in order of difficulty, and the starting set for a respondent varies
depending on his/her age. Progress through (up or down) sets is decided by performance during the test,
eventually determining what are known as the Basal and Ceiling Item sets for each individual. Scores are
then computed by subtracting the number of errors from the individual’s Ceiling Item.
In order to address concerns about potential cultural bias from administering a test which was basically
developed for the West, the Young Lives team undertook several measures to ensure the PPVT was
adapted to the relevant study samples and local conditions. A pilot test, comprising two stages, was
conducted before each round. The first step involved gathering a local panel of experts to evaluate each of
the test questions for fairness on the basis of various factors – appropriateness with respect to local culture
and mores, relevance of items to the skills being tested, gender neutrality, rural urban bias and ethnic
group (majority versus minority). Based on this assessment, the panel picked non-biased items from the
PPVT and the rest of the items were either adapted or replaced, in order to construct national versions of
the test. In the second stage, the pilot test was administered to a sample of around 48 non-Young-Lives
children, selected to reflect the characteristics of the Young Lives sample. On the basis of collected
response, the test was then refined further. The refinements addressed cultural adaptability of the test,
while simultaneously ensuring that the variability in children’s abilities is adequately captured. Further

36
details can be found in Cueto et al., (2009); Cueto and Leon, (2012). In this regard, it is important to
mention that, due to differences in the underlying population of reference, PPVT scores cannot only be
broadly (rather than strictly) compared across countries, or across groups with different maternal
languages within countries.
The Cloze Test was developed by the GRADE (Group for the Analysis of Development) team, and
attempts to measure verbal skills. The focus is on reading comprehension skills rather than simply
readability. The respondent is asked to read a sentence or a short paragraph that is missing one or more
words. In order to complete the meaning of the sentence or passage, the respondent has to demonstrate
both knowledge of vocabulary and comprehension of the situation. Scoring is based on the number of
correct responses provided. The test administered by the Young Lives, consisted of 24 questions, of
increasing difficulty, and acceptable answers to each of them. Trained enumerators were assigned the task
of filling the correct codes after the surveys had been collected – in order to standardise procedures of
coding. Each child took the test at his/her own pace, with gentle discontinuation after the first 10 minutes.
As in the case of the PPVT test, there was a translation and adaptation process for each relevant local
language.
The Mathematics test was administered to the older cohort in Round 2 and to both cohorts in Round 3.
The test consisted of two sections. The first section was aimed at measuring the ability to perform basic
mathematics operations with numbers and children were allowed 8 minutes for completion of this part. It
included 20 items dealing with addition, subtraction, multiplication, division and square roots, using both
whole numbers and fractions. Some of these items were the same as those used with the younger cohort
and some were repeated from Round 2 (details of the common items across cohorts and rounds can be
found in Appendix I, Cueto and Leon, 2012). Section 2 comprised ten items testing problem solving
skills.
These items were available from freely published international testing programs TIMMS (Trends in
International Mathematics and Science Study) and PISA (Programme for International Student
Assessment). Details about the sources of these items can be found in Appendix I, Cueto and Leon,
(2012). The topics measured with the items were: i) data interpretation; ii) number problem solving; iii)
measurement; and iv) basic knowledge of geometry. The items allowed for both multiple choice
responses as well as open responses, with ten minutes being allowed for completion. Children were not
allowed to use calculators or any other help for any of the maths tests. The total score for each child was
computed after adding the correct responses. Further information on individual items administered to

37
children and the format of responses, and fieldworker manuals can be found on the Young Lives
webpage.
Following, each round of the survey, the psychometric properties of the PPVT, Cloze and Maths tests
were analysed for reliability and validly2. To ascertain validity, the test score data were correlated with
background and demographic variables such as gender and language, on the basis of theory and prior
studies. Procedures in Item Response Theory (IRT) and Classical Test Theory (CTT) were employed to
investigate reliability. In computing a score, CTT treats considers all responses (correct, incorrect and
null) and treats each item equally. IRT estimates the level of difficulty of each item, as well as the ability
of the individual and a measured score is estimated. The Rasch model (a one-parameter model of IRT)
was utilized. These item by item diagnostic tests resulted in the exclusion of items with biases, poor fit
and low item-test correlation and generated corrected and Rasch PPVT scores. Further details on this
subject-matter can be found in the Young Lives technical documents for Rounds 2 and 3 (see Cueto et al.,
2009; and Cueto and Leon, 2012). We employ Rasch corrected scores for each of the three tests discussed
above.
ii) Health Outcomes
Two widely used anthropometric indicators to study nutritional status - Body Mass Index for age (BFA)
and Height for Age (HFA) z-scores3 - are utilized in this study. Anthropometric measurement for children
entails the use of growth references for assessing their growth, nutritional status and well being. BFA z-
scores are defined as the measure of weight relative to height, adjusted for child age and sex, calculated
with reference to a specific external standard. HFA z-scores are defined measures of height adjusted for
age and sex, calculated with reference to a specific external standard.
The external standards employed are children’s anthropometric measurements based on the International
Reference Population defined by the US National Centre for Health Statistics (NCHS), with the Centres
for Disease Control (CDC) and the World Health Organisation (WHO). Underlying the use of a reference
standard is the assumption that healthy children, born in any region of the world, follow similar growth
patterns across different populations and that all children have the potential to achieve a particular
potential within the same range for height, weight etcetera. In other words, the child’s measurements are
2 “Reliability refers to the degree to which the items measure a construct that is stable across the test. Validity, a more complex
characteristic, refers to the level at which the inferences made about the children’s knowledge and abilities, as measured by the
tests, are supported by the test data”. (see Cueto and Leon, 2012) 3 The Z-score is defined as a dimensionless measure of the magnitude and direction by which a measured value deviates from
the population mean, divided by the population standard deviation. It is derived by using the following formula

38
compared with those of another child from the same age group and gender, belonging to the healthy
reference population as defined under the International Reference Population. The reference population
has an expected mean Z-score of 0 and a standard deviation of 1.0 for all normalized growth indices.
HFA z-score serves as a cumulative indicator of physical growth, due to its ability to reflect past as well
as present nutritional status. In this context, stunting is defined as the deficit in the HFA indicator, in
other words slow growth in the height of the child compared to the healthy reference population. It
reflects chronic malnutrition. Supine length (Round 1) and standing height (Rounds 2 and 3) were
measured with length/height boards using standardized WHO methodology (WHO, 2008) and
measurements precise to 1 millimetre.
A child is classed as moderately stunted if his height is ranked 2 standard deviations below the median
height, corresponding to a healthy child of the same age and sex. A severely stunted child ranking is
given when the child’s height is 3 standard deviations below the reference height of a healthy child of the
same age and sex. In poor countries, stunting is a result of insufficient dietary intake and childhood
diseases, particularly chronic diarrhoea. Stunting cannot be reversed (in general), and children who
become stunted typically never catch up to their height potential. According to the WHO Working Group
(1986), stunting adequately reflects social deprivation.
The BFA z-score captures short-term effect, primarily, whereas the HFA z-score captures longer-term
effects. It is a particularly useful indicator in describing the current health status of a population and in
evaluating the benefits of intervention programs since it responds more readily to changes in nutritional
status than does stunting. However, a disadvantage of this index is that it classifies children with poor
growth in height as normal. A child of a particular age and sex is catalogued as thin, if his BMI is ranked
2 standard deviations below the reference BMI for a healthy child of the same age and sex. Severe
thinness is the ranking given when a child’s BMI is ranked 3 standard deviations below the reference
BMI for a healthy child of the same age and sex.
TABLE 1: ANTHROPOMETRIC INDICATORS OF HEALTH
Anthropometric indicator Classification
Stunting <-2 SD of height-for-age z-score
Severe stunting <-3 SD of height-for-age z-score
Thinness <-2 SD of BMI-for-age z-score
Severe thinness <-3 SD of BMI-for-age z-score
iii) Climate shocks:

39
We study the impacts of two climatic shocks: i) drought and ii) floods based on households’ reported
perceptions. The household survey included a section pertaining to the economic changes and recent life
events of the household. In this section, households were requested to consider a list of events and
indicate the ones they had been exposed to. Both climate-shock-related variables are dichotomous, being
1: shock was reported, 0: shock was not reported. It should be noted that answers are based on
perceptions, i.e. they do not show whether a negative event has occurred or not, rather they show whether
the respondent considers the event has affected the welfare of the household negatively. Hence the reports
of these shocks may be based on their coping strategy. Given that the objective of this study is to analyse
vulnerabilities associated with climatic shock, these self-reported responses assume particular importance.
iv) Child, parental, household and community characteristics:
Individual characteristics include child age and gender. Child age is measured in the number of months,
for each country. Child gender is a dichotomous variable, with 0 denoting that the child is male and 1
denoting that the child is female. Parental characteristics include whether the father and mother are still
alive and years of education completed by the mother and father. Father Alive and Mother Alive are
dichotomous variables, taking the value of 1 if the father (mother) is alive and 0 if the father (mother) is
dead. We only employ the variable in the regressions for two of the countries in the sample: Ethiopia and
India4.
We also employ categorical variables for parental education. The Father’s Education (Mother’s
Education) variable has been constructed from the Round 2 survey question on the years of schooling
completed by the father (mother). For Ethiopia, India and Vietnam the following construction is
employed; years of schooling have been divided into five broad categories: i) zero; ii) pre-primary; iii)
primary; iv) secondary; and v) higher/post-secondary technical education. For Peru we employ a slightly
different construction in order to address certain statistical estimation issues; years of schooling have been
divided into four broad categories instead of five: with secondary and higher/post secondary technical
education being combined into one category.
Household characteristics include household size, whether land is owned or rented and the wealth index.
Household size refers to the number of people living in the home and could include people from extended
families. Land-ownership is a binary choice variable for whether the household owned, rented or
sharecropped any land in the last year. The landownership variable has only been included for Ethiopia
4 The Young Lives dataset for Vietnam does not include the variable reporting whether the child’s parents are still alive. In the
case of Peru, only five mothers were reported as no longer alive, hence any statistically meaningful inference would have been
difficult to draw. Thus for both countries the Father Alive and Mother Alive variables have not been included.

40
and India5. The wealth index measures the socioeconomic status of the Young Lives household. Its
calculation is informed by the World Bank and Macro International’s work conducted to develop the
wealth index (as cited in the UNICEF Multiple Indicator Cluster Surveys). Its construction utilizes three
different indices, namely the housing quality index (HQI), consumer durables index (CDI) and the
services quality index (SQI). It basically takes an average of all three indices (i.e. WI= (HQI +CD
I+SI)/3). HQI concerns the number of rooms relative to the size of the household; wall, floor and roof
materials, SQI concerns whether access to drinking water, electricity, fuel and sanitation is available,
whereas the CDI comprises whether the household owns a refrigerator, bicycle, cellular phone, radio etc.
The value of the wealth index ranges from 0 to 1, with a higher index denoting higher socio-economic
status. Further details on the calculation of the wealth index can be found in the Young Lives Technical
Notes for each country.
Community characteristics include three variables i) log of population ii) site-type and iii) region. Log of
population is measured using the response to the question how many people live in the community. Site-
type is a dichotomous variable for whether the site is urban or rural. Region is a categorical variable,
included to account for heterogeneity across different geographical regions. The geographical regions for
each country are presented in the table below.
TABLE 2: REGIONS INCLUDED IN THE STUDY
Country Regions
Ethiopia Addis Ababa Amhara Oromia SNNP Tigray
India Coastal Andhra Rayalaseema Telangana
Peru Coast Mountain Jungle
Vietnam Northern Uplands Red River Delta Central Coastal Mekong River
v) Buffering mechanisms
To explore the role of buffering mechanisms and assistance programs in buffering climatic shocks, we
include household responses about these strategies. We include variables on different assistance programs
in each of these countries, and for Ethiopia and Peru we also employ variables for access to credit.
5 The survey question on Land Ownership was not available in the case of Vietnam. For Peru, land ownership was 100 percent,
so no meaningful statistical inference would be possible through its inclusion.

41
3.4. Summary Statistics
Table 3 displays the summary statistics of the main variables of analysis for Ethiopia, India, Peru and
Vietnam respectively. Each of these countries is discussed in turn.
i) Ethiopia
The third column in Table 3 below shows the summary statistics and average shocks reported by
households in Ethiopia. Around 38 percent of households suffered from droughts and 13 percent reported
being affected by floods. In other words, three times as many droughts were reported, as compared to
floods. The enrolment rate is around 90 percent. With respect to scores on cognitive tests, the mean PPVT
score was nearly 304 and the mean Cloze test score and Mathematics test score were nearly 300. Standard
deviations for the latter two tests were 2 points greater than that for the PPVT score. In sum, there is
considerable variation among all scores, reflecting significant differences in child cognitive ability. The
Ethiopian children in the sample considered, for the greater part, have a low distribution of health
outcomes, with means and distributions substantially below the WHO defined international reference
standards. The mean BFA score of -1.7 indicates moderate thinness on average. In the sample considered,
15 percent of the children are severely underweight (BFA z-score less than -3), and 28 percent are
moderately underweight (BFA z-score less than -2). The mean HFA z-score is -1.41, and also indicates
moderate stunting compared to the world reference standards. Compared to the rest of the countries in our
sample, stunting thinness is highest for Ethiopia. 12 percent of the children in the sample are severely
stunted (HFA z-score less than -3), and 17.6 percent are moderately stunted (HFA z-score less than -2).
The sample is gender-neutral, 52 percent of the sample is made of boys, whereas the rest comprises of
girls. The mean age is almost 15 years. 83 percent of the sample reported the father as still being alive,
whereas the corresponding figure for the mother still being alive was 94 percent. The parental education
figures are the lowest among the countries considered. Almost 27 percent of fathers and 50 percent of
mothers in the sample have zero years of education. These parental literacy figures are the lowest in the
four countries considered. Only 2 percent of fathers and 4.5 percent of mothers have secondary or higher
education. The

42
TABLE 3: SUMMARY STATISTICS
Ethiopia India Peru Vietnam
Enrolled 1 if child is enrolled in school, 0 otherwise 0.901 0.871 0.929 0.767
[0.299] [2.589] [0.257] [0.423]
PPVT Peabody Picture Vocabulary Test, Corrected Rasch Score 303.866 300.045 300.144 299.433
[13.525] [14.999] [14.906] [14.806]
Cloze Cloze Test, Corrected Rasch Score 299.810 299.979 300.341 299.687
[15.000] [14.777] [14.798] [14.980]
Math Mathematics Test, Corrected Rasch Score 299.778 299.980 300.872 299.658
[15.035] [14.956] [14.638] [14.809]
Z-BFA Body Mass Index for Age Z-score -1.704 -1.242 0.268 -0.853
[1.242] [1.262] [0.956] [1.021]
Z-HFA Height for Age Z-score -1.410 -1.675 -1.453 -1.445
[1.377] [1.052] [0.855] [0.913]
Child Gender 1 if female, 0 otherwise 0.515 0.489 0.530 0.494
[0.500] [0.500] [0.500] [0.500]
Child Age Age of child in months 180.257 179.254 178.608 180.585
[3.509] [4.090] [4.127] [3.862]
Father Alive 1 if father is still alive, 0 otherwise 0.831 0.912
[0.375] [0.283]
Mother Alive 1 if mother is still alive, 0 otherwise 0.940 0.969
[0.238] [0.175]
Fathers Education
1. Pre-Primary 1 if father’s education is pre-primary, 0 otherwise 0.395 0.080 0.119 0.140
[0.489] [0.272] [0.325] [0.347]
2. Primary 1 if father’s education is primary, 0 otherwise 0.151 0.203 0.226 0.238
[0.358] [0.402] [0.419] [0.426]

43
3. Secondary 1 if father’s education is secondary, 0 otherwise 0.097 0.188 0.636 0.365
[0.296] [0.391] [0.482] [0.482]
4. Higher 1 if father’s education is higher, 0 otherwise 0.086 0.112 0.186
[0.281] [0.315] [0.390]
Mother's Education
1. Pre-Primary 1 if mother’s education is pre-primary, 0 otherwise 0.304 0.051 0.163 0.186
[0.460] [0.220] [0.370] [0.389]
2. Primary 1 if mother’s education is primary, 0 otherwise 0.079 0.208 0.237 0.254
[0.270] [0.406] [0.426] [0.436]
3. Secondary 1 if mother’s education is secondary, 0 otherwise 0.072 0.101 0.499 0.337
[0.258] [0.301] [0.500] [0.473]
4. Higher 1 if mother’s education is higher, 0 otherwise 0.045 0.040 0.125
[0.207] [0.195] [0.331]
Household Size Size of Household 6.441 5.081 5.352 4.546
[2.071] [1.929] [1.863] [1.367]
Wealth Index Wealth Index of Household 0.346 0.523 0.591 0.619
[0.165] [0.175] [0.181] [0.182]
Land Ownership 1 if land owned/borrowed/sharecropped in the past 12 months, 0.829 0.606
0 otherwise [0.377] [0.489]
Site-type 1 child lives in a rural area, 0 otherwise 0.608 0.756 0.218 0.819
[0.489] [0.430] [0.413] [0.385]
Regions Ethiopia
1. Amhara 1 if child lives in Amhara, 0 otherwise 0.193
[0.395]
2. Oromia 1 if child lives in Oromia, 0 otherwise 0.207
[0.405]
3. SNNP 1 if child lives in SNNP, 0 otherwise 0.248
[0.432]

44
4. Tigray 1 if child lives in Tigray, 0 otherwise 0.203
[0.403]
Regions India
1. Rayalaseema 1 if child lives in Rayalaseema, 0 otherwise 0.318
[0.466]
2. Telangana 1 if child lives in Telangana, 0 otherwise 0.319
[0.466]
Regions Peru
1. Mountain 1 if child lives in Mountain Region, 0 otherwise 0.425
[0.495]
2. Jungle 1 if child lives in Jungle Region, 0 otherwise 0.132
[0.338]
Regions Vietnam
1. Red River Delta 1 if child lives in Red River Delta Region, 0 otherwise 0.203
[0.402]
2. Central Coast Delta 1 if child lives in Central Coast Region, 0 otherwise 0.382
[0.486]
3. Mekong River 1 if child lives in Mekong River Delta Region, 0 otherwise 0.208
[0.406]
Ln- Population Log of Population of Community 8.985 7.687 8.467 9.062
[0.744] [0.696] [1.599] [0.542]
Drought 1 if experienced drought in the last four years, 0 otherwise 0.381 0.089 0.050 0.090
[0.486] [0.285] [0.219] [0.287]
Flood 1 if experienced too much rain or flood in the last four years, 0.130 0.026 0.102 0.183
0 otherwise [0.336] [0.159] [0.303] [0.387]
Support Ethiopia
Credit 1 if household received loan/credit, 0 otherwise 0.666
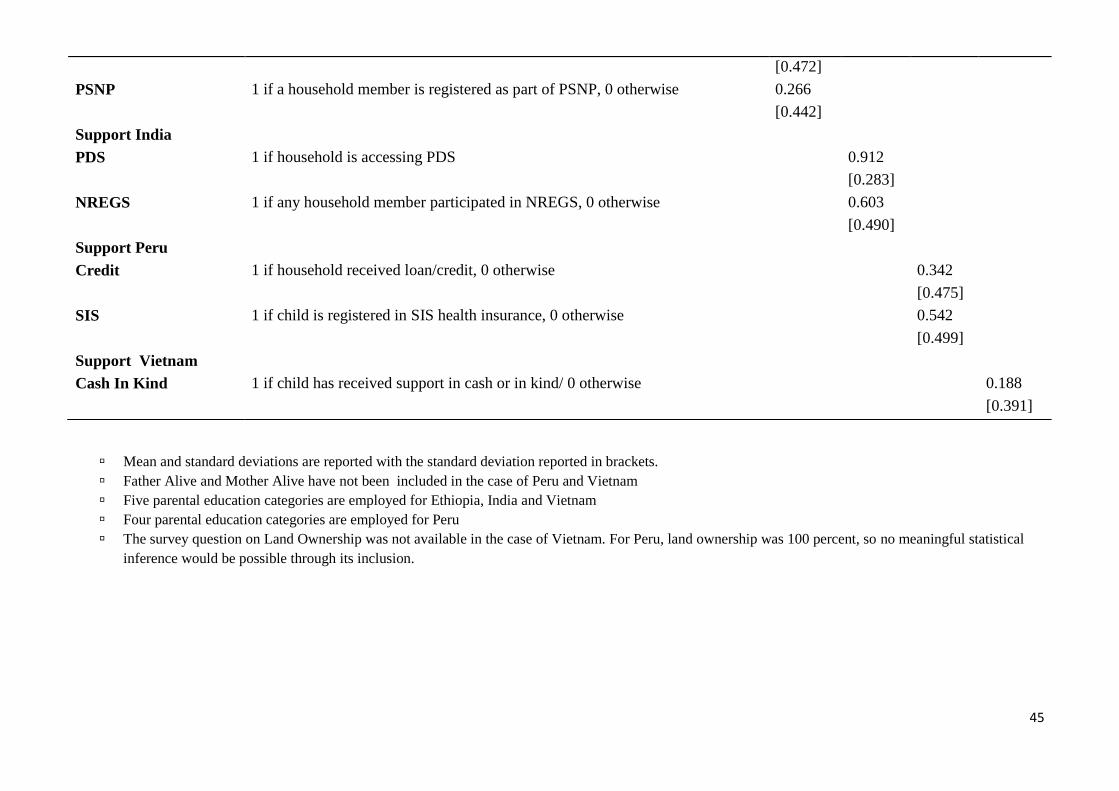
45
Mean and standard deviations are reported with the standard deviation reported in brackets.
Father Alive and Mother Alive have not been included in the case of Peru and Vietnam
Five parental education categories are employed for Ethiopia, India and Vietnam
Four parental education categories are employed for Peru
The survey question on Land Ownership was not available in the case of Vietnam. For Peru, land ownership was 100 percent, so no meaningful statistical
inference would be possible through its inclusion.
[0.472]
PSNP 1 if a household member is registered as part of PSNP, 0 otherwise 0.266
[0.442]
Support India
PDS 1 if household is accessing PDS 0.912
[0.283]
NREGS 1 if any household member participated in NREGS, 0 otherwise 0.603
[0.490]
Support Peru
Credit 1 if household received loan/credit, 0 otherwise 0.342
[0.475]
SIS 1 if child is registered in SIS health insurance, 0 otherwise 0.542
[0.499]
Support Vietnam
Cash In Kind 1 if child has received support in cash or in kind/ 0 otherwise 0.188
[0.391]

46
average household comprises of 6-7 people, with a standard deviation of 2 household members. The
average wealth index is 0.35, with considerable inequality. Roughly, 61 percent of the sample is rural,
whereas 39 percent is rural. With respect of the distribution of regions in the sample, SNNP comprises a
quarter of the sample, followed by Oromia, Amhara, Tigray and Addis Ababa.
To assess the impact of support policies in Ethiopia, we employ two dichotomous variables, whether
credit or a loan was taken out in the last five years and whether any of the household members are
registered as part of the Productive Safety Net Programme (PSNP). The programme was introduced in
2005, with the objective of combating food insecurity by offering families daily wages for unskilled
work. A combination of cash and foods transfers is used and families are given food in the lean season
between June and August. In our sample, 67 percent reported having received credit in the last five years,
while 27 percent of respondents reported registering to the PSNP.
ii) India
Column four shows the summary statistics and average shocks reported by households in India. Around 9
percent of households suffered from droughts and 3 percent reported being affected by floods, i.e. roughly
floods reported were one third of droughts reported. The enrolment rate is 8 percent, 3 percentage points
less than that of the Ethiopian sample. The average of PPVT, Cloze test and Mathematics tests scores is
almost similar and roughly around 300. The mean BFA and HFA z-scores are -1.24 and -1.68
respectively, which shows that BMI and height for age are well below the international reference
standard. The severity of thinness is milder compared to Ethiopia, but still higher than the other countries
in the sample. 7.7 percent of children in the sample are severely underweight (BFA z-score less than -3)
and 19.6 percent of children are moderately underweight (BFA z-score less than -2). However, stunting
severity is greatest in the sample: 8.7 percent of children are severely stunted (HFA z-score less than -3)
and 27.9 percent of children are moderately stunted (HFA z-score less -2).
The sample is gender-neutral and consists of a roughly equal number of young boys and girls. The mean
age is around 14 years and 11 months. 91 percent of the sample reported the father as still being alive,
whereas the corresponding figure for the mother still being alive was 97 percent. Almost 42 percent of the
sample has zero years of paternal education and 61 percent has zero years maternal education. 30 percent
of fathers completed secondary or higher education; for mothers the corresponding figure is 14 percent..
The average household comprises of almost 5 people, with a standard deviation of 2 household members.
The average wealth index is 0.56, with considerable deviation shown by a standard deviation of 0.17

47
points. This is consistent with the overall persistence of income inequality in Andhra Pradesh. The
distribution of the sample between different geographical regions is roughly equal.
As buffering mechanism variables, we employ two dichotomous variables, one for whether the household
is accessing the Public Distribution System (PDS) and the other for whether any household member has
participated in the National Rural Employment Guarantee Scheme (NREGS), in the last year. PDS is a
quantity rationing cum food subsidy program. The scheme aims to target 330 million people who are
nutritionally at risk by providing wheat, sugar, rice and kerosene through fair price shops. The scheme is
managed jointly between the central and state governments. The NREGS guarantees employment for the
rural unemployed for 100 days in a year, through employment in works such as infrastructure
improvement, improving water supply, building roads etcetera. If employment is not provided after
fifteen days (after the requisite procedure to verify eligibility and issue a job card) the applicant becomes
eligible for a job card. In our sample 91 percent of respondents reported having accessed the Public
Distribution System, and 60 percent of the sample reported having participated in NREGS.
iii) Peru
Column four shows the summary statistics and average shocks reported by households in Peru. Around 5
percent of households suffered from droughts and 10 percent reported being affected by floods, i.e. the
incidence of reported floods was twice that of reported droughts. The enrolment rate is the highest in the
sample of countries, at 92 percent. The average of PPVT, Cloze test and Math tests scores is almost
similar. The mean BFA and HFA z-scores are 0.268 and -1.45 respectively. The average BMI is
somewhat higher than that of the world reference standard indicating sound short term health. Only 0.5
percent of the sample is severely underweight and 0.8 percent of the sample is underweight. However, the
height for age is indicative of mild stunting. 4 percent of the sample is severely stunted and nearly 20
percent is moderately stunted. In sum, stunting is the main under-nutrition problem in Peru, while wasting
is relatively uncommon (Escobal et al., 2005 report similar findings).
47 percent of the sample are young boys and 53 percent are young girls. The mean age is near 14 years
and 11 months. Peru has the highest parental literacy rates in the sample of countries considered. Only 2
percent of fathers have zero years of education, whereas 12 percent of fathers reported only pre-primary
education, nearly 23 percent of fathers in the sample attained primary education, and nearly 64 percent
attained secondary or higher education. The corresponding figures for maternal education are 10 percent,
24 percent, and 50 percent respectively. It should be noted that the figures for the fourth category of
secondary and higher education cannot be compared to that of other countries, given that parental
48
education categories have been formulated in a different manner for Peru (as discussed above). The
average household comprises of 5 people. The average wealth index is 0.59. A standard deviation of 0.18
is suggestive of greater inequality in the sample than both Ethiopia and India. Less than a quarter of the
sample is rural. This makes the Peruvian sample considerably different from that of the other countries
considered, where the population is predominantly rural. The majority of children belong to the Mountain
and Coastal areas, whereas only 13 percent belong to the Jungle region.
In order to assess buffering mechanisms in Peru, two dichotomous variables are employed, whether credit
or a loan was taken out in the last five years and whether the child is registered under the Seguro Integral
de Salud (SIS) health insurance scheme. Translated as “Comprehensive Health Insurance,” SIS comes
under the jurisdiction of the Ministry of Health, and its objective is to protect the health of Peruvians who
do not have health insurance. This is achieved through the elimination of user fees for a package or
service. SIS gives priority to vulnerable populations who are at poverty and extreme poverty. In our
sample, 34 percent of households reported having taken out a credit or loan. Over half the children in the
sample were registered under the SIS.
iv) Vietnam
The last column in Table 3 shows the summary statistics for Vietnam. Around 9 percent of households
suffered from droughts and 18 percent reported being affected by floods, i.e. the incidence of reported
floods was twice that of reported droughts. The enrolment rate is the lowest in the sample of countries, at
nearly 77 percent. The average of PPVT, Cloze test and Math tests scores is almost similar. The mean
BFA and HFA z-scores are -0.853 and -1.44 respectively, indicating averages well below international
reference standards. Less than 2 percent of the sample is severely underweight (BFA z-score less than -3)
and 11.3 percent of the sample is moderately underweight (BFA z-score less than -2). Around 5 percent
of the sample is severely stunted (HFA z-score less than -3) and 19 percent is moderately stunted (HFA z-
score less than -2).
The sample is gender neutral and the mean age is nearly 15 years. 7 percent of fathers and 9 percent of
mothers have zero years of education. More fathers than mothers have secondary or higher years of
education. The average household comprises of 4-5 people. The average wealth index is 0.61, the highest
in the sample, with considerable inequality as depicted by a standard deviation of 0.18 points. This is
suggestive of greater inequality in the sample than both Ethiopia and India. Nearly, 82 percent of the
sample is rural, whereas only 18 percent is rural. 39 percent of the children in the sample reside in the
Mekong River Delta region, whereas the rest of the sample is equally divided between the other three

49
regions. In order to assess buffering mechanisms in Vietnam, a dichotomous variable is employed, for
whether the child has received support to encourage schooling, in cash or in kind. 19 percent of children
in the Vietnamese sample reported having received support in cash or in kind.
Section 4: Methodology
In light of the theoretical framework discussed in Section 2.1, we proceed to an empirical specification of
the relationship between climate shocks and human capital investment. For, each of the four countries, we
estimate six sets of equations: one for enrolment; one each for the three indicators of cognition and
psychometric development; and for the two anthropometric measures of health and nutritional status. We
use probit estimators for the dichotomous child school enrolment outcome and least squares estimators
for the other three child psychometric measures of attainment and measures of health outcomes. In both
cases the right-side variables include whether any drought and/or too much rain/flood were reported.
Unobserved child or household characteristics create the potential for bias in cross-sectional models. In
order to account for heterogeneity across children and households, various controls are added. Four broad
categories of controls are recognized and employed i) individual characteristics; ii) parental
characteristics; iii) household characteristics; and iv) community characteristics.
The equations listed above provide the empirical specification we will be testing. Equation 1 is for the
probit enrolment equation, where is a binary choice variable for whether the child is enrolled; it
equals one if the child is enrolled in school and equals zero otherwise. For testing the association
between climatic shocks and cognitive and anthropometric measures, we use the empirical specification
set out in Eq2. Five sets of equations are estimated, with PPVT, Cloze, Maths, BFA z-score, and HFA z-
score as the respective dependent variables in each of the equations. Details of these variables have
already been provided in Section 3.3.
and are binary choice variables for individual respondent reported droughts and floods respectively,
with and as coefficients measuring the impact of the shock. represents the vector of child
characteristics, including child gender and age. represents the vector of parental characteristics;
including whether the father is alive; mother is alive; father’s years of education and mothers years of
education. represents the vector of household characteristics; including household size, log of annual

50
income, the household’s initial wealth and a dummy for whether the household performs agricultural
tasks. represents the vector of community characteristics, including region, site-type, and log of
population. is the vector of buffering mechanisms; including a binary choice variable for whether the
respondent received help from any government or non-government organisation, and participation in
assistance programs or coping mechanisms for each particular country. is a normally distributed
stochastic term, including unobserved characteristics of the child , the parents , the household , the
community and unobserved random shocks.
The controls for child’s gender accounts for the gender discriminatory human capital investment
behaviour in poor households in developing countries. The second control for child age also reflects
similar concerns. Child age is an important determinant of investment in schooling. Two opposing effects
are at work. Firstly parents prefer to keep older children in school at the expense of younger children
because of the existing investments in the child’s schooling. Therefore, with rising age and years of
school, the likelihood of dropping out of school falls. However, greater labour market opportunities are
available for older children, so in this case with rising age the likelihood of dropping out rises.
Parental characteristics are important factors in explaining child health and nutritional outcomes. Dendir
(2014) shows that living with a caregiver who is not a biological parents decreases the likelihood of
enrolment by around 5-6 percentage points and increases that of the child working, in rural Ethiopia. In a
similar manner, parental education is an important determinant of investment in human capital. It captures
the value the family attaches to investment in education, and also acts as an indicator of wealth given that
educated parents are usually wealthier, relatively speaking. Mani, Strauss and Hoddinott (2013) find that
having a father with non-zero schooling increases the chances of a child’s enrolment by 7 to 10
percentage points in rural areas, whereas having a mother with non-zero schooling increases the chances
of a child’s enrolment by 3 to 7 percentage points. Interestingly Woldehanna, Jones and Terefa (2008)
find that maternal education increases the likelihood of combining work and schooling. On the basis of
qualitative data, they suggest that this finding stems from the fact that educated mothers are more likely to
be involved in paid activities outside the home and in the absence of child-care facilities; children have to
participate in domestic chores and caring activities. Schady (2011) also finds a strong association between
children's cognitive development and mothers’ years of schooling and vocabulary, for children in rural
Ecuador. The association between the maternal and child vocabulary is stronger for older children in the
sample, suggesting that the effects of the mother’s vocabulary are cumulative. We include a binary choice
variable for whether the mother and father are still alive and years of parental education, and parents’
years of education. Since the first question was not included in the Peru survey, it has not been included
in the empirical specification for Peru.

51
Our theoretical framework revealed that, in the absence of perfectly functioning credit markets, initial
wealth can play a critical role. Wealth and assets have a complex effect, however. Numerous studies show
a strong correlation between high household wealth and investment in human capital. Dendir (2014)
shows that a unitary increase in the wealth index increases the probability of enrolment by around five
percent for 15 year old children in Ethiopia. On the other hand, Woldehanna, Jones and Terefa (2008)
show that below a particular threshold, greater wealth is associated with an increased likelihood of a child
combining schooling and work. Thus it becomes important to include the wealth index in our empirical
specification.
We also use two other controls for community characteristics discussed in Section 3.3: household size
and whether the household owns or rents land. Theoretically land ownership may have either a positive or
a negative impact on child schooling outcomes. The positive effect arises because as an asset land-
ownership may allow households to forgo income from the child’s participation in the labour market.
However, in the presence of imperfect labour and credit markets, ownership of land may have a negative
impact on schooling. Land owners may have an incentive to employ children in the farm rather than
hiring productive labour from the outside – hence the likelihood of sending children to school decreases.
In all regressions, robust standard errors (using the Huber-White or heteroscedasticity consistent
sandwich estimators) are employed, in order to meet concerns about the failure to meet the standard
assumptions of the regressions equation. Robust standard errors cater to problems pertaining to
heteroscedasticity, normality, and unusual and influential data (outliers, leverage, and influence)6.
Utilising the robust option results in no change in the point estimates of the coefficients; however the
standard errors (and consequently t-tests) take into account violations of OLS assumptions.
Section 5: Results and Discussion
Using the above empirical specification, the impact of drought and floods on educational and health
outcomes is estimated. We present and subsequently discuss the results for each country. In order to
facilitate our understanding of these results and gain a holistic insight into the policy implications, we
present a brief background of each of these countries before our discussion of results.
6 Outliers are observations with large residuals. Leverage may be defined as an extreme value on a predictor variable, or in
other words, a measure of how far an independent variable deviates from its mean. Influence can be regarded as the product of
outlierness and leverage.

52
5.1. Discussion of results for Ethiopia
Covering 1.104 million square kilometres on the Horn of Africa, Ethiopia is considered to be one of the
poorest countries in the world with a per capita Gross Domestic Product (GDP) of US $ 550. It ranks 173
out of 185 countries in the United Nations Human Development Index, with a Human Development
Index (HDI) of 0.435 and a Multi Dimensional Poverty Index of 0.537 (see UNHDR, 2014). The
population in 2013 was recorded at 94.1 million and has been growing at a rate of 2.6 percent per annum.
Ethiopia’s economy is agriculture-based, with crop and livestock production contributing 45 percent to
GDP, over 80 percent to employment and more than 90 percent to foreign exchange earnings (Ministry of
Agriculture, 2010).
Agricultural growth has spurred annual growth rates ranging from 8-10 percent over the past decade.
However, despite one of the highest growth rates in the world and substantial investments in the social
infrastructure, Ethiopia has been unable to make significant inroads in poverty reduction. The absolute
number of poor has been unchanged since the past decade: around 25 million Ethiopians and 40 percent
of the rural population still lie below the poverty line. Moreover, the severity of poverty increased from
2.7 percent in 1999 to 3.1 percent in 2010 (MoFed, 2013b). The poor, along with those just lying above
the poverty line are exposed to climatic shocks and concomitant food insecurity.
Ethiopia’s location in the tropics contributes to extreme variations in rainfall and temperature patterns.
Drought is the most recurring climate shock, affecting million in the southern and eastern parts of
Ethiopia. Over the past three decades, Ethiopia has experienced countless localized episodes of drought
and seven major droughts; with five of these droughts resulting in famines. With climate change, it is
expected that droughts will become more prolonged. Floods occur even more frequently - large-scale
floods are more common in the lowland areas, whereas flash floods occur as a result of intense rainfall in
the Highlands. Sparse availability of health care facilities, a poorly developed road infrastructure
(especially in drought exposed areas) and weak institutions exacerbate this vulnerability and make it
difficult to cope with extreme weather events. Children in Ethiopia are highly vulnerable to climatic
shocks; chronic malnutrition and poor life expectancy have been reported for Ethiopian children.
With this background in mind, we discuss the results yielded by the empirical specification presented
above. Table 4 presents these results. We find no significant impact of droughts or floods on school
enrolment. This indicates that the income effect arising from the drought is countered by the positive

53
substitution effect arising from depressed labour market conditions. This finding is consistent with that of
Hyder and Behrman (2014) who also report no impact on schooling enrolment in the case of idiosyncratic
self-reported shocks in Ethiopia. Shah and Steinberg provide an explanation for this paradoxical effect in
the case of older children. They posit that time inputs become increasingly important as children age.
Also increases in agricultural productivity mean that both parents and children will substitute away from
work into school activities or activities at home. Thus the substitution and income effect can cancel each
other. We find no significant buffering impact of either the PSNP programme or access to credit on child
enrolment. However, children living in wealthier household have a higher likelihood of enrolment. Also
children with fathers who are still alive are more likely to be enrolled, perhaps due to the positive impact
on household income arising out of the father’s earning.
In case of cognitive measures of attainment, we find a significant impact of droughts and floods on PPVT
scores and Mathematics test scores. Drought decreases PPVT scores by 2.9 points, whereas floods reduce
PPVT scores by 6.7 points. Berhane, Abay and Woldehanna (2015) also report a reduction in PPVT
scores as a result of drought, for younger cohort children in the Young Lives sample in 2009. Considered
alongside the insignificant coefficient estimate for enrolment, these two coefficient estimates suggest that
due to the reduction of work options the likelihood of child enrolment remains unchanged. However,
despite depressed labour market conditions, they learn less, perhaps due to other pressures on their time.
For instance children in drought exposed areas may be spending time trying to gather firewood and
getting water from remote areas. Serna (2011) indicates that children helped their families in fetching
scarce water during drought in Kenya. Colmer (2013) also finds evidence that there is no substitution
between schooling and child labour as a result of rainfall variability in Ethiopia; however, droughts
increase the likelihood of children participating in the farm.
With respect to coping mechanisms, paternal education has a positive and significant impact on child
PPVT and Mathematics scores. Maternal education has no significant impact on scores, and in some
cases, the coefficients are negative (though insignificant). This is consistent with the results from
Woldehanna et al., (2008), which indicate that paternal education decreases the likelihood of a child
combining work and school; however children with educated mothers are ‘more’ likely to combine work
and schooling. Qualitative data from the Young Lives seems to suggest that more educated mothers are
more likely to be involved in productive work and have to rely on older children’s help with domestic
work and sibling care (given the absence of childcare facilities). Higher household wealth has a large and
highly significant coefficient for both PPVT and Math scores. Yamauchi, Yohannes and Quisumbing
(2009) report that in Malawi and Ethiopia intellectual human capital and assets help the household to
maintain schooling investment in children after being exposed to droughts.
54
No significant effect of drought was found in the case of Cloze test scores. This is not necessarily
puzzling, given that all three indicators measure different aspects of cognitive ability. Moreover, unlike
grade attainment the linkage between schooling inputs and cognitive outcomes is less clear-cut. Also
there must exist a substitution effect between different aspects of cognitive achievement. For instance a
child may be devoting time to a certain area of study over others, resulting in differences in test scores.
We only highlight this important result, without exploring the nature of the factors responsible for this
result; our data does not allow us to go into the exact semantics of this particular substitution effect.
However, we do highlight this possibility as a possible area of research in future studies. Other studies
such as Hyder and Behrman (2014) also report different positive, negative and insignificant impacts of
climatic shocks for PPVT and Maths test scores.
In the case of health outcomes, droughts have no significant impact on BFA z-scores. This may be
indicative of greater parental time allocation to child health due to depressed labour market conditions
and hence the substitution effect cancels out the negative income effect. However, long term health of
adolescents is adversely affected by the shock, resulting in a fall in the HFA z-score by 0.56 standard
deviations. Yamano et al., (2005) find that for Ethiopia, a 10 percent rise in damage crop area is
associated with a 0.12 centimetres reduction in growth, over a period of six months. Hoddinott and
Kinsey (2001) show that children grew by 1.5 to 2 centimetres less after being exposed to drought.
Household wealth has a significant and positive impact in buffering the impact of the shock on both
measures of child health outcomes.
Taking out credit does not have a significant impact in buffering the impact of the climatic shock for any
of the child learning or health outcomes discussed above. This is perhaps a reflection of the undeveloped
credit markets in Ethiopia – households may be receiving credit, but it may be insufficient to bring forth
any positive buffering impact on child health outcomes. There is significant evidence of credit
constraints faced by households in Ethiopia. Krishnan and Sciubba (2004) report that the informal sector
is the only source of loans, in most of rural Ethiopia. Ibrahim, Kedir and Torres (2008) also provide
evidence that urban households in Ethiopia face substantial credit constraints, despite having access to
formal credit sources. Ali and Deininger (2012) report that credit-rationing on the basis of risk-related
factors is widespread in rural villages and political and social network play a key role in determining
access to credit for smallholder farmers. These results clearly suggest that credit may not be available to
the most adversely affected households, and hence plays no significant role in buffering the climatic
shock.
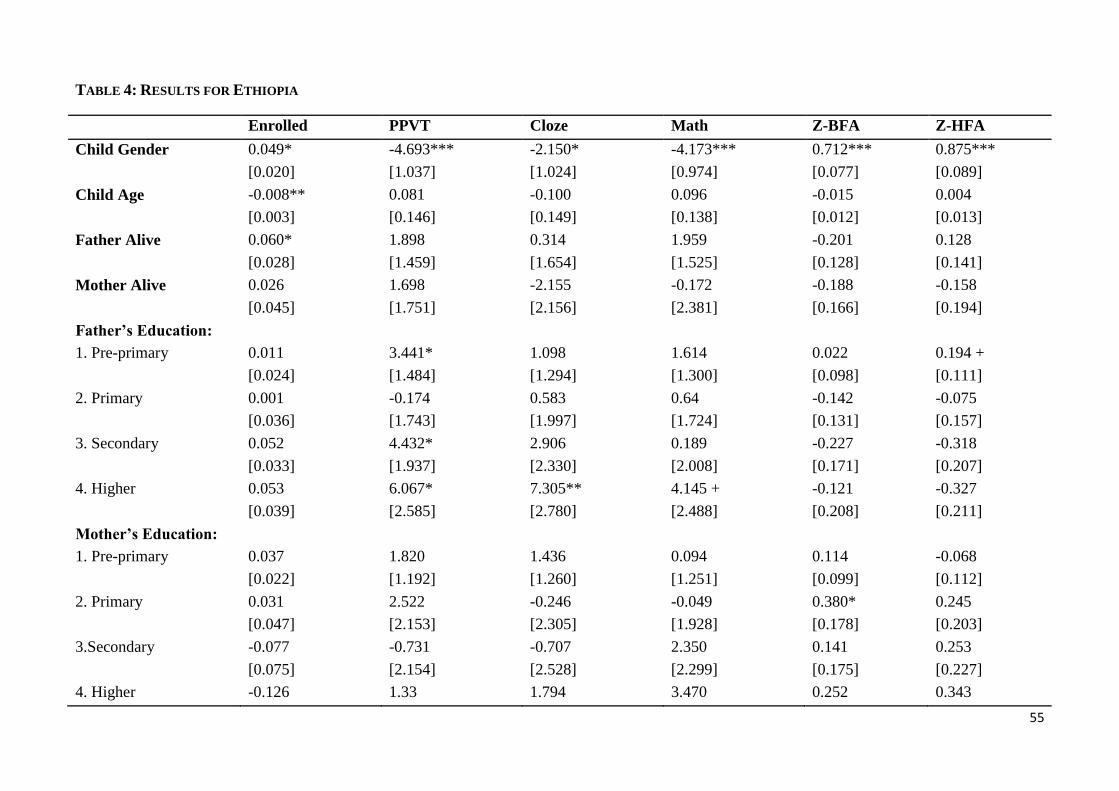
55
TABLE 4: RESULTS FOR ETHIOPIA
Enrolled PPVT Cloze Math Z-BFA Z-HFA
Child Gender 0.049* -4.693*** -2.150* -4.173*** 0.712*** 0.875***
[0.020] [1.037] [1.024] [0.974] [0.077] [0.089]
Child Age -0.008** 0.081 -0.100 0.096 -0.015 0.004
[0.003] [0.146] [0.149] [0.138] [0.012] [0.013]
Father Alive 0.060* 1.898 0.314 1.959 -0.201 0.128
[0.028] [1.459] [1.654] [1.525] [0.128] [0.141]
Mother Alive 0.026 1.698 -2.155 -0.172 -0.188 -0.158
[0.045] [1.751] [2.156] [2.381] [0.166] [0.194]
Father’s Education:
1. Pre-primary 0.011 3.441* 1.098 1.614 0.022 0.194 +
[0.024] [1.484] [1.294] [1.300] [0.098] [0.111]
2. Primary 0.001 -0.174 0.583 0.64 -0.142 -0.075
[0.036] [1.743] [1.997] [1.724] [0.131] [0.157]
3. Secondary 0.052 4.432* 2.906 0.189 -0.227 -0.318
[0.033] [1.937] [2.330] [2.008] [0.171] [0.207]
4. Higher 0.053 6.067* 7.305** 4.145 + -0.121 -0.327
[0.039] [2.585] [2.780] [2.488] [0.208] [0.211]
Mother’s Education:
1. Pre-primary 0.037 1.820 1.436 0.094 0.114 -0.068
[0.022] [1.192] [1.260] [1.251] [0.099] [0.112]
2. Primary 0.031 2.522 -0.246 -0.049 0.380* 0.245
[0.047] [2.153] [2.305] [1.928] [0.178] [0.203]
3.Secondary -0.077 -0.731 -0.707 2.350 0.141 0.253
[0.075] [2.154] [2.528] [2.299] [0.175] [0.227]
4. Higher -0.126 1.33 1.794 3.470 0.252 0.343

56
Enrolled PPVT Cloze Math Z-BFA Z-HFA
[0.108] [2.676] [3.465] [2.930] [0.214] [0.233]
Household Size -0.003 -0.534* -0.043 -0.432 + -0.043* -0.025
[0.005] [0.249] [0.277] [0.262] [0.021] [0.022]
Wealth Index 0.356*** 19.796*** 7.105 12.632** 1.041** 0.735 +
[0.106] [4.042] [4.429] [4.322] [0.359] [0.428]
Land Ownership 0.007 -2.290 -0.646 0.569 -0.294 0.064
[0.047] [1.835] [2.559] [2.152] [0.180] [0.175]
Site-type -0.108* -8.576*** -4.651* -2.937 0.014 0.113
[0.045] [2.256] [2.040] [1.881] [0.141] [0.157]
Region:
1. Amhara 0.014 -9.082* -8.435* 1.808 -0.381 -0.472
[0.063] [3.876] [3.408] [2.941] [0.249] [0.243]
2. Oromia -0.008 -7.088 + -2.237 -0.146 0.376 -0.026
[0.074] [3.702] [4.002] [3.418] [0.284] [0.294]
3. SNNP 0.033 -10.031* -6.541 3.644 0.599* -0.017
[0.074] [4.957] [4.108] [3.677] [0.284] [0.299]
4. Tigray 0.008 - 0.446 7.778** -0.132 -0.353
[0.066] - [3.476] [2.940] [0.248] [0.248]
Ln- Population 0.009 -6.738** -0.74 3.213* 0.119 0.136
[0.030] [2.455] [1.705] [1.614] [0.128] [0.147]
Drought -0.001 -2.859 + -1.242 -2.173+ -0.046 -0.554***
[0.023] [1.493] [1.425] [1.304] [0.098] [0.119]
Flood 0.010 -5.471** -3.399 + -2.909* -0.085 -0.041
[0.029] [1.818] [1.847] [1.478] [0.126] [0.146]
Support: Loan/Credit 0.021 -0.305 1.125 1.674 -0.026 0.034
[0.022] [1.141] [1.146] [1.100] [0.082] [0.097]
Support: PSNP -0.016 4.098* -2.293 -1.847 -0.108 -0.041

57
Enrolled PPVT Cloze Math Z-BFA Z-HFA
[0.025] [1.678] [1.424] [1.339] [0.100] [0.121]
Constant
- 359.782*** 332.615*** 248.832*** 0.726 -2.804
- [38.897] [33.143] [29.522] [2.497] [2.768]
R2/ Pseudo R2 0.156 0.546 0.212 0.210 0.233 0.193
Note:
Robust standard errors in brackets
+ p< 0.1, *p<0.05, **p<0.01, *** p<0.001
Pseudo R2 is reported for enrolment regression, whereas R2 is reported for other categories
All coefficient estimates are Huber-White homoscedastic
Marginal coefficient estimates and standard errors are reported for probit enrolment equation.
No of observations used: 840.
Corrected PPVT Rasch scores were not available for the Tigray region. Hence, no of observations used in the PPVT estimation are 377.
58
Similarly, our results indicate that except in the case of PPVT scores, participation in the PSNP
programme does not help in buffering the impact of the climatic shock and contributing positively to
child health and educational outcomes. Orkin (2010) notes that the PSNP has increased child labour
supply. Although the PSNP does not formally avail the services of children, it is not uncommon for
children to substitute for, or work alongside, their parents or other registered household members.
Finally, as discussed earlier, the rise in women's labour supply without concurrent improvements in social
and physical infrastructure for child care may have shifted household work responsibilities to female
children (Woldehanna et al., 2008). Gilligan, Hoddinott and Taffesse (2008) report that the PSNP
programme has little impact on participants on average. They attribute this to transfer levels being far
below the program’s stated targets. Only households that received at least half of the intended transfers
experienced food security. Moreover the PSNP programme showed positive results for households which
combined the PSNP package with other targeted supported packages like agricultural support
programmes. Also the review of PSNP Public Works Programme in 2006, commissioned by the
Government of Ethiopia, found that the programme is beset by various constraints including “inadequate
coordination and monitoring, untimely delivery of resources, lack of timely planning and implementation,
low levels of technical skills of field staff” (Government of Ethiopia 2006). Corruption in administering
aid is also an issue. Broussard, Dercon, and Somanathan (2009) show that a household’s position in the
village power structure has a significant impact on the amount of food aid received in Ethiopia.
In light of the insignificance of PSNP coefficient estimates for all other measures of human capital, the
positive impact of the PSNP programme on buffering the impact of droughts and shocks on child PPVT
scores is somewhat surprising. However, this finding becomes less perplexing when we consider the
coefficient estimates of various variables across the six equations for Ethiopia. By far the PPVT variable
is most responsive to buffering mechanism such as parental education, wealth index etcetera. This could
be, in part, a reflection of the fact that PPVT scores for Tigray were not available and hence regression
estimates for various cognitive outcomes are not directly comparable.
5.2. Discussion of Results for India
India is a vast country covering 3.28 million sq kilometres, occupying just a little less than 3 percent of
the world’s geographical area. As the world’s second most populous country, India is home to over 1.25
billion people, with a population that continues to grow at 1.2 percent annually. In 2013, GDP was
recorded at US $ 1498.87 and GDP growth rate was 6.9 percent. It ranks 135 out of 185 countries in the
UNHDI, with an HDI of 0.586 and a Multidimensional Poverty Index of 0.282 (UNHDR, 2014). Over the

59
last five years, India has seen impressive economic growth and is now the world’s third largest economy
in purchasing power parity terms (IMF, 2015). Even during the global recession in 2009, the economy
had a growth rate of 7 percent of GDP. However, despite high rates of economic growth and the
introduction of several poverty reduction programmes, India accounts for almost a quarter of the world’s
poor population. According to the World Bank (2010) report, 68.7 percent of the population (841million)
lives on less than two dollars per day, meaning families and children in poverty cannot afford basic goods
and services.
With respect to climatic conditions, India is endowed with varied landscapes and climate from alpine
conditions to tropical regions and arid deserts. About 70 percent of the population is dependent on climate
sensitive activities such as agriculture, and nearly 75 percent of the annual precipitation occurs over a
short monsoon season (June – September). Thus when a shortfall of or excessive rainfall ensues, they can
have widespread effects on the population. 68 percent of the country’s area is drought-prone in varying
degrees, of which about 50 percent is chronically drought-prone. According to the Government of India’s
estimates, there are one or two years of droughts every five years in semi-arid and arid regions of India
and 50 million people are affected annually. With respect to floods, 40 million hectares, or 12 percent of
Indian land, are considered flood prone. Floods are a perennial phenomenon in at least 5 states - Assam,
Bihar, Orissa, Uttar Pradesh and West Bengal. With greater climatic variability, floods have also occurred
in areas such as Rajasthan, which are not normally flood prone. As the incidence of such shocks rises,
India is vulnerable to deeper impacts resulting from such shocks.
Children below the age of 18 years account for nearly 40 per cent of India’s population. Needless to say
that enabling children to realize their full potential is essential for sustaining progress and fostering
pronounced improvements in human development. The gains from India’s remarkable growth have been
unevenly distributed, and millions of children are still challenged in terms of survival, food security and
healthy development. Hunger and child malnutrition prevail in many areas of India. Thus given the scale
of childhood poverty in India and the incidence of climate shocks, assessing their impact on child health
and learning outcomes is particularly important.
In India, the Young Lives research has been carried out in a mixture of poor and non-poor, rural and
urban sites in the states of Andhra Pradesh and Telangana. Andhra Pradesh was formed in 1956 and
comprised the regions of: Coastal Andhra, Rayalaseema and Telangana. In 2014, Telangana formally
became an Indian State. Andhra Pradesh has 13 district, with a population of 52.4 million. Telangana, on
the other hand, has 10 district with a population of 32.2 million. Hyderabad, as the shared capital of
Andhra Pradesh and Telangana, is the largest city. The Gross State Domestic Product (GSDP) average
grew at 7.9 percent during the first two years of the Eleventh Five-Year Plan – a little over the all-India

60
GDP growth rate of 7.8 percent (Government of Andhra Pradesh 2010). Andhra Pradesh is one of the
three largest drought-prone states in India.
Table 5 presents the result of our empirical analysis for Andhra Pradesh, India. Our empirical
specification finds an insignificant impact of droughts on school enrolment, cognitive measures of
attainment and anthropometric indicators of child health. In sum, this is suggestive of the substitution
effect cancelling out the negative income effect of the drought shock. Jacoby and Skoufias (1997) report
that rainfall shocks do not result in any substantial loss of human capital on average in two villages in
Andhra Pradesh and four villages in Maharashtra.
Ownership or renting of land has a significant positive impact on school enrolment. This is somewhat
paradoxical, given that there is considerable substitution expected between time spent in schooling
activities and time spent working at the farm for households owning or renting land, as compared landless
households. But perhaps it could be the case that cultivable land area is destroyed due to prolonged
exposure to drought and hence work opportunities at the farm are depressed, leaving children free to
pursue schooling activities and thus enhancing enrolment. In arid regions like Andhra Pradesh following
droughts cultivable land may becomes too dry and the ability to absorb water may be reduced, making
many areas of land unsuitable for cultivation. Thus there would be a substitution away from work on farm
to investment in time spent at school.
Too much rain or floods have a positive and significant impact on child enrolment. This finding can most
plausibly be explained by the existence of a positive (rather than negative) income effect resulting from
excessive rainfall. Excessive rainfall in arid regions is likely to result in an increase in agricultural
productivity and output, leading to higher household income and improved food availability. Thus the
income effect serves to improve child health and schooling outcomes in this case. The positive impact of
shocks on schooling and health outcomes has been documented by Maccini and Yang (2009), Jacoby and
Skoufias (1997), Neri and Thomas (2001), among others. Maccini and Yang report that Indonesian
women are likely to complete 0.22 more years of schooling, as a result of excessive rainfall. Schady
(2004) reports that four out of five children exposed to an adverse shock complete one more grade of
schooling.
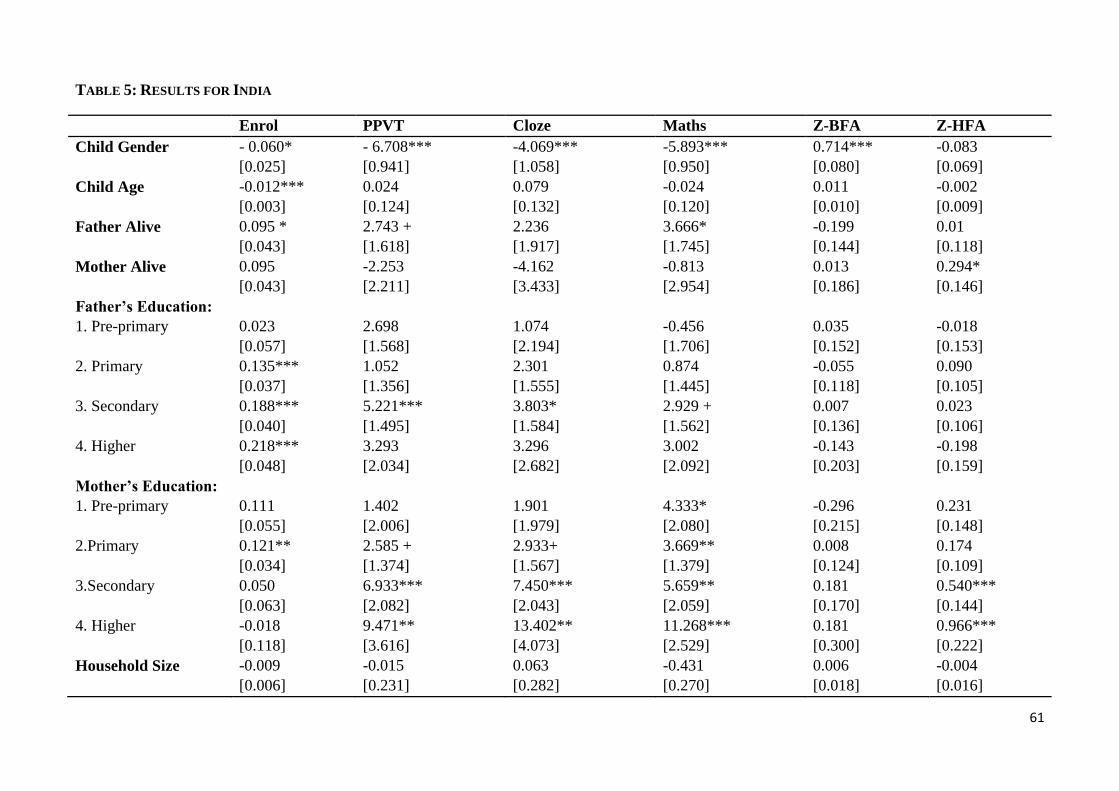
61
TABLE 5: RESULTS FOR INDIA
Enrol PPVT Cloze Maths Z-BFA Z-HFA
Child Gender - 0.060* - 6.708*** -4.069*** -5.893*** 0.714*** -0.083
[0.025] [0.941] [1.058] [0.950] [0.080] [0.069]
Child Age -0.012*** 0.024 0.079 -0.024 0.011 -0.002
[0.003] [0.124] [0.132] [0.120] [0.010] [0.009]
Father Alive 0.095 * 2.743 + 2.236 3.666* -0.199 0.01
[0.043] [1.618] [1.917] [1.745] [0.144] [0.118]
Mother Alive 0.095 -2.253 -4.162 -0.813 0.013 0.294*
[0.043] [2.211] [3.433] [2.954] [0.186] [0.146]
Father’s Education:
1. Pre-primary 0.023 2.698 1.074 -0.456 0.035 -0.018
[0.057] [1.568] [2.194] [1.706] [0.152] [0.153]
2. Primary 0.135*** 1.052 2.301 0.874 -0.055 0.090
[0.037] [1.356] [1.555] [1.445] [0.118] [0.105]
3. Secondary 0.188*** 5.221*** 3.803* 2.929 + 0.007 0.023
[0.040] [1.495] [1.584] [1.562] [0.136] [0.106]
4. Higher 0.218*** 3.293 3.296 3.002 -0.143 -0.198
[0.048] [2.034] [2.682] [2.092] [0.203] [0.159]
Mother’s Education:
1. Pre-primary 0.111 1.402 1.901 4.333* -0.296 0.231
[0.055] [2.006] [1.979] [2.080] [0.215] [0.148]
2.Primary 0.121** 2.585 + 2.933+ 3.669** 0.008 0.174
[0.034] [1.374] [1.567] [1.379] [0.124] [0.109]
3.Secondary 0.050 6.933*** 7.450*** 5.659** 0.181 0.540***
[0.063] [2.082] [2.043] [2.059] [0.170] [0.144]
4. Higher -0.018 9.471** 13.402** 11.268*** 0.181 0.966***
[0.118] [3.616] [4.073] [2.529] [0.300] [0.222]
Household Size -0.009 -0.015 0.063 -0.431 0.006 -0.004
[0.006] [0.231] [0.282] [0.270] [0.018] [0.016]

62
Enrol PPVT Cloze Maths Z-BFA Z-HFA
Wealth Index 0.189* 18.625*** 13.588** 15.305*** 0.177 0.794**
[0.095] [3.494] [4.232] [3.533] [0.317] [0.287]
Land Ownership 0.053 + -0.689 0.374 0.955 -0.068 -0.064
[0.031] [1.247] [1.369] [1.243] [0.108] [0.089]
Site-type -0.034 1.857 4.013* 2.535 -0.300 + 0.088
[0.049] [1.766] [1.974] [1.807] [0.159] [0.132]
Region:
1. Rayalaseema -0.156 *** 0.311 -2.665 + -2.972* -0.208 + -0.088
[0.033] [1.195] [1.363] [1.240] [0.109] [0.082]
2. Telangana -0.027 -5.625*** -2.367 + -5.229*** -0.402*** -0.078
[0.030] [1.241] [1.390] [1.203] [0.104] [0.088]
Ln-Population 0.017 1.067 1.227 0.945 -0.005 -0.077
[0.019] [0.845] [0.786] [0.741] [0.069] [0.057]
Drought 0.059 0.970 -3.028 -0.049 0.177 -0.038
[0.046] [1.682] [2.036] [1.830] [0.137] [0.126]
Flood 0.256* 4.935* 4.849 + 0.778 0.210 -0.127
[0.120] [2.233] [2.750] [3.212] [0.205] [0.157]
Support: PDS -0.177* -1.706 -0.035 -2.361 -0.360 + -0.107
[0.079] [2.222] [2.456] [2.128] [0.186] [0.166]
Support: NREGS 0.040 -0.041 0.535 -0.468 -0.022 -0.043
[0.036] [1.526] [1.574] [1.573] [0.115] [0.100]
Constant - 271.604*** 259.860*** 282.436*** -1.765 -1.509
- [24.029] [26.656] [23.752] [1.942] [1.684]
R2/ Pseudo R2 0.180 0.267 0.133 0.221 0.142 0.099
Note:
No of observations used: 874

63
The coefficient estimates for BFA and HFA z-score are insignificant, in the case of both floods and
drought. However both coefficients have opposite signs, climate shocks have an insignificant but positive
impact on HFA; the association with BFA is negative but insignificant. Other studies such as Hyder and
Behrman (2014) and Tiwari and Skoufias (2013) have reported similarly paradoxical findings for health
outcomes. Hyder and Behrman explain that there are differences in the short-term and longer-term
impacts on health: crop destruction and livestock disease shocks have a negative (but insignificant)
association with BFA z-scores and a positive association with HFA z-scores, in Ethiopia. In the case of
children in Nepal, Tiwari and Skoufias explain that perhaps vector-borne disease following an adverse
rainfall shock impacts short-term health adversely, whereas in the longer term such effects are mitigated.
Moreover, in the long run institutional aid may play a role in improving health outcomes. Also, the use of
standardized measures HFA and WFA poses a problem, in that the two measures confound each other.
Children who are stunted are ceteris paribus less likely to be underweight. Simply put, taller children will
weigh less, given their height, than shorter children.
It is noteworthy that we find a significant impact of household wealth and parental education on
enrolment and cognitive measures of attainment. The effects are particularly strong in the case of
mother’s education. The positive income effect from gainful maternal employment appears to outweight
any negative impacts resulting from a fall in maternal time devoted to child care. Secondary and higher
maternal education also contributes positively to improving HFA z-scores. Children with fathers who are
still alive also exhibit a greater likelihood of enrolment and stronger cognitive scores. This suggests that
family and household characteristics can play a considerable role in cushioning shocks in affected areas.
In analyzing support programs, we find that they do not act as buffers to shocks in Andhra Pradesh. The
coefficient estimates for the PDS are insignificant for all cognitive scores and HFA z-score specifications.
For enrolment and BFA z-score there is a significant negative association with the PDS. This is hardly
surprising - there is widespread consensus among researchers that the system has been unable to reach its
goal due to inefficiencies, corruption, improper implementation and limited scope. Radhakrishna and
Subbarao (1997) find that the welfare gains of PDS in terms of income transfer and effects of poverty and
nutritional status are meagre. Moreover, even meagre transfer benefits are realized at an exorbitant cost.
Corruption and misappropriation of funds is rampant in bureaucratic organisations like PDS. Coupled
with mismanagement and inefficiencies of operations, this means that the majority of beneficiaries of the
PDS are not the target population (see Kattumuri, 2011). According to M.S. Ahluwalia, the former
Deputy-Chairman of the Planning Commission of India, only 16% of the resources allocated towards
India’s food subsidized distribution scheme reach the poor (see Economist 2010a). Niehaus and
Atanassova (2011) report substantial inclusion errors in the allocation of Below Poverty Line (BPL) cards
64
by loan officials. Some of these errors result from an inefficient and antiquated system rules while others
are a result of deliberate actions by officials. Officials have vested interests and in order to garner political
support they target households who are more likely to benefit from the PDS scheme rather than poorer
households.
Secondly agents have a strong incentive to sell goods on the black market (see Parivartan, 2004).
According to Khera (2011), approximately 44 percent of food grain procured for distribution purposes is
diverted for primary use by private markets (grain dealers and shop owners) to fetch market prices and
reap huge profits. According to PEO (2005) when a poor household seeks grain, the shopkeeper may
report that the PDS grain has not arrived yet (or has run out) and market grain is readily available. The
poorest households are thus forced to make many rounds to the shops to catch PDS grain at subsidised
rates. This implies that time spent by household members in trying to access the PDS comes at the cost of
time spent on other activities such as mother’s time spent caring for the kid and hence may account for
the negative impact on enrolment and the short term indicator of nutritional status (BFA z-score),
observed in our study.
The third channel accounting for a detrimental impact of the PDS is the poor quality of PDS grain,
relative to that of other grains available in the market. Many studies report poor PDS grain quality (see
Nagavarapu and Sekhri, 2011; Gubrium, Pellissery and Lodium, 2013). Pellissery and Mathew (2014b)
cite one of their survey respondents as describing the PDS grain as “worth only giving to cattle and hens”.
Gubrium et al., point out that in deliberate attempt shopkeepers carefully separate grains on the basis of
quality. Higher quality grain is placed for sale as market prices, and poor quality grain is displayed for
PDS sales. Public awareness of low PDS grain quality means that only those who have no other choice
frequent PDS shops. Thus, disadvantaged and poorer households are more likely to participate in PDS.
For them poor grain qualities means deterioration in nutritional and consequently health and educational
outcomes.
We also find that the NREGS has no significant association with schooling and nutritional outcomes.
According to literature, participation in employment guarantee programs can impact children’s health and
educational outcomes through three channels. First increased income and availability of work could
ensure that children are not required to work in order to ensure the household’s economic status, during
crisis. This would have a positive impact on investment in human capital. However, adult time at work
can inadvertently force children to substitute time at school or school-related activities to time at home in
caring for young siblings or time spent in farm-related activities. Also, a reduction in parental time
allocation, particularly that of mothers, may result in deterioration in human capital (numerous studies

65
report a negative association between female labour force participation and child health in developing
countries). These negative effects would reinforce the negative impact of climatic shocks.
Various evaluation studies on the impact of NREGS have been conducted, but there are hardly any
systematic studies relating to impact of the scheme on children. Uppal (2009) analyses the impact of the
NREGS programme in Andhra Pradesh and finds considerable evidence of corruption. He reports that
having more than 5 influential relatives increases the probability of registration by 10.3 point. They report
an insignificant positive association between program participation and health outcomes. Program
registration reduces the probability of young boys and girls entering child labour. Islam and Sivasankaran
(2014) report that the NREGS results in an increase in time spent on education for young children and an
increase in time spent working outside the household for older children. The GBPSSI (2009) study of six
north-Indian states shows that basic work site facilities were missing in most of the cases. In the absence
of care facilities for younger children, older siblings may have to devote time to caring for their siblings.
Working women will have lesser time for child care activities.
5.3. Discussion of Results for Peru
Peru is an upper-middle-income country, with per capita GDP reported at US $ 6,662 and growth rate
reported at 5.8 percent in 2013. The third largest country in Southern America, it stretches over an area of
30.38 million sq kilometres. Population has been growing at a rate of 1.3 percent annually. Peru ranks 82
in the UNHDI index, with an HDI of 0.737 (UNHDR 2014). Despite growth rates averaging over 6
percent in the last decade, 25.8 percent of the population lived in poverty in 2012 and inequality remains
a major threat to continued development and growth. In some regions just over 10 percent of the
population lives in poverty, while in others around 60 percent of the population are poor. Inequality has
major implications for children in Peru (Dornan and Woodhead, 2015). Children in poorer households
suffer disproportionately as a result of adverse shocks. Childhood stunting and chronic malnutrition is a
major problem
Traditionally, the country has been broadly divided into three geographical regions. The Coast, lying to
the west, in a largely arid plan except for valleys which are created by seasonal rivers. The Mountain or
highlands describe the region of the Andes and the Altiplano plateau. The Jungle region is a wide
expanse of flat terrain covered by the Amazon rainforest extending to the east. 60 percent of the
country’s area is located within the Jungle region. Peru’s climate is a heterogeneous mixture, reflecting its
varied geography. The Coast, in the north receives substantial precipitation, while the desert in the south

66
is dry and arid. Valleys and plateaus in the Mountain region have their own micro-climates with various
degrees of precipitation and temperatures. The Jungle receives heavy precipitation. Climate change trends
in Peru include rising temperatures, extreme temperature fluctuations, changing rainfall patterns, sea level
rise, and an increasing rate of glacier melt in the Andes. Earthquakes are the most common natural
disaster, followed by floods. Floods have major implication for the poor, many of whom live in water-
sensitive areas and work in resource-dependent sectors such as agriculture or fishing.
We use the empirical specification set out in Section 4, to ascertain the impact of drought and floods on
human capital investment in Peru. Results are presented in Table 6 below. We find no significant impact
of drought or floods on enrolment. The negative income effect of the shock is cancelled out by the
substitution effect due to lessened labour market alternatives. This is consistent with the findings reported
by Escobal et al., (2005) for Peruvian children. They report that the ‘quantity’ of education, as measured
by drop-out rates and overage remains unchanged in the face of adverse shocks.
Drought has a negative impact on child PPVT scores – PPVT scores are 4.47 points lower for children
living in drought exposed households. This is indicative of a dominant income effect and adjustment in
the quality of schooling. To ensure against the shock, children may increase time spent in productive
activities, at the expense of time spent in learning activities outside school. Dureya and Levison (2007)
demonstrate evidence of increased child labour force participation, without an accompanying fall in
enrolment, in the face of unemployment shocks in Latin America. Baez and Santos (2007) reported that
the proportion of children simultaneously enrolled in school and working more than doubled, in areas
affected by Hurricane Mitch in Nicaragua.
The association of Cloze and Maths test scores with drought is negative but insignificant. As discussed
earlier, differing results for various cognitive measures of attainment have been documented in previous
studies (see Hyder and Behrman, 2014). In the case of too much rain and floods, PPVT and Maths test
scores have negative but insignificant coefficients, whereas Cloze test scores are 3.21 points lower for
children living in drought exposed households. The coefficient estimate for drought in both the health
outcome equations is insignificant. BFA z-scores are 0.24 points lower in flood exposed households,
whereas no significant association can be seen in the case of HFA z-scores. This suggests that in the short
term the ‘disease environment effect’ documented in studies may be particularly strong, thus affecting the
short term health if adolescents adversely (see Tiwari and Skoufias, 2013).
Household wealth has a large positive impact on enrolment, cognitive scores and longer-term nutritional
status. Household size on the other hand is negatively associated with cognitive scores and HFA z-scores.

67
Rural students have lower cognitive outcomes than do urban students. Primary and secondary parental
education, particularly paternal education, has significant impacts on enrolment and cognitive scores. This
may be in part because parental education is associated with greater wealth, but also because educated
parents may have a stronger preference for investing in their child’s human capital. Anthropometric
indicators show no significant association with parental education. In this respect it must be emphasized
that our analysis is based considers a cross-section of households, at a particular point time. Impacts on
health outcomes, particular HFA z-scores typically become evident in the long-run. Hence such effects
may become more evident in panel data regressions. Also past values of anthropometric indicators are
key explanatory variables in such panel regressions, due to the critical importance of early life
circumstances. Since our analysis is cross-sectional and we focus on the association between climatic
shocks and child anthropometric indicators, rather than the determinants of child human capital in
general, we have not included past values of anthropometric indicators in our specification.
Taking out loans and credit plays an instrumental role as a buffering mechanism. This is typical of the
well-developed credit markets in Latin America, in general, compared to credit markets in Asia and
Africa. Support from loans and credit increases PPVT and Cloze test scores by almost 2.5 points. HFA z-
scores are 0.16 points greater in households that received loans. Jacoby and Skoufias (1997) provide an
excellent exposition of the impact of credit constraints on schooling outcomes. If parents are constrained
in their ability to borrow, and child time is valuable in home or market production, then the desire to
smooth household consumption over time will lead parents to gradually withdraw their children from
school and put their children to work. Thus in well-developed credit markets, access to credit will enable
consumption smoothing in the face of shocks without having to substitute between investment in human
capital and outside work. Jacoby (1994) documents that human capital investment decisions differ
considerably between credit constrained and non-credit-constrained households, in Peru.
Registration in the SIS Health Insurance programme has no significant impact on BFA and HFA z-scores.
This is hardly surprising, given that the SIS failed as a programme. According to Francke (2013) the SIS
has played an instrumental role in the reduction of maternal and child mortality; however, it has failed to
make reforms to the system that were expected. In part this is because of the low budget allocation to SIS
(less than 10 percent of the total budget directed to health care by the Ministry of Health (MOH)), weak
management capabilities of SIS facilities in different regions and a lack of clear distinction between the
roles of national and regional governments in the program. Moreover the SIS has failed to target the poor.
Due to its failures the policy was replaced by Universal Health Insurance (AUS), in 2010 so as to promote
a more holistic approach to health reform. However the policy still remains to be implemented properly.

68
TABLE 6: RESULTS FOR PERU
Enrolled PPVT Cloze Math Z-BFA Z-HFA
Child Gender -0.045* -2.070 + 1.211 0.454 0.306*** -0.171*
[0.020] [1.104] [1.099] [1.144] [0.081] [0.068]
Child Age -0.003 0.165 -0.133 0.229 + 0.004 -0.011
[0.002] [0.126] [0.132] [0.124] [0.009] [0.008]
Father’s Education:
1. Pre-Primary 0.044 8.854 2.019 9.333* -0.066 0.049
[0.106] [5.912] [5.706] [3.712] [0.295] [0.301]
2. Primary 0.061 8.287 1.146 7.596* -0.007 0.244
[0.107] [5.860] [5.610] [3.571] [0.296] [0.302]
3. Secondary and Higher 0.060 10.44 + 3.348 12.410*** 0.035 0.217
[0.109] [5.951] [5.517] [3.543] [0.288] [0.295]
Mother’s Education:
1. Pre-Primary 0.090 + -0.054 1.14 -0.89 -0.049 0.044
[0.044] [2.979] [2.931] [2.655] [0.176] [0.129]
2. Primary -0.012 -0.035 3.758 3.098 0.028 0.131
[0.035] [2.639] [2.757] [2.458] [0.167] [0.138]
3. Secondary and Higher 0.012 4.191 8.350** 5.524* -0.233 0.196
[0.037] [2.673] [2.758] [2.457] [0.176] [0.137]
Household Size -0.004 -0.603 + -0.609 + -0.372 -0.044 + -0.034 +
[0.005] [0.349] [0.325] [0.298] [0.026] [0.017]
Wealth Index 0.341 *** 20.385*** 15.700*** 16.755*** 0.429 0.966***
[0.081] [4.990] [4.657] [4.974] [0.323] [0.271]
Site-type -0.016 -6.528** -4.939* -3.46 + -0.045 -0.104
[0.032] [1.987] [1.920] [2.009] [0.138] [0.126]
Region:

69
1. Mountain 0.093 *** -1.186 -1.992 1.210 -0.410*** -0.250**
[0.029] [1.350] [1.342] [1.450] [0.111] [0.092]
2. Jungle 0.057 -0.661 -0.381 -1.558 -0.367* -0.191 +
[0.036] [1.957] [1.885] [1.905] [0.174] [0.110]
Ln-Population -0.008 + -1.051 -0.888 -1.234* -0.052 -0.025
[0.008] [0.537] [0.550] [0.603] [0.037] [0.031]
Drought 0.044 -4.472* -2.571 -0.146 0.127 -0.008
[0.052] [2.094] [2.615] [2.082] [0.159] [0.201]
Flood 0.016 -2.286 -3.215 + -2.818 -0.240 + -0.137
[0.031] [1.894] [1.926] [2.021] [0.131] [0.137]
Support: Loan/Credit 0.018 2.351* 2.484* 0.843 -0.021 0.163*
[0.022] [1.163] [1.192] [1.293] [0.092] [0.075]
Support: SIS Health Insurance - - - - 0.108 0.081
- - - - [0.090] [0.076]
Constant - 266.240*** 324.855*** 252.689*** 0.556 0.079
- [24.141] [26.093] [24.213] [1.737] [1.525]
R2/ Pseudo R2 0.199 0.303 0.292 0.217 0.082 0.179
Note:
No of observations used: 537
This empirical specification uses only three categories of parental education (For details see Section 3.4)
The SIS Health insurance variable has only been included in the health outcomes specification.
Land ownership in Peru was 100 percent, so we do not include the variable in our specification
Only 5 mothers were reported as not still being alive; no meaningful statistical inference would be possible with its inclusion. Therefore, we do not include
the variables father alive and mother alive in our specification

70
5.4. Discussion of Results for Vietnam
Vietnam, an eastern country in the Indo-China peninsula, covers an area of 331,210 sq kilometres. With a
population recorded at 90.5 million in 2014 and a growth rate of 1.0 percent per annum, Vietnam is the
13th
most populous country in the world. On the economic front, Vietnam is a story of developmental
success. Growth rates have averaged 6.4 percent per year, over the last decade, with a slowdown in 2014.
Political and economic reforms launched in 1986 have transformed Vietnam from one of the poorest
countries in the world, with per capita income below $100, to a lower middle income country within a
quarter of a century, with per capita income of over $2,000 by the end of 2014. Moreover, growth has
been broad-based and inclusive. It has achieved most and in some cases surpassed a number of the
Millennium Development Goals (MDGs), particularly with the goals on poverty reduction, education and
gender equality. Vietnam has made impressive progress in reducing poverty. The percentage of people
living in poverty dropped from almost 60% in the 1990s to less than 3% today. Vietnam's HDI value for
2012 was 0.617, in the medium human development category, ranking the country 127th out of 187
countries and territories. Between 1990 and 2012, Vietnam's HDI value increased from 0.439 to 0.617, an
increase of 41 percent, or an average annual increase of about 1.6 percent.
The educational sector has also shown considerable progress. Literacy and school attendance are
relatively higher compared to other countries with similar income levels. Recent literature has voiced
concerns over the quality of and access to education (Pham and Jones, 2010 provide a detailed
discussion). Universal primary school enrolment is very close to being achieved, however enrolment rates
are much lower for secondary and higher-secondary education, more so for children who are poor and/ or
hail from rural areas.
Vietnam’s topography includes tropical lowlands, hills, and densely forested highlands, with level land
covering merely 20 percent of the area. It is divided into highlands and the densely populated Red River
Delta in the north, the central mountains and coastal lowlands, and the Mekong River Delta in the south.
The country is prone to many different types of various climatic shocks including flood, storm and
drought. Over 70 percent of the population is vulnerable to the risks associated with such hazards. Floods
are the most common type of natural disaster, accounting for almost half of all natural disasters.
Provinces in the northwest of the Mekong River Delta face the greatest risk of flooding.
A rise in the incidence of climatic shocks has increased household exposure to risks. Children face
greater vulnerabilities as a result, and we attempt to examine these vulnerabilities through the empirical

71
specifications set out in Equation 1 and 2 in Section 4. The results are provided in Table 7 above and
discussed subsequently.
Our results demonstrate no significant impacts of either droughts or flood on school enrolment. This
suggests that the income effect of climatic shocks is cancelled out by the substitution effect. This is
consistent with the insights provided by Ferriera and Schady (2009), discussed in Section 2.2. A country’s
initial level of wealth plays an important role in buffering shocks. In middle-income countries like
Vietnam, credit markets are well-developed and households have greater asset wealth, consequently
borrowing constraints are less binding for households affected by shocks (see Dung, 2013). The effect of
falling incomes is cushioned by households’ ability to sell assets and borrow in order to smooth
consumption. Hence the need for a child to substitute time at school with time at work or in the farm is
lessened. The coefficient estimates for cognitive measures of attainment are also insignificant. Again the
income and substitution effects balance each other.
Droughts have a significant and negative impact on child HFA z-scores, indicative of the dominance of
the income effect over the substitution effect. Thai and Falaris (2011) report similar findings for infants
and young children in rural Vietnam. However, both drought and floods have no significant impact on
BFA z-scores (see Shah and Steinberg, 2013; Maccini and Yang 2009).
Secondary and higher maternal education play an instrumental role in explaining cognitive outcomes,
more so than paternal education. This finding is consistent with numerous studies which indicate that
maternal time allocation and mother’s education is a key factor in child human capital investment. This
finding is consistent with numerous studies which indicate that maternal time allocation and mother’s
education is a key factor in child human capital investment. Parental education has no significant impact
on health indicators. Household wealth also plays an important role in explaining differences in cognitive
attainment and HFA z-scores. We do not find any substantial evidence of differences in scores across
regions, except in the case of Math scores, which are higher for children living in the Mekong River
Delta. This is perhaps a reflection of the greater degree of urbanisation in this area.

72
TABLE 7: RESULTS FOR VIETNAM
Enrolled PPVT Cloze Math Z-BFA Z-HFA
Child Gender -0.048 0.248 -4.539*** -3.093** -0.266*** -0.032
[0.025] [0.901] [0.998] [0.961] [0.076] [0.064]
Child Age -0.007 0.134 -0.202 0.140 -0.016 -0.018*
[0.003] [0.131] [0.140] -0.139 [0.011] [0.009]
Father’s Education:
1. Pre-primary -0.110 0.844 1.716 2.724 -0.091 -0.298
[0.079] [4.020] [3.099] [2.789] [0.191] [0.193]
2. Primary -0.025 1.335 3.627 5.574 + -0.142 -0.092
[0.079] [3.989] [3.020] [2.906] [0.189] [0.189]
3. Secondary 0.076 2.705 5.805 + 5.600 + -0.103 0.050
[0.079] [4.023] [3.060] [2.908] [0.193] [0.188]
4. Higher 0.121 2.630 6.712* 7.748* -0.233 -0.072
[0.084] [4.199] [3.253] [3.109] [0.216] [0.203]
Mother’s Education:
1. Pre-primary 0.039 9.985*** 1.469 2.669 -0.12 0.410*
[0.080] [2.748] [2.486] [2.425] [0.173] [0.171]
2. Primary 0.133 10.842*** 2.609 3.774 -0.111 0.380*
[0.079] [2.573] [2.490] [2.488] [0.166] [0.173]
3.Secondary 0.151 10.721*** 4.987 + 5.891* -0.224 0.350*
[0.083] [2.715] [2.629] [2.617] [0.180] [0.176]
4. Higher 0.227 13.160*** 7.888** 11.944*** 0.014 0.394*
[0.088] [2.954] [2.891] [2.939] [0.208] [0.194]
Household Size -0.006 0.151 -1.166** -0.304 -0.036 -0.043
[0.010] [0.400] [0.402] [0.398] [0.029] [0.028]
Wealth Index 0.505 28.273*** 13.550** 17.078*** 0.504 0.856**

73
Enrolled PPVT Cloze Math Z-BFA Z-HFA
[0.106] [4.003] [4.249] [3.947] [0.308] [0.261]
Site-type -0.017 -4.787** 5.899** -1.656 -0.465** 0.032
[0.054] [1.783] [1.887] [1.753] [0.142] [0.120]
Region:
1.Red River Delta -0.097 0.210 -3.312 -0.317 -0.252 + 0.166
[0.054] [1.732] [2.045] [1.909] [0.140] [0.129]
2. Central Coast -0.038 -1.499 3.202 -1.843 -0.259* 0.022
[0.040] [1.513] [1.975] [1.547] [0.121] [0.114]
3. Mekong River Delta 0.052 1.042 0.358 4.133* 0.088 0.335**
[0.036] [1.691] [1.983] [1.775] [0.132] [0.117]
Ln -Population -0.017 0.114 3.814*** 2.587* 0.054 0.058
[0.030] [1.137] [1.139] [1.116] [0.087] [0.077]
Drought -0.004 0.467 -2.192 0.528 0.067 -0.226 +
[0.044] [1.772] [2.059] [1.522] [0.130] [0.128]
Flood -0.039 1.331 0.356 0.275 -0.107 -0.094
[0.033] [1.163] [1.302] [1.242] [0.091] [0.085]
Support: Cash in Kind 0.117 2.433 + 2.481 2.006 0.101 -0.154
[0.027] [1.411] [1.540] [1.456] [0.098] [0.110]
Constant 252.626*** 281.260*** 236.013*** 2.852 0.621
[24.848] [27.145] [27.065] [2.148] [1.730]
R2/ Pseudo R2 0.215 0.298 0.203 0.263 0.091 0.147
Notes:
No of observations used: 740
The variables: Father Alive, Mother Alive and Land Ownership have not been included in the empirical specifications above (for details see Section 3.3)

74
Support for schooling, received in the form of cash or in kind, has no significant impact on school
enrolment. The coefficient is positive for all cognitive measures of attainment but only significant in the
case of PPVT scores. PPVT scores of children receiving transfers were 2.5 points higher than those of
children who had not received such transfers. This suggests that targeted programmes such as the cash in-
kind scheme have the potential to significantly increase investment in human capital. Skoufias et al.,
(2001) found that conditional cash transfers under the PROGRESA programme in Mexico resulted in
significant increases in the enrolment of boys and girls. This was accompanied by significant reductions
of boys and girls in the labour market.
Section 6: Conclusion and Policy Implications
In light of the results discussed in the section above we analyse policy implications and sum up key
findings from the study here. The theoretical framework based on Becker’s Woytinsky lecture suggested
that climatic shocks can have either positive, negative or no impact on educational and health outcomes.
Our analysis of four immensely different countries with different economic and social backgrounds
reveals that this is indeed the case. Tables 8 and 9 provide the summary of climatic shocks impact for
droughts and floods respectively. It becomes obvious that sweeping generalisations about the impact of
climatic shocks are unwarranted. The impact of climatic shocks depends on a host of coping mechanisms,
particularly for individually reported household shocks.
Table 8: Summary Table of Drought Impacts on Child Outcomes
COUNTRY
CHILD OUTCOMES ETHIOPIA INDIA PERU VIETNAM
ENROLMENT
PPVT NEGATIVE
NEGATIVE
CLOZE
MATH NEGATIVE
BFA-Z
NEGATIVE
HFA-Z NEGATIVE
NEGATIVE
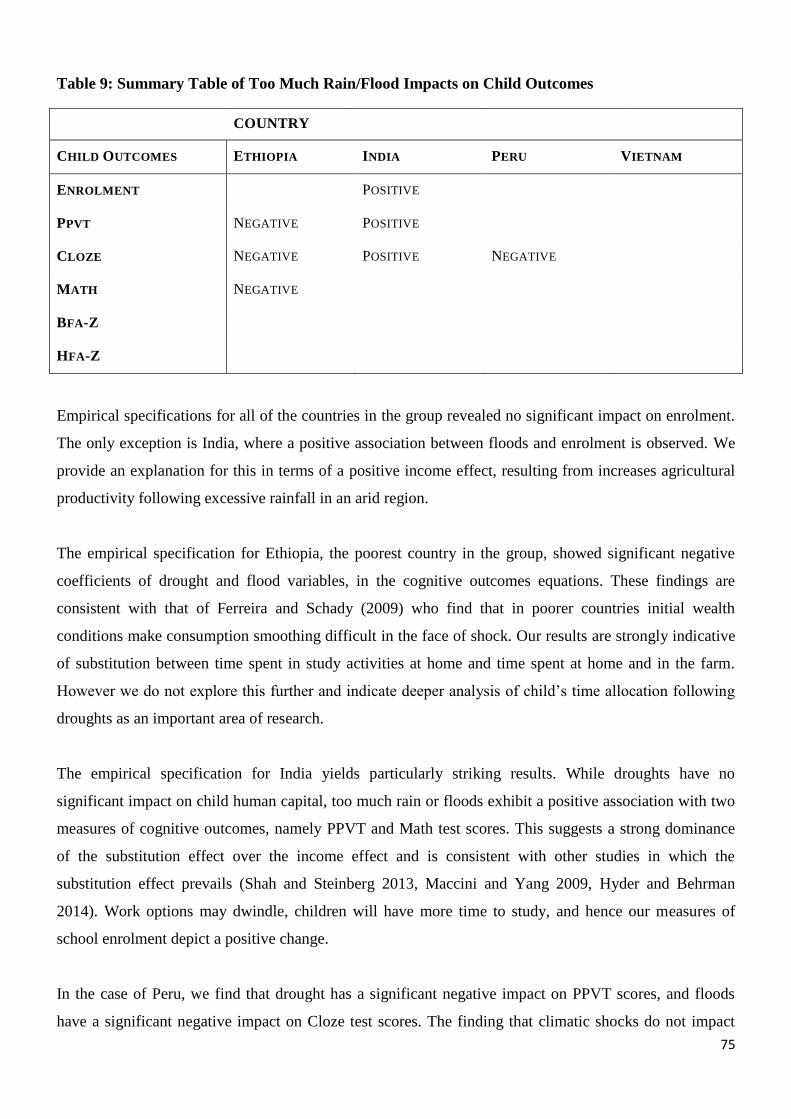
75
Table 9: Summary Table of Too Much Rain/Flood Impacts on Child Outcomes
COUNTRY
CHILD OUTCOMES ETHIOPIA INDIA PERU VIETNAM
ENROLMENT
POSITIVE
PPVT NEGATIVE POSITIVE
CLOZE NEGATIVE POSITIVE NEGATIVE
MATH NEGATIVE
BFA-Z
HFA-Z
Empirical specifications for all of the countries in the group revealed no significant impact on enrolment.
The only exception is India, where a positive association between floods and enrolment is observed. We
provide an explanation for this in terms of a positive income effect, resulting from increases agricultural
productivity following excessive rainfall in an arid region.
The empirical specification for Ethiopia, the poorest country in the group, showed significant negative
coefficients of drought and flood variables, in the cognitive outcomes equations. These findings are
consistent with that of Ferreira and Schady (2009) who find that in poorer countries initial wealth
conditions make consumption smoothing difficult in the face of shock. Our results are strongly indicative
of substitution between time spent in study activities at home and time spent at home and in the farm.
However we do not explore this further and indicate deeper analysis of child’s time allocation following
droughts as an important area of research.
The empirical specification for India yields particularly striking results. While droughts have no
significant impact on child human capital, too much rain or floods exhibit a positive association with two
measures of cognitive outcomes, namely PPVT and Math test scores. This suggests a strong dominance
of the substitution effect over the income effect and is consistent with other studies in which the
substitution effect prevails (Shah and Steinberg 2013, Maccini and Yang 2009, Hyder and Behrman
2014). Work options may dwindle, children will have more time to study, and hence our measures of
school enrolment depict a positive change.
In the case of Peru, we find that drought has a significant negative impact on PPVT scores, and floods
have a significant negative impact on Cloze test scores. The finding that climatic shocks do not impact

76
different psychometric outcomes negatively (or positively) across the board seems somewhat perplexing.
We only point out that each psychometric outcome is different from the others and measures different
aspects of cognitive abilities, tests of reading comprehension are necessarily different from maths test.
We leave further analysis of these differences to studies in psychology and psychometrics.
In the case of Vietnam, we observe no significant impacts on either enrolment or any indicators of
cognition. This is indicative of substitution and income effects balancing each other out on average. In
more advanced economies with better functioning credit markets borrowing constraints are less stringent,
and households can thus smooth consumption without children having to resort to substitution away from
school and studying to work either in the farm or inside the home (Jacoby, 2004).
Our empirical analysis shows that the relationship between health indicators and climatic shocks is less
than clear cut. We found significant negative impacts of drought on HFA z-scores in Vietnam and
Ethiopia. For the BFA z-score specification we found a significant coefficient estimate only in the case of
Peru. We found no prior studies on adolescents with which we could compare our results. The
insignificant coefficient estimates may be an indication of the substitution and income effect of the
adverse climatic shock balancing each other. However this may not necessarily be the case. More
accurate specifications of health outcomes utilize panel data with past values of anthropometric indicators
appearing as explanatory variables. We admit this important caveat, when limiting ourselves to an
analysis of cross-sectional data at one point in time only.
The various controls that we employed in our specifications reveal significant differences across genders
with boys performing better at cognitive tests, having lower BFA z-scores and higher HFA z-scores than
girls. With respect to parental characteristics secondary and higher parental education plays a key role in
determining investment in human capital. Father being alive also had a significant coefficient estimate in
the probit enrolment regression, but not in any other specifications. Mother being alive was insignificant.
This result is consistent with prior literature. According to Cas et al. (2011) parental death has a
significant negative impact on adolescents’ education; however maternal death does impacts time
allocation rather than schooling outcomes. Yamano and Jayne (2004) find that the negative impact of
parental death is only observed in poorer households.
As expected, household wealth also has a large and significant impact on enrolment and cognitive scores
in almost all our specifications. Share cropping, ownership or renting of farm land did not seem to have
any significant impact on educational and health outcomes in Indian and Ethiopia. Household size is a
significant determinant of child education and health outcomes in some, but not all specifications.

77
Differences in urban and rural areas were also observed; in the majority of specifications educational
outcomes were significantly higher in urban areas. Regional differences also appeared as significant
explanatory variables.
We also examined the role of availability of credit and the efficacy of country-specific aid programs in
buffering the impact of shocks. In the case of Ethiopia our analysis indicated that households that
received loans or credit did not exhibit any improvements in enrolment, cognition or health indicators.
However, the variable for receiving credit was highly significant in the case of Peru. The difference can
be understood in the context of how developed credit markets are in each of these countries. In Ethiopia,
where credit markets are poorly developed, loans received were too small to effectively act as a buffer to
shocks. In contrast, in Peru, where credit markets are far more advanced (as documented in literature)
access to credit played a significant buffering role.
With respect to the role of specific aid programs in buffering the impact of shocks on human capital
development, some very important policy results emerge. Ineffective targeting of the poorest and most
deserving sections in society, poor implementation and tension between central and local bodies are major
factors behind ineffectiveness of aid programs. In India corruption emerges as a major issue, which
accounts for the negative impact of the PDS on school enrolment. In the case of NREGS scheme in India
and the PSNP programme in Ethiopia which guarantee pay for employment, we find that the reduction in
parental time allocation has a negative impact on child outcomes. For instance older children may have to
spend time looking after younger siblings at home. This effect competes with the positive income effect
resulting from guaranteed employment. In order to ensure that NREGS and PSNP have the positive
buffering role (that is stated as part of their objectives) these negative impacts of reduced parental time
allocation need to be taken into account. Our analysis also indicates that targeted programs like the cash
or in kind transfer programme for schooling in Vietnam have a positive buffering impact. Thus design of
programs should enable direct targeting for maximum efficacy.
In sum, we find that broad categorization of the impact of climate shocks ignores heterogeneity and
coping strategies across children and households. Theory and empirics both point out to the existence of
positive and negative outcomes associated with climate shocks. Our results find different positive and
negative impacts on educational and health measures in the group of countries considered. On the policy
front the importance of improving access to credit, effective targeting and reducing the disincentive
effects of employment guarantee schemes is emphasized.

viii
References
(IPCC), Intergovernmental Panel of Climate Change. "Contribution of Working Groups I, II and III to the
Fourth Assessment Report of the Intergovernmental Panel on Climate Change." Edited by R.K
Pachauri and A Reisinger. Geneva, 2007. 104.
(MoA), Ministry of Agriculture. Productive Safety Net Programme: Programme Implementation Manual.
Addis Ababa: 2010.
(MoFED), Ministry of Finance and Economic Devleopment. Development and Poverty in Ethiopia
1995/96-2010/11. Federal Democratic Republic of Ethiopia. Addis Ababa. (2013): 111 pages.
(UNDP), United Nations Development Programme. "Sustaining Human Progress: Reducing
Vulnerabilities and Building Resilience." Human Development Report 2014, 2014.
(UNDP), United Nations Devlopment Program. "Fighting Climate Change: Human Solidarity in a
Divided World." Human Development Report 2007/2008, New York, 2007.
(UNICEF), United Nations Children's Fund. "Progress of Children: A world fit for children, statistical
review." United Nations, December 2007.
Alderman, Harold, Hans Hoogeveen, and Mariacristina Rossi. "Preschool Nutrition and Subsequent
Schooling Attainment: Longitudinal Evidence from Tanzania." Economic Development and
Cutural Change (University of Chicago Press) 57, no. 2 (2009): 239-260.
Alderman, Harold, John Hoddinott, and Bill Kinsey. "Long-term Consequences of Early Childhood
Malnutrition." Oxford Economic Papers 58, no. 3 (2006): 450-474.
Ali, Daniel Ayalew, and Klaus Deininger. "Causes and implications of credit rationing in rural Ethiopia:
The importance of spatial variation." World Bank Policy Research Working Paper. no. 6096.
2012.
Aradhana, Sharma. "The Impact of a Macroeconomic Crises on Child Schooling Outcomes in Indonesia."
Oxford: Centre for the Study of African Economies (CSAE) and Department of Economics,
Unversity of Oxford, 2014.
Baez, Javier, and Indira Santos. "Children's Vulnerability to Shocks: Hurricane Mitch in Nicaragua as a
Natural Experiment." Paper presented on seminar ar Maxwell School of Citizenship and Public
Affairs. Syracuse Unversity and Kennedy School of Govrnment Harvard University, 2007.
Baez, Javier, Angel de la Fuente, and Indira Santos. "Do Natural Disasters Affect Human Capital? An
Assessment based on existing Empiral Evidence." IZA Discussion Paper. no. 5164. Bonn,
Germany: Institute for the Study of Labour/IZA, 2009.
Baloch, Asma Hyder, and Jere R Behrman. "Climatic Shocks and Child Human Capital: Evidence from
Ethiopia ." october 13, 2014.

ix
Becker, Gary S. "Human Capital and the Personal Distribution of Income: An Analytical Approach."
Human Capital. New York: NBER, 1975. 94-117.
Beegle, Kathleen, Rajeev H. Dehejia, and Roberta Gatti. "Child labour and agricultural shocks." Journal
of Development Economics 81, no. 1 (2006): 80-96.
Behrman, Jere R., Anil B. Deolalikar, and Pranee Tinakorn. "What Really Happened to Thai Wage Rates
During the 1997 Financial Crisis?" Recent Financial Crisises: Analysis, Challenges and
Implications,. Edited by Lawrence R. Klein and Tayyeb Shabbir. Northhampton, MA: Edward
Elgar Publishing, Inc., 2007. 221-39.
Behrman, Jere R., John Hoddinott, John A. Maluccio, Erica Soler-Hampejsek, Emily L. Behrman,
Reynaldo Martorell, Manuel Ramirez-Zea, and Aryeh D. Stein. "What determines adult cognitive
skills? Impacts of pre-schooling, schooling and post-schooling experiences in Guatemala." (2006).
Berhane, Guush, Mehari Hiluf Abav, and Tassew Woldehanna. "Childhood Shocks, Safety Nets and
Congnitive Skills: Panel Data Evidence from Rural Ethopia." 2015.
Binder, Melissa. "Schooling Indicators during Mexico's 'Lost Decade'." Economics of Education Review
18, no. 2 (1999): 183-199.
Black, Sandra E., and Kenneth L. Sokoloff. "Long-Term Trends in Schooling: The Rise and Decline of
Public Education in the Unied States." Edited by Eric Hanushek and Fins Welch. Handboook of
the Economics of Education (Elsevier) 1 (2006).
Boyden, Jo, Brigitta Ling, and William Myers. What Works for Working Children. Stockholm: Radda
Barnen, 1998.
Broomhall, David E., and Thomas G. Johnson. "Economic Factors that Influence Educational
Performance in Rural Schools." American Journal of Agricultural Economics 76, no. 3 (1994):
557-567.
Broussard, Nzinga H, Stefan Dercon, and Rohini Somanathan. "Aid and Agency in Africa: Explaining
food Disbursements across Ethiopian Households, 1994-2004." Jounral of Development
Economics, no. 108 (2014): 128-137.
Broussard, Nzinga H., Stefan Dercon, and Rohini Somanathan. "Aid and agency in Africa: Explaining
food disbursements across Ethiopian households, 1994–2004." Journal of Development
Economics 108 (2014): 128-137.
Bustelo, Monserrat, Mary Arends-Kuenning, and Leonardo Lucchetti. "Persistent impact of natural
disasters on child nutrition and schooling: Evidence from the 1999 Colombian earthquake." 2012.
Campbell, Johnathan M. "Review of the Peabody Picture Vocabulary Test." Journal of
Psychoeducational Assessment - Third Edition 16, no. 4 (1998): 334-338.
Campbell, Jonathan M., Stephen K. Bell, and Lori K. Keith. "Concurrent validity of the peabody picture
vocabulary test-as an intelligence and achievement screener for low SES African American
children." Assessment. Vol. 8. 2001. 85-94.

x
Cas, Ava, Elizabeth Frankenberg, Wayan Suriastini, and Duncan Thomas. The Impact of Parental Death
on Child Well-being: Evidnece from the Indian Ocean Tsunami. no. w19357. National Bureau of
Economic Research, 2013.
Cavallo, Eduardo, Sebastian Galliani, Ilan Noy, and Juan Pantano. "Catastrophic Natural Disasters and
Economic Growth." IDB Working Paper Series. no. IDB-WP-138. Inter-American Development
Bank, 2010.
Chay, Kenneth Y, and Michael Greenstone. "The Impact of Air Pollution on Infant Mortality: Evidence
from Geographic Variation in Pollution Shocks Induced by a Recession." Quarterly Journal of
Economics 118, no. 3 (2003): 1121-67.
Colmer, Jonathan. "Climate Variability, Child Labour and Schooling: Evidence on the Intensive and
Extensive Margin." 2013.
Cueto, Santiago, and Juan Leon. "Psychometric Characteristics of Cognitive Development and
Achivement Instruments in Round 3 of Young Lives." Young Lives: Technical Note. no. 25. 2012.
Cueto, Santiago, Juan Leon, Gabriela Guerrero, and Ismael Munoz. "Psychometric characteristics of
Cognitive Development and Achievement Instruments in Round 2 of Young Lives." Young Lives:
Technical Note. no. 15. 2009.
Cutler, David M., Felicia Knaul, Rafael Lozano, Oscar Méndez, and Beatriz Zurita. "Financial crisis,
health outcomes and ageing: Mexico in the 1980s and 1990s." Journal of Public Economics 84,
no. 2 (2002): 279-303.
Datar, Ashlesha, Jenny Lui, Sebastian Linnemayr, and Chad Stetcher. "The Impact of Natural Disasters
on Child Health and Investments in Rural India." Social Science and Medicine 76 (2013): 83-91.
Deaton, Angus S., and Christina Paxson. "Mortality, education, income, and inequality among American
cohorts." In Themes in the Economics of Aging, pp. 129-170. University of Chicago Press, 2001.
Dehejia, Rajeev Harsha, and Adriana Lleras-Muney. Booms, Busts, and Babies' Health. National Bureau
of Economics Research, 2004.
Dendir, Siefe. "Children's Cogntive Ability, Schooling and Work: Evidence from Ethopia." International
Journal of Educational Development 38 (2014): 22-36.
Dillon, Andrew. "Child Labour and Schooling Responses to Production and Health Shocks in Northern
Maii." IFPRI Discussion Paper. no. 00756. Washington DC: International Food Policy Research
Institute, 2008.
Dornan, Paul, and Martin Woodhead. "How Inequalities Develop Through Childhood: Life Course
Evidence from the Young Lives Cohort Study." UNICEF Innocenti Research Centre, Young
Lives, 2015.
Dornan, Paul, Maria Jose Oganda Portela, and Kirrilly Pells. "Climate Shocks." Food and Nutrition
Security: Evidence from the Young Lives Birth Cohort Study, Background paper for Oxfam. 2014.

xi
Dung, Nguyen Tien. "Shocks, Borrowing Constraints and Schooling in Rural Vietnam." Young Lives
Working Paper. Vol. 94. Oxford: Young Lives, Department of International Development at the
University of Oxford, 2013.
Dunn, Lloyd M., and Leota M. Dunn. "Examiners Manual for the PPVT-III. Form IIIA and IIIB." AGS:
Circle Pines. Minnesota, 1997.
Dunn, Lloyd M., Padilla D. Lugo, and Leota M. Dunn. "Manual del Examinador para el Test de
Vocabulario en Imagenes Peabody: Adapticon Hispanoamericana (Peabody Picture Vocabulary
Test: Hispanic-American Adaptation." 1986.
Dureya, Suzanne, David Lam, and Deborah Levison. "Effects of Economic Shocks on Children's
Employement and Schooling in Brazil." Journal of Development Economics 84, no. 1 (2007):
188-214.
Duryea, Suzanne, and Mary Arends Kuenning. "School Attendance, Child Labour and Local Labour
Market Fluctuations in Urban Brazil." World Development 31, no. 7 (2003): 1165-1178.
Duryea, Suzanne, David Lam , and Deborah Levison. "Effects of Economic Shocks on Children's
Employement and Schooling in Brazil." Journal of Development Economics 84, no. 1 (2007):
188-214.
Duryea, Suzanne, Jere R. Behrman, and Miguel Székely. "Schooling Investments and Aggregate
Conditions: A Household Survey-Based Approach for Latin America and the Caribbean." IDB
Publications Working Papers. no. 6457. Inter-American Development Bank., 1999.
Escobal, Javier, and Eva Flores. "An Assessment of the Young Lives Sampling Approach in Peru." Young
Lives: Technical Note. no. 3. 2008.
Escobal, Javier, Jaime Saavedra, Pablo Suárez, Sharon Huttly, Mary Penny, Claudio Lanata, and Eliana
Villar. "The Interaction of Public Assets, Private Assets, and Community Characteristics and its
effect of Early Childhood Height-for-Age in Peru." Young Lives: Working Paper. no. 14. 2005.
Escobal, Javier, Jaime Saavedra, and Pablo Suarez. "Economic Shocks and Changes in School
Attendence Levels and Education Expenditure in Peru." MPRA Paper. Vol. 56481. Germany:
University Library of Munich, 2005.
Ferreira, Francisco HG, and Nobert Schady. "Aggregate Economic Shocks, Child Schooling and Child
Health." World Bank Research Observer 24, no. 2 (2008): 147-181.
Foster, Andrew. "Prices, Credit Markets, and Child Growth in Low-Income Rural Areas." Economic
Journal 105 (1995): 551-570.
Francke, Pedro. "Peru’s Comprehensive Health Insurance and New Challenges for Universal Coverage."
Washington DC: World Bank, 2013.
Galab, Shaik, and Ingo Outes-Leon. "Siblings, Schooling, Work and Drought." Young Lives: Working
Paper. no. 73. 2011.

xii
Gilligan, Daniel O, John Hoddinott, and Alemayehu Taffesse Taffesse. "The Impact of Ethopia's
Productive Safety Net Programme and its Linkages." The Journal of Development Studies 45, no.
10 (2009): 1684-106.
Goldin, Claudia. "Egalitarianism and the Returns to Education during the Great Transformation of
American Education." Journal of Political Economy 107, no. S6 (1999): S65-S94.
Government of Ethiopia. "Productive Safety Net Programme: Summary of the Public Works Review
Findings for SNNPR, Oromia, Amhara and Tigray Regions." Addis Ababa: Ministry of
Agriculture and Rural Development, 2006.
Guarcello, Lorenzo, Fabrizia Mealli, and Furio C. Rosati. "Household Vulnerability and Child Labour:
The Effect of Shocks, Credit Rationing and Insurance." Manuscript, Innocenti Research Center,
UNICEF, 2002.
Gubrium, Erika K, Sony Pellissery, and Ivar Lødem. The Shame of It: Global perspectives on Anti-
Poverty Policies. Policy Press, 2013.
Heckman, James J. "A life-cycle model of earnings, learning, and consumption." Journal of political
economy (1976): S9-S44.
Hoddinott, John, and Bill Kinsey. "Child Growth iin the time of Drought." Oxford Bulletin of Economics
and Statistics 63 (2001): 409-436.
Hoddinott, John, and Stefan Dercon. "Health, Shocks and Poverty Persistence." Discussion Paper
2003/08. Helsinki: World Institute for the Devlopment Economics Research, United Nations
University, 2003.
Hyder, Asma, and Jere R. Behrman. "Climatic Shocks and Child Human Capital: Evidence from
Ethopia." Jornal of Asian and African Studies, 2014: 1-25.
Islam, Mahnaz, and Anitha Sivasankaran. "How Does Child Labour respond to changes in Adult Work
Opportunities?" Evidence from Nrega: Preliminary Draft. Harvard University, January 1, 2014.
Jacoby, Hanan G. "Borrowing Constraints and Progress through School: Evidence from Peru: ." The
Review of Economics and Statistics, 1994: 151-160.
Jacoby, Hanan G., and Emmanuel Skoufias. "Risk, Financial markets, and Human Capital in a
Developing Country." Review of Economic Studies 64, no. 3 (1999): 311-335.
Jensen, Robert. "Agricultural Volatility and Investments in Children." American Economic Review , 2000
: 399-404.
Kane, Thomas J. "College Entry by Blacks since 19770: The Role of College COsts, Family Background
and the Returns to Education." Journal of Political Economy 102, no. 5 (1994): 878-911.
Kattumuri, Ruth. "Food Security and the Targeted PPublic Distribution System in India." LSE Asia
Research Centre Working Paper. 2011.
Kedir, A, Gamal Ibrahim, and S Torres. "Household-Level Credit Constraints in Urban Ethiopia."
University of Leicester, Nottingham Trent University and Catholic University of Uruguay, 2007.

xiii
Khera, Reetika. "Trends in Diversion of Grain from the Public Distribution System." Economic and
Political Weekly 46, no. 21 (2011): 106-114.
Krishnan, Pramila, and Emanuela Sciubba. "Links and Architecture in Village Networks." Cambridge
Working Papers in Economics. no. 462. Cambridge: University of Cambridge, 2005.
Kumra, Neha. "An Assessment of the Young Lives Sampling Approach in Andhra Pradesh, India." Young
Lives: Technical Note. no. 2. March 2008.
Lacambra, Carmen, Iris Moller, and Tom Spencer. "The Need for an Ecosystem-Inclusive Vulnerability
Index for Coastal Areas in Colombia." Edited by Hans-Georg Bohle and Koko Warner.
Megacities: Resilience and Social Vulnerability (UNU Institutle for Environment and Human
Security (UNU-EHS)), 2008.
Lan , Pham Thi , and Nicola Jones. "Education for All in Vietnam: High Enrolment, But Problems of
Quality Remain." Young Lives Policy Brief 4. Oxford: Young Lives, 2010.
Del Ninno, Carlo, and Mattias Lundberg. "Treading water: the long-term impact of the 1998 flood on
nutrition in Bangladesh." Economics & Human Biology 3, no. 1 (2005): 67-96.
Maccini, Sharon, and Dean Yang. "Under the Weather: Health, Schooling and Economic Consequences
of Early-Life Rainfall." American Economic Review 99, no. 3 (2009): 1006-1026.
Mani, Anandi, Sendhil Mullainathan, Eldar Shafir, and Jiaying Zhao. "Poverty Impedes Congnitive
Function." Science 341, no. 6149 (2013): 976-980.
Mani, Subha, John Hoddinott, and John Strauss. "Determinants of Schooling Outcomes: Empirical
Evidence from Rural Ethiopia." Fordham University, Department of Economics Discussion Paper
2009-03. 2009.
McDermott, Tom. "On Natural Disasters and Economic Development." Trinity College Dublin Journal of
Postgraduate Reserarch 10 (2011): 54-66.
McKenzie, David J. "How do Households Cope with Aggregate Shocks? Evidece from Mexican Peso
Crisis." World Devlopemnt 31, no. 7 (2006): 1179-1199.
McKenzie, David J. "The Consumer Responses to the Mexican Peso Crisis." Economic Development and
Cultural Change 55, no. 1 (2006): 139-172.
Meri, Marcelo C., and Mark R. Thomas. Household Educational Responses to Labour-Market Schocks in
Brazil, 1982-99. 2001.
Miller, Grant, and Piedad Urdinola. "Time vs. Money in child health production: the case of coffee price
fluctuations and child survival in Colombia." Unpublished manuscript, Stanford University. 2007.
Nagavarapu, Sriniketh, and Sheetal Sekhri. "Who is Targeted by India’s Targeted Public Distribution
System?(Preliminary; Under Revision)." July 2011.
Neri, Marcelo, and Mark Thomas. "Household Educational Responses to Labour-Market Shcks in Brazil:
1982-99." unpublished, the World Bank. May 2000.

xiv
Nguyen, Ngoc P. "An Assessment of the Young Lives Sampling Approah in Vietnam." Young Lives:
Technical Note. no. 4. 2008.
Niehaus, Paul, and Antonia Atanassova. "Targeting with Agents , no. 1 (2013): 206-238." American
Economic Journal: Economic Policy 5, no. 1 (2013): 206-238.
Nieuwenhuys, Olga. Children's Lifeworlds: Gender, Welfare annd Labour in the Developing World.
London and New York: Routledge, 1994.
Orazem, Peter. "Schooling in Developing Countries: The Roles of Supply, Demand, and Government
Policy, in Schultz, Paul and Strauss, Johnn." Handbook of Development Economics 4 (2007).
Orkin, Kate, Workeneh A Yadete, and Martin Woodhead. "Deliveriing Quality Early Learning in Low-
Resource Settings: Progress and Challenges in Ethiopia." 2012.
Outes-Leon, Ingo, and Alan Sanchez. "An Assessment of the Young Lives Sampling Approach in
Ethopia." Young Lives Technical Note. Vol. 1. 2008.
Parivartan. "Report of Jan Sunwai on Public Distribution System (TPDS)." Discussion Paper, 2004.
Pellissery, Sony, and Leemamol Mathew. The Shame of It: Global Perspectives. Edited by E Chase and G
Bantebeya Kyyomuhendo. Oxford: Oxford Univeristy Press, 2014.
PEO. Performance Evaluation of Targeted Public Distribution System (TPDS) . Discussion Paper,
Programme Evaluation Organisation, Planning Commission, Government of India., 2005.
Government of Andhra Pradesh. "Socio-Economic Survey 2009–10." Hyderabad: State Planning
Department, 2010.
Prado C., Alfaiate Jorge. "Mozambique and Natural Disasters: Human Captal under Threat." MPRA
Paper, no. 18189 (2009).
Radharkrishna, Rokkam, and Kalanidhi Subbarao. India's Public Distribution System: A National and
International Perspective. Vol. 380. World Bank Publications, 1997.
"Report for Selected Countries and Subjects, India." World Economic Outlook Database, International
Monetary Fund, 2015.
Rocha, Rudi, and Rodrigo Soares. "Water Scarcity and Birth Outcomes in the Brazilian Semi Arid." IZA
Discussion Paper (Bonn, Germany: Institute for the Study of Labour/IZA), no. 6673 (2012).
Rossel , Deustua J. "The Impact of Climatic Shocks on Child Nutrition in Peru." Young Lives, Student
Paper. Oxford University, 2008.
Schady, Nobert. "Do Macroconomic Crises always slw Human Capital Accumulation?" World Bank
Economic Review 18, no. 2 (2004): 131-154.
Schady, Norbert. "Parents’ Education, Mothers’ Vocabulary, and Cognitive Development in Early
Childhood: Longitudinal Evidence from Ecuador." American Journal of Public Health 101, no. 12
(2011): 2299-2307.

xv
Serna, Jessa M. "Drought Assessment Northern Eastern Kenya." Save the Children, 2011.
Shah, Manisha, and Bryce M. Steinberg. Drought of opportunities: contemporaneous and long term
impacts of rainfall shocks on human capital. No. w19140. National Bureau of Economic
Research, 2013.
Singh, Madhu B., Ranjana Fotedar, J. Lakshminarayana, and P.K Anad. "Studies on the Nutritional Status
of Children Aged 0-5 Years in a Drought-Affected Desert Area of Western Rajasthan." Public
Health Nutrition 9, no. 8 (2005): 961-967.
Skoufias, Emmanuel, and Katja Vinha. "Growing Precious Resources: Climate Variability and Child
height in Rural Mexico." The World Bank, 2012.
Skoufias, Emmanuel, and Katja Vinha. "Climate Varaibility and Child Height in Rural Mexico."
Economics and Human Biology 10, no. 1 (2012): 54-73.
Skoufias, Emmanuel, Parker, Susan W, Behrman Jere R and Pessino, Carola "Conditional cash transfers
and their impact on child work and schooling: Evidence from the progresa program in mexico
Economia (2001): 45-96.
Stein, Aryeh D., Huiman X. Barnhart, Morgen Hickey, Usha Ramakrishnan, Dirk G. Schroeder, and
Reynaldo Martorell. "Prospective Study of Protein-Energy Supplementation Early in Life and of
Growth in the Subsequent Generation in Guatemala." The American Journal of Clinical Nutrition
78, no. 1 (2003): 162-167.
Subbarao, Kalanidhi, Carlo del Ninno, Colin Andrews, and Claudia Rodríguez-Alas. "Public Works as a
Safety Net: Design, Evidence and Implementation." 2012.
Thai, Thuan Q., and Evangelos M. Falaris. "Child Schooling, Child Health and Rainfall Shocks: Evidence
from Rural Vietnam." MPIDR Workinng Paper. no. WP-2011-011. 2011.
The Economist. "The Millennium Development Goals." September 25, 2010. 31-34.
Thomas, Duncan, Kathleen Beegle, Elizabeth Frankenberg, Bondan Sikoki, John Strauss, and Graciela
Teruel. "Education in a Crisis." Journal of Development economics 74, no. 1 (2004): 53-85.
Tiwari, Sailesh, and Hanan G. Jacoby. "Monsoon Babies: Rainfall Shocks and Child Nutrition in Nepal."
World Bank Policy Research Working Paper. no. 6395. 2013.
Uppal, Vinayak. "Is the NREGS a Safety Net for Children?" Studying the Access to the National Rural
Employment Guarantee Scheme for Young Lives Families, and its Impact on Child Outcomes in
Andhra Pradesh, 2009.
Vreyer, Phillipe de, Nathalie Guilbert, and Sandrine Mesple-Somps. "Impact of Natural Disasters on
Education Outcomes: Evidence from the 1987-89 Locust Plague in Mali." Jounal of African
Economies, 2014.
Wagstaff, Adam. "Time Series Analysis of the Relationship between Unemployement and Morality: A
Survey of Econometric Critiques and Relications of Brenner's Studies." Social Science and
Medicine 21, no. 9 (1985): 985-996.

xvi
Woldehanna, Tassew, Alemu Mekonnen, and Nicola Jones. "Education Choices in Ethiopia: What
determines whether Poor Households send their Children to School." Ethiopian Journal of
Economics 17, no. 1 (2009): 43-80.
Woldehanna, Tassew, Nicola Jones, and Bekele Tefer. "The Invisibility of Children's Paid and Unpaid
Work Implications for Ethiopia's national poverty reduction policy." Childhood. Vol. 15. 2008.
177-201.
World Bank. "Development and Climate Change." World Development Report 2010:, Washington DC,
2010.
World Bank. "India – New Global Poverty Estimates." 2010.
World Bank. "Progress of Children: A World Fit for Children." Statistical Review, 2007.
World Bank. Malawi Poverty and Vulnerability Assessment : Investing in Our Future, Synthesis Report.
Washington, DC. (2007). https://openknowledge.worldbank.org/handle/10986/7557
World Health Organisation. Training Course on Child Growth Assessment. Geneva, WHO, 2008.
World Health Organisation Working Group. Use and interpretation of anthropometric indicators of
nutritional status. Bulletin of the World Health Organisation 64. (1986): 929– 941.
Yamano , Takashi, Harold Alderman, and Luc Christiaensen. "Child Growth, Shocks, and Food Aid in
Rural Ethiopia." American Journal of Agricultural Economics 87, no. 2 (2005): 273-288.
Yamano, Takashi, and Thomas S Jayne. "Measuring the Impacts of Working-Age Adult Mortality on
Small Scale Farm Households in Kenya." Vol. 32. 2004. 91-119.
Yamano, Takashi, Harold Alderman, and Luc Christiaensen. "Child Growth, Shocks and Food Aid in
Rural Ethopia." American Journal of Agricultural Economics 87, no. 2 (2005): 273-288.
Yamauchi, Futoshi, Yisehac Yohannes, and Agnes R. Quisumbing. "Natural Disasters, Self-Insurance
and Human Capital Investment: Evidence from Bangladesh, Ethiopia and Malawi." World Bank
Policy Research Working Paper Series. 2009.