Impact of Climate Change on Natural Ecosystems & Forests … · 2013-06-07 · Impact of Climate...
21
G. B. Pant Institute of Himalayan Environment & Development Kosi-Katarmal, Almora, Uttarakhand GBPIHED Impact of Climate Change on Natural Ecosystems & Forests in the North-Western Himalaya (Jammu & Kashmir, Himachal Pradesh and Uttarakhand) L. M. S. Palni
Transcript of Impact of Climate Change on Natural Ecosystems & Forests … · 2013-06-07 · Impact of Climate...

G. B. Pant Institute of Himalayan Environment & DevelopmentKosi-Katarmal, Almora, Uttarakhand
GBPIHED
Impact of Climate Change on
Natural Ecosystems & Forests in the North-Western Himalaya
(Jammu & Kashmir, Himachal Pradesh and Uttarakhand)
L. M. S. Palni

Reporting
AreaGBPIHED
� A large part of the study area is covered by snow-clad peaks
� Glaciers in the higher Himalaya
� Dense forest cover in mid-Himalaya
� Thin and dispersed human population as compared to the national figures
� The population growth rate (average ~23%) is higher than the national average (21.35%) during 1991-2001
Features:

ParameterJammu &
Kashmir
Himachal
PradeshUttarakhand IHR India
Geographical Area (km2) 222,236 55,673 53,483 537,430 3,287,263
Demographic Parameters
Human Population
(Persons)10069917 6077248 8479562 39,628,311 1,026,640,181
Percent contribution to
the total population of the
country
0.98 0.59 0.83 4.08 100.00
Decadal Growth rate
(1991-2001)30.46 18 20 25.43 21.35
Annual average
exponential growth rate
(1961-2001)
2.6 2 2 2.47 2.12
Sex ratio (females/ 1000
males)900 970 964 940 933
Population density (km-1) 99 109 159 74 324
General Profile ...
Source: Census, 2001
GBPIHED
GBPIHED
ParameterJammu &
Kashmir
Himachal
PradeshUttarakhand
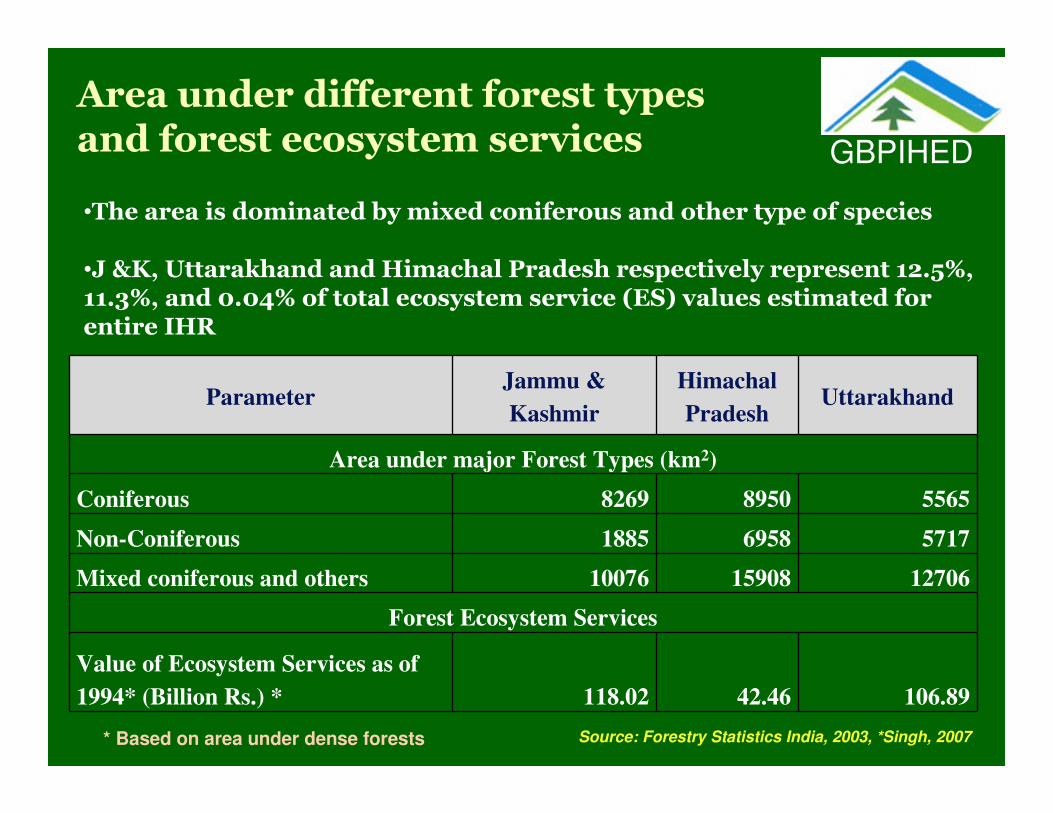
Area under major Forest Types (km2)
Coniferous 8269 8950 5565
Non-Coniferous 1885 6958 5717
Mixed coniferous and others 10076 15908 12706
Forest Ecosystem Services
Value of Ecosystem Services as of
1994* (Billion Rs.) * 118.02 42.46 106.89
Area under different forest types and forest ecosystem services
Source: Forestry Statistics India, 2003, *Singh, 2007
•The area is dominated by mixed coniferous and other type of species
•J &K, Uttarakhand and Himachal Pradesh respectively represent 12.5%, 11.3%, and 0.04% of total ecosystem service (ES) values estimated for entire IHR
* Based on area under dense forests

GBPIHED
Changing Climatic Patterns…
• Decreasing trend of annual rainfall (-29.7 to -2.1 cm/100 years) has been observed at Srinagar, Shimla, Musoorie, Mukteshwar and Joshimath whereas increasing trend at Dehradun, Pauri, Nainital, Almora & Pithoragarh (3.8 to 28.7 cm/100 years) has been observed in last century (Borgaonkar et al. 1998)
• On seasonal scale, increasing trend of winter rainfall (1964-2006) & summer rainfall (1938-2006), whereas decreasing trend of monsoon rainfall (1960 onwards) has been observed in western Himalaya (Sontakke et al. 2008)
• Decrease of snowfall and reduction in effective duration of winter has been observed in Pir-Panjal Himalayan ranges (Bhutiyani et al., 2009).

GBPIHED
• Trends of temperature are not uniform over the NWH region and annual temperature has risen by 1.6 oC in the last century with winter warming (Bhutiyani et al. 2007)
• Increasing trend of temperature in post-monsoon & winter and decreasing trend in monsoon has been observed for Srinagar, Shimla, Musoorie, Dehradun & Mukteshwar, whereas Leh has experienced warming during last 100 years (Borgaonkar et al. 1998)
• Ring-width chronology prepared from Lahul-Spiti region has indicated warming in late 20th century mean summer temperature in the Himalayan region (Yadav, 2009)
Changing Climatic Patterns…

GBPIHEDName of the
Glacier
State Period of
observation
Trend Avg. retreat
rate (m/yr)
Reference
Gangotri Uttarakhand 1935-71
1971-2004
2004-2005
Retreating
--do--
--do--
26.50
17.15
12.10
Bali et. al, 2009
--do--
Kumar et. al,
2008
Pindari Uttarakhand 1845-1906
1906-1958
1958-1996
1966-2007
Retreating
--do--
--do--
--do--
26.23
20.0
7.62
6.39
Bali et. al, 2009
Dokriani Uttarakhand 1962–95 Retreating 16.67 Dobhal, et al.,
2004
Durung
Drung
Jammu & Kashmir 2004-07 No Change - Ganjoo, 2010
Kangriz Jammu & Kashmir 1913-2007 No Change - Ganjoo, 2010
Siachin Jammu & Kashmir 1862-1909
1909-1929
1929-1958
1958-1985
1985-2004
2004-2005
Advancing
Retreating
Retreating
No Change
Retreating
No change
15.42
2.5
14
-
3
-
Ganjoo, 2010
Retreating Pattern of Himalayan Glaciers

GBPIHED
• Most of the glaciers in western Himalaya are receding (expect a few in J & K state, which do not show any change or are advancing) However, the rate of recession of many large glaciers (Siachin and Gangotri) has slowed down over past few decades
• In Ladakh, Zanskar and Great Himalayan ranges of Jammu & Kashmir, during last three decades most of the glaciers are receding with glacier volume change ranges between 3.6-97 % with majority of the glaciers showing 17-25% degradation
• The glaciers of the Nubra valley of Jammu & Kashmir (houses 114 small sized glaciers varying between less than 5 km to 5-10 km in length) do not show much change in their length and area during the period 1989-2001
• The variable rates of recession in different valleys indicate the influence of micro-climatic variability
1999
2004
2007
Retreating Pattern of Himalayan Glaciers
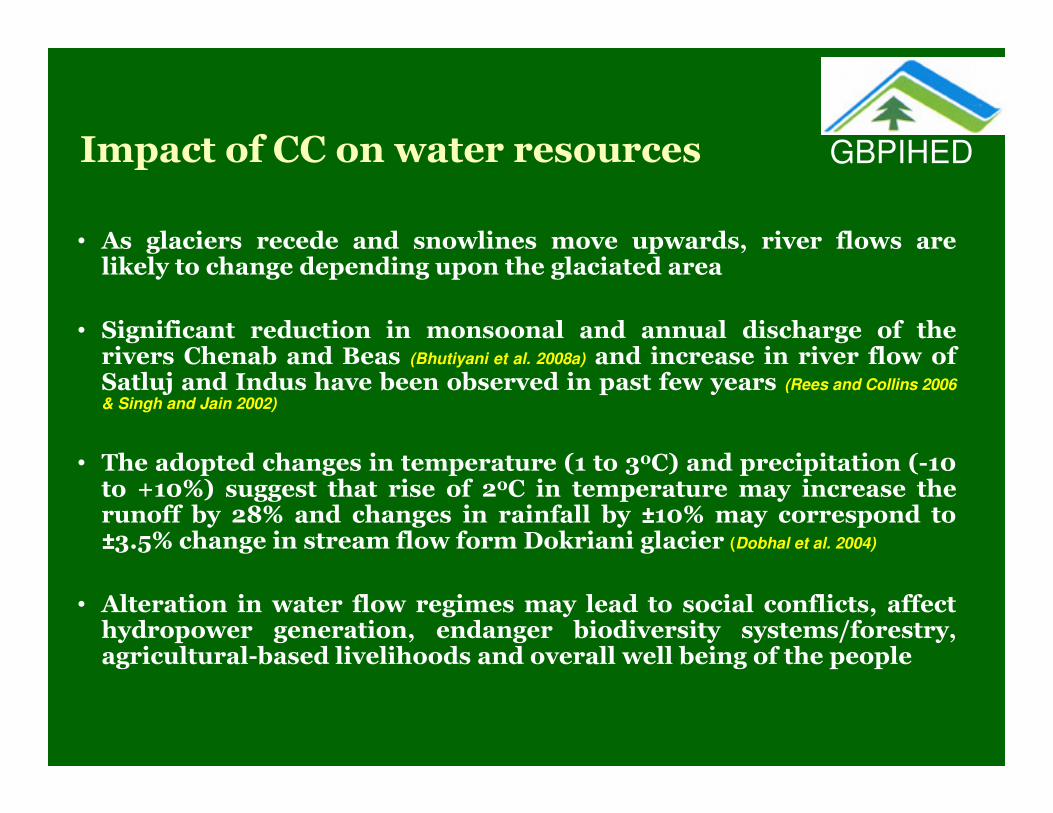
• As glaciers recede and snowlines move upwards, river flows are likely to change depending upon the glaciated area
• Significant reduction in monsoonal and annual discharge of the rivers Chenab and Beas (Bhutiyani et al. 2008a) and increase in river flow of Satluj and Indus have been observed in past few years (Rees and Collins 2006 & Singh and Jain 2002)
• The adopted changes in temperature (1 to 30C) and precipitation (-10 to +10%) suggest that rise of 20C in temperature may increase the runoff by 28% and changes in rainfall by ±10% may correspond to ±3.5% change in stream flow form Dokriani glacier (Dobhal et al. 2004)
• Alteration in water flow regimes may lead to social conflicts, affect hydropower generation, endanger biodiversity systems/forestry, agricultural-based livelihoods and overall well being of the people
Impact of CC on water resources GBPIHED

Biological Responses to CC GBPIHED
• Phenology
• Endemics
• PAs
• Species – community pattern
• Alien/invasive
• Microbes
• Retreat – replacements (?)
GBPIHED
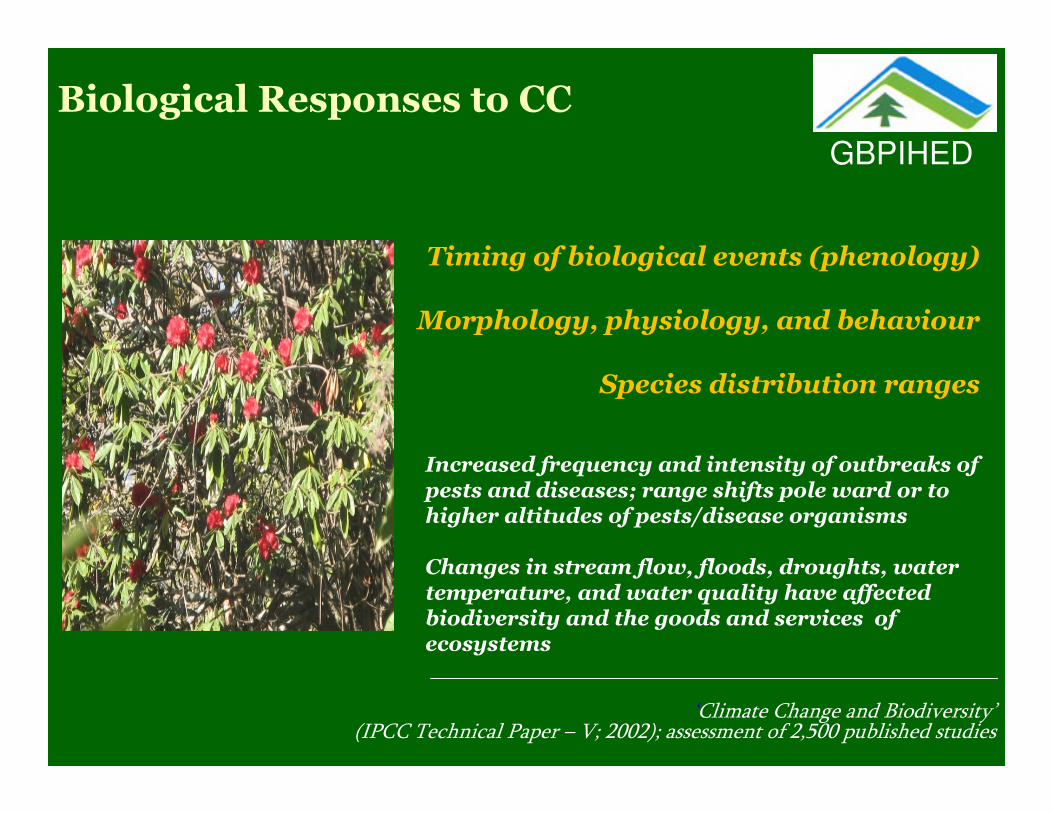
Biological Responses to CC
Timing of biological events (phenology)
Morphology, physiology, and behaviour
Species distribution ranges
Increased frequency and intensity of outbreaks of pests and diseases; range shifts pole ward or to higher altitudes of pests/disease organisms
Changes in stream flow, floods, droughts, water temperature, and water quality have affected biodiversity and the goods and services of ecosystems
‘Climate Change and Biodiversity’(IPCC Technical Paper – V; 2002); assessment of 2,500 published studies

• The phenophases of 11 multipurpose tree species, substantial shift in critical phenophases and advancement in phenophases of these tree species in a span of 8 years is believed to be associated with climate change at the regional level in Himachal Pardesh (Thakur et al. 2008)
• The projected climate change scenario of +1oC and +2oC rise in temperature exhibit the overall area under present day Brown oak (Quercus semecarpifolia Sm.) distribution will get reduced by 40 and 76%, respectively in the west Himalayan region (Saran et al. 2010)
• Rhododendrons and other woody species have begun to invade alpine meadows in the valley of flowers of Uttarakhand (Singh et al., 2010)
Biological Responses to CC
GBPIHED

Biological Responses to CC
Upward shift of Blue –pine (P. wallichiana)
�Young saplings on upper limitYoung saplings on upper limitYoung saplings on upper limitYoung saplings on upper limit
�High rate of upward shift (19m/10yr South slope; High rate of upward shift (19m/10yr South slope; High rate of upward shift (19m/10yr South slope; High rate of upward shift (19m/10yr South slope;
14 m/10yr North slope14 m/10yr North slope14 m/10yr North slope14 m/10yr North slope
�Exponential increase in growth since 1950sExponential increase in growth since 1950sExponential increase in growth since 1950sExponential increase in growth since 1950s
(AS= Abies spectabilis; BU= Betula utilis; PW= Pinus wallichiana; SD= Salix disperma
1
10
100
1000
10000
1
10
100
1000
AS BU PW SD
Species
De
ns
ity
(In
d h
a-1
)
Tree
Sapling
Seedling
Abies spectabilis
Betula utilis
• A. spectabilis - stable• B. utilis - stable
• B. utilis - reduced back-up• S. disperma – emergent
Dubey et al. 2003
Forest Regeneration - Nanda Devi
NP
Samant 2003
GBPIHED

•••• Higher male tree density Higher male tree density Higher male tree density Higher male tree density –––– males with larger mean tree sizemales with larger mean tree sizemales with larger mean tree sizemales with larger mean tree size---- extremes of species range and resourceextremes of species range and resourceextremes of species range and resourceextremes of species range and resource----poor habitat conditionspoor habitat conditionspoor habitat conditionspoor habitat conditions
Low altitude(1300m)
High altitude(2100m)
• Femaleness • Seedling recruitment• Sapling bank
• Favorableness !• Likely expansion of forest and species boundaries !
•••• Probability of sexProbability of sexProbability of sexProbability of sex
Young Myrica stock
Male biased
Female biased
•
Longterm
Decline
Increase
Sensitive Species - Myrica esculenta
Rawal et al. 2003
Biological Responses to CC…
GBPIHED

Net photosynthesis Stomatal conductance
H. himalayensH. vulgare
Traditional crop responses…
Greater sensitivity of photosynthetic characteristics of Hordeumhimalayens to high temperature - reduction in cultivation
Joshi & Palni, 2005
GBPIHED

Decline in apple production
Despite of an increase of 46.9% Despite of an increase of 46.9% Despite of an increase of 46.9% Despite of an increase of 46.9%
area under apple cultivation from area under apple cultivation from area under apple cultivation from area under apple cultivation from
8888thththth to 9to 9to 9to 9thththth decade a decade a decade a decade a decrease of decrease of decrease of decrease of
26.4% per unit area production26.4% per unit area production26.4% per unit area production26.4% per unit area production in in in in
the 9the 9the 9the 9thththth decade decade decade decade
Climatic data recorded at Naggar Climatic data recorded at Naggar Climatic data recorded at Naggar Climatic data recorded at Naggar
in Kullu valley showed an in Kullu valley showed an in Kullu valley showed an in Kullu valley showed an
increase in both, maximum increase in both, maximum increase in both, maximum increase in both, maximum
(1.1(1.1(1.1(1.1◦C) and minimum (0.35C) and minimum (0.35C) and minimum (0.35C) and minimum (0.35◦C) C) C) C)
temperatures and decline in the temperatures and decline in the temperatures and decline in the temperatures and decline in the
average annual rainfall average annual rainfall average annual rainfall average annual rainfall and and and and
snowfall in the 9snowfall in the 9snowfall in the 9snowfall in the 9thththth decade decade decade decade
Decrease of nearly 9.01 cm in Decrease of nearly 9.01 cm in Decrease of nearly 9.01 cm in Decrease of nearly 9.01 cm in
annual average rainfallannual average rainfallannual average rainfallannual average rainfall in the in the in the in the
second half of the 20second half of the 20second half of the 20second half of the 20thththth century century century century
was found as compared to first was found as compared to first was found as compared to first was found as compared to first
half of the same century.half of the same century.half of the same century.half of the same century.
GBPIHED

SocioSocioSocioSocio---- economiceconomiceconomiceconomic…………
� Climate sensitivity
� Geological vulnerability
� Geographical isolation
� Economic marginality
� Poor technical skill
…out migration
Linking challenges & opportunities
…over burdened
Cultural diversity
Indigenous Knowledge
Adaptation strategies ?
GBPIHED

GBPIHEDFuture Directions…
� Development of scientific programmes for climate change monitoring
� Downscaling of regional climate models (RCMs)
� Researches on Himalayan precipitation processes
� Coupling of climate and hydrological models for the Himalayan streams
� Long-term studies on biodiversity elements of forest and alpine ecosystems
� Study of micro-organisms in relation to the effect of climate

� Partnership building – implementation strategy
� Issues of information gaps – optimal use of existing information
� Access to better information - Backup of Decision Support Systems (model based data generation and retrieval systems), information & knowledge portals
� Methods/approaches- compatibility and reproducibility
� Ecosystem conservation – technological advancement and holistic approach
GBPIHED
Key
iss
ues
….
Key issues for discussions . . .

� Capacity building – multiple stakeholder groups
� Community involvement – information generation and refinement of coping mechanisms
� Improving outreach – R&D extension
� Observational network – responsibilities
� Trans boundary cooperation – information sharing and technology transfer
GBPIHED
Key
iss
ues
….
Key issues for discussions...

Let us face the reality …
…prepare our selves
T h a n k s
GBPIHED