Impact of agriculture crop residue burning on atmospheric ...
13
Ann. Geophys., 28, 367–379, 2010 www.ann-geophys.net/28/367/2010/ © Author(s) 2010. This work is distributed under the Creative Commons Attribution 3.0 License. Annales Geophysicae Impact of agriculture crop residue burning on atmospheric aerosol loading – a study over Punjab State, India Anu Rani Sharma 1 , Shailesh Kumar Kharol 1 , K. V. S. Badarinath 1 , and Darshan Singh 2 1 Atmospheric Science Section, National Remote Sensing Centre, Dept. of Space-Govt. of India, Balanagar, Hyderabad 500 625, India 2 Physics Department, Punjabi University, Patiala 147 002, India Received: 19 June 2009 – Revised: 6 January 2010 – Accepted: 26 January 2010 – Published: 2 February 2010 Abstract. The present study deals with the impact of agriculture crop residue burning on aerosol properties dur- ing October 2006 and 2007 over Punjab State, India using ground based measurements and multi-satellite data. Spec- tral aerosol optical depth (AOD) and ˚ Angstr¨ om exponent (α) values exhibited larger day to day variation during crop residue burning period. The monthly mean ˚ Angstr¨ om ex- ponent “α” and turbidity parameter “β ” values during Octo- ber 2007 were 1.31±0.31 and 0.36±0.21, respectively. The higher values of “α” and “β ” suggest turbid atmospheric con- ditions with increase in fine mode aerosols over the region during crop residue burning period. AURA-OMI derived Aerosol Index (AI) and Nitrogen dioxide (NO 2 ) showed higher values over the study region during October 2007 compared to October 2006 suggesting enhanced atmospheric pollution associated with agriculture crop residue burning. Keywords. Atmospheric composition and structure (Aerosols and particles; Pollution – urban and regional) 1 Introduction Biomass burning is one of the significant global source of atmospheric aerosols and trace gas emissions, which have a major impact on climate and human health (Vander werf et al., 2006; Kharol and Badarinath, 2006; Pandey et al., 2005). In urban areas, carbonaceous aerosols associated with vehic- ular combustion are major sources of pollution and radia- tive effect of carbonaceous aerosols constitutes one of the largest uncertainities in climate modeling (Andreae et al., 2005; Ramanathan et al., 2007). In addition to aerosol par- ticles, biomass burning due to forest fires and crop residue burning are considered a major source of carbon dioxide Correspondence to: K. V. S. Badarinath (badrinath [email protected]) (CO 2 ), carbon monoxide (CO), methane (CH 4 ), volatile or- ganic compounds (VOC), nitrogen oxides and halogen com- pounds (Guyon et al., 2005; Andreae and Merlet, 2001). The greenhouse gases CO 2 and CH 4 directly influence the global warming, while changes in oxidizing capacity to CO vari- ability could perturb the growth rates of greenhouse gases. Recent study by Gustafsson et al. (2009) highlighted that biomass burning is one of the main causes for dense “brown clouds” in South Asia and 50–90% of the South Asian BC originates from fossil fuel combustion (Stone et al., 2007; Menon et al., 2002). Smoke particles from biomass burn- ing have direct radiative impact by scattering and absorbing shortwave radiation and indirect radiative impact by serving as cloud-condensation nuclei (CCN) and changing the cloud microphysical and optical properties (Cattani et al., 2005). Agricultural crop residues are burnt during the months of October and November each year in the Indo-Gangetic Plains (IGP) which has significant impact on greenhouse gas emis- sions and aerosol loading (Badarinath et al., 2009). The IGP is a very important agro-ecoregion in South-Asia, which oc- cupies nearly one-fifth of the total geographic area in four countries (Pakistan, India, Nepal and Bangladesh). The IGP in India covers 20% geographical area and contributes ∼42% to the total food grains production and holds nearly ∼40% of the total population (Tripathi et al., 2005). In the IGP region of India, ∼12 million hectares is accounted for rice- wheat crop rotation and harvesting of these crops with com- bine harvesters is very popular with the farmers of Punjab, Haryana and western Uttar Pradesh (Badarinath et al., 2009). These combine harvesting techniques in rice-wheat system leaves behind large quantities of straw in the field. The crop residues are subjected to open burning on account of high la- bor wages and anxiety of the farmers to get the crop produce collected and marketed at the earliest. Punjab state straddles India’s border with Pakistan and is often referred to as the country’s “bread basket” because it produces two-thirds of the country’s food grains. A Published by Copernicus Publications on behalf of the European Geosciences Union.
Transcript of Impact of agriculture crop residue burning on atmospheric ...
Ann. Geophys., 28, 367–379, 2010www.ann-geophys.net/28/367/2010/© Author(s) 2010. This work is distributed underthe Creative Commons Attribution 3.0 License.
AnnalesGeophysicae
Impact of agriculture crop residue burning on atmospheric aerosolloading – a study over Punjab State, India
Anu Rani Sharma1, Shailesh Kumar Kharol1, K. V. S. Badarinath1, and Darshan Singh2
1Atmospheric Science Section, National Remote Sensing Centre, Dept. of Space-Govt. of India, Balanagar,Hyderabad 500 625, India2Physics Department, Punjabi University, Patiala 147 002, India
Received: 19 June 2009 – Revised: 6 January 2010 – Accepted: 26 January 2010 – Published: 2 February 2010
Abstract. The present study deals with the impact ofagriculture crop residue burning on aerosol properties dur-ing October 2006 and 2007 over Punjab State, India usingground based measurements and multi-satellite data. Spec-tral aerosol optical depth (AOD) andAngstrom exponent(α) values exhibited larger day to day variation during cropresidue burning period. The monthly meanAngstrom ex-ponent “α” and turbidity parameter “β” values during Octo-ber 2007 were 1.31±0.31 and 0.36±0.21, respectively. Thehigher values of “α” and “β” suggest turbid atmospheric con-ditions with increase in fine mode aerosols over the regionduring crop residue burning period. AURA-OMI derivedAerosol Index (AI) and Nitrogen dioxide (NO2) showedhigher values over the study region during October 2007compared to October 2006 suggesting enhanced atmosphericpollution associated with agriculture crop residue burning.
Keywords. Atmospheric composition and structure(Aerosols and particles; Pollution – urban and regional)
1 Introduction
Biomass burning is one of the significant global source ofatmospheric aerosols and trace gas emissions, which have amajor impact on climate and human health (Vander werf etal., 2006; Kharol and Badarinath, 2006; Pandey et al., 2005).In urban areas, carbonaceous aerosols associated with vehic-ular combustion are major sources of pollution and radia-tive effect of carbonaceous aerosols constitutes one of thelargest uncertainities in climate modeling (Andreae et al.,2005; Ramanathan et al., 2007). In addition to aerosol par-ticles, biomass burning due to forest fires and crop residueburning are considered a major source of carbon dioxide
Correspondence to:K. V. S. Badarinath([email protected])
(CO2), carbon monoxide (CO), methane (CH4), volatile or-ganic compounds (VOC), nitrogen oxides and halogen com-pounds (Guyon et al., 2005; Andreae and Merlet, 2001). Thegreenhouse gases CO2 and CH4 directly influence the globalwarming, while changes in oxidizing capacity to CO vari-ability could perturb the growth rates of greenhouse gases.Recent study by Gustafsson et al. (2009) highlighted thatbiomass burning is one of the main causes for dense “brownclouds” in South Asia and 50–90% of the South Asian BCoriginates from fossil fuel combustion (Stone et al., 2007;Menon et al., 2002). Smoke particles from biomass burn-ing have direct radiative impact by scattering and absorbingshortwave radiation and indirect radiative impact by servingas cloud-condensation nuclei (CCN) and changing the cloudmicrophysical and optical properties (Cattani et al., 2005).
Agricultural crop residues are burnt during the months ofOctober and November each year in the Indo-Gangetic Plains(IGP) which has significant impact on greenhouse gas emis-sions and aerosol loading (Badarinath et al., 2009). The IGPis a very important agro-ecoregion in South-Asia, which oc-cupies nearly one-fifth of the total geographic area in fourcountries (Pakistan, India, Nepal and Bangladesh). The IGPin India covers 20% geographical area and contributes∼42%to the total food grains production and holds nearly∼40%of the total population (Tripathi et al., 2005). In the IGPregion of India,∼12 million hectares is accounted for rice-wheat crop rotation and harvesting of these crops with com-bine harvesters is very popular with the farmers of Punjab,Haryana and western Uttar Pradesh (Badarinath et al., 2009).These combine harvesting techniques in rice-wheat systemleaves behind large quantities of straw in the field. The cropresidues are subjected to open burning on account of high la-bor wages and anxiety of the farmers to get the crop producecollected and marketed at the earliest.
Punjab state straddles India’s border with Pakistan and isoften referred to as the country’s “bread basket” becauseit produces two-thirds of the country’s food grains. A
Published by Copernicus Publications on behalf of the European Geosciences Union.

368 Anu Rani Sharma et al.: Impact of agriculture crop residue burning on atmospheric aerosol loading
vast cloud of smoke engulfs the Punjab state, India, duringOctober–November, as farmers burn the stubble of freshlyharvested rice. The open burning results in perturbations tothe regional atmospheric chemistry due to emissions of tracegases like CO2, CO, CH4, N2O, NOx, NMHCs and aerosolswhich is also a health hazard to local inhabitants (Wang andChristopher, 2003). The size of the crop area also makesstubble burning a serious problem as more than 17 milliontones of rice stubble is burnt each year.
In the present study, we have examined the influenceof rice crop stubble burning practices on the atmosphericaerosol properties using ground based measurements andsatellite dataset during October 2006 and 2007 over the Pa-tiala city, Punjab state, India. The area around Patiala city,Punjab State, India is predominantly rural, with farmers cul-tivating wheat, rice and other crops. Crop stubble burning inopen fields in and around the city is a major pollution sourceduring October-November each year (Mittal et al., 2009).
2 Study area
Patiala city, Punjab State, India is located at (76◦24′ E,30◦19′ N, 249 m a.s.l.), centre of the agrarian region of north-west India, close to Shivalik Hills in the east and Thar Desertin the southwest. The Punjab State suffers from severe fog,haze and smog during winter period due to anthropogenicactivities and low temperatures (Mittal et al., 2009). The cli-mate of the city is very hot in the summer and very cold inthe winter. The region is generally dry and hot with maxi-mum temperature of 43.1◦C during May. The monsoon sea-son lasts for three months with an annual rainfall of 688 mm.January is the coldest month with mean monthly minimumtemperature of 2.1◦C.
3 Datasets and methodology
3.1 Multi Wavelength Radiometer (MWR)
Multi-Wavelength Radiometer (MWR) designed and devel-oped by the Space Physics Laboratory (SPL), Thiruvanantha-puram operated for continuous and concurrent measurementsof AOD at Patiala city of Punjab state, India. MWR takesmeasurements of the spectral extinction of ground reach-ing solar flux as a function of the solar zenith angle at tenwavelengths, centered at 380, 400, 450, 500, 600, 650, 750,850, 935 and 1025 nm and having FWHM ranging from 6to 10 nm. The detailed description about the instrument hasbeen published elsewhere (Moorthy et al., 1999; Gogoi et al.,2008).
The spectral dependence of the AOD was used to com-pute theAngstrom’s exponent “α”. A spectrally-averagedvalue of this exponent, which contains information about thesize of the particles or the volume fraction of the fine versus
coarse-mode particles (Schuster et al., 2006), can be obtainedby fitting theAngstrom’s formula (Angstrom, 1964):
AODλ = βλ−α (1)
where AODλ is estimated AOD at the wavelengthλ, “β” isthe Angstrom’s turbidity coefficient, which equals AOD atλ=1 µm, and “α” is the Angstrom exponent. TheAngstromformula is a special case of a more complicated equationvalid for a limited range of particle diameters and a lim-ited interval of wavelengths. The validity of this theory pre-supposes that the Junge power law is valid for the particle-radius range, where significant extinction takes place andthat the spectral variation of the refractive index does notimpose significant variations on the Mie extinction factor(Kaskaoutis et al., 2006). Taking the logarithms of both sidesof Eq. (1) obtains:
lnAODλ = −α lnλ+ lnβ (2)
The Angstrom exponent itself varies with wavelength. Amore precise empirical relationship between aerosol extinc-tion and wavelength is obtained with a second-order poly-nomial approximation (Pedros et al., 2003; Kaskaoutis andKambezidis, 2006):
lnAODλ = a2(lnλ)2+a1lnλ+ao (3)
where the coefficient “a2” accounts for a curvature often ob-served in sun photometry measurements. This curvature canbe an indicator of the aerosol-particle size, with negativecurvature indicating aerosol-size distributions dominated byfine-mode and positive curvature indicating size distributionswith significant contribution by the coarse-mode aerosols(Schuster et al., 2006). In this study, “α” was computed inthe wavelength interval 380–850 nm, using the Eq. (2). Thelinear fit to the logarithmic function of Eq. (2) is the mostprecise method, although the results may also depend on thespectral interval considered (Pedros et al., 2003; Kaskaoutisand Kambezidis, 2008). The second-order polynomial fit(Eq. 3) was also applied to the AOD values at five wave-lengths (380, 450, 500, 650 and 850 nm). Although the poly-nomial fit to Eq. (3) is more precise than the linear fit toEq. (2), large errors can appear especially under low turbid-ity conditions. To limit these errors only the cases where thesecond-order polynomial fit was associated withR2 > 0.95were considered.
3.2 MODIS Aerosol Optical Depth (AOD)
Moderate Resolution Imaging Spectroradiometer (MODIS)acquires daily global data in 36 spectral bands from visibleto thermal infrared (29 spectral bands with 1-km, 5 spec-tral bands with 500-m, and 2 spectral bands with 250-m,nadir pixel dimensions). The MODIS sensor is onboard thepolar orbiting NASA-EOS Terra and Aqua spacecrafts withequator crossing times of 10:30 and 13:30 Local Solar Time
Ann. Geophys., 28, 367–379, 2010 www.ann-geophys.net/28/367/2010/

Anu Rani Sharma et al.: Impact of agriculture crop residue burning on atmospheric aerosol loading 369
(LST), respectively (Levy et al., 2007). Aerosol retrievalsfrom MODIS data are performed over land and ocean sur-faces by means of two separate algorithms described in liter-ature (Kaufman and Tanre, 1998). The aerosol properties arederived by the inversion of the MODIS-observed reflectanceusing pre-computed radiative transfer look-up tables basedon aerosol models (Remer et al., 2005; Levy et al., 2007).The initial versions of the MODIS algorithms have been un-der continued development, and have recently received animproved aerosol determination, via processing to Collec-tion 5 (C005) (Levy et al., 2007). The data used in thisstudy include Terra MODIS aerosol products, calculated us-ing separate algorithms over land and ocean to obtain AOD at550 nm (AOD550) and the proportion of AOD550 contributedto the fine-mode aerosols (determined as fine-mode fraction,FM); such estimations are only made over cloud-free regions(Remer et al., 2005). The C005 Level 3 (spatial resolution1◦
×1◦) MODIS products were obtained from LADSWEBwebsite (http://ladsweb.nascom.nasa.gov/).
3.3 OMI Aerosol Index
Aerosol Index (AI) values from the Ozone Monitoring In-strument (OMI) onboard the Finnish-Dutch AURA satelliteare used. The AI, as defined in Eq. (4) below, is the resid-ual between the measured radiance and the calculated oneusing the Lambert Equivalent Reflectivity (LER) assump-tion. Assuming a Rayleigh scattering atmosphere above aLambertian surface, the Lambert Equivalent Reflectivity isdefined as the value of the Lambertian spectral albedo forwhich the modeled and measured top of atmosphere (TOA)reflectance are equal. The LER in the multi-wavelength al-gorithm was determined using the radiative transfer codeDoubling-Adding KNMI (DAK) (Curier et al., 2008).
AI = −100log
{[Iλ1
Iλ2
]meas
}+100log
{[Iλ1
(ALERλ1
)Iλ2
(ALERλ2
)]calc
}(4)
ALER is the wavelength-dependent surface Lambert Equiva-lent albedo. The UV aerosol index at 388 nm is calculated us-ing the following wavelengthsλ1=342.5 nm andλ2=388 nm.Aerosol index (AI) is sensitive to elevated absorbing layerssuch as dust and biomass burning aerosols (de Graaf et al.,2005).
3.4 OMI tropospheric NO2
OMI/AURA NO2 total and tropospheric column L2 (V00)global product from GES-DISC (http://gdata1.sci.gsfc.nasa.gov/daac-bin/G3/gui.cgi?instanceid=omil2g) at 0.25 degspatial resolution were used in the study. The AtmosphericNO2 column densities use the Differential Optical Absorp-tion Spectroscopy (DOAS) technique (Platt, 1994) and areretrieved using spectral measurements of the solar irradi-ance and earth shine radiance in the wavelength region 415–465 nm using the instrument’s VIS detector at a spectral reso-
lution of 0.5 nm (Celarier et al., 2008). Detailed descriptionsof the algorithm for the standard OMI NO2 data product aregiven in Boersma et al., 2002; Bucsela et al., 2006;Celarieret al., 2008.
3.5 CALIPSO
The Cloud-Aerosol Lidar and Infrared Pathfinder SatelliteObservation (CALIPSO) provide new insight into the roleof clouds and atmospheric aerosols (airborne particles) inregulating Earth’s climate and air quality. CloudSat is apart of the A-train series satellite constellation that includesAqua, Aura, and PARASOL satellites. CALIPSO has a 98◦-inclination orbit and flies at an altitude of 705 km provid-ing daily global maps of the vertical distribution of aerosolsand clouds. CALIPSO was launched on 28 April 2006. TheCALIPSO payload consists of three instruments: the Cloud-Aerosol Lidar with Orthogonal Polarization (CALIOP), anImaging Infrared Radiometer (IIR), and a moderate spa-tial resolution Wide Field-of-view Camera (WFC). CALIOPprovides profiles of backscatter at 532 and 1064 nm, as wellas two orthogonal (parallel and perpendicular) polarizationcomponents at 532 nm. A detailed discussion of CALIOPdata products has been described elsewhere (Powell et al.,2009).
3.6 MOPITT CO
CO data from Measurements of Pollution in the Troposphereinstrument (MOPITT) were analysed to assess the CO varia-tions coinciding with crop residue burning period. MOPITTis a thermal nadir-viewing gas-correlation radiometer, whichprovides view of CO emissions with a horizontal resolutionof 22 km (Liu et al., 2005). MOPITT retrievals provide av-erage CO values separately resolved in two relatively broadlayers of the atmosphere; in the lower troposphere fromabout 700–500 hPa, and in the upper troposphere from about300–200 hPa (Deeter et al., 2004). Details on measurementand retrieval techniques from MOPITT have been describedelsewhere (Deeter et al., 2004). We use version 3 of level 2total column CO data available at the NASA (http://eosweb.larc.nasa.gov/PRODOCS/mopitt/tablemopitt.html) LangleyDistributed Active Archive Center. The version 3 of level 2total column CO data files contains the total column abun-dance and the profiles of CO at 7 heights.
3.7 MODIS active fire locations
Fire observations are performed four times a day from theTerra (10:30 and 22:30) and Aqua (13:30 and 01:30) plat-forms. MODIS Fire detection is performed using a contex-tual algorithm (Giglio et al., 2003) that exploits the strongemission of mid-infrared radiation from fires. The algo-rithm uses brightness temperatures derived from the MODIS4 and 11 µm channels. The description of MODIS fireproducts retrieval has been provided elsewhere (Giglio et
www.ann-geophys.net/28/367/2010/ Ann. Geophys., 28, 367–379, 2010

370 Anu Rani Sharma et al.: Impact of agriculture crop residue burning on atmospheric aerosol loading
Figure 1:
m/sec
Fig. 1. Synoptic wind patterns at 925 hPa level over Indian region for the period of October 2006 and 2007.
al., 2003). We used MODIS active fire location compos-ited for the period of October 2006 and 2007 from Russiaweb fire maps (http://maps.geog.umd.edu/activefirehtml/).The mean composite wind vector at 925-hpa level over theIndian region was obtained from NCEP/NCAR reanalysiswebsite (http://www.cdc.noaa.gov/cgi-bin/data/composites/printpage.pl). Air mass back trajectories ending at the Patialacity at three altitudes (500 m, 1500 m and 3000 m a.s.l.) werecalculated using the NOAA-HYSPLIT (National Oceanicand Atmospheric Administration Hybrid Single- Particle La-grangian Integrated Trajectory) model (version 4) which in-cludes vertical wind. This model was developed at the AirResources Laboratory, National Oceanic and AtmosphericAdministration, USA (Draxler and Rolph, 2003).
4 Results and discussion
4.1 Meteorological conditions
The wind vectors at 925 hPa from NCEP were analysed tocharacterize the dispersion of aerosols in the study regionduring the study period. Figure 1 shows the average windspeed and direction at 925 hPa over Indian region duringOctober 2006 and 2007. A persistent north-westerly flowfor October 2006 and northerly flow for October 2007 withhigh intensities in the northern part of India (Ganges valley)can be seen from the Fig. 1. The wind field confirms con-tinental aerosols outflow over Arabian Sea (AS) during thestudy period. Recent studies by Badarinath et al. (2009a,
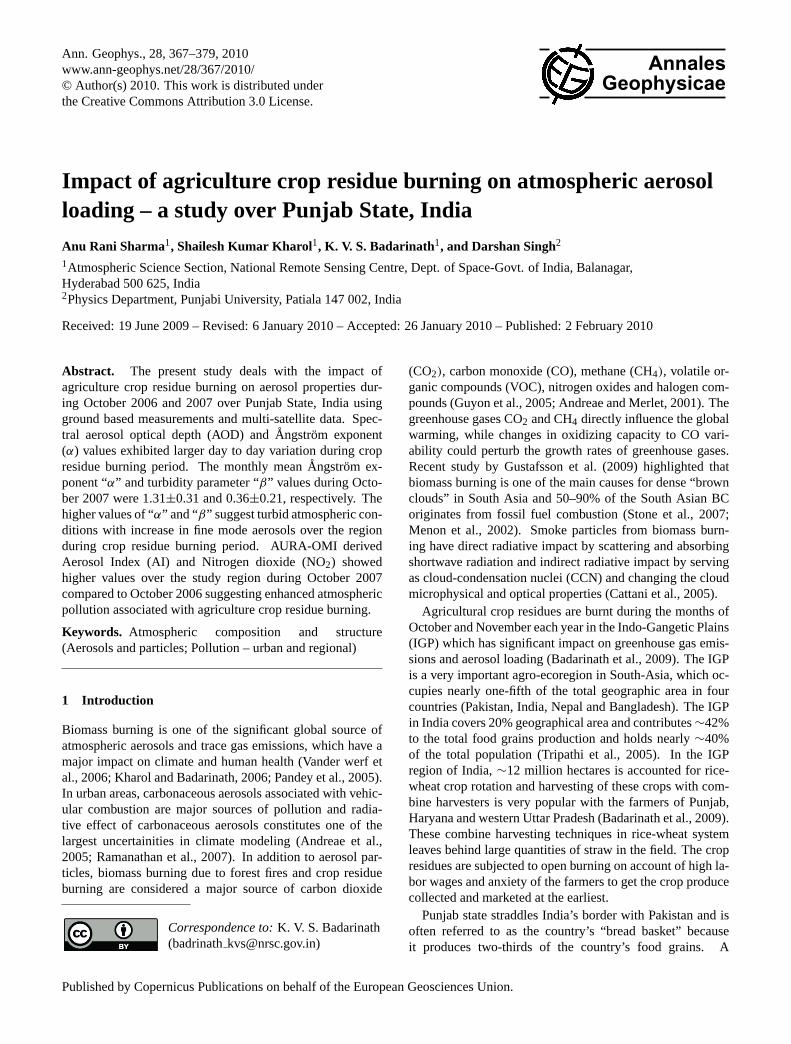
b) reported the long range transport of aerosols/trace gasesfrom agriculture crop residue burning regions to urban re-gion of Hyderabad and Arabian Sea (AS). Earlier studiescarried out by Deshpande and Kamra (2002) suggested longrange transport of aerosols from the northern Indian subcon-tinent and South Asian region to the pristine oceanic atmo-sphere of the Southern Hemisphere by northeasterly windsof the Asian winter monsoon. Figure 2 shows the NOAA-HYSPLIT derived five-day back trajectories ending at Pa-tiala at three altitudes (500, 1500 and 3000 m) on each day at00:00 UTC during October 2006 and 2007. The north/northwesterly winds were prominent over the region during thestudy period at three altitudes attributed to the biomass burn-ing aerosols transport over the region. The variations in dailyaverage temperature, relative humidity (RH) and wind speedduring October 2006 and October 2007 over Patiala city isshown in Fig. 3a–b. Air temperature was varying between21.6◦C–30.4◦C and 23.3◦C–28.2◦C during October 2006and 2007, respectively (Fig. 3a). Relative humidity was rang-ing between 54.4%–70.6% and 45.8%–73.6% during Octo-ber 2006 and 2007 (Fig. 3b).
4.2 Aerosol properties over Patiala
Aerosol optical depth (AOD) measurements were carried outusing Multi Wavelength Radiometer (MWR) (Moorthy et al.,1999; Gogoi et al., 2008; Pillai and Murthy, 2004; Vinojet al., 2004). Figure 4a–c shows the comparative day-to-day variability of AOD500, Angstrom Exponent “α” and tur-bidity parameter “β” during October for the years of 2006
Ann. Geophys., 28, 367–379, 2010 www.ann-geophys.net/28/367/2010/

Anu Rani Sharma et al.: Impact of agriculture crop residue burning on atmospheric aerosol loading 371
Figure 2a:
(a)
Figure 2b:
(b)
Fig. 2. NOAA-HYSPLIT five-day wind back trajectories ending atPatiala during 6 October and 7 October at 500 (red), 1500 (blue)and 4000 m (green).
and 2007. Day-to-day increase in AOD500 values was ob-served during October 2006 and 2007 suggesting additionalloading of aerosols over the region associated with agricul-ture crop residue burning practices (Fig. 13). The monthlymean AOD500 exhibited larger values during October 2007(∼0.97±0.56) compared to October 2006 (0.76±0.45) sug-gesting a∼21% increase in aerosols loading over the re-gion. TheAngstrom exponents were derived from the AODvalues using the least-squares method covering the spectralrange 380–850 nm (Das et al., 2008). The abundance of ac-cumulation (0.1 µm<radius<1.0 µm) mode particles as re-flected in high values of theAngstrom exponent “α” witha simultaneous increase in the turbidity parameter “β” canbe noticed during October 2007 compared to October 2006(Fig. 4b, c). The monthly mean “α” values during Octo-ber 2007 (1.31±0.31) were observed to be high comparedto October 2006 (1.10±0.26). Similarly, monthly mean “β”values also showed higher values (0.36±0.21) during Octo-
Figure 3a:
(a)
Figure 3b:
(b)
Fig. 3. Day-to-day variation of(a) average temperature and(b) Rel-ative humidity (RH) during October 2006 and 2007.
ber 2007 compared to October 2006 (0.32±0.15) suggestingmore turbid atmospheric conditions and increase in accumu-lation mode aerosols particles over the region during October2007 (Badarinath et al., 2009). TheAngstrom parameter (α)
and turbidity coefficient (β) showed 18% and 10% increaserespectively during October 2007 and were attributed to agri-culture crop residue burning activities over the region.
Figure 5a–b shows the scatter plot of the coefficienta2(curvature in the polynomial fit) against AOD500 during Oc-tober 2006 and 2007. The correlation between “a2” andAOD500 provides information on the atmospheric conditionunder which “α” is independent from wavelength. The datalying on or near thea2 = 0 line corresponds to bimodal log-normal aerosol size distribution without curvature, negativea2 values corresponds to fine mode aerosols and positivea2
www.ann-geophys.net/28/367/2010/ Ann. Geophys., 28, 367–379, 2010

372 Anu Rani Sharma et al.: Impact of agriculture crop residue burning on atmospheric aerosol loading
Figure 4a:
(a)
Figure 4b:
(b)
Figure 4c:
(c)
Fig. 4. Day-to-day variation of(a) MWR measured AOD500,(b) Angstrom Exponent (α) and (c) Turbidity parameter (β) dur-ing October 2006 and 2007.
Figure 5a:
(a)
Figure 5b:
(b)
Fig. 5. Scatter plot of coefficienta2 against AOD500 during(a) Oc-tober 2006 and(b) October 2007.
values mainly indicates presence of coarse mode aerosol par-ticles (Kaskaoutis et al., 2007; Schuster et al., 2006). DuringOctober 2007 “a2” exhibits negative values suggesting abun-dance of accumulation mode aerosol particles over the re-gion (Fig. 5a–b). However, during October 2006, majorityof a2 values were negative, but few positive values and nearzero values occurred, suggesting presence of coarse modeaerosol particles along with accumulation mode aerosol par-ticles over the region.
4.3 Satellite observations on emission from agriculturecrop residue burning
MODIS images have been extensively used for monitoring offorest fires, dust outbreaks, severe storms, cyclones, volca-noes etc over the globe (Kaskaoutis et al., 2008; Badarinath
Ann. Geophys., 28, 367–379, 2010 www.ann-geophys.net/28/367/2010/

Anu Rani Sharma et al.: Impact of agriculture crop residue burning on atmospheric aerosol loading 373
Figure 6a:
(a)
Fires due to agriculture crop residue burning over Punjab, India
TERRA MODIS
18-Oct- 06
Smoke Plume
Figure 6b:
Smoke Plume
Fires due to agriculture crop residue burning over Punjab, India
TERRA MODIS
22-Oct- 07
(b)
Fig. 6. Terra MODIS true color composite of study area showingsmoke due to crop residue burning and fires in red color on 18 Oc-tober 2006 and 22 October 2007.
et al., 2008, 2009c; Rothery, et al., 2005). Figure 6a–b showsthe Terra MODIS true color composite images on 18 October2006 and 22 October 2007 over Punjab state, India. At thebase of the Himalaya mountain in northwestern India, a largeand intense smoke plume extending over the Indo GangeticPlains (IGP) and Punjab with active fires marked with reddots can be clearly seen in Fig. 6a–b associated with agri-culture crop residue burning (Badarinath et al., 2006; Mit-tal et al., 2009). Figure 7 shows the daily variation of TerraMODIS AOD550during October 2006 and 2007. The day-to-day variation of Terra MODIS AOD550 also shows the highervalues similar to MWR AOD500 (Fig. 4a) variations over theregion during October 2006 and 2007. The linear regres-sion analysis between ground based MWR measurements onAOD500 and Terra MODIS AOD550 during October 2007 ex-hibited good correlation of∼0.86 (Fig. 8).
In addition, AURA-OMI Aerosol Index (AI) was alsoanalysed over the region during the study period. AerosolIndex (AI) is sensitive to a range of UV-absorbing aerosols
Figure 7:
Fig. 7. Day-to-day variation of Terra MODIS AOD500 during Oc-tober 2006 and 2007.
Figure 8:
Fig. 8. Scatter plot of MODIS AOD550 vs. MWR measuredAOD500 over Patiala city, Punjab state, India.
such as mineral dust, volcanic ash, and black carbon fromfossil-fuel combustion sources and biomass burning (Badar-inath et al., 2007). The UV surface reflectivity is typicallylow and nearly constant over both land and sea, which al-lows OMI to detect aerosols over both land and ocean. Ex-tensive analysis of the seasonal and interannual variabil-ity of TOMS-AI values has been carried out over India byHabib et al. (2006). The spatial distribution of OMI de-rived monthly mean Aerosol Index during October 2006 and2007 are shown in the Fig. 9a–b. The typical AI valuesduring October 2006 over the region were in the range of∼1–1.4, while for October 2007, it varied between∼1 to∼2. The high OMI AI suggested increased concentration
www.ann-geophys.net/28/367/2010/ Ann. Geophys., 28, 367–379, 2010

374 Anu Rani Sharma et al.: Impact of agriculture crop residue burning on atmospheric aerosol loading
Figure 9:
Fig. 9. Spatial variation of OMI-AI over Punjab state during October 2006 and 2007.
Figure 10:
October-06 October-07
NO2
1015 molec/cm2
Fig. 10. Spatial variation of OMI-NO2 over Punjab state, India during October 2006 and 2007.
of absorbing aerosols in the atmosphere from crop residueburning over the study region. Figure 10a–b shows the OMIderived monthly mean tropospheric columnar NO2 duringOctober 2006 and 2007 over Punjab state with Patiala citylocation marked on the figure. Figure 10 suggests relativelyhigher values of NO2 in the range of minimum∼4 to a max-imum of ∼9 (1015 molec cm−2) during October 2007, com-pared to October 2006. The higher NO2 concentration in
October 2007 compared to October 2006 may be related withthe intensity of the fires due to agriculture crop residue burn-ing and the larger AOD,α andβ values.
Satellite remote sensing provides an opportunity of mak-ing global measurements of tropospheric trace gases andaerosols over extended periods of time (Edwards et al., 2004;Andreae and Merlet, 2001). Figure 11a–b shows the monthlymean distribution of daytime total columnar CO abundance
Ann. Geophys., 28, 367–379, 2010 www.ann-geophys.net/28/367/2010/

Anu Rani Sharma et al.: Impact of agriculture crop residue burning on atmospheric aerosol loading 375
Figure 11:
1018 Mol/Cm2
Fig. 11. Spatial variation of MOPITT CO over Punjab state during October 2006 and 2007.
Figure 12:
25-October-2007
Aerosol layer over Punjab state
Fig. 12. Calipso derived vertical feature mask image showing high aerosol loading over central region of India on 25 October 2007.
at 850 hPa measured by MOPITT during October 2006 and2007 over Punjab state, India. MOPITT observed high levelsof carbon monoxide (red and golden yellow pixels) over thestudy region during October 2007 associated with agricul-ture crop residue burning. Figure 12 shows the CALIPSO-derived vertical feature mask image covering the central partof India on 25 October 2007. In the lower part of Fig. 12
the coordinates of the overpass (latitude above and longi-tude below) are also given. The daytime pass of CALIPSOwas at 08:08 to 08:21 UTC mainly covering parts of the Pun-jab, Haryana, Rajasthan, Madhya Pradesh, Andhra Pradeshand Tamil Nadu states. The CALIPSO derived vertical fea-ture mask image suggested vertically extended aerosol layer(∼3 Km) over central Indian region on 25 October 20007
www.ann-geophys.net/28/367/2010/ Ann. Geophys., 28, 367–379, 2010

376 Anu Rani Sharma et al.: Impact of agriculture crop residue burning on atmospheric aerosol loading
Figure 13:
2006271-280 2006281-290
2006291-300 2006301-310
2007291-3002007301-310
2007271-280 2007281-290
Fig. 13. MODIS active fires composite during October 2006 and2007 showing increased occurrence of fires during October 2007.
associated with agriculture crop residue burning activitiesover the region. Figure 13 shows the MODIS active fire lo-cations composite over Indian subcontinent during October2006 and 2007. Higher incidence of fires occurred over theIGP region during 2007, mainly in the Punjab and Haryanastate followed by Utter Pradesh, Madhya Pradesh and Maha-rashtra (Fig. 13). These fire practices are mainly attributed toagricultural crop residue burning associated with rice-wheatcrop rotation system over the IGP region (Badarinath et al.,2006).
Figure 14a:
(a)
Figure 14b:
(b)
Fig. 14. Aerosol shortwave (SW) radiative forcing estimated usingSBDART model over Patiala city during(a) 18 (turbid day) and 23(clear day) October 2006 and(b) 3 (clear day) and 31 (turbid day)October 2007.
4.4 Aerosol radiative forcing
The knowledge of aerosol loading is important as it can in-fluence the weather patterns by perturbing the radiation bud-get over any region. The radiative forcing from biomassburning aerosols has been a subject of scientific researchat regional and global scale. In the present study, we haveused aerosol optical depth (AOD) data measured using MWR(Gogoi et al., 2008) as input to Optical Properties of Aerosoland Clouds (OPAC) model to calculate single scatteringalbedo (ω) and asymmetry factor values. The radiative trans-fer calculations were made using the Santa Barbara Dis-crete Ordinate Radiative Transfer (SBDART) (Ricchiazzi etal., 1998) algorithm. This hybrid approach has been used
Ann. Geophys., 28, 367–379, 2010 www.ann-geophys.net/28/367/2010/

Anu Rani Sharma et al.: Impact of agriculture crop residue burning on atmospheric aerosol loading 377
successfully to estimate the aerosol radiative forcing (Badar-inath et al., 2009). The calculations were performed sep-arately with and without aerosols for shortwave spectrum(0.2–4.0 µm) and the clear sky radiative forcing was deter-mined over the study site. Figure 14 shows shortwave (SW)direct radiative forcing at the surface (SRF), TOA and atmo-sphere over study site during (a) 18 (turbid day) and 23 (clearday) October 2006 and (b) 3 (clear day) and 31 (turbid day)October 2007. Considerable reduction in surface reachingshortwave radiation i.e.∼ −175.4 W m−2 during 18 October2006 and∼ −212.1 W m−2 during 31 October 2007 wereobserved during biomass burning period at the study site.The SW radiative forcing at TOA was∼ −41.48 W m−2 and∼ −47.67 W m−2 over the region during 18 October 2006and 31 October 2007, respectively. The reduction in surfaceSW radiation resulted in large atmospheric SW forcing ofabout∼134 W m−2 and∼164.4 W m−2 during 18 October2006 and 31 October 2007, respectively. The increased ab-sorption of shortwave radiation results in atmospheric heat-ing that can have possible impact on climate over the re-gion. Earlier studies by Tripathi et al. (2005) highlighteda decrease in the shortwave radiation reaching the surface∼62±23 W m−2 and the top of the atmosphere (TOA) re-flected radiation by∼9±3 W m−2 over Kanpur located inthe IGP region, India. Badarinath and Latha (2006) sug-gested aerosol forcing of−33 Wm2 and +9 W m−2 at thesurface and at the top of the atmosphere respectively overurban region of Hyderabad. Bellouin et al. (2005) estimatedradiative forcing using state-of-the-art satellite based mea-surements of aerosols, surface wind speed and highlighted aclear sky global direct radiative forcing of−1.9±0.3 W m−2
at TOA. Wang et al. (2007) estimated regional radiative im-pact of biomass burning aerosols in the Asia during the ex-perimental period of Transport and Chemical Evolution overthe Pacific (TRACE-P) and suggested monthly mean clear-sky direct shortwave radiative forcing ranging from−1.9 to0.4 W m−2 at TOA and from−0.5 to−12.0 W m−2 at sur-face. Recently Badarinath et al. (2009) observed radiativeforcing in the range of∼ −107.81 W m−2 at surface over ur-ban region of Hyderabad due to enhanced aerosols loadingassociated with agriculture crop residue burning.
5 Conclusions
In the present study, impact of agriculture crop residue burn-ing on aerosol properties during October 2006 and 2007years over Punjab state in the IGP region of India were ana-lyzed. Results of the study suggested that
– Higher values of AOD500, α and β exhibited duringcrop residue burning period suggesting increased con-centration of accumulation mode particle in the atmo-sphere with high turbidity conditions. The AOD val-ues were∼21% higher during October 2007 compared
to October 2006 and were attributed to agriculture cropresidue burning over the region.
– Satellite derived observations on AOD, aerosol index(AI), NO2 and carbon monoxide (CO) showed signifi-cant increase during October 2007 compared to October2006 coinciding with ground observations of aerosolparameters.
– Model estimates on aerosol shortwave radiative forcingsuggested increased atmospheric absorption of radiationduring crop residue burning period over the region.
Acknowledgements.The authors thank the Director of NRSC &Deputy. Director (RS&GIS-AA), NRSC for necessary help at vari-ous stages and ISRO-GBP for funding support.
Topical Editor F. D’Andrea thanks D. Kaskaoutis and anotheranonymous referee for their help in evaluating this paper.
References
Andreae, M. O. and Merlet, P.: Emission of trace gases and aerosolsfrom biomass burning, Global Biogeochemical Cycles, 15, 955–966, 2001.
Andreae, M. O., Jones, C. J., and Cox, P. M.: Strong present-dayaerosol cooling implies a hot future, Nature, 435, 1187–1190,2005.
Angstrom, A.: The parameters of atmospheric turbidity, Tellus, 16,64–75, 1964.
Badarinath, K. V. S., Kharol, S. K., Kaskoutis, D. G., and Kam-bezidis, H. D.: Influence of atmospheric aerosols on solar spec-tral irradiance in an urban area, J. Atmos. Solar-Terr. Phys., 69,589–599, 2007.
Badarinath, K. V. S., Kiran Chand, T. R., and Prasad, V. K.: Agri-culture crop residue burning in the Indo-Gangetic plains – Astudy using IRS P6 AWiFS satellite, Current Sci., 91, 1085–1089, 2006.
Badarinath, K. V. S. and Latha, K. M.: Direct radiative forcing fromblack carbon aerosols over urban environment, Adv. Space Res.,37, 2183–2188, 2006.
Badarinath, K. V. S., Kharol, S. K., and Sharma, A. R.: Long-rangetransport of aerosols from agriculture crop residue burning inIndo-Gangetic Plains – A study using LIDAR, ground measure-ments and satellite data, J. Atmos. Solar-Terr. Phys., 71, 112–120, 2009a.
Badarinath, K. V. S., Kharol, S. K., Krishna Prasad, V., Kaskaoutis,D. G., and Kambezidis, H. D.: Variation in aerosol propertiesover Hyderabad, India during intense cyclonic conditions, Int. J.Remote Sens., 29(15), 4575–4597, 2008.
Badarinath, K. V. S., Kharol, S. K., Sharma, A. R., and KrishnaPrasad, V.: Analysis of aerosol and carbon monoxide charac-teristics over Arabian Sea during crop residue burning periodin the Indo-Gangetic Plains using multi-satellite remote sensingdatasets, J. Atmos. Solar-Terr. Phys., 71, 1267–1276, 2009b.
Badarinath, K. V. S., Kharol, S. K., Sharma, A. R., Ramaswamy,V., Kaskaoutis, D. G., and Kambezidis, H. D.: Investigations ofan intense aerosol loading during 2007 cyclone SIDR – A studyusing satellite data and ground measurements over Indian region,Atmos. Environ., 43, 3708–3716, 2009c.
www.ann-geophys.net/28/367/2010/ Ann. Geophys., 28, 367–379, 2010

378 Anu Rani Sharma et al.: Impact of agriculture crop residue burning on atmospheric aerosol loading
Bellouin, N., Boucher, O., Haywood, J., and Reddy, M. S.: Globalestimate of aerosol direct radiative forcing from satellite mea-surements, Nature, 438, 1138–1141, doi:10.1038/nature04348,2005.
Boersma, K. F., Bucsela, E., Brinksma, E., and Gleason, J. F.: NO2,in: OMI Algorithm Theoretical Basis Document, vol. IV, TraceGas Algorithms, edited by: Chance, K., pp. 15–36, NASA God-dard Space Flight Cent., Greenbelt, Md., 2002.
Bucsela, E. J., Celarier, E. A., Wenig, M. O., Gleason, J. F.,Veefkind, J. P., Booersma, K. F., and Brinksma, E. J.: Algorithmfor NO2 vertical column retrieval from the Ozone Monitoring In-strument, IEEE Trans. Geosci. Remote Sens., 44(5), 1245–1258,2006.
Cattani, E., Costa, M. J., Torricella, F., Levizzani, V., and Silva, A.M.: Influence of aerosol particles from biomass burning on cloudmicrophysical properties and radiative forcing, Atmos. Res., 82,310–327, 2005.
Celarier, E., Brinksma, E., Gleason, J., Wenig, M., Veefkind,J., Cede, A., Herman, J., Ionov, D., Goutail, F., Pommereau,J.-P., Lambert, J.-C., van Roozendahl, M., Pinardi, G., Wit-trock, F., Schonhardt, A., Richter, A., Ibrahim, O., Wagner,T., Bojkov, B., Mount, G., Bucsela, E., Swart, D., Volten, H.,Kroon, M., and Levelt, P.: Validation Ozone Monitoring Instru-ment nitrogen dioxide columns, J. Geophys. Res., 113, D15S15,doi:10.1029/2007JD008908, 2008.
Curier, L., Veefkind, J. P., Braak, R., Torres, O., Veihelmann, B.,and Leeuw, G. de,: Retrieval of aerosols optical properties fromOMI radiances using a multi-wavelength algorithm: Applicationand validation to Western Europe, J. Geophys. Res. D, 2008,doi:10.1029/2007JD008738, 2008.
Das, S. K., Jayaraman, A., and Misra, A.: Fog-induced variationsin aerosol optical and physical properties over the Indo-GangeticBasin and impact to aerosol radiative forcing, Ann. Geophys.,26, 1345–1354, 2008,http://www.ann-geophys.net/26/1345/2008/.
de Graaf, M. and Stammes, P.: SCIAMACHY Absorbing AerosolIndex – calibration issues and global results from 2002–2004,Atmos. Chem. Phys., 5, 2385–2394, 2005,http://www.atmos-chem-phys.net/5/2385/2005/.
Deeter, M. N., Emmons, L. K., Francis, G. L., et al.:Evaluation of operational radiances for the Measurementsof Pollution in the Troposphere (MOPITT) instrument COthermal-band channels, J. Geophys. Res., 109(D3), D03308,doi:10.1029/2003JD003970, 2004.
Draxler, R. R. and Rolph, G. D.: HYSPLIT (Hybrid Single-ParticleLagrangian Integrated Trajectory) model,http://www.arl.noaa.gov/ready/hysplit4.html, NOAA Air Resour. Lab., Silver Spring,MD, 2003.
Edwards, D. P., Emmons, L. K., Hauglustaine, D. A., et al.: Obser-vations of carbon monoxide and aerosols from the Terra satellite:Northern Hemisphere variability, J. Geophys. Res., 109, D24202,doi:10.1029/2004JD004727, 2004.
Giglio, L., Kendall, J. D., and Mack, R.: A multi-year active firedata set for the tropics derived from the TRMM VIRS, Int. J.Rem. Sens., 24, 4505–4525, 2003.
Gogoi, M. M., Bhuyan, P. K., and Krishna Moorthy, K.: Estima-tion of the effect of long-range transport on seasonal variation ofaerosols over northeastern India, Ann. Geophys., 26, 1365–1377,2008,
http://www.ann-geophys.net/26/1365/2008/.Gustafsson, O., Krusa, M., Zencak, Z., Sheesley, R. J., Granat,
L., Engstrom, E., Praveen, P. S., Rao, P. S. P., Leck, C., andRodhe, H.: Brown Clouds over South Asia: Biomass or FossilFuel Combustion?, Science, 323, 495–498, 2009.
Guyon, P., Frank, G. P., Welling, M., Chand, D., Artaxo, P., Rizzo,L., Nishioka, G., Kolle, O., Fritsch, H., Silva Dias, M. A. F, Gatti,L. V., Cordova, A. M., and Andreae, M. O.: Airborne measure-ments of trace gas and aerosol particle emissions from biomassburning in Amazonia, Atmos. Chem. Phys., 5, 2989–3002, 2005,http://www.atmos-chem-phys.net/5/2989/2005/.
Habib, G., Venkataraman, C., Chiapello, I., Ramachadran, S.,Boucher, O., and Reddy, M. S.: Seasonal and interannual vari-ability in absorbing aerosols over India derived form TOMS: Re-lationship to regional meteorology and emissions, Atmos. Envi-ron., 40, 1909–1921, 2006.
Kaskaoutis, D. G. and Kambezidis, H. D.: Investigation on thewavelength dependence of the aerosol optical depth in the Athensarea, Q. J. Roy. Meteorol. Soc., 132, 2217–2234, 2006.
Kaskaoutis, D. G., Kambezidis, H. D., Adamopoulos, A. D., andKassomenos, P. A.: Comparison between experimental data andmodeling estimates of atmospheric optical depth over Athens,Greece, J. Atmos. Solar Terr. Phys., 68, 1167–1178, 2006.
Kaskaoutis, D. G., Kambezidis, H. D., Hatzianastassiou, N., Kos-mopoulos, P. G., and Badarinath, K. V. S.: Aerosol climatology:dependence of theAngstrom exponent on wavelength over fourAERONET sites, Atmos. Chem. Phys. Discuss., 7, 7347–7397,2007,http://www.atmos-chem-phys-discuss.net/7/7347/2007/.
Kaskaoutis, D. G. and Kambezidis, H. D.: Comparison of theAngstrom parameters retrieval in different spectral ranges withthe use of different techniques, Meteorol. Atmos. Phys., 99, 233–246, 2008.
Kaskaoutis, D. G., Kambezidis, H. D., Nastos, P. T., and Kos-mopoulos, P. G.: Study on an intense dust storm over Greece,Atmos. Environ., 42, 6884–6896, 2008.
Kaufman, Y. J. and Tanre, D.: Algorithm For Remote Sensing ofTropospheric Aerosol from MODIS, Algorithm Theoretical Ba-sis Document, ATBD-MOD-02, NASA Goddard Space FlightCenter, 85, 1998.
Kharol, S. K. and Badarinath, K. V. S.: Impact of biomassburning on aerosol properties over tropical urban regionof Hyderabad, India, Geophys. Res. Lett., 33, L20801,doi:10.1029/2006GL026759, 2006.
Levy, R. C., Remer, L. A., and Dubovik, O.: Global aerosol opti-cal properties and application to Moderate Resolution ImagingSpectroradiometer aerosol retrieval over land, J. Geophys. Res.,112, D13210, doi:10.1029/2006JD007815, 2007.
Liu, J., Drummond, J. R., Li, Q., Gille, J. C., and Ziskin, D. C.:Satellite mapping of CO emission from forest fires in NorthwestAmerica using MOPITT measurements, Remote Sens. Environ.,95(4), 502–516, 2005.
Menon, S., Hansen, J. E., Nazarenko, L., and Luo, Y.: Climateeffects of black carbon aerosols in China and India, Science, 297,2250–2253, doi:10.1126/science.1075159, 2002.
Mittal, S. K., Singh, N., Agarwal, R., Awasthi, A., and Gupta, P. K.:Ambient air quality during wheat and rice crop stubble burningepisodes in Patiala, Atmos. Environ., 43(2), 238–244, 2009.
Moorthy, K. K., Niranjan, K., Narasimhamurthy, B., Agashe, V. V.,
Ann. Geophys., 28, 367–379, 2010 www.ann-geophys.net/28/367/2010/

Anu Rani Sharma et al.: Impact of agriculture crop residue burning on atmospheric aerosol loading 379
and Murthy, B. V. K.: Aerosol climatology over India: ISROGBP MWR network and database, ISRO GBP SR-03-99, IndianSpace Res. Organ., Bangalore, 1999.
Pandey, J. S., Kumar, R., and Devotta, S.: Health risks of NO2,SPM and SO2 in Delhi, Atmos. Environ., 39(36), 6868–6874,2005.
Pedros, R., Martinez-Lozano, J. A., Utrillas, M. P., Gomez-Amo,J. L., and Tena, F.: Column-integrated aerosol, optical proper-ties from ground-based spectroradiometer measurementsat Bar-rax (Spain) during the Digital Airborne Imaging SpectrometerExperiment (DAISEX) campaigns, J. Geophys. Res., 108(D18),4571, doi:10.1029/2002JD003331, 2003.
Pillai, P. S. and Krishna Moorthy, K.: Size distribution of near-surface aerosols and its relation to the columnar aerosol opticaldepths, Ann. Geophys., 22, 3347–3351, 2004,http://www.ann-geophys.net/22/3347/2004/.
Platt, U.: Differential optical absorption spectroscopy (DOAS), in:Air Monitoring by Spectroscopic Techniques, edited by: Sigrist,M., 27–84, John Wiley, Hoboken, NJ, 1994.
Powell, K. A., Hostetler, C. A., Vaughan, M. A., Lee, K., Trepte, C.R., Rogers, R. R., Winker, D. M., Liu, Z., Kuehn, R. E., Hunt, W.H., and Young, S. A.: CALIPSO Lidar Calibration Algorithms:Part I – Nighttime 532-nm Parallel Channel and 532-nm Per-pendicular Channel, J. Atmos. Oceanic Technol., 26(10), 2015–2033, 2009.
Ramanathan, V., Ramana, M. V., Roberts, G., Kim, D., Corriganm,C., Chung, C., and Winker, D.: Warming trends in Asia amplifiedby brown cloud solar absorption, Nature, 448, 575–578, 2007.
Remer, L. A., Kaufman, Y. J., Tanre, D., Mattoo, S., Chu, D. A.,Martins, J. V., Li, R.-R., Ichoku, C., Levy, R. C., Kleidman, R.G., Eck, T. F., Vermote, E., and Holben, B. N.: The MODISAerosol Algorithm, Products and Validation, J. Atmos. Sci., Spe-cial Issue, 62, 947–973, 2005.
Ricchiazzi, P., Yang, S., Gautier, C., and Sowle, D.: SBDART, aresearch and teaching tool for plane-parallel radiative transfer inthe Earth’s atmosphere, B. Am. Meteorol. Soc., 79, 2101–2114,1998.
Rothery. D. A., Coppola, D., and Saunders, C.: Analysis of vol-canic activity patterns using MODIS thermal alerts, Bulletin ofVolcanology, 67(6), 539–556, 2005.
Schuster, G. L., Dubovik, O., and Holben, B. N.:Angstrom ex-ponent and bimodal aerosol size distributions, J. Geophys. Res.,111, D07207, doi:101029/2005JD006328, 2006.
Stone, E. A., Lough, G. C., Schauer, J. J., Praveen, P. S., Corrigan,C. E., and Ramanathan, V.: Understanding the origin of blackcarbon in the atmospheric brown cloud over the Indian Ocean,J. Geophys. Res., 112, D22S23, doi:10.1029/2006JD008118,2007.
Tripathi, S. N., Dey, Sagnik, Chandel, A., Srivastava, S., Singh,Ramesh P., and Holben, B. N.: Comparison of MODIS andAERONET derived aerosol optical depth over the Ganga Basin,India, Ann. Geophys., 23, 1093–1101, 2005,http://www.ann-geophys.net/23/1093/2005/.
Tripathi, S. N., Dey, S., Tare, V., and Satheesh, S. K.: Aerosol blackcarbon radiative forcing at an industrial city in northern India,Geophys. Res. Lett., 32, L08802, doi:10.1029/2005GL022515,2005.
van der Werf, G. R., Randerson, J. T., Giglio, L., Collatz, G. J.,Kasibhatla, P. S., and Arellano Jr., A. F.: Interannual variabilityin global biomass burning emissions from 1997 to 2004, Atmos.Chem. Phys., 6, 3423–3441, 2006,http://www.atmos-chem-phys.net/6/3423/2006/.
Vinoj, V., Satheesh, S. K., Suresh Babu, S., and Krishna Moorthy,K.: Large aerosol optical depths observed at an urban locationin southern India associated with rain-deficit summer monsoonseason, Ann. Geophys., 22, 3073–3077, 2004,http://www.ann-geophys.net/22/3073/2004/.
Wang, J. and Christopher, S. A.: Intercomparison between satel-litederived aerosol optical thickness and PM2.5 mass: Implica-tions for air quality studies, Geophys. Res. Lett., 30(21), 2095,doi:10.1029/2003GL018174, 2003.
Wang, S. H., Lin, N. H., Chou, M. D., and Woo, J. H.: Estimate ofradiative forcing and regional feedback of Asian biomass burningaerosols during the period of TRACE-P, J. Geophys. Res., 112,D10222, doi:10.1029/2006JD007564, 2007.
www.ann-geophys.net/28/367/2010/ Ann. Geophys., 28, 367–379, 2010