
Impact of a Fruit and Vegetable Diet Intervention in Young ...
89
Graduate Theses, Dissertations, and Problem Reports 2018 Impact of a Fruit and Vegetable Diet Intervention in Young Adults Impact of a Fruit and Vegetable Diet Intervention in Young Adults with Metabolic Syndrome on Behavior and Gut Microbiome with Metabolic Syndrome on Behavior and Gut Microbiome Rashel L. Clark Follow this and additional works at: https://researchrepository.wvu.edu/etd Recommended Citation Recommended Citation Clark, Rashel L., "Impact of a Fruit and Vegetable Diet Intervention in Young Adults with Metabolic Syndrome on Behavior and Gut Microbiome" (2018). Graduate Theses, Dissertations, and Problem Reports. 5370. https://researchrepository.wvu.edu/etd/5370 This Thesis is protected by copyright and/or related rights. It has been brought to you by the The Research Repository @ WVU with permission from the rights-holder(s). You are free to use this Thesis in any way that is permitted by the copyright and related rights legislation that applies to your use. For other uses you must obtain permission from the rights-holder(s) directly, unless additional rights are indicated by a Creative Commons license in the record and/ or on the work itself. This Thesis has been accepted for inclusion in WVU Graduate Theses, Dissertations, and Problem Reports collection by an authorized administrator of The Research Repository @ WVU. For more information, please contact [email protected].
Transcript of Impact of a Fruit and Vegetable Diet Intervention in Young ...
Graduate Theses, Dissertations, and Problem Reports
2018
Impact of a Fruit and Vegetable Diet Intervention in Young Adults Impact of a Fruit and Vegetable Diet Intervention in Young Adults
with Metabolic Syndrome on Behavior and Gut Microbiome with Metabolic Syndrome on Behavior and Gut Microbiome
Rashel L. Clark
Follow this and additional works at: https://researchrepository.wvu.edu/etd
Recommended Citation Recommended Citation Clark, Rashel L., "Impact of a Fruit and Vegetable Diet Intervention in Young Adults with Metabolic Syndrome on Behavior and Gut Microbiome" (2018). Graduate Theses, Dissertations, and Problem Reports. 5370. https://researchrepository.wvu.edu/etd/5370
This Thesis is protected by copyright and/or related rights. It has been brought to you by the The Research Repository @ WVU with permission from the rights-holder(s). You are free to use this Thesis in any way that is permitted by the copyright and related rights legislation that applies to your use. For other uses you must obtain permission from the rights-holder(s) directly, unless additional rights are indicated by a Creative Commons license in the record and/ or on the work itself. This Thesis has been accepted for inclusion in WVU Graduate Theses, Dissertations, and Problem Reports collection by an authorized administrator of The Research Repository @ WVU. For more information, please contact [email protected].

Impact of a Fruit and Vegetable Diet Intervention in Young Adults with Metabolic Syndrome on Behavior and Gut Microbiome
Rashel L. Clark
Thesis submitted to the Davis College of Agriculture, Natural Resources, and Design
at West Virginia University
In partial fulfillment of the requirements for the degree of
Master of Science in Human Nutrition and Foods
Melissa Olfert, DrPH, MS, RDN; Chair Christopher Cuff, PhD
Oluremi Famodu, PhD, RDN
Department of Animal and Nutritional Sciences
Morgantown, West Virginia 2018
Keywords: Metabolic Syndrome, young adults, healthy diet, MyPlate diet, fruits and vegetables Copyright 2018 Rashel Clark

iv
ABSTRACT
Impact of a Fruit and Vegetable Diet Intervention in Young Adults with Metabolic Syndrome on Behavior and Gut Microbiome
Rashel L. Clark
Background: Metabolic Syndrome (MetS) is a clustering of factors that increases the risk of developing cardiovascular diseases and diabetes [1]. The rates of MetS are on the rise, even among young adults [2]. The primary objective of the Fruvedomics phase 2 study was to determine changes in behavior, cardiovascular, and gut microbiome health in a group of young adults with MetS following an 8-week, free-living, dietary intervention. Methods: The dietary intervention followed the USDA Dietary Guidelines for Americans and focused on increasing fruit and vegetable intake to equal half their diet. University students (18-30 years old) with MetS were recruited on the West Virginia University (WVU) campus. Eligible, consented individuals (n=17) completed baseline measurements, including arterial stiffness, complete blood lipid panel, anthropometric measures, stool sample for microbial analysis, 24-hour diet recall, and body composition. Participants completed an 8-week dietary intervention including weekly consultations with a Registered Dietitian Nutritionist/trained researcher who assessed food logs, food receipts, and adherence to the diet. Results: Two participants were excluded from analysis due to medical or dietary non-compliance (n=15). Fruit and vegetable (p<0.0001), and fiber (0.05) intake did significantly increase over the intervention from 1.7 to 4.6 cups of fruits and vegetables and 16 to 28 grams of fiber. Clinical results yielded an increase in sodium (p=0.002). Erysipelotrichaceae (Firmicute phyla) decreased (log2 fold change: -1.78, p=0.01) and Caulobacteraceae (Proteobacteria phyla) increased (log2 fold change= -1.07, p= 0.01). The dietary intervention resulted in a time by intervention interaction in both the family Actinobacteria and its family taxa, Coriobacteraceae (p=0.033). Conclusion: Overall, implementing a free-living 8-week diet, with intensive education and accountability, gave participants the knowledge, skills, and feedback to improve health behaviors, but did not result in many metabolic and gut microbiome changes. A longer diet intervention may be needed in this population to improve metabolic health.

iv
Acknowledgements This project has been a very large undertaking, and there is no way I would have finished it
without the help and support of many people in my life. First, I would like to thank my chair Dr.
Melissa Olfert for her help and support throughout this graduate program. I am very lucky to
have been mentored by her and my other committee members, Dr. Christopher Cuff and Dr.
Oluremi Famodu, who have helped guide me through the FRUVEDomics research journey. The
entire FRUVEDomics research team has come together to offer up their expertise and time, of
which I will be forever grateful. On top of their help, statistics experts, my fellow colleagues, and
the Lifestyle Intervention Research Lab undergraduate team have also supported me. Of course,
aside from all of this help I would also like to thank my friends and family for being the cheering
section, and motivators through the last two years.
iii

iv
Table of Contents I. Introduction........................................................................................................................................1
Target Population and Significance.....................................................................................................2
Research Aims........................................................................................................................................4
II. Literature Review..........................................................................................................................5
Metabolic Syndrome..............................................................................................................................5
MetS Treatment.....................................................................................................................................7
Microbiome............................................................................................................................................7
MetS Risk Factors and the Microbiome..............................................................................................9
Diet, Microbiome, and MetS...............................................................................................................11
Mediterranean diet.............................................................................................................................12
Dietary Approaches to Stop Hypertension (DASH) diet...................................................................14
III. Methods........................................................................................................................................16
Research Design...................................................................................................................................16
Outcome Measures..............................................................................................................................16
Nutrition and Behavior......................................................................................................................16
Anthropometrics................................................................................................................................17
Clinical...............................................................................................................................................18
Stool Sample Collection and Processing............................................................................................18
Diet Intervention..................................................................................................................................19
Statistical Analysis...............................................................................................................................21
Diet and Anthropometrics..................................................................................................................21
Microbiome Changes.........................................................................................................................22
Diet and Microbiome.........................................................................................................................22
Power Analysis..................................................................................................................................23
IV. Peer Review Manuscript.............................................................................................................24
2.1 Research Design........................................................................................................................28
2.3.1 Nutrition and Behavior.............................................................................................................30
2.3.2 Anthropometrics and Cardiovascular Measurements...............................................................30
2.3.3 Blood and Stool Sample Collection/Processing........................................................................32
3.1 Diet and Anthropometrics..........................................................................................................33
3.3 Diet and Microbiome.................................................................................................................34
3.4 Power Analysis..........................................................................................................................35
Future Implications.............................................................................................................................47
References.................................................................................................................................................49
iv

iv
Appendices...............................................................................................................................................56
Appendix A: Tables.............................................................................................................................56
Appendix B: Figures............................................................................................................................62
...............................................................................................................................................................62
Appendix C: Cost of Diet Intervention Manuscript.........................................................................67
v
iv
List of Tables Table 1: Demographic and health related characteristics of the study population. Table 2: Sleep, physical activity, and stress means and standard deviations (n=15). Table 3: Intervention effects on daily dietary factors across the duration of the study on compliant individuals (n=15). Table 4: MetS risk factors in each participant at the screening, pre-intervention, and post-intervention (n=15; female n=9, male n= 6). Table 5: Intervention effects on clinical measures at pre- and post-intervention on compliant individuals (n=15). Table 6: Intervention effects of gut microbial changes and their relationship with dietary and anthropometric variables (n=
vi
iv
List of Figures Figure 1: Consort diagram of participants from recruitment to statistical analysis. Figure 2: Variables with significant changes over the intervention including: (A) fruit and vegetable (cups), (B) fiber (grams) mean, and (C) insoluble fiber (grams), and (E) empty calorie intake mean across the entire study with standard error bars (n=15). Figure 2: Phyla bacterial taxa plot for all individuals’ pre and post with all identified bacteriabefore filtering. Figure 3: Phyla bacterial taxa plot for all individuals’ pre and post with all identified bacteria, before filtering. Figure 4: Interaction of dietary fat (%) and intervention (pre and post) on Coriobacteraceae. Figure 5: Interaction of empty calories and intervention (pre and post) on Clostridiales cluster.
vii

1
I. Introduction
Humans have 350 trillion microbial cells, or 10 times the number of human cells [3]. The
microbial cells that reside in the human gut are termed the gut microbiome, microbiota,
microbes, or bacterial cells. These microbes serve several key functions in digestion and
metabolism. First, the gut bacteria maintains the integrity of the intestinal epithelial barrier,
which offers protection from bacterial colonization [4]. Secondly, the microbiome plays a key
role in the regulation of the intestinal tract through metabolizing otherwise indigestible
polysaccharides, fat, protein, and vitamins. During the metabolic process, bacterial fermentation
occurs, which affects the deposition of triglycerides in adipocytes [5]. These roles make
microbes integral in the amount of energy absorbed from the diet. [4-6].
The microbiome’s role in metabolism of nutrients and energy harvest has led to recent
research on its connection to the obesity epidemic and related diseases. It is estimated that 600
million people around the world are obese, with an additional 1.9 billion overweight individuals
[4]. The increase in obesity is the result of genetic and environmental factors, with the shift in
eating habits to a fat-enriched, refined carbohydrate diet being a modifiable risk factor [7]. Aside
from energy absorption and weight status, research has investigated the link between microbial
interactions with health through the suppression of pathogens, impact on blood lipids, and
metabolic disorders, such as the Metabolic Syndrome (MetS) [6].
MetS encompasses five factors, which increases the risk for heart disease, type 2
diabetes, and stroke [1]. These five factors include the following: waist circumference >102cm
(men), >88cm (women); serum triglycerides ≥150mg/dL; serum HDL <40mg/dL (men),
<50mg/dL (women); blood pressure ≥ 130/85mm Hg; and fasting blood glucose ≥100mg/dL [8].
To be diagnosed with MetS, an individual must have, or be taking medication for at least three of
2
the factors according to the National Cholesterol Education Panel Adult Treatment Panel (NCEP
ATP) III and the more factors a person presents with, the higher their risk for chronic diseases
[8]. Being diagnosed with MetS is closely linked with overweight, obesity, low physical activity,
insulin resistance, family history, genetics, and older age [9, 10]. With prevalence of MetS on the
rise, possibly due to increasing obesity, it is important to determine strategies to prevent this
continued increase [1].
The NCEP-ATP III states treatment of MetS is through modification of lifestyle factors
such as weight control, increased physical activity, and dietary changes. Examples of dietary
modifications include lowering saturated fat, cholesterol, and calories through increasing fruits,
vegetables, and whole grains [10, 11]. These dietary modifications have been shown to improve
metabolic health [12, 13], weight status, as well as the health of the microbiome [4]. Since both
the MetS and gut microbiome are impacted by dietary intake, it can be useful to study the fecal
matter of individuals making dietary changes to determine how the diet is impacting their
digestion and biochemical reactions [14]. Using dietary strategies to improve the bacterial
diversity of the gut microbiome is one possible strategy for treatment of MetS and its related
comorbidities [15].
Target Population and Significance
Since rates of MetS typically increase with age, primary prevention for the comorbidities
related to MetS should be started at an early age [16]. However, MetS is often undiagnosed in
the young adult population (age 18-30) [17]. Thus, the young adult population is an optimal time
to engage in primary prevention strategies to reduce future risk of disease [18, 19]. Treatment
recommendations from the NCEP-ATP III focus on primary prevention of those with multiple
coronary heart disease (CHD) risk factors, such as people diagnosed with MetS [16]. However,
3
many young adults do not engage in these practices, such as healthy dietary changes [20]. In fact,
the annual American College Health Association survey found only 4.2% of college students
were eating the recommended 5 or more servings of fruits and vegetables daily [21].
Deficiency in some of these dietary guidelines can lead to increased energy intake and
weight gain in this population. For example, young adults have been found to weigh more, and
are more likely to gain weight than any other age cohort, with a weight gain of 15kg in the
fifteen year timespan of young adulthood [20, 22]. Of those that gain weight and are considered
overweight, less than 10% lose enough weight to return to a healthy weight classification later in
life. Furthermore, the development and persistence of increased weight status during this time
period is indicative of health and onset of chronic diseases later in life [23].
With the need to improve dietary intake among young adults with suboptimal health
behaviors [24], education-based dietary interventions are one way to help improve lifestyle
behaviors and decrease risk of further CHD events [25]. The combination of a motivated
individual and appropriate behavioral support can result in a positive dietary change [26].
Individuals that place high importance on nutrition have lower energy intake, consume more
fruits and non-starchy vegetables, read food labels, and engage in weight reduction strategies
[27]. In meta-analyses, motivational interviewing has been found to be an effective strategy to
change behavior in weight loss [28] and clinical outcomes such as blood pressure and cholesterol
levels [29]. Motivational interviewing is a collaborative conversation between a client and coach
intended to strengthen the client’s own motivation and commitment toward behavior change
[30]. An education-based diet intervention, that uses motivational interviewing techniques,
could be an appropriate format to educate young adults and provide them strategies to improve
their nutrition intake during their transition to adulthood. These diet behavior improvements can
4
then link to improvements in gut microbiome health which is linked to better overall health and
decreased risk of chronic disease.
Research Aims
Specific Aim 1.0: Increase fruit and vegetable consumption using an 8-week, education-based,
free-living diet intervention in young adults (18-30 y/o) with MetS.
Hypothesis 1.1: An education based, free-living diet intervention will increase fruit and
vegetable consumption.
Specific Aim 2.0: Determine the impact of increased fruit and vegetable consumption on gut
microbiota in young adults with MetS.
Hypothesis 2.1: Increased fruit and vegetable consumption will change the relative
amounts of bacteria in the gut microbiome.
5
II. Literature Review
Metabolic Syndrome
A diagnosis of MetS is associated with an overall increased risk for development of
chronic diseases like cardiovascular disease (CVD), diabetes and stroke. From 1988 to 2012, the
National Health and Nutrition Education Survey (NHANES) data shows an increase in
prevalence of MetS among all adults by 5% (25.3%-34.2%) [16, 31]. A MetS diagnosis has been
found to double the individual’s risk of CVD, and CVD mortality and stroke, while increasing
risk of all cause mortality by 1.5 times [32, 33]. Development of Type 2 Diabetes Mellitus is also
increased by five times in this population [34]. This increase of prevalence to more than one-
quarter of the North American population [31] further indicates MetS as an increasing health
concern due to its resulting disease burden [17].
MetS has been heavily studied in the middle and older age populations and was considered a
cluster of risk factors that occurred in older age. However, little research has been conducted on
young adults despite increasing prevalence in individals aged 20-39 [2, 35, 36] [37]. In addition
to U.S. statistics, the prevalence of MetS amongst young adult Asian Indians (10%) [38], and
Latin American individuals (5-10%) [35] have followed similar trends. Morrell et al. determined
that 8% of college students at three different universities met the criteria for MetS [36]. These
findings suggest that regardless of location, region, or nationality, the prevalence of MetS among
young adults is increasing. This is especially concerning for a young adult population because
MetS is associated with increased chronic disease burden throughout the lifespan [2].
Defining the prevalence of MetS can be challenging because of the different definitions of
MetS used. The following organizations have put forth MetS diagnosis criteria: World Health
Organization (WHO), NCEP-ATP III, International Diabetes Federation (IDF), and the

6
American Heart Association/National Heart, Lung, and Blood Institute [39]. For decades there
has been a consensus of MetS encompassing at least three of the following risk factors:
dyslipidemia (high triglycerides and low HDL), hypertension, abdominal obesity, and elevated
fasting glucose [39]. Of these risk factors, hypertension and abdominal obesity are most
frequently used when comparing data in the Global Disease Study from 2000 to 2013. These risk
factors indicate there is a shift in non-communicable diseases having impact on disability-
adjusted life-years [40].
Ravikiran et al. [38] used these different definitions in determining the prevalence of
MetS to determine how rates would differ based on the different organization’s criteria in a
young adult population. Rates of diagnosed MetS based on definitions varied slightly: ~36%
(NCEP-ATP III), ~40% (International Diabetes Federation; IDF), and ~45% (modified NCEP
ATP III) diagnosed via the differing criteria. This indicates the NCEP-ATP III to be the least
conservative definition, and the modified NCEP-ATP III to be the most conservative in this
particular population. Even though the same risk factors are used in each definition, the largest
variance is likely to be found in waist circumference [2]. IDF requires the presence of abdominal
obesity, as well as two of the other criteria. Both of the criterias from NCEP use waist
circumference as one of the five risk factors, and the modified NCEP-ATP III recommends the
use of ethnic specific waist circumference measures [41]. In 2009 the IDF Task Force on
Epidemiology and Prevention, National Heart Lung and Blood Institute, American Heart
Association, World Heart Federation, International Atherosclerosis Society, and the International
Association for the Study of Obesity came to a consensus regarding the MetS criteria, and it
matches the NCEP-ATP III with waist circumference recommendations, while adding regional
and ethnic specificifications [39].
7
MetS Treatment
Treatment and prevention recommendations for MetS focus on therapeutic lifestyle
modifications [42] (health education, diet, exercise, etc.) and pharmacotherapy [8] [42]. In order
for this treatment to be cost effective, this approach requires health care providers to educate,
motivate, and encourage compliance from patients [8]. Diet is a modifiable risk factor [43] and
an effective target for lifestyle interventions in young adults [44].
Many national organizations recommend a healthy diet (high in vegetables and fruit, and
low in saturated fat and cholesterol) for the prevention of chronic diseases and management of
conditions, such as MetS,[33, 45, 46]. The United States Department of Agriculture (USDA)
Dietary Guidelines for Americans recommends half the plate consist of vegetables and fruit,
while also focusing on lean proteins, whole grains, and low-fat dairy [45]. The American Heart
Association (AHA) and American College of Cardiology agree with those recommendations in
addition to a diet with a variety of foods like fish, legumes, non-tropical vegetable oils and nuts,
while limiting intake of sweets, sugar-sweetened beverages and red meat [46]. Individualized
nutrition prescription for patients offers a promising approach to cost effective treatment to
improve metabolic health [47]. Alongside changing dietary patterns to improve metabolic health,
increasing research has studied the effect of the second genome, or gut microbiota.
Microbiome
The gastrointestinal tract has unique structures, functions, and motility, making it’s
environment capable of harboring various microbial communities [48]. This gut microbiome has
been described as another organ within the human body with cells that communicate, are
involved in energy distribution and storage, and can maintain and repair themselves [49].

8
Metagenomic sequencing of the gut microbiome have found 1,000- 1,150 prevalent bacterial
species [50]. While these numbers may be vast, the phyla division is quite low, with ̴ 90% of gut
bacteria being classified within the Bacteriodetes and the Firmicutes [6, 49, 51]. Other dominant
bacteria include Proteobacteria [49] and Actinobacteria [52]. Research regarding these two
dominant phyla and their role in the human body has been abundant. Firmicutes have been found
to comprise more than 200 different gram positive genera, while Bacteriodetes only have about
20 genera of gram negative bacteria [4]. Bacteriodes and Bifidobacteria are the main species
which maintain the integrity of the epithelial barrier, but Lactobacillus, Escherichia coli, and
Enterococcus also contribute to this protective layer [53].
The variation of the gut microbiota is associated with host genotypes and age, as well as
external factors including diet, antibiotics, prebiotics, and probiotics [6]. Despite these various
influences, research still indicates the microbiota is largely similar amongst adults [54]. The
health of the gut microbiome depends on the balance maintained between the microbial elements
which is influenced by defensins (an antimicrobial protein) that favor certain bacteria over others
[48]. Dysfunction, or reduced bacterial diversity, in these host genes can lead to an increased risk
of MetS, hypercholesterolemia, enteral inflammation, and other cardiovascular issues[6, 55].
One important consideration in determining an individual’s gut microbial diversity is that
different microbial species have preferred functions. Thus, the distribution of bacteria will rely
on the external factors listed above [6]. Diet is considered an external factor because the
microbiota works to metabolize certain nutrients [4]. The microbiome will change in response to
the nutrients provided by an individual’s long-term dietary patterns [5]. The study of the gut
microbiome through fecal extract gives information regarding the interaction of the host and gut
microbiota in digestion and biochemical reactions [14]. To further determine best treatment
9
strategies, the next section will discuss the relevant literature on how lifestyle changes and the
microbiome influences the individual factors of MetS.
MetS Risk Factors and the Microbiome
Management of the MetS aims to improve each of the individual components of the
syndrome [33]. For MetS it is important to determine what this cluster of factors looks like,
specifically in the young adult population. Determining the make up of the disease in this
population could help identify better treatment and intervention strategies [2].
A pooled analysis completed by Nolan et. al determined the prevalence of MetS and its
five components amongst young adults [2]. This review of 34 studies included 26,609 young
adult participants and determined the prevalence of MetS components using the three widely
used criteria: NCEP-ATP III, American Heart Association/National Heart, Blood and Lung
Institute, and the IDF. Depending on the definition used, MetS prevalence was between 4.8%
and 7%. Regardless of the criteria used, low HDL was the most prevalent component (26.9%-
41.2%), followed by high blood pressure (16.6%-26.6%), abdominal obesity (6.8-23.6%), high
triglycerides (8.6-15.6%), and high fasting glucose (2.8-15.4%) [2]. In this sample, the overall
prevalence of MetS was closely distributed, however some of the individual components had a
wide distribution. The most widely distributed risk factor, abdominal obesity, may be attributed
to the fact that some studies measured waist circumference using ethnic specific
recommendations.
Using NHANES data, Moore et al. found that of the five MetS factors, waist circumference
has increased the most over time (1988-2012) with a 19% increase in men, and a 22.7% increase
in women [16]. This increase is a health concern because excess weight relates to changes in the
10
lipid profile, increased blood pressure, and hyperinsulinemia [56]. These factors all contribute to
the increased burden of cardiovascular diseases, diabetes, and certain forms of cancer [57].
The microbiome has been implicated to play a role in the development of obesity [4, 6].
Connections between increased energy harvest, weight gain, and the gut microbiome have been
found in both animal [58] and human studies [59]. Its contributions to obesity is likely linked by
its role in diet through the regulation of the intestinal tract by metabolizing otherwise indigestible
polysaccharides, fat, protein, and vitamins, as well as bacterial fermentation [4, 6]. The result of
the fermentation process are the short chain fatty acids (SCFAs)- acetate, propionate, and
butyrate. SCFAs are used for lipid or glucose synthesis which can then be used as an source of
energy [6, 59], making them integral in the amount of energy absorbed from the diet [4].
Much of the research connecting weight and the gut microbiome began with the focus on
the prevalence and ratio of Firmicutes to Bacteriodetes [5]. In milestone data collected by
Turnbough et al. it was determined that obesity correlates with a microbiome higher in
proportions of Firmicutes [58]. However, a study conducted by Schweitz et al. did not find this
link with those particular phyla [59]. In a group of 98 individuals, those who were overweight or
obese had higher proportions of Bacteriodetes (46.8%, 45% respectively) compared with lean
individuals (22.9%), and a lower amount of Ruminococcus flavefaciens (part of the Firmicute
subgroup) and Methanobrevibacter [59]. Regardless of the variations in microbiota both studies
showed an increased ability for energy harvest and production of short chain fatty acids in the
obese phenotype [58, 59].
These findings suggest the relationship between obesity, nutrition, and the microbiome is
more complex than a simple ratio of two bacterial families [5]. Poor diet quality [44], and the
shift in eating habits to a fat-enriched, refined carbohydrate diet are key predictors in obesity
11
[60]. Implementing dietary changes for manipulation of gut microbiome content is a potential
form of therapy to improve health status [5]. Thus, improving nutritional status is an area which
can both improve weight and gut microbiome health [44].
The American Heart Association reports one third (80 million) of U.S. adults have
hypertension (HTN) [48]. As blood pressure increases, the risk of CVD and other heart related
problems also increases. A reduction of blood pressure is critical to decrease the burden of these
chronic diseases [61]. The INTERMAP epidemiological study across populations in China,
Japan, the UK, and USA investigated metabolites from dietary, gut microbial, and host
metabolism across these populations determined an inverse association between blood pressure
and formate (by-product of gut microbial fiber breakdown) [62]. Recommendations to decrease
blood pressure and other MetS risk factors include lifestyle modification strategies [33, 61]. One
effective treatment and prevention of these risk factors are closely related to different dietary
patterns to be discussed in the section below.
Diet, Microbiome, and MetS
Diet quality is inversely related to systolic and diastolic blood pressure, triglycerides, and
high BMI [44]. In determining the recommended dietary therapeutic lifestyle intervention, it is
important to consider that people do not eat isolated nutrients [63]. There are many competing
and interacting factors when a diet is consumed with several nutrients and foods [64]. Thus,
while studies focusing on specific nutrients can be useful for mechanistic understanding, a more
holistic dietary pattern may be more clinically useful [64] when recommending a dietary pattern
and has shown better compliance than recommendations to increase isolated nutrients. Dietary
patterns have been associated with positive results in the management and prevention of diseases
12
[65]. The following paragraphs will examine several of the researched dietary patterns and their
effect on both the gut microbiome and its relation to MetS.
Western Diet
Studies using mice prone to the physiological changes in MetS have found relationships
between what is considered the western diet (high fat, high sugar) and resulting inflammation
and microbial diversity [60, 66]. In comparing germ free and conventionalized mice it was found
that germ free mice had better protection against diet-induced obesity compared with
conventional counterparts [67]. When high fat versus control diets were compared on MetS
prone genotype, it was determined that a high fat diet impaired glucose tolerance, had no
Bifidobacteria, and showed the presence of Desulfovibrianaceae [68]. Results of the study by
Cani et al. indicate a high fat diet yields many of the same biomarkers caused by inflammation as
indicated by the higher levels of inflammatory markers compared to the lipopolysaccharide
infused mice. This suggests a high fat diet can increase inflammation, and insulin resistance
resulting in changes in the gut microbiome (decreased Bifidobacterium, E. rectale/c. coccoides,
and Bacteroides), which are all indicators of MetS [60]. Ussar et al. further studied how MetS
factors and the microbiome were affected from a high fat diet for 3-6 generations. In these
studies it was found that mice inflammation tended to remain through generations, regardless of
diet [66].
Mediterranean diet
The Mediterranean diet has been associated with decreased risk of MetS [69]. A
Mediterranean diet typically consists of: high amounts of vegetables, fruits, legumes, whole
grains, monounsaturated/saturated fat ratio; moderate wine intake; and low in red and processed
13
meats [70, 71]. Length of dietary maintenance in studies varies widely from a short intervention,
to following a cohort through most of their adulthood.
In a 25-week education based, free-living diet intervention the Mediterranean diet
improved anthropometric, dietary, and metabolic measures in participants. [12]. A one-year
prospective study of older adults with high-risk of CVD randomized participants to
Mediterranean diet with added olive oil or nuts, and a control (low fat) diet. Those on the
Mediterranean diet experienced a decrease in triglycerides, blood pressure, and waist
circumference compared to the control [72]. Esposito et al followed MetS patients for two years
that followed either the Mediterranean diet, or diet consisting of 50%-60% carbohydrates, 15%-
20% protein, and less than 30% fat. Patients in the Mediterranean diet experienced greater
weight loss, reduced serum concentrations of human serum C-Reactive Protein (hsCRP),
decreased insulin resistance, and an improved endothelial function score in comparison to the
control diet. At the end of the study 40 patients in the intervention group still had MetS features,
compared to 78 patients in the control group [73]. In a 5-year follow-up of the ATTICA study
adherence to the Mediterranean diet decreased risk of development of CVD after adjustment of
potential confounding factors [74].
Two large cohort studies (CARDIA and SUN) determined incident MetS in a cohort
study based on Mediterranean adherence diet scores determined through a questionnaire. Both
studies found a lower incidence of MetS amongst those with a higher Mediterranean diet score
[65, 71]. However, no baseline demographics were given with the SUN study [65]. The
CARDIA study specifically looked for correlations in the young adult population (18-30) by
following them over a 25-year time period to determine CVD incidence [71].
14
Overall, these studies indicate a Mediterranean diet can decrease risk of MetS and CVD
in those at-risk of developing these chronic diseases [72]. This dietary pattern can also help
improve the metabolic health of those already diagnosed with MetS, especially if followed as a
long-term dietary pattern[71].
Dietary Approaches to Stop Hypertension (DASH) diet
The DASH diet was developed to help control mild elevations of blood pressure. It
consists of alcohol moderation, sodium reduction, and increased consumption of fresh fruits and
vegetables and low-fat dairy products [33]. After 6 months of adherence to the DASH diet,
prevalence of the MetS significantly decreased (p<0.05) compared with the weight-reduction and
control diets. At the end of the six months, there was a 65% prevalence of MetS in the DASH
diet, 81% in the weight reducing, and 100% in the control group. The DASH diet also yielded
favorable effects on blood pressure and blood lipids [9].
Fruits and Vegetables
The increased consumption of fruits and vegetables, as seen in both the Mediterranean
style and DASH diet has also been researched to determine its impact in the gut microbiome. To
determine if the macronutrients of a high fruit and vegetable diet affect the microbiome, the
microbiota of 105 vegans and 144 vegetarians were analyzed at one time point in comparison to
omnivore controls. When comparing vegans versus vegetarians there was no significant
difference found in any of the measurements. On the other hand, vegetarians had significantly
lower microbial counts of Bacteroides (p< 0.001) and Bifidobacterium (p< 0.001) compared to
controls. Vegans compared to controls also had significantly lower Bacteroides and
Bifidobacterium, but differed in having lower Enterobacteriaceae. The results indicated that the

15
vegan and vegetarian diet which is generally higher in carbohydrates and fiber could play a role
in the gut microbial content [53].
Most studies conclude diet to be the main predictor of microbial content [66, 68]. A study
of 10 human subjects found a shift in microbiota 24-hours following a dietary change, although
this amount of time was not enough to change the dominant phyla [75]. Research suggests a diet
composed of high amounts of fruits and vegetables can positively affect the metabolic and
microbial content of individuals. This information can be further explored to determine how a
dietary change focusing on fruit and vegetable intake can influence the clinical symptoms of
MetS in the young adult population. This study will enroll young adults in a diet intervention
focused on increasing fruit and vegetable intake to determine how it will further impact
metabolic and gut microbiome health.
16
III. Methods
Research Design
Ethical approval was obtained from WVU Institutional Review Board and informed
consent was collected from each subject prior to enrollment in the study. Young adults
completed a diet intervention at West Virginia University (WVU) in the fall of 2016 (Clinical
Trials Record NCT03115866). Recruitment occurred through word of mouth, flyers posted
around campus, announcements in classrooms, and emails to the student body.
Eligibility criteria included the individuals to be free from chronic disease, have no
diagnosis or treatment of a serious mental or behavioral disorder within the past year, and not be
pregnant, no antibiotic use for the past six months, and be diagnosed with MetS. NCEP ATP III
was used to diagnosis the participants, where they needed to have three of the following risk
factors: waist circumference >102cm (men), >88cm (women), serum triglycerides >150mg/dl,
serum HDL <40mg/dl (men) <50mg/dl (women), blood pressure ≥130/85mm Hg, and fasting
blood glucose ≥ 100mg/dl [76]. Pre-screening first involved a phone interview, followed by an
in-person anthropometric and finger stick blood screening. Participants were also required to
agree to be compliant with the diet for 8-weeks. After consenting to the study, participants were
required to adhere to the diet for 8-weeks.
Outcome Measures
Nutrition and Behavior
Clinical and nutrition history was obtained by a trained researcher. An in-person assessment
and a 120-questionnaire survey were administered prior to beginning the 8-week diet
intervention, and again at the end of the intervention. Data on sleep hours, stress, and diet were
collected before and after the 8-week intervention using the Pittsburgh Sleep Quality Index
17
(PSQI) [77], Cohen’s Perceived Stress Score [78], and the National Cancer Institute’s (NCI)
Fruit and Vegetable Screener [79], respectively.
Physical activity was measured by participants wearing an accelerometer (ActiGraph
GT3X, Actilife 6.0 Software, Pensacola, FL) around their waists for one week pre- and post-
intervention. Specific instructions were provided based on manufacturer’s guidelines.
Participants were required to wear the device for at least three days. Non-wear time was defined
as ≥60 repeated minutes of zero activity counts. Average steps per day were calculated using age
specific cut-points by Freedson et al. cut-points [80]. Participants were instructed to keep
physical activity, stress, and sleep hours consistent throughout the study to ensure that the diet
was the main intervention.
Anthropometrics
The following anthropometric measurements were taken by a trained researcher while the
participant was wearing minimal, tight-fitting clothing, with no shoes. Weight was measured
using a digital scale (SECA 874) and recorded to the nearest 0.1kg. All other measurements were
taken twice, averaged, and recorded to the nearest 0.1cm. Height was measured using a
Stadiometer (SECA 213) with the participant in a standing position with their shoulders relaxed
and the subject facing forward, looking straight, and back against the wall. Waist circumference
was measured at the narrowest point, and hip circumference was measured at the maximum level
using a Gulick tape meter. Neck circumference was measured at the base of the Adam’s apple
with the head facing forward. Body mass index (BMI) was calculated and expressed in kg/m2.
Body composition was taken using a BodPod (CosMed USA Inc., Chicago, IL).

18
Clinical
Ten-hour fasting blood samples were collected by venipuncture, allowed to coagulate at
room temperature for 30 minutes and then centrifuged 3,400 × g for 10 min at 4°C. Following
this process, serum was decanted and stored at -80°C until analysis. Assays for a complete
metabolic panel (triglycerides, high density lipoprotein, total cholesterol, glucose) with addition
of Hemoglobin A1c and C - reactive protein (CRP) were performed by the WVU’s Ruby
Memorial Hospital Clinical laboratory and measured by commercially available enzymatic
reagents. Blood pressure was measured twice using an Omron digital blood pressure cuff with a
two-minute interval between measurements after the subject sat up straight for five minutes with
relaxed, un-crossed legs.
Stool Sample Collection and Processing
The Easy Sampler stool kits (ALPCO, Salem, New Hampshire) were used to collect fecal
samples from each participant. The samples were frozen within 2 hours of collection, and stored
at -80° C for later processing. A direct PCR approach was used to isolate DNA and amplify
bacterial DNA for sequencing using the Extract-N-Amp Plant PCR kit (Sigma-Aldrich, Inc) as
described [81]. DNA from fragments of fecal samples (100mg) were diluted 1/600 in RNAse
DNase free water for PCR amplification.
The PCR primers for the V3 to V4 regions of the 16S ribosomal RNA were used as
described [82]. Bacterial DNA was amplified on a Techne Genius Model FGEN02TP Thermal
Cycler usng the Extract-N-Amp kit following manufacturer’s instructions with the following
modifications: PCR conditions were: 95° C for 6 minutes to denature; 95° C for 2 minutes, 50° C
for 2 minutes, 72° C for 2 minutes for 30 cycles; 72° C for 4 minutes; 0.5 µM forward primer,
0.5 µM reverse primer and DNA in a total volume of 60 µL samples, amplified in triplicate, and
19
reaction products were pooled prior to purification. PCR products were purified with Ampure XP
beads (Beckman Coulter Life Sciences, Indianapolis, IN) per manufacturer’s instructions [83].
Paired end sequencing was performed using an Illumina MiSeq (San Diego, CA) in the
Genomics Core Facility at WVU and then paired ends were merged with FLASH (fast length
Magoc and Slazberg Bioinformatics 27:21). Quantitative Insights Into Microbial Ecology
(QIIME v1.9.1 http://qiime.org) [84] was used to split the libraries and pick open-reference
taxonomic units (OTUs) at 97% similarity. OTUs were first filtered by excluding those below a
minimum threshold count of 500, then summed and normalized to relative abundance at all
taxonomic levels [83]. Gut bacteria were then excluded if <17% of the samples had an
abundance of <0.005. Sequence analysis was performed as described below.
Diet Intervention
Participants had to score in this compliance range for six of the eight intervention weeks.
This was determined by an affirmative answer to the following question: “Are you willing and
able to adhere to a nutritional intervention consisting of half your plate of fruits and vegetables
for eight weeks?” Participants received a diet plan consisting of 50% fruit and vegetable intake
and caloric recommendations based on weight maintenance, age, and physical activity in
accordance with the USDA Dietary Guidelines for Americans. The recommended portions for
each food group were calculated for each participant using USDA MyPlate prior to the start of
the intervention from the computer software Nutritionist ProTM (Axxya Systsems LLC,
Redmond, WA). Each participant attended a 2-hour education session, led by a Registered
Dietitian Nutritionist, prior to the start of the intervention to receive materials and tools to help
achieve their personal diet recommendations.
20
During the intervention, participants were required to attend a weekly, 1-hour counseling
session with a trained nutrition researcher. These counseling sessions utilized motivational
interviewing techniques to encourage client-led goal setting. Participants provided daily food and
activity logs, food receipts, and food pictures at this time. These were used to help researchers
determine diet compliance and aid in developing strategies to improve their diets. Each week
participants were asked, “Which day depicts the most common eating habits from the week?”
The day reported was used to analyze food components for macronutrients, fiber, sugar, empty
calorie, and fruit and vegetable consumption using Nutritionist Pro analysis software.
Compliance to the diet was based on participants consisting of at least 50% fruits and
vegetables. Participants were asked, “Rate yourself on a scale of 0-100, how often did you
maintain the diet?” The researcher would also rate the participant based on their dietary food log
and counseling session. A combined and averaged score of 75 or higher, as well as the
Nutritionist Pro report of 4-5 servings a day was determined to be diet compliant each week. At
this point, exclusion from the analysis included any significant changes in sleep, stress, physical
activity, medication changes, use of antibiotics or steroids, and non-compliance to the dietary
recommendations.

21
Statistical Analysis All continuous outcome distributions were examined for goodness-of-fit by Shapiro-
Wilk W-test and when lack of normality was found, those variables were transformed.
Benjamini-Hochberg was used to control type I error rate during multiple analyses, using false
discovery rate at 10% for all analyses unless otherwise stated. All analyses were completed
using JMP 13.0 (JMP, Version Pro 13.2, SAS Institute Inc., Cary, NC, Copyright ©2016), SAS
9.3 (SAS, Version 9.3, SAS Institute Inc., Cary, NC, Copyright ©2002-2012), and R (R Core
Team (2013), Vienna, Austria. URL: http://www.R-project.org). A p-value less than 0.05 was
considered significant, and data are presented as mean ± standard deviation (SD) unless
otherwise stated.
Diet and Anthropometrics Transformations were: log-transformation (fiber, sugar, CHO grams, fat grams, dietary
cholesterol, monounsaturated fat, and polyunsaturated fat, CRP, LDL, total bilirubin, and ALT),
or reciprocal square (AST). A repeated measures analysis of variance (ANOVA) was used to
assess differences in weekly collected dietary data over the 8-week study. Week (referred to as
intervention, accrued over the 8 weeks) was used as repeated effect (week 0-8) in the model.
Dietary values were also tested with a specific contrast (week 0 vs. week 8, representing pre-
intervention and post-intervention). Matched pairs t-test was used to determine differences in
survey, clinical, and anthropometric measures between pre-intervention and post-intervention.
Soluble, insoluble, and CRP data had unusual distributions difficult to normalize with
transformations so a non-parametric matched test Wilcoxon Signed Rank test. An analysis of
covariance (ANCOVA) was conducted to determine effect of sex and their interactions on
dietary anthropometric and clinical variables.
22
Microbiome Changes Changes in the microbiome from baseline to post intervention were assessed using a
generalized linear model, DESeq2, where counts are modeled using a negative binomial
distribution with a fitted mean, an OTU-specific dispersion parameter, and a Bonferroni
adjustment.
Diet and Microbiome An arcsine square root transformation of the microbiome abundance was used for the
linear regression and statistical test modeling of diet, anthropometrics, and demographic
variables. Relationships of microbial phyla and families with dietary and anthropometric
variables were assessed using a stepwise multiple linear regression. Only dietary and
anthropometric variables that changed significantly over the intervention were used in the model.
Influential observations were examined using the studentized residuals, with values greater than
two being eliminated from the particular model in one round of screening. Below are the
equations used, and the order of statistical analysis.
1. Relationships of dietary and anthropometric measures with each microbial operational
taxonomic unit (OTU) were initially screened by stepwise regression: (1)
p_OTUi = µ + Dietary (D) and Anthropometric (A) variables + Ɛ, where p_OTUi is
a proportion of specific OTU examined, µ is the mean response, and Ɛ represents
random error terms.
2. Specific dietary and anthropometric factors found significant in primary regression
analysis (1) for each OTU were entered into the secondary model to examine their
effect and the effect of intervention (pre and post) and their interaction by ANCOVA:
(2)
p_OTUi = µ + D and A (from 1) + Intervention + D and A * Intervention + Ɛ
23
3. Microbial changes were then further assessed to determine if corresponding phyla, or
family taxa were related to each other. This was completed in a stepwise regression
done separately for phyla and family levels: (3)
p_OTUi = µ + p_OTUk-1 + Ɛ, where p_OTUk-1, where p_OTUk-1 represents
proportions of all other phyla or families.
4. The bacterial families with significantly related dietary or anthropometric factors were
added into the model to determine if diet or the gut microbiome had greater impact on
OTU change: (4)
p_OTUi = µ + p_OTU k-1 (from 3) + p_OTU * intervention + Ɛ
5. The dietary and anthropometric variables from (2) and the OTU from (4) were then
entered into an ANCOVA model: (5)
p_OTUi = µ + D and A (from 2) + Intervention + D and A * Intervention + p_OTU
(from 3) + p_OTU * intervention + Ɛ
Power Analysis A post-hoc power analysis was completed for a one-sided, paired sample t-test with 15
participants. The variables used were fruit and vegetable intake, and n umber of MetS factors
change from pre- to post-intervention. The fruit and vegetable intake change was computed to
66.5%, while the power of detecting change in the number of MetS factors was approaching
100%. Another strategy to determine power is by calculating effect size, or Cohen’s d. Using this
technique fruit and vegetable intake was computed to 0.81, while number of MetS risk factors
was 1.41, which are both indicative of large effect sizes.
24
IV. Peer Review Manuscript
Educational Intervention Alters Diet Composition and Gut Microbiome in Young Adults with Metabolic Syndrome
Components Rashel L. Clark1, Oluremi A. Famodu1, Ida Holásková2, Aniello M. Infante3, Matthew W.
Duespohl7, Pamela J. Murray4,5, I. Mark Olfert5,6, Paul D. Chantler5,6, Joseph W. McFadden1, Marianne T. Downes7, Christopher F. Cuff8*, Melissa D. Olfert1*
*Co-senior author
West Virginia University, 1Division of Animal and Nutritional Sciences, Davis College of Agriculture, Natural Resources and Design; 2Office of Statistics, Agriculture and Forestry Experiment Station; 3Genomics Core Facility; 4Department of Pediatrics, School of Medicine; 5Clinical and Translational Sciences; 6Department of Exercise Physiology, School of Medicine; 7Division of Medical Laboratory Sciences, School of Medicine; 8Department of Microbiology, Immunology, and Cell Biology, School of Medicine; Morgantown, WV 26506
25
Abstract Background: The primary objective of the FRUVEDomics study was to determine changes in the diet, gut microbiome, and cardiovascular health of young adults with/at-risk for MetS following a fruit and vegetable-based dietary intervention. Methods: The 8-week dietary intervention adhered to the USDA Dietary Guidelines for Americans and focused on increasing fruit and vegetable intake to equal half of the diet. Seventeen eligible young adults with/or at high-risk of MetS, consented and completed pre- and post-intervention measurements, including anthropometric, body composition, cardiovascular, complete blood lipid panel, and collection of stool sample for microbial analysis. Participants also attended weekly consultations to assess food logs, food receipts, and adherence to the diet. Results: Two participants were excluded from analysis due to medical or dietary non-compliance (n=15). Fruit and vegetable intake increased from 1.7 to 4.6 cups of fruits and vegetables (p<0.0001) Total fiber and insoluble fiber also increased and from 16.5 to 28 grams of fiber (p=0.05) and from 0.3 to 0.7 grams insoluble fiber (p<0.0001). Clinical results yielded an increase in diastolic blood pressure (p=0.03) and sodium (p=0.002) and a decrease in body fat percentage (p=0.04). Erysipelotrichaceae (phylum Firmicutes) decreased (log2 fold change: -1.78, p=0.01) and Caulobacteraceae (phylum Proteobacteria) increased (log2 fold change= 1.07, p= 0.01). Conclusion: Implementing a free-living 8-week diet, with intensive education and accountability, gave young adults at high-risk for/or diagnosed with MetS the knowledge, skills, and feedback to improve diet. To yield greater clinical and gut microbiome changes a longer diet intervention may be needed in this population. Keywords Metabolic Syndrome, young adults, healthy diet, MyPlate diet, fruits and vegetables
26
1. Introduction Individuals with Metabolic Syndrome (MetS) have variable combinations of at least three
of the following five components- increased waist circumference, blood pressure, triglycerides,
and blood glucose and low high-density lipoprotein (HDL). A MetS diagnosis indicates overall
increased chronic disease burden throughout the lifespan [2], most specifically increasing rates
of heart disease and diabetes [16, 31]. Unfortunately, MetS is often undiagnosed in the young
adult population [17], missing the opportunities to implement treatment and prevention of future
diseases [16].
Hypercholesterolemia, enteral inflammation, and other cardiovascular risk [6, 55]
associated with MetS are related to a gut microbiome with low diversity [47]. The gut
microbiome has been described as another organ with cells that communicate and are involved in
energy distribution and storage [49]. The diversity and bacterial content of an individual’s gut
microbiome is dependent on host genotype and age, as well as environmental factors, including
diet composition [6]. Diet-induced modifications in the intestinal microbiome have been
established in both human and animal models of obesity (reviewed in [4]). Diet is a modifiable
risk factor [43] and an effective target for lifestyle interventions in young adults [44] to both
improve gut microbiome health and decrease risk of MetS diagnosis.
Currently, many areas of the world are adopting the Western diet, which is high in total
fat, saturated fat, and refined carbohydrate intake, but low in fruits, vegetables, and other plant-
based foods, resulting in low dietary fiber, non-starychy polysaccharides, and resistant starch
[85]. This diet contributes to increased inflammation and decreases gut microbiome diversity
[60, 66, 68]. Diets high in fruits and vegetables that also increase fiber intake, for example, the
Mediterranean [65, 69, 71-73] and Dietary Approach to Stop Hypertension (DASH) [9] diets, has
been shown to decrease risk of MetS and improve the gut microbiome diversity [86]. Prevalence
27
of MetS decreased from 61.4% to 13.7% in a group of adults eating a Mediterranean diet for one
year, [72]. Panunzio et al. observed similar improvements in MetS risk factors (lower body
weight, C-reactive protein (CRP), and fasting insulin) in adults after 25 weeks of a
Mediterranean diet [12]. Similarly, metabolic parameters improved in participants after an 8-
week energy-restricted Mediterranean diet [25]. We previously reported our results of an 8-week
diet focused on adopting the 2010 USDA Dietary Guidelines for Americans that improved
metabolic and cardiovascular measures in young adults without MetS [87]. Altogether, these
results indicate a simple intensive 8-week diet intervention can improve metabolic parameters.
However, little research has determined whether a similar diet produces the same outcomes in a
young adult population with high-risk and/or overt MetS.
Young adults are an optimal population to target for an education-based diet intervention
[24] focused on improving dietary behaviors to reduce chronic disease risk [36]. Implementing
dietary modifications can reduce long and short-term risk of coronary heart disease events [8],
and improve individual health outcomes [16]. Diet-induced change in the intestinal microbiome
can contribute to overall health by modulating immune mediated interactions and food
metabolism [4] in the host. In this study, young adults at high-risk for and/or having MetS were
recruited to determine the behavioral and gut microbial changes that would occur given a dietary
intervention focused on the MyPlate guideline to increase fruits and vegetables to half of their
dietary intake. The primary research hypothesis was that the educational intervention design
would increase fruit and vegetable intake in young adults. The secondary hypothesis was that the
improvements in dietary habits would improve metabolic and gut microbiome health.
2. Methods

28
2.1 Research Design
Ethical approval was obtained from the West Virginia University (WVU) Institutional
Review Board and informed consent was collected from each subject prior to enrollment in the
study. Young adults completed the diet intervention at WVU in the fall of 2016 (Clinical Trials
Record NCT03115866). Recruitment occurred through word of mouth, flyers posted around
campus, announcements in classrooms, and emails to the student body.
Eligibility criteria included the individuals to be free from chronic disease, have no
diagnosis or treatment of a serious mental or behavioral disorder within the past year, not be
pregnant, no antibiotic use for the past six months, and be diagnosed with MetS at the in-person
screening. The National Cholesterol Education Program Adult Treatment Panel (NCEP ATP) III
MetS diagnosis criteria was used to diagnose the participants, where subjects needed to have
three of the following risk factors: waist circumference >102cm (men), >88cm (women), serum
triglycerides >150mg/dl, serum HDL <40mg/dl (men), <50mg/dl (women), blood pressure
≥130/85mm Hg, and fasting blood glucose ≥ 100mg/dl [76]. Pre-screening first involved a phone
interview, followed by an in-person anthropometric assessment and blood test confirmation of
MetS components. After consent was obtained participants were scheduled for a pre-intervention
assessment to determine baseline measures.
2.3 Diet Intervention
Participants were expected to be willing to adhere to a diet of 50% fruit and vegetable
intake (4-5 daily servings) and caloric recommendations based on weight maintenance, age, and
physical activity in accordance with the USDA Dietary Guidelines for Americans for 8-weeks.
This was determined by an affirmative answer to the following question: “Are you willing and
able to adhere to a nutritional intervention consisting of half your plate fruits and vegetables for
29
eight weeks?” The recommended portions for each food group were calculated for each
participant using USDA MyPlate prior to the start of the intervention from the computer software
Nutritionist ProTM (Axxya Systsems LLC, Redmond, WA). Each participant attended a 2-hour
education session prior to the start of the intervention to receive materials and tools to help
achieve their personal diet recommendations.
During the intervention, participants were required to attend weekly, 1-hour counseling
sessions with a trained nutrition researcher. These counseling sessions utilized motivational
interviewing techniques to encourage client-led goal setting. Participants provided daily food and
activity logs, food receipts, and food pictures at this time. These were used to determine diet
compliance and aid in developing strategies to improve their diets. Each week participants were
asked, “Which day depicts the most common eating habits from the week?” The day reported
was used to analyze food components for macronutrients, fiber, sugar, empty calorie, and fruit
and vegetable consumption using the Nutritionist Pro analysis software. During these weekly
sessions participants also received financial compensation, totaling $250 for participating in the
study.
Compliance with the diet was based on participants consuming at least 50% fruits and
vegetables, or 4-5 daily servings. Participants were asked, “Rate yourself on a scale of 0-100,
how often did you maintain the diet?” The researcher would also rate the participant based on
their dietary food log and counseling session. A combined and averaged score of 75 or higher, as
well as the Nutritionist Pro report of 4-5 fruit and vegetable servings a day was determined to be
diet compliant each week. Participants had to score in this compliance range for six of the eight
intervention weeks. Participants with any significant changes in sleep, stress, physical activity,
30
medication changes, use of antibiotics or steroids, and non-compliance to the dietary
recommendations were also excluded from the analysis.
2.2 Outcome Measures
2.3.1 Nutrition and Behavior
Clinical and nutrition history as well as an in-person assessment was obtained by a
trained researcher. A 120-questionnaire survey was distributed to participants prior to beginning
the 8-week diet intervention, and again at the end of the intervention. Data on sleep hours and
stress were collected as part of the survey using the Pittsburgh Sleep Quality Index [77] and the
Cohen’s Perceived Stress Score [78].
Physical activity was measured by participants wearing an accelerometer (ActiGraph
GT3X, Actilife 6.0 Software, Pensacola, FL) around their waist for one week pre- and post-
intervention. Instructions were provided based on manufacturer’s guidelines and participants
were required to wear the device for at least three days. Non-wear time was defined as ≥60
repeated minutes of zero activity counts. Average steps per day were calculated using age
specific cut-points by Freedson et al. [80]. Participants were instructed to keep physical activity,
stress, and sleep hours consistent throughout the study to ensure that the diet was the main
intervention.
2.3.2 Anthropometrics and Cardiovascular Measurements
Anthropometric measurements were taken by a trained researcher while the participant
was wearing minimal, tight-fitting clothing, with no shoes. Weight was measured using a digital
scale (SECA 874) and recorded to the nearest 0.1kg. All other measurements were taken twice,
averaged, and recorded to the nearest 0.1cm. Height was measured using a Stadiometer (SECA
213) with the participant in a standing position with shoulders relaxed and the subject facing

31
forward, looking straight, with back against the wall. Waist circumference was measured at the
narrowest point, and hip circumference was measured at the maximum level using a Gulick tape
meter. Neck circumference was measured at the base of the Adam’s apple with the head facing
forward. Body mass index (BMI) was calculated and expressed in kg/m2 and body composition
was taken using a BodPod (CosMed USA Inc., Chicago, IL).
Brachial (b) systolic and diastolic blood pressures (SBP and DBP) were measured with
an automated, oscillometric sphygmomanometer (Critikon Dinamap Compact BP monitor, GE
Medical Tampa, FL), and pulse pressure (PP) was calculated from systolic bSBP-bDBP. Pulse
wave analysis was performed noninvasively on the radial artery (SphygmoCor System, ATCor
Medical, Sydney, NSW, Australia). All measurements were made in triplicate and the mean
values were used for subsequent analysis. The SphygmoCor system synthesizes a central
(ascending aortic) pressure wave form from the radial pressure wave form that does not differ
from that of an intra-arterially recorded wave [88] using a validated generalized transfer function
[89] that has good reproducibility under major hymodynamic changes [90]. Pulse wave velocity
(PWV) is measured using the same tonometry unit, alternating the placement of the probe on the
carotid and femoral (cf) pulse. Velocity is determined by the difference in arrival time of the
pulse wave between sits. In the supine position, B-mode ultrasound (GE Vivid i) 2-D images of
the right common carotid artery were obtained 1-2 cm proximal to the carotid bifurcation to
measure maximal lumen diameter, and intima medial thickness (cIMT) following standard
procedures [91]. Cross-sectional area of the carotid artery was calculated as [(maximal lumen
diameter/2)2 X 𝜋] - [(maximal lumen diameter/2 - IMT)2 X 𝜋]. The wall-to-lumen ratio (W/L) of
the right CCA was calculated as 2 X IMT/lumen diameter in diastole [92]. A blinded expert then
assessed the quality for each measure to make the determination if the value was valid.
32
2.3.3 Blood and Stool Sample Collection/Processing
Fasting blood was collected by venipuncture prior to the intervention, during, and after
the 8-week intervention. Samples were analyzed by Ruby Memorial Hospital Clinical laboratory
for basic chemistry analysis, complete lipid panel (i.e., cholesterol, HDL, low density lipoprotein
(LDL)) and selected endocrine analysis (i.e., insulin, high-sensitve C-reactive protein). We report
data collected pre (week 0) and post (week 8) intervention.
The Easy Sampler stool kits (ALPCO, Salem, New Hampshire) were used to collect fecal
samples from each participant. The samples were frozen within 2 hours of collection, and stored
at -80° C for later processing. A direct polymerase chain reaction (PCR) approach was used on
isolated stool DNA to amplify bacterial DNA for sequencing using the Extract-N-Amp Plant
PCR kit (Sigma-Aldrich, Inc) as previously described [81]. In short, DNA from fragments of
fecal samples (100 mg) was diluted 1/600 in RNAse DNase free water for PCR amplification.
The PCR primers for the V3 to V4 regions of the 16S ribosomal RNA were used as described
[93]. Bacterial DNA was amplified on a Techne Genius Model FGEN02TP Thermal Cycler
using the Extract-N-Amp kit following manufacturer’s instructions with the following
modifications: The PCR conditions were: 95° C for 6 minutes to denature; 95° C for 2 minutes,
50° C for 2 minutes, 72° C for 2 minutes for 30 cycles; 72° C for 4 minutes; 0.5 µM forward
primer, 0.5 µM reverse primer and DNA in a total volume of 60 µL samples, amplified in
triplicate, and reaction products were pooled prior to purification. PCR products were purified
with Ampure XP beads (Beckman Coulter Life Sciences, Indianapolis, IN) per manufacturer’s
instructions [83].
Paired end sequencing was performed using an Illumina MiSeq (San Diego, CA) in the
Genomics Core Facility at WVU and then paired ends were merged with FLASH (fast length
33
Magoc and Slazberg Bioinformatics 27:21). Quantitative Insights Into Microbial Ecology
(QIIME v1.9.1 http://qiime.org) [84] was used to split the libraries and pick open-reference
taxonomic units (OTUs) at 97% similarity. OTUs were first filtered by excluding those below a
minimum threshold count of 500.
3. Statistical Analyses
All continuous outcome distributions were examined for goodness-of-fit by the
Shapiro-Wilk W-test. When lack of normality was found, those variables were transformed. All
analyses were completed using JMP 13.0 (JMP, Version Pro 13.2, SAS Institute Inc., Cary, NC,
Copyright ©2016), SAS 9.3 (SAS, Version 9.4, SAS Institute Inc., Cary, NC, Copyright
©2002-2012), and R (R Core Team (2013), Vienna, Austria. URL: http://www.R-project.org).
A p-value less than or equal to 0.05 was considered significant, and data are presented as mean
± standard deviation (SD) unless otherwise noted. Benjamini-Hochberg was used to control
type I error rate during multiple analyses (more than 20 items), using false discovery rate at
10%.
3.1 Diet and Anthropometrics
Log-transformation was used for fiber, sugar, carbohydrate grams, fat grams, dietary
cholesterol, monounsaturated fat, polyunsaturated fat, CRP, and LDL. A repeated measures
analysis of variance (rANOVA) was used to assess differences in dietary data collected weekly
over the 8-week study. Week (referred to as intervention, accrued over the 8 weeks) was used as
repeated effect (week 0-8) in the model. Dietary values were also tested with a specific contrast
(week 0 vs. week 8, representing pre-intervention and post-intervention). Matched pairs t-test
was used to determine differences in survey, clinical, and anthropometric measures between pre-
intervention and post-intervention. Soluble, insoluble, and CRP data had unusual distributions
34
difficult to normalize with transformations. Soluble and insoluble fiber were analyzed using
Mantel-Haenszel for nonparametric repeated measures [94]. CRP analysis utilized the Wilcoxon
Signed Rank test which is a non-parametric matched pairs test.
3.2 Microbiome Changes
Changes in the microbiome from pre- to post-intervention were assessed using a
generalized linear model, DESeq2, where counts are modeled using a negative binomial
distribution with a fitted mean, an OTU-specific dispersion parameter, and a Bonferroni
adjustment.
3.3 Diet and Microbiome
An arcsine square root transformation of the microbiome abundance was used for the
linear regression and statistical test modeling of diet, anthropometrics, and demographic
variables. Gut bacteria was excluded from this analysis if <17% of the samples had an abundance
of <0.005 with that particular OTU (this filtering method has been used in other studies [95]).
Relationships of microbial phyla and families with dietary and anthropometric variables that
changed with a p-value ≤0.05 were assessed using a stepwise multiple linear regression to
determine how dietary changes were influencing the gut microbiome. Influential observations
were examined by studentized residuals, with values greater than two being eliminated from the
particular model in one round of screening. Below are the general equations used, and the order
of statistical analyses.
1. Relationships of dietary and anthropometric measures with each microbial operational
taxonomic unit (OTU) were initially screened by stepwise regression:
p_OTUi = µ + Dietary (D) and Anthropometric (A) variables + Ɛ (1)
35
where p_OTUi is a proportion of specific OTU examined, µ is the mean response, and Ɛ
represents random error terms.
2. Specific dietary and anthropometric factors found significant in primary regression
analysis (1) for each OTU were entered into the secondary model to examine their effect
and the effect of intervention (pre and post) and their interaction by analysis of
covariance ANCOVA:
p_OTUi = µ + D and A (from 1) + Intervention + D and A * Intervention + Ɛ (2)
where D and A * Intervention represent the interactions of specific dietary variable (D)
with intervention and of specific anthropometric (A) variable with intervention.
3.4 Power Analysis
A post-hoc power analysis was completed for a one-sided, paired sample t-test with 15
participants using the data from the current study to determine the statistical power for the fruit
and vegetable intake (from food log dietary analysis), and number of MetS risk factors changed
throughout the intervention. The power for fruit and vegetable intake change was computed to
66.5%, while the power of detecting change in the number of MetS risk factors from screening to
post-intervention was approaching 100%. The effect size, calculated by Cohen’s d for fruit and
vegetable intake was 0.81, while number of MetS risk factors was 1.41, which are both suitable
effect sizes [96].
36
4. Results
4.1 Diet and Clinical
Two participants were excluded from analysis due to dietary and medication non-
compliance (i.e. antibiotic use), resulting in 15 participants included in the final analysis (Figure
1). Most of the participants identified as Caucasian (73.3%), female (60%) and being from
Appalachia (60%), with an average age of 21.9 ± 3.1 years old. Average BMI identified
participants in the morbid obesity class II (37.8 ± 5.4), and the average hemoglobin A1C was
within normal limits (5.3 ± 0.3) (Table 1). As anticipated, there were no significant changes in
sleep, stress, and physical activity throughout the intervention (Table 2). There was a significant
increase in fruit and vegetable (pre-intervention: 1.7 ± 1.5 servings; post-intervention 5.8 ± 7.2,
p<0.0001), total fiber (pre-intervention: 16.5 ± 13.6 grams, total fiber (pre-intervention 16.5 ±
13.6 grams; post-intervention 28.7 ±17.5 grams), and insoluble fiber intake (pre-intervention: 1.1
± 1.9 grams; post-intervention 4.6 ± 1.5, p<0.0001) during the 8-week intervention. Similarly,
considering pre (week 0) and post (week 8) intervention (matched pairs t-test), number of fruit
and vegetable cups (p<0.0001) as well as total fiber (p=0.003), and insoluble fiber (p=0.015)
increased, while empty calorie intake decreased (p=0.039). We also noted a 3% increase in
percent protein (p=0.101), and a 7% decrease in fat percent (p=0.056) intake, though these
values did not result in statistical significance (Table 3 and Figures 2A-D).
The MetS components in the NCEP ATP III guidelines [8] at screening, (Table 4) were
as follows (most to least prevalent): increased waist circumference (100% of participants), low
HDL (86.7%), high serum triglycerides (73.3%), high fasting blood glucose (46.7%), and high
blood pressure (13.3%). At the in-person screening, 13 individuals qualified for MetS with three
risk factors, and two with either four or five risk factors. Within the next two weeks when pre-
37
intervention measures were taken, two individuals demonstrated three risk factors, nine had two
risk factors, and four had one risk factor; none had more than three of the MetS components.
Eight weeks later, at post-assessment, three participants had three risk factors, five with two risk
factors, and six with one risk factor. Overall, the number of MetS components decreased from
screening (3.2 ± 0.6 per person) to pre- (1.9 ± 0.6 per person) to post-intervention (1.7 ± 0.8 per
person), though this was not significant from pre- to post-intervention (p=0.43). Clinical
measures (Table 5) indicated an increase in sodium (p=0.0018) pre- to post-intervention. We also
noted a 3% decrease in body fat percentage (p=0.04), though this was not statistically significant.
Participant arterial function was assessed (Table 5), and ten individuals were found to have valid
measurements (per expert blinded review) to be used in the analysis with no significantly
different measures.
4.1 Microbiome
Of the 15 participants used for analysis in the diet and clinical variables, three of them
did not have pre and post stool samples; thus the microbiome analysis included 12 participants.
Bacteriodetes and Firmicutes phyla were the most prevalent (Figure 3). Six main families of
Bacteriodetes were identified (Bacteriodaceae, Paraprevotellaceae, Porphyromonadaceae,
Prevotellaceae, Rikenellaceae, and Barnesiellaceae). Additionally, eight main families of
bacteria in the Firmicutes were identified (Clostridiales cluster, Clostridiaceae,
Erysipelotrichaceae, Lachnospiraceae, Planococcaceae, Ruminococcaceae, Streptococcaceae,
and Veillonellaceae). This was followed by Actinobacteria (with 2 families; Coriobacteraceae
and Bifidobacteriaceae), Proteobacteria (6 families; Caulobacteraceae, Desulfovibrionaceae,
Pasteurellaceae, Sphingomonadaceae, Enterobacteriaceae, and Alcaligenaceae),
Verrucomicrobia (1 family; Verrucomicrobiaceae), and an unassigned bacteria. No changes were
38
detected in the microbiomes when comparing samples from pre- and post-intervention at the
phylum level. There were significant changes from pre to post intervention in two groups at the
family level. Erysipelotrichaceae (phylum Firmicutes) decreased (log2 fold change: -1.78,
p=0.01) and Caulobacteraceae (phylum Proteobacteria) increased (log2 fold change= 1.07, p=
0.01).
Results of stepwise regression (1) and ANCOVA (2) indicate (Table 6) three families of
Firmicutes were associated with dietary and clinical variables. As Ruminococcaceae increased,
soluble fiber decreased (p=0.002). Decreasing calories from dietary fat was associated with
decreasing Lachnospiraceae (p=0.028). Increasing Clostridiaceae corresponded to increasing
diastolic blood pressure (p=0.029). One family of Bacteroidetes (Prevotellaceae) significantly
changed through the intervention (p=0.048), though this was likely explained by two outliers.
Interaction of time (intervention) and dietary variables affecting OTU were observed in
the phyla Actinobacteria (family Coriobacteraceae) and Firmicutes (Clostridiales cluster).
Actinobacteria, with its most represented family taxa, Coriobacteraceae, decreased as percent
dietary fat intake (p=0.033) decreased (Figure 4). As average dietary fat decreased from 35.2%
to 28.2% (20% decrease), Coriobacteraceae decreased by 2/3 at the end of the intervention.
Likewise, Clostridiales cluster decreased as empty calorie intake decreased through the dietary
intervention (p= 0.008) (Figure 5). A 36% decrease in empty calories (930 to 595 kcals) was
related to a ¾ decrease in the Clostridiales cluster at the end of the 8-weeks. Proportion of family
Prevotellaceae from phylum Bacteroidetes was affected more by dietary intervention in time
(p=0.05) than by body fat (p=0.18), with a trend toward significant interaction (p=0.06),
although this relationship was likely due to a couple of influential observations (data not shown).
39
5. Discussion
5.1 Diet Intervention
This study was designed to increase the fruit and vegetable intake of young adults at
high-risk for/or having MetS, and then determine how the dietary changes impacted participants’
metabolic measures and gut microbiome composition. The cohort significantly increased fruit
and vegetable intake from 1.7 cups per day at pre-intervention, which is average for this age
group [21], to 4.6 cups near the recommended 5 cups every day. By the end of the intervention,
average total fiber and fat percent intake also fell within recommended limits (25-30 grams of
fiber, and <30% fat intake [45]).
These dietary improvements indicate this free-living, education-based, motivational
intervention design was effective in accomplishing the primary objective of increased fruit and
vegetable intake in this population. Previously, in a meta-regression of 122 young adult diet
interventions it was determined that the most effective interventions focused on a behavior
change approach to help participants self-monitor [97] and remain motivated [98]. This study
implemented those concepts in the design through motivational interviewing counseling, daily
tracking of food, weekly goal setting, and screening participants to ensure they were motivated at
the beginning of the study to begin dietary changes to improve metabolic health.
The MetS components this cohort exhibited at baseline varied slightly in prevalence
from a previously reported pooled analysis of 34 studies on young adults with MetS [2].
Abdominal obesity, prevalent at pre- and post-intervention, and elevated fasting glucose and
triglycerides, prevalent at screening, were found at higher rates in this cohort. All 15 participants
qualified for MetS at the in-person screening and consent; however, only two participants met
the diagnostic criteria for MetS at the time of pre-intervention measures which occurred up to
40
two weeks later. This could be explained by the Hawthorne Effect in research on human
behavior [99]. This phenomenon indicates that discussion of the intervention with individuals
diagnosed with a negative health outcome (such as MetS during the screening appointment)
[100], can inherently cause participants to change behavior because they know they are being
observed [101]. Although we sought to prevent this potential effect by instructing participants to
not begin any lifestyle changes until the official start date of the study, there were, nevertheless,
changes in MetS components from screening to pre-intervention indicating the Hawthorne Effect
could have influenced participants’ behavior. Alternatively, since the risk factor that declined the
most from screening and consent to pre-intervention were glucose and triglyceride levels, it
could also be that individuals did not fast for as long as instructed to prior to the screening
appointment.
Although number of MetS components varied at the pre-assessment, participants’ were
still included in the study because MetS qualification at screening was the study entry criteria
and it was not anticipated that clinical components would change between these two time points.
This cohort did all have at least one MetS component which indicates they are at an increased
risk of Mets diagnosis. There was an overall decrease in total number of MetS risk factors. On
the other hand, sodium increased, though according to clinical guidelines it was still within the
normal range [102]. Therefore, in looking at the secondary objective of our study there were
some clinical improvements in participants, but not as many as expected based on prior research.
One possible explanations for the lack of improvement in clinical outcomes is that a longer
intervention may be needed in a group of individuals with overt MetS in comparison to a
relatively healthy group. Similarly, Honrath et al. implemented a 10-week nutrition education
41
intervention to increase fruit and vegetable intake and did not see significant improvements in
anthropometric measurements- weight, BMI, and body fat percentage [98].
In this study, only fruit and vegetable intake and total and insoluble fiber significantly
improved. This supported the primary objective/hypothesis of the study yet other studies that
have yielded positive changes in metabolic health demonstrated improvements in other areas of
the diet. The previously reported cohort did experience significant metabolic improvements with
the additional dietary changes focusing on increased complex carbohydrates and decreased fat
[87]. It may require a diet focused on more than one simple change to work synergistically and
result in metabolic improvements. For example, in a 12-week study of 417 weight stable
Europeans with MetS it was found that an isocaloric diet reducing only saturated fat had no
effect on insulin sensitivity, or any of the five components of MetS. The only improvement in
metabolic health occurred in the group with low fat, high complex carbohydrates, and
supplemented long chain omega-3 polyunsaturated fatty acids [103]. A 10-12 week study by
Klein et al., whose participants also had a decrease in body fat with equal caloric intake, found
that these changes did not significantly alter insulin sensitivity, blood pressure, CRP, or any
other inflammatory markers [104]. Overall, it may take a diet that is focused on several dietary
improvements and a negative energy balance to result in weight loss and the desired metabolic
improvements in this population [105].
5.2 Microbiome
The gut microbiome can be affected by weight status [4, 6, 58, 59] and risk factors
associated with MetS diagnosis [6, 55]. Among relationships with diet and disease, Firmicutes
and Bacteroidetes are among the most commonly identified and studied in lean and obese
42
individuals [59]. As expected, the current cohort’s fecal microbiomes consisted mainly of
Firmicutes and Bacteroidetes. There was little change overall from pre- to post-assessment in the
fecal microbiome. However, significant changes at the family level were a decrease of
Erysipelotrichaceae (phylum Firmicutes) and an increase in Caulobacteraceae (phylum
Proteobacteria). Other researchers have found a positive association between Erysipelotrichaceae
and the pro-inflammatory cytokine IL-1β [106], dietary fat intake [107] and obesity [108] The
concurrent decrease in this family, dietary fat intake, and body fat percentage (though these
weren’t significant) in the current study population aligns with this prior research.
Caulobacteraceae is a family of bacteria in the Proteobacteria phylum. Increased
Proteobacteria has been associated with obesity and dysbiosis (reviewed in [109]).
Caulobacteraceae have not been studied in detail in intestinal dysbiosis in humans, however an
increase in Caulobacteraceae abundance was found in piglets fed lysine-restricted diets, resulting
in decreased expression of lysine transporters, decreased expression of leptin in the blood, and
decreased levels of ghrelin and CCK mRNA in the jejunum, all of which was associated with
increased feed intake [110]. Projecting those findings to our study population, an increase in
Caulobacteraceae could potentially contribute to physiologic responses that decrease satiety in
the participants undergoing dietary intervention, which could be problematic for maintaining the
diet long-term, and possibly contribute to failures in the interventional approach.
Along with few changes in metabolic outcomes, study length, the dietary variable
changes, and the relatively small number of participants in the study could be the reason why
little changes were seen in the gut microbiota. Mohan et al. found that gluten-sensitive monkeys,
when switched to a gluten-free diet took longer than the 70-day study period for their gut
microbiome to shift to that of a healthy microbiome- though the gut microbiome was showing
43
some improvements [111]. The 60-day length of dietary intervention in a free-living
environment in this study may have not been sufficient time for significant changes. Similarly, in
a 12-week intervention with obese individuals Cotillard et al. found significant improvements in
body fat mass, adipocyte diameter, microbial gene richness, and biomarkers of insulin
sensitivity, inflammation, and metabolism only when participants changed to an energy restricted
diet for an for the last 6-weeks of the study [112].
Two relationships between decreases in dietary components and decreases in the
abundance of certain microbial populations were identified: 1) dietary fat and Coriobacteraceae
(Actinobacteria phylum) and 2) empty calories and Clostridiales cluster (Firmicutes phylum). In
either case the decrease in the dietary variable resulted in at least a two-fold change in the
bacterial family. Empty calories originate from solid fats, added sugars, and any alcohol in
excess of 13g/1000kcals [113]. Firmicutes (the phyla level of Clostridiales cluster) have also
been found to increase as diets high in fat and sugar (empty calories) similar to the Western diet
pattern increase [60, 85, 114]. Although the abundance of all Firmicutes was not different after
the intervention, a major family within this phylum was affected by decreased empty calories
consumed during the intervention.
5.6 Study Limitations
There are limitations in this study. First, with data from only 15 participants in the study
and 12 used in the microbiome analysis, this can limit the power needed to detect differences in
dietary, behavioral, metabolic, and microbial health. However, we would note that, we used a
repeated measures design so that each subject served as their own control. This has the advantage
of limiting treatment variability outcomes and improving statistical power with small population
cohorts (compared to studies only using between subject comparisons). Additionally we had
44
limited attrition once subjects were consented which we believe is attributed to our attention to
the stages of change that participants were in when screened for study eligibility. This, along
with weekly counseling may have increased the likelihood of participants being able to complete
the study requirements, and likely contributed to our high (15/17=88%) successful study
completion.
Another concern is the study length of 8-weeks. While this has been enough time to yield
metabolic and microbial improvements in other studies [25], and in our previous study using a
similar 8-week diet intervention [87], this cohort (with risk of MetS) did not see as many desired
metabolic improvements suggesting that as disease burden increases that longer diet
interventions may be needed. Lengthening the study period may help give participants with
lower baseline diet quality the extra time needed to improve their diet in a free-living
intervention, which more closely resembles peoples’ lives and struggles. Lastly, the study
participants were all largely white, and thus future research should be expanded to include more
diversity and geographic locations before results can be generalized to the young adult
population as rates of MetS vary in different ethnic groups [115].
5.7 Conclusion
The average young adult college student eats only one serving of fruits and vegetables
daily, which is contrary to the recommended five cups a day for the prevention of chronic
diseases. In this study, a monitored, free-living, diet intervention was found to be effective in
increasing fruit and vegetable intake, and total fiber, while decreasing empty calories in young
adults with/or high risk for MetS. This resulted in decreased total number of MetS risk factors
and body fat while decreasing Erysipelotrichaceae and increasing Caulobacteraceae. Further
45
research is needed to determine if a longer intervention using this diet will produce more success
in improving metabolic and gut microbiome health. Additionally, inclusion and specific focus on
other dietary components such as decreased dietary fat (especially saturated fat) and increased
complex carbohydrates (especially foods rich in soluble fiber), will be needed to promote greater
microbiome diversity and maximize changes in metabolic and cardiovascular health.
List of Abbreviations ANCOVA, analysis of covariance; BMI, body mass index; b, brachial; CCA, common carotid artery; CRP, C-reactive protein; DASH, Dietary Approach to Stop Hypertension; DBP, diastolic blood pressure; HDL, high density lipoprotein; IMT, intima-medial thickness ; LDL, low density lipoprotein; MetS, Metabolic Syndrome; NCEP- ATP, National Cholesterol Education Program Adult Treatment Panel; OTU, operational taxonomic unit; PCR, polymerase chain reaction; PP, pulse pressure; PWVcf, pulse wave velocity at the carotid and femoral artery; rANOVA, repeated measures analysis of variance; SD, standard deviation; SBP, systolic blood pressure; USDA, United States Department of Agriculture; WVU, West Virginia University; Competing Interests The authors’ declare they have no competing interests. Authors’ Contributions Concept and study design was a team effort by MDO, IMO, PJM, JWM and CCC. Study
intervention was performed by RLC, OAF, and MDO. Data processing and analysis was
conducted by RLC, IH, AMI, PDC, MWD, MTD, JWM, IMO, CCC, and MDO. Preparation of
46
the manuscript and statistical analyses was performed by RLC with assistance from IH, MDO,
CCC, and AMI. All authors read and approved the final manuscript.
Acknowledgements and Funding This work was supported by a research grant (#2014-67001-21851) from the USDA National
Institute of Food and Agriculture, West Virginia Clinical Translational Science Institute (NIH
P30 GM103488), West Virginia University Experimental Station Hatch WVA00627 and
WVA00641, WVU Mountains of Excellence Flash Funding, WV INBRE P20 GM103434 for the
Genomics core, and WVU Medicine. WVA00641. WVU Pediatrics grant; Obesity, Diabetes &
Asthma Fund. The funding sponsors had no role in the design of the study; in the collection,
analyses, or interpretation of the data; in the writing of the manuscript; or in the decision to
publish the results.

47
V. Conclusion
The average young adult college student eats one serving of fruits and vegetables daily,
which is contrary to what is recommended for the prevention of chronic diseases. The main
purpose of the FRUVEDomics study was to determine if a free-living, education-based diet
intervention could improve fruit and vegetable intake, and if this dietary change would result in
metabolic and gut microbiome changes. In this study of young adults with MetS, a diet
intervention was found to be effective in improving some dietary components. This did attribute
to some changes in clinical and gut microbiome measurements. For more participants to achieve
better metabolic and gut microbial health further research should investigate this diet in a larger,
more diverse, cohort, with a longer diet intervention. Employing these strategies will give
individuals more time to adjust to the behavior changes so their body can reap the benefits of the
improved behaviors through better metabolic health, and decreased risk of chronic diseases later
in life.
Future Implications
Young adults (18-30 years old) are expected to have increasing responsibility and autonomy
in decisions and lifestyle behaviors, such as diet. Implementing an effective intervention for this
population includes giving them the knowledge and skills to help young adults transition to
making healthy choices with better long-term health consequences. This study design did result
in significant dietary improvements. However, some things should be taken into consideration to
help further drive this research.
First, this intervention focused mainly on improving fruit and vegetable intake. It may take a
dietary intervention that focuses on several dietary components to see metabolic and gut
microbiome changes. For example, other studies have shown positive results after increasing
48
complex carbohydrates and decreasing fat intake. Another consideration for this population is
that their baseline dietary quality may be less healthy, and take longer to improve in a free-living
diet intervention. To account for these limitations researchers could employ several different
strategies outlined below:
• Use the same study design, but have a longer diet intervention so individuals have a
longer time to adjust to the dietary changes.
• Include a more intense diet intervention that focuses on improving more dietary
components than just fruit and vegetable intake such as decreased fat intake or increased
complex carbohydrates.
• Have tighter restrictions when it comes to monitoring diet compliance. For example,
require that participants meet certain guidelines in several dietary components each week.
It is very important to continue research in this young adult population since it is often
understudied and is a transitional period where many health behavior habits begin as the
individual transitions to life as an adult. As research in this area progresses then more public
health interventions can be implemented to help improve the overall quality of life.
49
References 1. What is Metabolic Syndrome? . In. Edited by National Heart Lung and Blood Institute; 2016. 2. Nolan PB, Carrick-Ranson G, Stinear JW, Reading SA, Dalleck LC: Prevalence of metabolic
syndrome and metabolic syndrome components in young adults: A pooled analysis. Preventive medicine reports 2017, 7:211-215.
3. Althani AA, Marei HE, Hamdi WS, Nasrallah GK, El Zowalaty ME, Al Khodor S, Al-Asmakh M, Abdel-Aziz H, Cenciarelli C: Human Microbiome and its Association With Health and Diseases. Journal of cellular physiology 2016, 231(8):1688-1694.
4. John GK, Mullin GE: The Gut Microbiome and Obesity. Current oncology reports 2016, 18(7):45.
5. Pu S, Khazanehei H, Jones PJ, Khafipour E: Interactions between Obesity Status and Dietary Intake of Monounsaturated and Polyunsaturated Oils on Human Gut Microbiome Profiles in the Canola Oil Multicenter Intervention Trial (COMIT). Frontiers in microbiology 2016, 7:1612.
6. Chen J, He X, Huang J: Diet effects in gut microbiome and obesity. Journal of food science 2014, 79(4):R442-451.
7. Cani PD, Amar J, Iglesias MA, Poggi M, Knauf C, Bastelica D, Neyrinck AM, Fava F, Tuohy KM, Chabo C et al: Metabolic endotoxemia initiates obesity and insulin resistance. Diabetes 2007, 56(7):1761-1772.
8. National Cholesterol Education Program Expert Panel on Detection E, Treatment of High Blood Cholesterol in A: Third Report of the National Cholesterol Education Program (NCEP) Expert Panel on Detection, Evaluation, and Treatment of High Blood Cholesterol in Adults (Adult Treatment Panel III) final report. Circulation 2002, 106(25):3143-3421.
9. Azadbakht L, Mirmiran P, Esmaillzadeh A, Azizi T, Azizi F: Beneficial Effects of a Dietary Approaches to Stop Hypertension Eating Plan on Features of the Metabolic Syndrome. Diabetes care 2005, 28(12):2823.
10. Meydani M: A Mediterranean-style diet and metabolic syndrome. Nutrition reviews 2005, 63(9):312-314.
11. National Cholesterol Education Program . Expert Panel on Detection E, Treatment of High Blood Cholesterol in A: Third report of the National Cholesterol Education Program (NCEP) Expert Panel on Detection, Evaluation, and Treatment of High Blood Cholesterol in Adults (adult treatment panel III) : executive summary. In. [Bethesda, Md.?] :: National Cholesterol Education Program; 2001.
12. Panunzio M, Caporizzi R, Antoniciello A, Cela E, Ferguson L, D'Ambrosio P: Randomized, controlled nutrition education trial promotes a Mediterranean diet and improves anthropometric, dietary, and metabolic parameters in adults. Annali di igiene: medicina preventiva e di comunita 2011, 23(1):13-25.
13. Julia C, Vernay M, Salanave Bt, Deschamps Vr, Malon Al, Oleko A, Hercberg S, Castetbon K: Nutrition patterns and metabolic syndrome: A need for action in young adults (French Nutrition and Health Survey — ENNS, 2006-2007). Preventive Medicine 2010, 51(6):488-493.
14. Claus SP, Swann JR: Nutrimetabonomics: applications for nutritional sciences, with specific reference to gut microbial interactions. Annual review of food science and technology 2013, 4:381-399.
15. Robertson Ruairi OCS, Murphy Kiera, Moloney Gerard M., Cryan John F., Dinan Timothy G., Ross R.P., Stanton Catherine: Deficiency of essential dietary n-3 PUFA disrupts the caecal microbiome and metabolome in mice. British Journal of Nutrition 2017, 118(11):959-970.
16. Moore JX, Chaudhary N, Akinyemiju T: Metabolic syndrome prevalence by race/ ethnicity and sex in the united states, national health and nutrition examination survey, 1988-2012. Preventing Chronic Disease 2017, 14(3).
50
17. Miller B, Fridline M, Liu PY, Marino D: Use of CHAID decision trees to formulate pathways for the early detection of metabolic syndrome in young adults. Computational and mathematical methods in medicine 2014, 2014:242717.
18. Murray Christopher JL: The State of US Health, 1990-2010. JAMA: Journal of the American Medical Association 2013, 310(6):591.
19. Holben DH, Zurmehly A, Jackson L, Holcomb JP: Food Insecurity Is Associated with Increased Diabetes Risk, Obesity, and Poorer Perceived Diet and Health among Women in Rural Appalachian Ohio. Journal of the American Dietetic Association Journal of the American Dietetic Association 2009, 109(9):A96.
20. Munt AE, Partridge SR, Allman-Farinelli M: The barriers and enablers of healthy eating among young adults: a missing piece of the obesity puzzle: A scoping review. Obesity Reviews 2017, 18(1):1-17.
21. Association American College Health: American College Health Association-National College Health Assessment II: Reference Group Executive Summary Fall 2016. In. Edited by Association ACH. Hanover, MD; 2017.
22. AllmanFarinelli M: Nutrition promotion to prevent obesity in young adults. Healthcare 2015, 3:809-821.
23. GordonLarsen P: Longitudinal trends in obesity in the United States from adolescence to the third decade of life. Obesity 2010, 18:1801-1804.
24. Lipsky LM, Nansel TR, Haynie DL, Liu D, Li K, Pratt CA, Iannotti RJ, Dempster KW, Simons-Morton B: Diet quality of US adolescents during the transition to adulthood: changes and predictors. The American Journal of Clinical Nutrition 2017, 105(6):1424-1432.
25. Bondia-Pons I, Martinez JA, la Iglesia R, Lopez-Legarrea P, Poutanen K, Hanhineva K, Zulet MdlÁ: Effects of short-and long-term Mediterranean-based dietary treatment on plasma LC-QTOF/MS metabolic profiling of subjects with metabolic syndrome features: The Metabolic Syndrome Reduction in Navarra (RESMENA) randomized controlled trial. Molecular nutrition & food research 2015, 59(4):711-728.
26. Lanza E, Schatzkin A, Daston C, Corle D, Freedman L, Ballard-Barbash R, Caan B, Lance P, Marshall J, Iber F: Implementation of a 4-y, high-fiber, high-fruit-and-vegetable, low-fat dietary intervention: results of dietary changes in the Polyp Prevention Trial. The American journal of clinical nutrition 2001, 74(3):387-401.
27. Bowman SA: Food shoppers' nutrition attitudes and relationship to dietary and lifestyle practices. Nutrition Research 2005, 25(3):281-293.
28. Armstrong M, Mottershead T, Ronksley P, Sigal R, Campbell T, Hemmelgarn B: Motivational interviewing to improve weight loss in overweight and/or obese patients: a systematic review and meta-analysis of randomized controlled trials. Obesity reviews 2011, 12(9):709-723.
29. Lundahl B, Moleni T, Burke BL, Butters R, Tollefson D, Butler C, Rollnick S: Motivational interviewing in medical care settings: a systematic review and meta-analysis of randomized controlled trials. Patient education and counseling 2013, 93(2):157-168.
30. Miller WR, Rollnick S: Motivational interviewing: Helping people change: Guilford press; 2012.
31. Ford ES, Giles WH, Dietz WH: Prevalence of the metabolic syndrome among US adults: findings from the third National Health and Nutrition Examination Survey. Jama 2002, 287(3):356-359.
32. Mottillo S, Filion KB, Genest J, Joseph L, Pilote L, Poirier P, Rinfret S, Schiffrin EL, Eisenberg MJ: The metabolic syndrome and cardiovascular risk: a systematic review and meta-analysis. Journal of the American College of Cardiology 2010, 56(14):1113-1132.
33. Grundy SM, Cleeman JI, Daniels SR, Donato KA, Eckel RH, Franklin BA, Gordon DJ, Krauss RM, Savage PJ, Smith SC, Jr., Spertus JA, Costa F: Diagnosis and management of the
51
metabolic syndrome: an American Heart Association/National Heart, Lung, and Blood Institute Scientific Statement. Circulation 2005, 112(17):2735-2752.
34. Lakka H-M, Laaksonen DE, Lakka TA, Niskanen LK, Kumpusalo E, Tuomilehto J, Salonen JT: The metabolic syndrome and total and cardiovascular disease mortality in middle-aged men. Jama 2002, 288(21):2709-2716.
35. Bustos P, da Silva AAM, Amigo H, Bettiol H, Barbieri MA: Metabolic syndrome in young adults from two socioeconomic Latin American settings. Nutrition, Metabolism and Cardiovascular Diseases 2007, 17(8):581-589.
36. Morrell JS, Byrd-Bredbenner CP, Quick VP, Olfert MD, Dent A, Carey GB: Metabolic Syndrome: Comparison of Prevalence in Young Adults at 3 Land-Grant Universities. Journal of American College Health 2014, 62(1):1-9.
37. Mozumdar A, Liguori G: Persistent increase of prevalence of metabolic syndrome among US adults: NHANES III to NHANES 1999–2006. Diabetes care 2011, 34(1):216-219.
38. Ravikiran M, Bhansali A, Ravikumar P, Bhansali S, Dutta P, Thakur JS, Sachdeva N, Bhadada S, Walia R: Prevalence and risk factors of metabolic syndrome among Asian Indians: a community survey. Diabetes research and clinical practice 2010, 89(2):181-188.
39. Alberti KG, Eckel RH, Grundy SM, Zimmet PZ, Cleeman JI, Donato KA, Fruchart JC, James WP, Loria CM, Smith SC, Jr. et al: Harmonizing the metabolic syndrome: a joint interim statement of the International Diabetes Federation Task Force on Epidemiology and Prevention; National Heart, Lung, and Blood Institute; American Heart Association; World Heart Federation; International Atherosclerosis Society; and International Association for the Study of Obesity. Circulation 2009, 120(16):1640-1645.
40. Forouzanfar MH, Alexander L, Anderson HR, Bachman VF, Biryukov S, Brauer M, Burnett R, Casey D, Ärnlöv J, Murray CL: Global, regional, and national comparative risk assessment of 79 behavioural, environmental and occupational, and metabolic risks or clusters of risks in 188 countries, 1990–2013: a systematic analysis for the Global Burden of Disease Study 2013. The Lancet 2015, 386(10010):2287-2323.
41. Moy FM, Bulgiba A: The modified NCEP ATP III criteria maybe better than the IDF criteria in diagnosing Metabolic Syndrome among Malays in Kuala Lumpur. BMC Public Health 2010, 10(1):678.
42. Oh EG, Bang SY, Hyun SS, Kim SH, Chu SH, Jeon JY, Im JA, Lee MK, Lee JE: Effects of a 6-month lifestyle modification intervention on the cardiometabolic risk factors and health-related qualities of life in women with metabolic syndrome. Metabolism: clinical and experimental 2010, 59(7):1035-1043.
43. Panagiotakos DB, Pitsavos C, Skoumas Y, Stefanadis C: The association between food patterns and the metabolic syndrome using principal components analysis: The ATTICA Study. Journal of the American Dietetic Association 2007, 107(6):979-987.
44. Yosaee S, Erfani M, Bazrafshan M, Entezami N, Alinavaz M, Akbari M, Soltani S, Djafarian K: Correlation between diet quality and metabolic syndrome. Journal of Nutrition and Food Security 2017, 2(3):213-220.
45. United States Department of, Health and Human Services : 2015–2020 dietary guidelines for Americans. Washington (DC): USDA 2015.
46. Eckel RH, Jakicic JM, Ard JD, de Jesus JM, Miller NH, Hubbard VS, Lee IM, Lichtenstein AH, Loria CM, Millen BE et al: 2013 AHA/ACC Guideline on Lifestyle Management to Reduce Cardiovascular Risk. Circulation 2014, 129(25 suppl 2):S76-S99.
47. de Toro-Martín J, Arsenault BJ, Després J-P, Vohl M-C: Precision Nutrition: A Review of Personalized Nutritional Approaches for the Prevention and Management of Metabolic Syndrome. Nutrients 2017, 9(8):913.
48. Richards EM, Pepine CJ, Raizada MK, Kim S: The gut, its microbiome, and hypertension. Current hypertension reports 2017, 19(4):36.
52
49. Bäckhed F, Ley RE, Sonnenburg JL, Peterson DA, Gordon JI: Host-bacterial mutualism in the human intestine. Science (New York, NY) 2005, 307(5717):1915-1920.
50. Qin J: A human gut microbial gene catalogue established by metagenomic sequencing. Nature 2010, 464(7285):59-65.
51. Ley RE: Ecological and evolutionary forces shaping microbial diversity in the human intestine. Cell 2006, 124:837-848.
52. Fukuda S, Ohno H: Gut microbiome and metabolic diseases. Seminars in Immunopathology 2014, 36(1):103-114.
53. Zimmer J, Lange B, Frick JS, Sauer H, Zimmermann K, Schwiertz A, Rusch K, Klosterhalfen S, Enck P: A vegan or vegetarian diet substantially alters the human colonic faecal microbiota. European journal of clinical nutrition 2012, 66(1):53-60.
54. Turnbaugh PJ, Hamady M, Yatsunenko T, Cantarel BL, Duncan A, Ley RE, Sogin ML, Jones WJ, Roe BA, Affourtit JP: A core gut microbiome in obese and lean twins. nature 2009, 457(7228):480.
55. Bo T, Shao S, Wu D, Niu S, Zhao J, Gao L: Relative variations of gut microbiota in disordered cholesterol metabolism caused by high-cholesterol diet and host genetics. MicrobiologyOpen 2017, 6(4).
56. Spolidoro JV, Pitrez Filho ML, Vargas LT, Santana JoC, Pitrez E, Hauschild JA, Bruscato NM, Moriguchi EH, Medeiros AK, Piva JP: Waist circumference in children and adolescents correlate with metabolic syndrome and fat deposits in young adults. Clinical Nutrition 2013, 32(1):93-97.
57. Wang YC, McPherson K, Marsh T, Gortmaker SL, Brown M: Health and economic burden of the projected obesity trends in the USA and the UK. The Lancet 2011, 378(9793):815-825.
58. Turnbaugh PJ, Ley RE, Mahowald MA, Magrini V, Mardis ER, Gordon JI: An obesity-associated gut microbiome with increased capacity for energy harvest. Nature 2006, 444(7122):1027-1031.
59. Schwiertz A, Taras D, Schäfer K, Beijer S, Bos NA, Donus C, Hardt PD: Microbiota and SCFA in lean and overweight healthy subjects. Obesity (Silver Spring, Md) 2010, 18(1):190-195.
60. Cani PD, Amar J, Iglesias MA, Poggi M, Knauf C, Bastelica D, Neyrinck AM, Fava F, Tuohy KM, Chabo C: Metabolic endotoxemia initiates obesity and insulin resistance. Diabetes 2007, 56(7):1761-1772.
61. Chobanian AV: National Heart, Lung, and Blood Institute Joint National Committee on Prevention, Detection, Evaluation, and Treatment of High Blood Pressure; National High Blood Pressure Education Program Coordinating Committee. The Seventh Report of the Joint National Committee on Prevention, Detection, Evaluation, and Treatment of High Blood Pressure: the JNC 7 report. Jama 2003, 289:2560-2572.
62. Holmes E, Loo RL, Stamler J, Bictash M, Yap IK, Chan Q, Ebbels T, De Iorio M, Brown IJ, Veselkov KA et al: Human metabolic phenotype diversity and its association with diet and blood pressure. Nature 2008, 453(7193):396-400.
63. Garduño-Diaz SD, Khokhar S: South Asian dietary patterns and their association with risk factors for the metabolic syndrome. Journal of Human Nutrition and Dietetics 2013, 26(2):145-155.
64. Deshmukh-Taskar PR, O'Neil CE, Nicklas TA, Yang SJ, Liu Y, Gustat J, Berenson GS: Dietary patterns associated with metabolic syndrome, sociodemographic and lifestyle factors in young adults: the Bogalusa Heart Study. Public health nutrition 2009, 12(12):2493-2503.
65. Tortosa A, Bes-Rastrollo M, Sanchez-Villegas A, Basterra-Gortari FJ, Nunez-Cordoba JM, Martinez-Gonzalez MA: Mediterranean diet inversely associated with the incidence of metabolic syndrome: the SUN prospective cohort. Diabetes Care 2007, 30(11):2957-2959.
66. Ussar S, Griffin NW, Bezy O, Fujisaka S, Vienberg S, Softic S, Deng L, Bry L, Gordon JI, Kahn CR: Interactions between gut microbiota, host genetics and diet modulate the predisposition to obesity and metabolic syndrome. Cell metabolism 2015, 22(3):516-530.

53
67. Bäckhed F, Manchester JK, Semenkovich CF, Gordon JI: Mechanisms underlying the resistance to diet-induced obesity in germ-free mice. Proceedings of the National Academy of Sciences 2007, 104(3):979-984.
68. Zhang C, Zhang M, Wang S, Han R, Cao Y, Hua W, Mao Y, Zhang X, Pang X, Wei C: Interactions between gut microbiota, host genetics and diet relevant to development of metabolic syndromes in mice. The ISME journal 2010, 4(2):232.
69. Kastorini CM: The effect of Mediterranean diet on metabolic syndrome and its components: a metaanalysis of 50 studies and 534906 individuals. J Am Coll Cardiol 2011, 57:1299-1313.
70. Trichopoulou A, Lagiou P: Healthy traditional Mediterranean diet: an expression of culture, history, and lifestyle. Nutrition reviews 1997, 55(11):383-389.
71. Steffen LM, Van Horn L, Daviglus ML, Zhou X, Reis JP, Loria CM, Jacobs DR, Duffey KJ: A modified Mediterranean diet score is associated with a lower risk of incident metabolic syndrome over 25 years among young adults: the CARDIA (Coronary Artery Risk Development in Young Adults) study. The British journal of nutrition 2014, 112(10):1654-1661.
72. Salas-Salvadó J, Fernández-Ballart J, Ros E, et al.: Effect of a mediterranean diet supplemented with nuts on metabolic syndrome status: One-year results of the predimed randomized trial. Archives of Internal Medicine 2008, 168(22):2449-2458.
73. Esposito K, Marfella R, Ciotola M, et al.: Effect of a mediterranean-style diet on endothelial dysfunction and markers of vascular inflammation in the metabolic syndrome: A randomized trial. JAMA 2004, 292(12):1440-1446.
74. Vlismas K, Panagiotakos DB, Pitsavos C, Chrysohoou C, Skoumas Y, Sitara M, Yfantopoulos J, Stavrinos V, Stefanadis C: Quality, but not cost, of diet is associated with 5-year incidence of CVD: the ATTICA study. Public health nutrition 2010, 13(11):1890-1897.
75. Wu GD: Linking longterm dietary patterns with gut microbial enterotypes. Science 2011, 334(6052):105-108.
76. Miccoli R, Bianchi C, Odoguardi L, Penno G, Caricato F, Giovannitti MG, Pucci L, Del Prato S: Prevalence of the metabolic syndrome among Italian adults according to ATP III definition. NUMECD Nutrition, Metabolism and Cardiovascular Diseases 2005, 15(4):250-254.
77. Smyth C: The Pittsburgh sleep quality index. Medsurg nursing : official journal of the Academy of Medical-Surgical Nurses 2003, 12(4):261-262.
78. Cohen S, Kamarck T, Mermelstein R: Perceived stress scale. Measuring stress: A guide for health and social scientists 1994.
79. Block G, Gillespie C, Rosenbaum EH, Jenson C: A rapid food screener to assess fat and fruit and vegetable intake. American journal of preventive medicine 2000, 18(4):284-288.
80. Freedson PS, Melanson E, Sirard J: Calibration of the Computer Science and Applications, Inc. accelerometer. Medicine and science in sports and exercise 1998, 30(5):777-781.
81. Flores GE, Henley JB, Fierer N: A direct PCR approach to accelerate analyses of human-associated microbial communities. PloS one 2012, 7(9):e44563.
82. The Human Microbiome Project C: Structure, function and diversity of the healthy human microbiome. NATURE -LONDON- 2012, 486(7402):207-214.
83. Famodu OA, West Virginia University. Human N, Foods: Using a multi-omic approach to investigate a diet intervention in young adults at risk of disease. Morgantown, West Virginia :: West Virginia University; 2017.
84. Caporaso JG, Kuczynski J, Stombaugh J, Bittinger K, Bushman FD, Costello EK, Fierer N, Peña AG, Goodrich JK, Gordon JI et al: QIIME allows analysis of high-throughput community sequencing data. Nature methods 2010, 7(5):335-336.
85. Conlon MA, Bird AR: The impact of diet and lifestyle on gut microbiota and human health. Nutrients 2014, 7(1):17-44.
86. Kovatcheva-Datchary P, Arora TS: Nutrition, the gut microbiome and the metabolic syndrome. Best Practice & Research Clinical Gastroenterology 2013, 27(1):59-72.
54
87. Mathews AT, Famodu OA, Olfert MD, Murray PJ, Cuff CF, Downes MT, Haughey NJ, Colby SE, Chantler PD, Olfert IM: Efficacy of nutritional interventions to lower circulating ceramides in young adults: FRUVEDomic pilot study. Physiological Reports 2017, 5(13):e13329.
88. Chen C-H, Ting C-T, Nussbacher A, Nevo E, Kass DA, Pak P, Wang S-P, Chang M-S, Yin FC: Validation of carotid artery tonometry as a means of estimating augmentation index of ascending aortic pressure. Hypertension 1996, 27(2):168-175.
89. Chen C-H, Nevo E, Fetics B, Pak PH, Yin FC, Maughan WL, Kass DA: Estimation of central aortic pressure waveform by mathematical transformation of radial tonometry pressure: validation of generalized transfer function. Circulation 1997, 95(7):1827-1836.
90. Sharman JE, Lim R, Qasem AM, Coombes JS, Burgess MI, Franco J, Garrahy P, Wilkinson IB, Marwick TH: Validation of a generalized transfer function to noninvasively derive central blood pressure during exercise. Hypertension 2006, 47(6):1203-1208.
91. Roman MJ, Naqvi TZ, Gardin JM, Gerhard-Herman M, Jaff M, Mohler E: American society of echocardiography report: Clinical application of noninvasive vascular ultrasound in cardiovascular risk stratification: a report from the American Society of Echocardiography and the Society for Vascular Medicine and Biology. Vascular medicine 2006, 11(3):201-211.
92. Fournier SB, Reger BL, Donley DA, Bonner DE, Warden BE, Gharib W, Failinger CF, Olfert MD, Frisbee JC, Olfert IM: Exercise reveals impairments in left ventricular systolic function in patients with metabolic syndrome. Experimental physiology 2014, 99(1):149-163.
93. Bartram AK, Lynch MD, Stearns JC, Moreno-Hagelsieb G, Neufeld JD: Generation of multimillion-sequence 16S rRNA gene libraries from complex microbial communities by assembling paired-end Illumina reads. Applied and environmental microbiology 2011, 77(11):3846-3852.
94. Stokes ME, Davis CS, Koch GG: Categorical data analysis using SAS: SAS institute; 2012. 95. Morgan XC, Kabakchiev B, Waldron L, Tyler AD, Tickle TL, Milgrom R, Stempak JM, Gevers
D, Xavier RJ, Silverberg MS: Associations between host gene expression, the mucosal microbiome, and clinical outcome in the pelvic pouch of patients with inflammatory bowel disease. Genome biology 2015, 16(1):67.
96. Cohen J: Statistical power analyses for the social sciences. Hillsdale, NJ, Lawrence Erlbauni Associates 1988.
97. Michie S, Abraham C, Whittington C, McAteer J, Gupta S: Effective techniques in healthy eating and physical activity interventions: a meta-regression. Health Psychology 2009, 28(6):690.
98. Honrath K, Wagner MG, Rhee Y: Does Nutrition Education with Fruit and Vegetable Supplementation Increase Fruit and Vegetable Intake and Improve Anthropometrics of Overweight or Obese People of Varying Socioeconomic Status? Ecology of food and nutrition 2017:1-18.
99. Gillespie R: Manufacturing knowledge: A history of the Hawthorne experiments: Cambridge University Press; 1993.
100. MacNeill V, Foley M, Quirk A, McCambridge J: Shedding light on research participation effects in behaviour change trials: a qualitative study examining research participant experiences. BMC public health 2016, 16(1):91.
101. McCambridge J, Witton J, Elbourne DR: Systematic review of the Hawthorne effect: New concepts are needed to study research participation effects. Journal of Clinical Epidemiology 2014, 67(3):267-277.
102. Sterns RH: Disorders of plasma sodium—causes, consequences, and correction. New England Journal of Medicine 2015, 372(1):55-65.
103. Tierney AC, McMonagle J, Shaw D, Gulseth H, Helal O, Saris W, Paniagua J, Gołąbek-Leszczyñska I, Defoort C, Williams CM: Effects of dietary fat modification on insulin
55
sensitivity and on other risk factors of the metabolic syndrome—LIPGENE: a European randomized dietary intervention study. International journal of obesity 2011, 35(6):800-809.
104. Klein S, Fontana L, Young VL, Coggan AR, Kilo C, Patterson BW, Mohammed BS: Absence of an effect of liposuction on insulin action and risk factors for coronary heart disease. N Engl J Med 2004, 350(25):2549-2557.
105. Klein S, Luu K, Gasic S, Green A: Effect of weight loss on whole body and cellular lipid metabolism in severely obese humans. The American journal of physiology 1996, 270(5 Pt 1):E739-745.
106. Dinh DM, Volpe GE, Duffalo C, Bhalchandra S, Tai AK, Kane AV, Wanke CA, Ward HD: Intestinal microbiota, microbial translocation, and systemic inflammation in chronic HIV infection. J Infect Dis 2015, 211(1):19-27.
107. Turnbaugh PJ, Ridaura VK, Faith JJ, Rey FE, Knight R, Gordon JI: The effect of diet on the human gut microbiome: a metagenomic analysis in humanized gnotobiotic mice. Science translational medicine 2009, 1(6):6ra14.
108. Zhang H, DiBaise JK, Zuccolo A, Kudrna D, Braidotti M, Yu Y, Parameswaran P, Crowell MD, Wing R, Rittmann BE: Human gut microbiota in obesity and after gastric bypass. Proceedings of the National Academy of Sciences 2009, 106(7):2365-2370.
109. Shin N-R, Whon TW, Bae J-W: Proteobacteria: microbial signature of dysbiosis in gut microbiota. Trends in biotechnology 2015, 33(9):496-503.
110. Yin J, Han H, Li Y, Liu Z, Zhao Y, Fang R, Huang X, Zheng J, Ren W, Wu F et al: Lysine Restriction Affects Feed Intake and Amino Acid Metabolism via Gut Microbiome in Piglets. Cellular physiology and biochemistry : international journal of experimental cellular physiology, biochemistry, and pharmacology 2017, 44(5):1749-1761.
111. Mohan Mahesh M, Chow C-ET, Ryan CN, Chan LS, Dufour J, Aye PP, Blanchard J, Moehs CP, Sestak K: Dietary Gluten-Induced Gut Dysbiosis Is Accompanied by Selective Upregulation of microRNAs with Intestinal Tight Junction and Bacteria-Binding Motifs in Rhesus Macaque Model of Celiac Disease. Nutrients 2016, 8(11).
112. Cotillard A, Kennedy SP, Kong LC, Prifti E, Pons N, Le Chatelier E, Almeida M, Quinquis B, Levenez F, Galleron N: Dietary intervention impact on gut microbial gene richness. Nature 2013, 500(7464):585.
113. Reedy J, Krebs-Smith SM, Miller PE, Liese AD, Kahle LL, Park Y, Subar AF: Higher Diet Quality Is Associated with Decreased Risk of All-Cause, Cardiovascular Disease, and Cancer Mortality among Older Adults1, 2. The Journal of nutrition 2014, 144(6):881-889.
114. Turnbaugh PJ, Backhed F, Fulton L, Gordon JI: Diet-induced obesity is linked to marked but reversible alterations in the mouse distal gut microbiome. Cell host & microbe 2008, 3(4):213-223.
115. Ervin RB: Prevalence of metabolic syndrome among adults 20 years of age and over, by sex, age, race and ethnicity, and body mass index: United States. National health statistics reports 2009, 13:1-8.

56
Appendices Appendix A: Tables Table 1: Demographic and health related characteristics of the study population. Total n=17 (%) Included a n=15 (%) Age (mean ± SD) 22.2 ± 3.4 21.9 ± 3.1
Sex (% male) 6 (35.3) 6 (40) Race/ethnicity (%) White 13 (76.5) 11 (73.3) African-American 3 (17.6) 3 (20) Asian 1 (5.9) 1 (6.7) Hispanic 0 0 Other 0 0 Body Mass Index (mean ± SD) Total 37.95 ± 5.04 37.8 ± 5.4 Male 36.52 ± 4.5 36.80 ± 4.6 Female 38.73 ± 5.3 38.60 ± 5.6 Hemoglobin A1C (%) (mean ± SD) 5.3 ± 0.4 5.3 ± 0.3 From Appalachia (%) 9 (52.9) 9 (60) aTwo participants were excluded due to dietary and medication non-compliance.
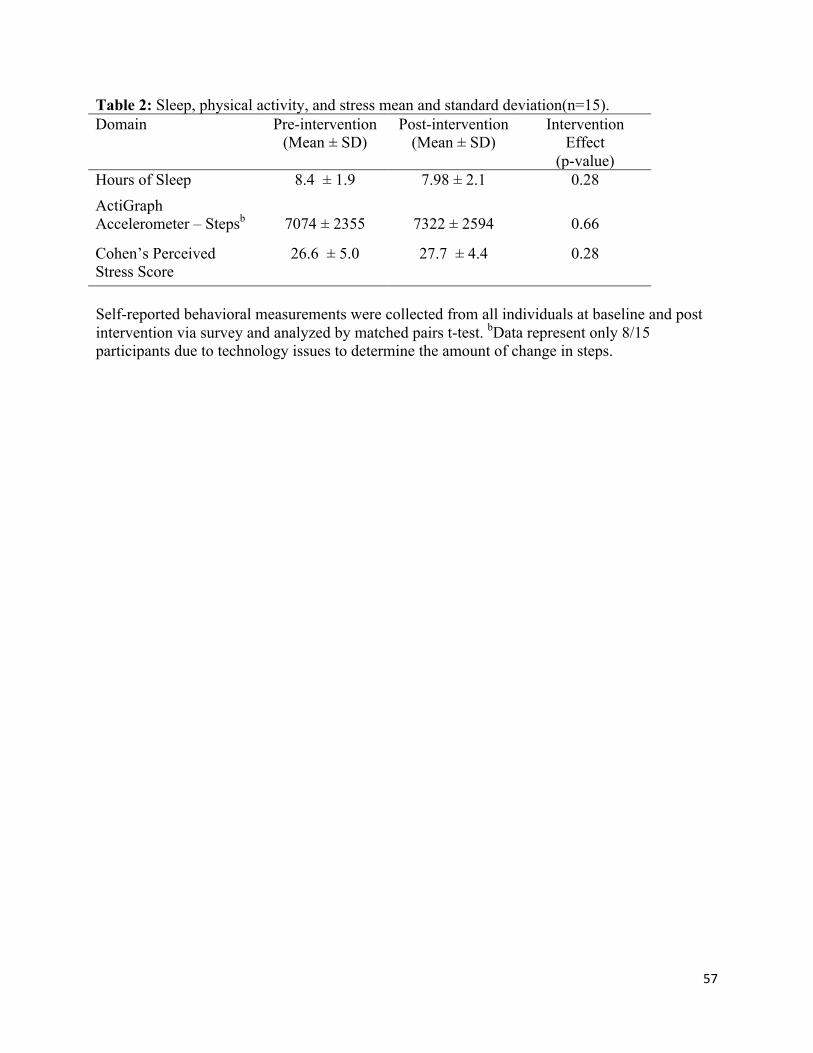
57
Table 2: Sleep, physical activity, and stress mean and standard deviation(n=15). Domain
Pre-intervention (Mean ± SD)
Post-intervention (Mean ± SD)
Intervention Effect
(p-value) Hours of Sleep 8.4 ± 1.9 7.98 ± 2.1 0.28 ActiGraph Accelerometer – Stepsb
7074 ± 2355
7322 ± 2594
0.66
Cohen’s Perceived Stress Score
26.6 ± 5.0 27.7 ± 4.4 0.28
Self-reported behavioral measurements were collected from all individuals at baseline and post intervention via survey and analyzed by matched pairs t-test. bData represent only 8/15 participants due to technology issues to determine the amount of change in steps.
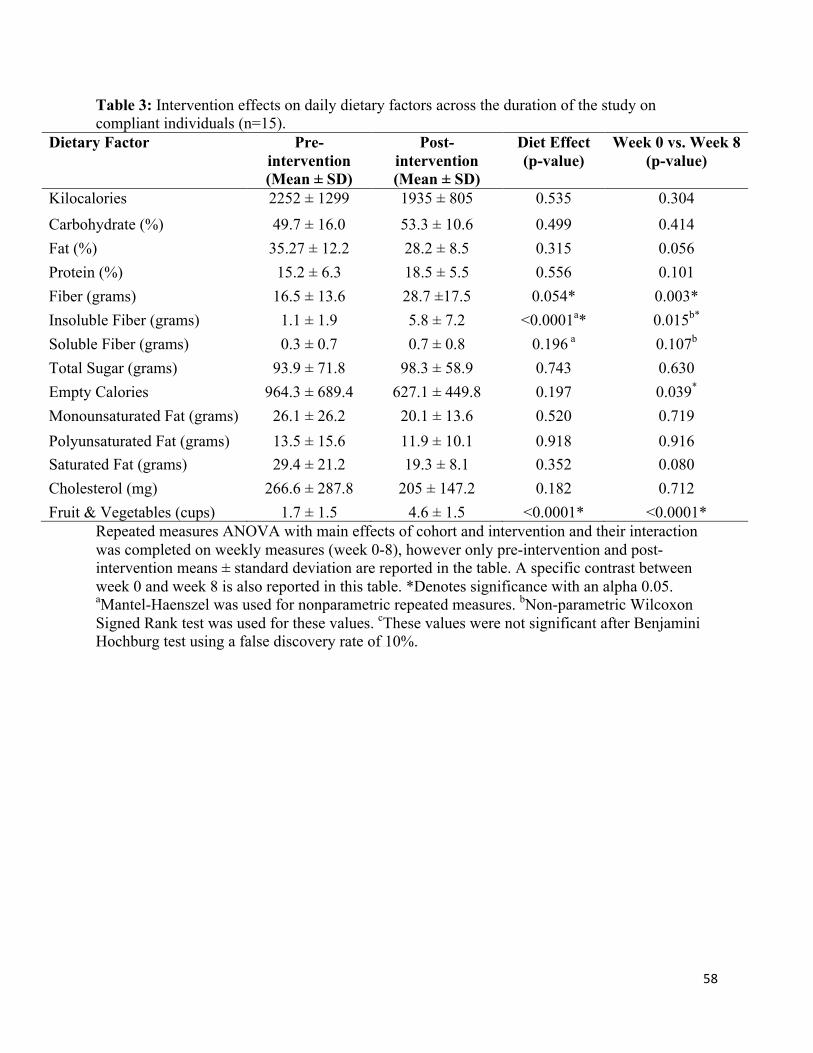
58
Table 3: Intervention effects on daily dietary factors across the duration of the study on compliant individuals (n=15).
Dietary Factor Pre-intervention (Mean ± SD)
Post- intervention (Mean ± SD)
Diet Effect (p-value)
Week 0 vs. Week 8 (p-value)
Kilocalories 2252 ± 1299 1935 ± 805 0.535 0.304 Carbohydrate (%) 49.7 ± 16.0 53.3 ± 10.6 0.499 0.414 Fat (%) 35.27 ± 12.2 28.2 ± 8.5 0.315 0.056 Protein (%) 15.2 ± 6.3 18.5 ± 5.5 0.556 0.101 Fiber (grams) 16.5 ± 13.6 28.7 ±17.5 0.054* 0.003* Insoluble Fiber (grams) 1.1 ± 1.9 5.8 ± 7.2 <0.0001a* 0.015b* Soluble Fiber (grams) 0.3 ± 0.7 0.7 ± 0.8 0.196 a 0.107b
Total Sugar (grams) 93.9 ± 71.8 98.3 ± 58.9 0.743 0.630 Empty Calories 964.3 ± 689.4 627.1 ± 449.8 0.197 0.039*
Monounsaturated Fat (grams) 26.1 ± 26.2 20.1 ± 13.6 0.520 0.719 Polyunsaturated Fat (grams) 13.5 ± 15.6 11.9 ± 10.1 0.918 0.916 Saturated Fat (grams) 29.4 ± 21.2 19.3 ± 8.1 0.352 0.080 Cholesterol (mg) 266.6 ± 287.8 205 ± 147.2 0.182 0.712 Fruit & Vegetables (cups) 1.7 ± 1.5 4.6 ± 1.5 <0.0001* <0.0001*
Repeated measures ANOVA with main effects of cohort and intervention and their interaction was completed on weekly measures (week 0-8), however only pre-intervention and post-intervention means ± standard deviation are reported in the table. A specific contrast between week 0 and week 8 is also reported in this table. *Denotes significance with an alpha 0.05. aMantel-Haenszel was used for nonparametric repeated measures. bNon-parametric Wilcoxon Signed Rank test was used for these values. cThese values were not significant after Benjamini Hochburg test using a false discovery rate of 10%.
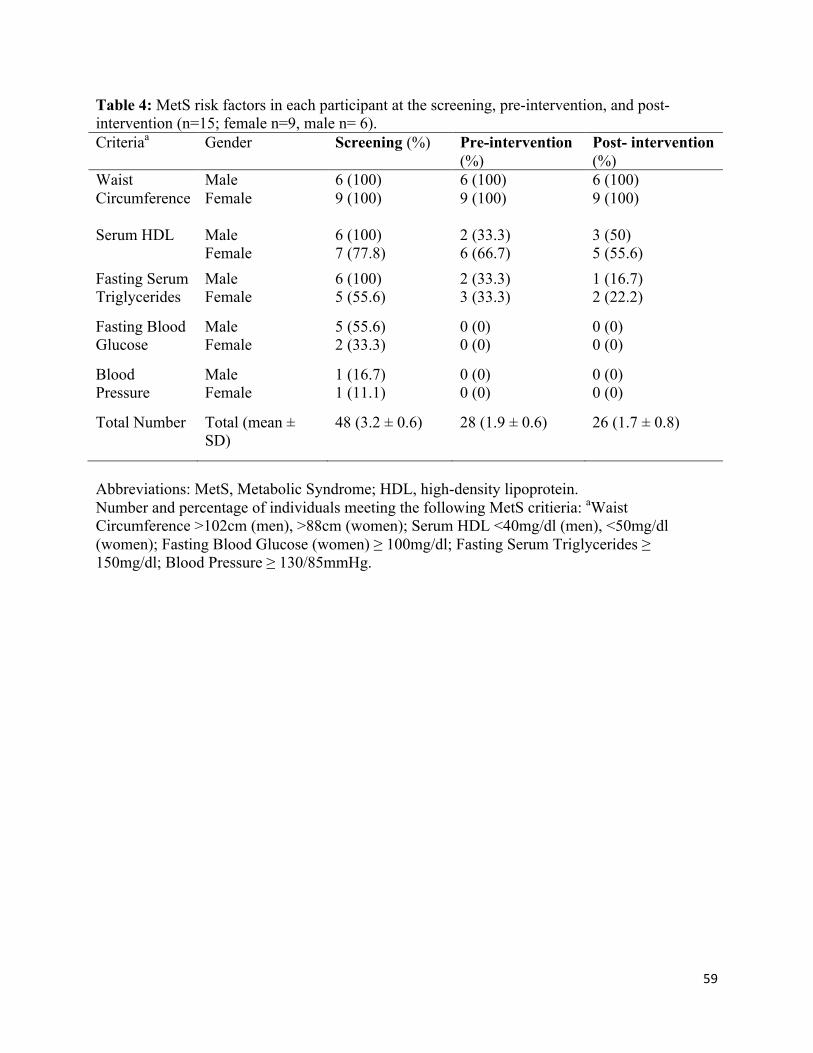
59
Table 4: MetS risk factors in each participant at the screening, pre-intervention, and post-intervention (n=15; female n=9, male n= 6). Criteriaa Gender Screening (%) Pre-intervention
(%) Post- intervention (%)
Waist Circumference
Male Female
6 (100) 9 (100)
6 (100) 9 (100)
6 (100) 9 (100)
Serum HDL Male Female
6 (100) 7 (77.8)
2 (33.3) 6 (66.7)
3 (50) 5 (55.6)
Fasting Serum Triglycerides
Male Female
6 (100) 5 (55.6)
2 (33.3) 3 (33.3)
1 (16.7) 2 (22.2)
Fasting Blood Glucose
Male Female
5 (55.6) 2 (33.3)
0 (0) 0 (0)
0 (0) 0 (0)
Blood Pressure
Male Female
1 (16.7) 1 (11.1)
0 (0) 0 (0)
0 (0) 0 (0)
Total Number Total (mean ± SD)
48 (3.2 ± 0.6) 28 (1.9 ± 0.6) 26 (1.7 ± 0.8)
Abbreviations: MetS, Metabolic Syndrome; HDL, high-density lipoprotein. Number and percentage of individuals meeting the following MetS critieria: aWaist Circumference >102cm (men), >88cm (women); Serum HDL <40mg/dl (men), <50mg/dl (women); Fasting Blood Glucose (women) ≥ 100mg/dl; Fasting Serum Triglycerides ≥ 150mg/dl; Blood Pressure ≥ 130/85mmHg.
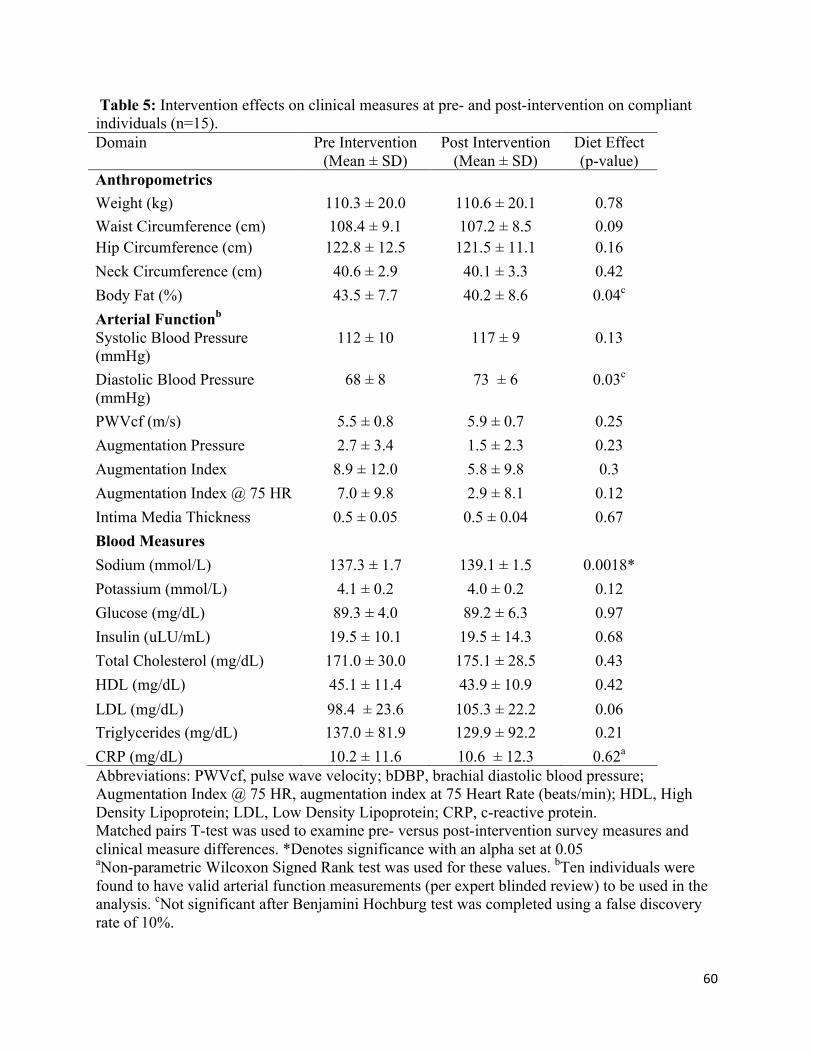
60
Table 5: Intervention effects on clinical measures at pre- and post-intervention on compliant individuals (n=15). Domain
Pre Intervention (Mean ± SD)
Post Intervention (Mean ± SD)
Diet Effect (p-value)
Anthropometrics Weight (kg) 110.3 ± 20.0 110.6 ± 20.1 0.78 Waist Circumference (cm) 108.4 ± 9.1 107.2 ± 8.5 0.09 Hip Circumference (cm) 122.8 ± 12.5 121.5 ± 11.1 0.16 Neck Circumference (cm) 40.6 ± 2.9 40.1 ± 3.3 0.42 Body Fat (%) 43.5 ± 7.7 40.2 ± 8.6 0.04c
Arterial Functionb Systolic Blood Pressure (mmHg)
112 ± 10 117 ± 9 0.13
Diastolic Blood Pressure (mmHg)
68 ± 8 73 ± 6 0.03c
PWVcf (m/s) 5.5 ± 0.8 5.9 ± 0.7 0.25 Augmentation Pressure 2.7 ± 3.4 1.5 ± 2.3 0.23 Augmentation Index 8.9 ± 12.0 5.8 ± 9.8 0.3 Augmentation Index @ 75 HR 7.0 ± 9.8 2.9 ± 8.1 0.12 Intima Media Thickness 0.5 ± 0.05 0.5 ± 0.04 0.67 Blood Measures Sodium (mmol/L) 137.3 ± 1.7 139.1 ± 1.5 0.0018* Potassium (mmol/L) 4.1 ± 0.2 4.0 ± 0.2 0.12 Glucose (mg/dL) 89.3 ± 4.0 89.2 ± 6.3 0.97 Insulin (uLU/mL) 19.5 ± 10.1 19.5 ± 14.3 0.68 Total Cholesterol (mg/dL) 171.0 ± 30.0 175.1 ± 28.5 0.43 HDL (mg/dL) 45.1 ± 11.4 43.9 ± 10.9 0.42 LDL (mg/dL) 98.4 ± 23.6 105.3 ± 22.2 0.06 Triglycerides (mg/dL) 137.0 ± 81.9 129.9 ± 92.2 0.21 CRP (mg/dL) 10.2 ± 11.6 10.6 ± 12.3 0.62a
Abbreviations: PWVcf, pulse wave velocity; bDBP, brachial diastolic blood pressure; Augmentation Index @ 75 HR, augmentation index at 75 Heart Rate (beats/min); HDL, High Density Lipoprotein; LDL, Low Density Lipoprotein; CRP, c-reactive protein. Matched pairs T-test was used to examine pre- versus post-intervention survey measures and clinical measure differences. *Denotes significance with an alpha set at 0.05 aNon-parametric Wilcoxon Signed Rank test was used for these values. bTen individuals were found to have valid arterial function measurements (per expert blinded review) to be used in the analysis. cNot significant after Benjamini Hochburg test was completed using a false discovery rate of 10%.
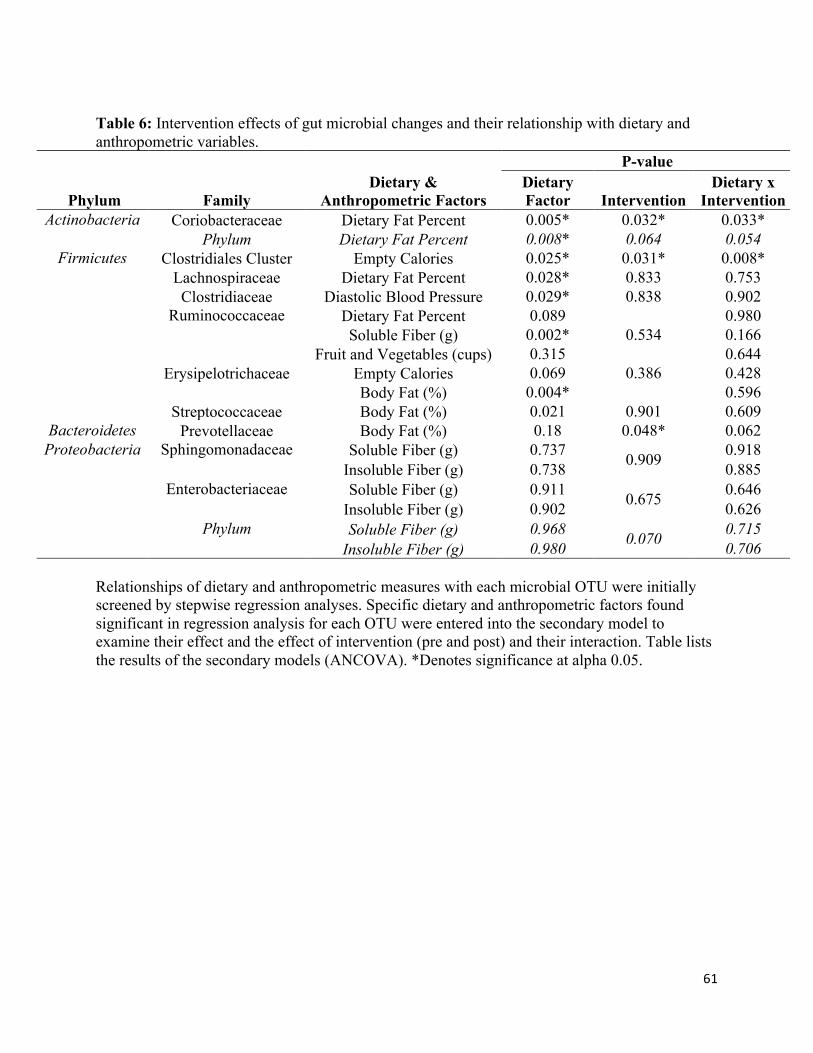
61
Table 6: Intervention effects of gut microbial changes and their relationship with dietary and anthropometric variables.
Phylum Family Dietary &
Anthropometric Factors
P-value Dietary Factor Intervention
Dietary x Intervention
Actinobacteria Coriobacteraceae Dietary Fat Percent 0.005* 0.032* 0.033* Phylum Dietary Fat Percent 0.008* 0.064 0.054
Firmicutes Clostridiales Cluster Empty Calories 0.025* 0.031* 0.008* Lachnospiraceae Dietary Fat Percent 0.028* 0.833 0.753 Clostridiaceae Diastolic Blood Pressure 0.029* 0.838 0.902
Ruminococcaceae Dietary Fat Percent 0.089 0.534
0.980 Soluble Fiber (g) 0.002* 0.166
Fruit and Vegetables (cups) 0.315 0.644 Erysipelotrichaceae Empty Calories 0.069 0.386 0.428 Body Fat (%) 0.004* 0.596 Streptococcaceae Body Fat (%) 0.021 0.901 0.609
Bacteroidetes Prevotellaceae Body Fat (%) 0.18 0.048* 0.062 Proteobacteria Sphingomonadaceae Soluble Fiber (g) 0.737 0.909 0.918
Insoluble Fiber (g) 0.738 0.885 Enterobacteriaceae Soluble Fiber (g) 0.911 0.675 0.646
Insoluble Fiber (g) 0.902 0.626 Phylum Soluble Fiber (g) 0.968 0.070 0.715
Insoluble Fiber (g) 0.980 0.706 Relationships of dietary and anthropometric measures with each microbial OTU were initially screened by stepwise regression analyses. Specific dietary and anthropometric factors found significant in regression analysis for each OTU were entered into the secondary model to examine their effect and the effect of intervention (pre and post) and their interaction. Table lists the results of the secondary models (ANCOVA). *Denotes significance at alpha 0.05.
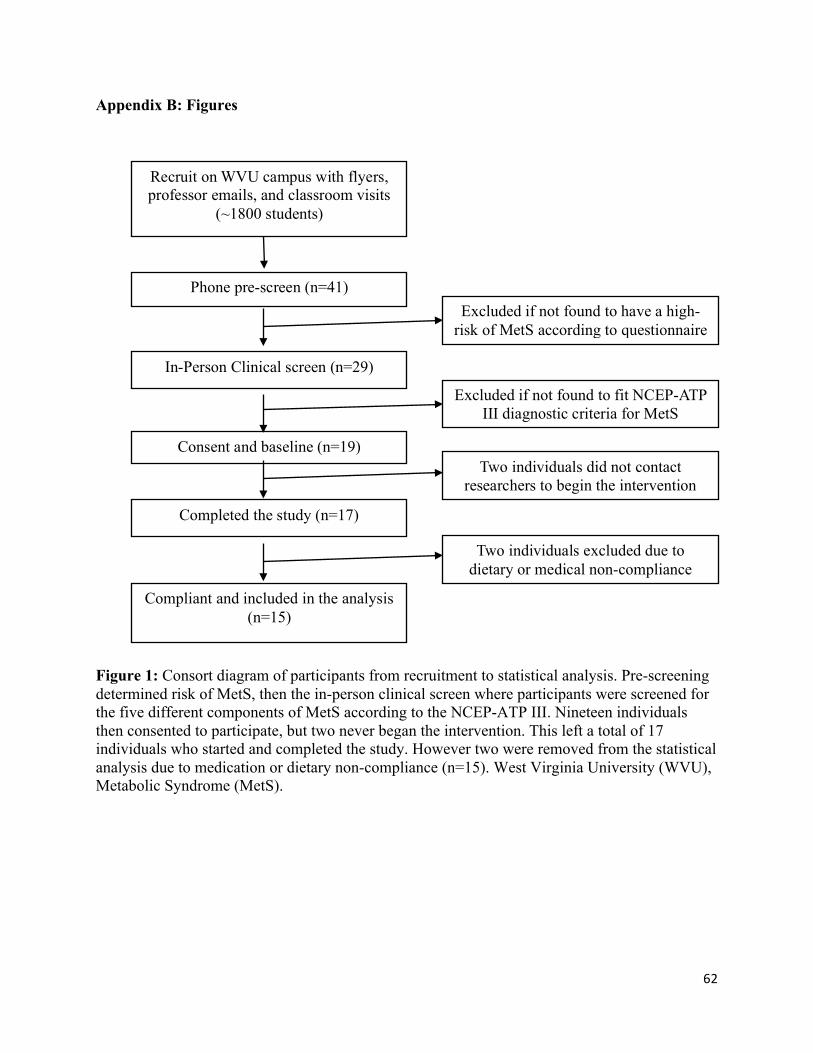
62
Appendix B: Figures
Figure 1: Consort diagram of participants from recruitment to statistical analysis. Pre-screening determined risk of MetS, then the in-person clinical screen where participants were screened for the five different components of MetS according to the NCEP-ATP III. Nineteen individuals then consented to participate, but two never began the intervention. This left a total of 17 individuals who started and completed the study. However two were removed from the statistical analysis due to medication or dietary non-compliance (n=15). West Virginia University (WVU), Metabolic Syndrome (MetS).
Recruit on WVU campus with flyers, professor emails, and classroom visits
(~1800 students)
Compliant and included in the analysis (n=15)
Phone pre-screen (n=41)
In-Person Clinical screen (n=29)
Consent and baseline (n=19)
Completed the study (n=17)
Excluded if not found to have a high-risk of MetS according to questionnaire
Two individuals excluded due to dietary or medical non-compliance
Excluded if not found to fit NCEP-ATP III diagnostic criteria for MetS
Two individuals did not contact researchers to begin the intervention
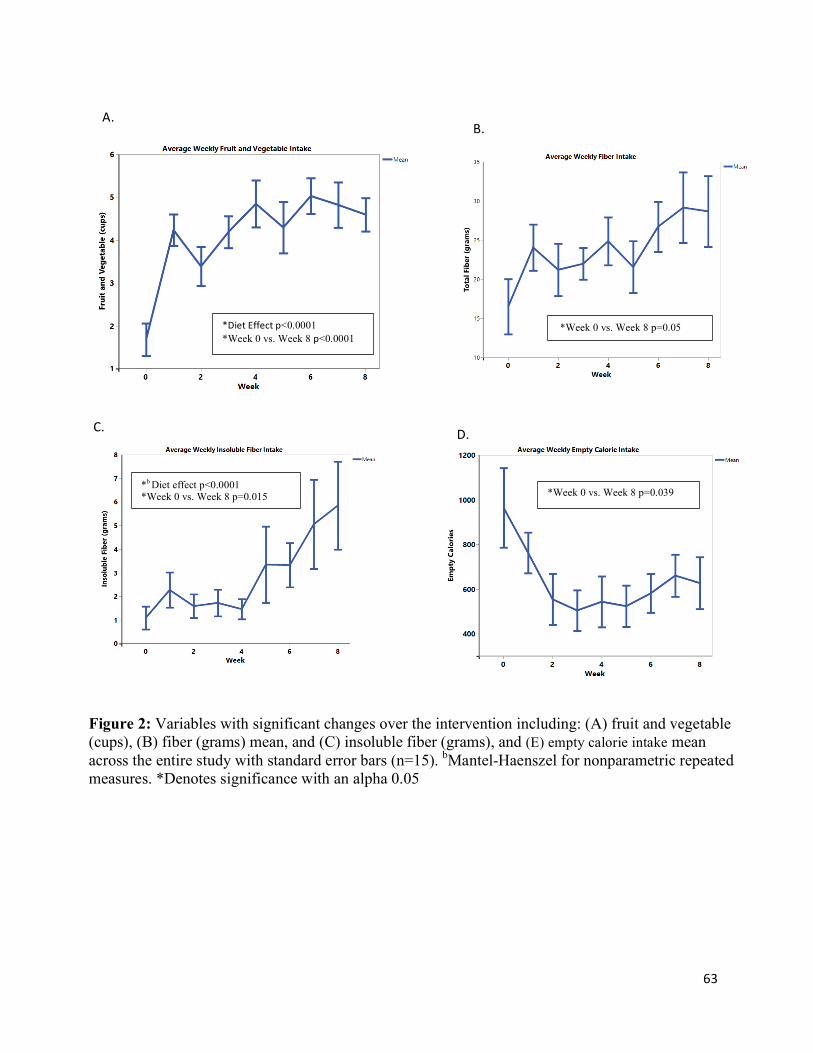
63
*DietEffectp<0.0001*Week 0 vs. Week 8 p<0.0001
*b Diet effect p<0.0001 *Week 0 vs. Week 8 p=0.015
C.
Figure 2: Variables with significant changes over the intervention including: (A) fruit and vegetable (cups), (B) fiber (grams) mean, and (C) insoluble fiber (grams), and (E) empty calorie intake mean across the entire study with standard error bars (n=15). bMantel-Haenszel for nonparametric repeated measures. *Denotes significance with an alpha 0.05
A. B.
*Week 0 vs. Week 8 p=0.05
D.
*Week 0 vs. Week 8 p=0.039
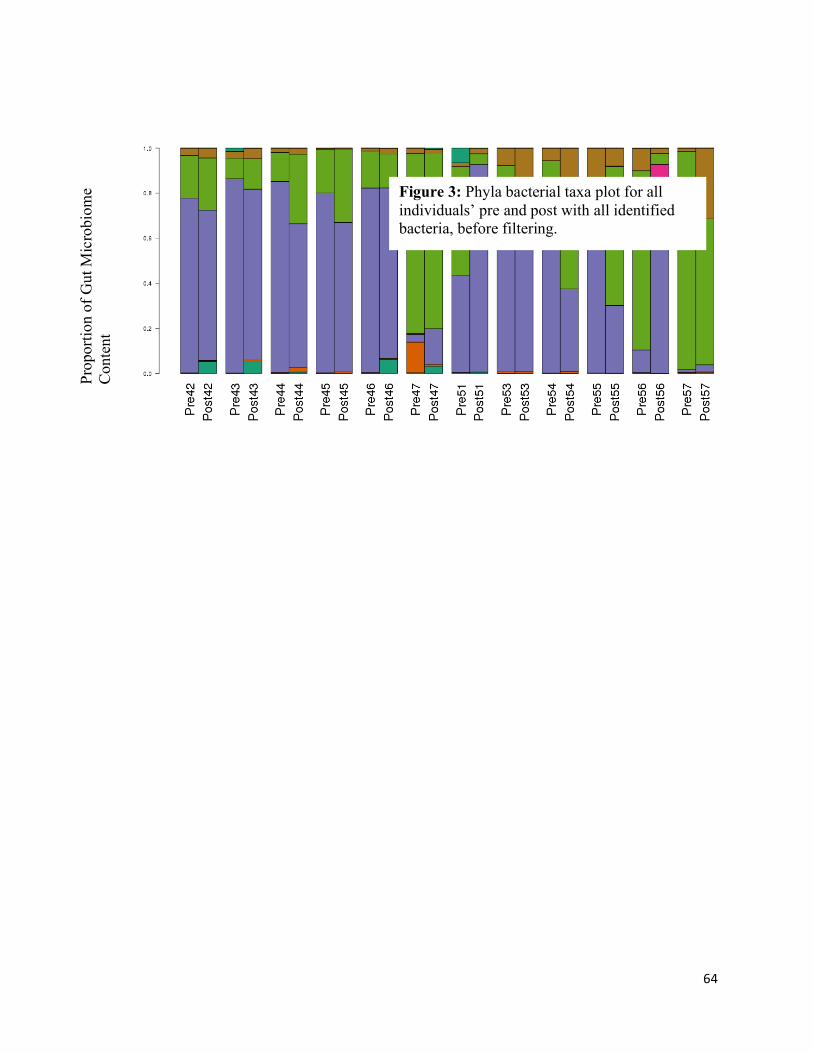
64
Figure 3: Phyla bacterial taxa plot for all individuals’ pre and post with all identified bacteria, before filtering.
Prop
ortio
n of
Gut
Mic
robi
ome
Con
tent
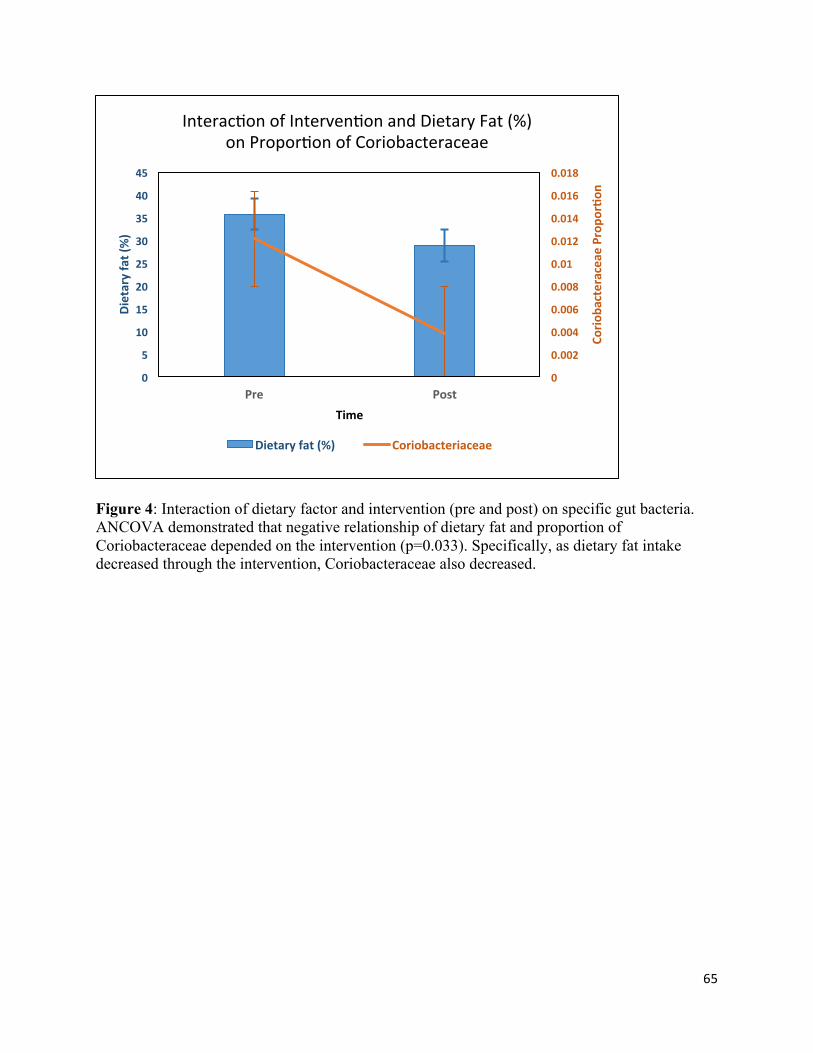
65
0
0.002
0.004
0.006
0.008
0.01
0.012
0.014
0.016
0.018
0
5
10
15
20
25
30
35
40
45
Pre Post
Corio
bacteraceaeProp
or7o
n
Dietaryfat(%)
Time
Interac>onofInterven>onandDietaryFat(%)onPropor>onofCoriobacteraceae
Dietaryfat(%) Coriobacteriaceae
Figure 4: Interaction of dietary factor and intervention (pre and post) on specific gut bacteria. ANCOVA demonstrated that negative relationship of dietary fat and proportion of Coriobacteraceae depended on the intervention (p=0.033). Specifically, as dietary fat intake decreased through the intervention, Coriobacteraceae also decreased.

66
0
0.002
0.004
0.006
0.008
0.01
0.012
0
200
400
600
800
1000
1200
Pre Post
ClostridialesC
lusterPropo
r7on
EmptyCa
lorie
s(Kcals)
Time
Interac>onofInterven>onandEmptyCaloriesonPropor>onofClostridialesCluster
EmptyKcals ClostridialesCluster
Figure 5: Interaction of dietary factor and intervention (pre and post) on specific gut bacteria. ANCOVA demonstrated that negative relationship of empty calories and proportion of Clostridiales cluster depended on the intervention (p=0.008). Specifically, as empty calorie intake decreased through the intervention, Clostridiales cluster also decreased.
67
Appendix C: Cost of Diet Intervention Manuscript
Monetary Cost of the MyPlate Diet in Young Adults: Higher Expenses Associated with Increased Fruits and Vegetables Consumption
Rashel L. Clark 1, Oluremi A. Famodu 1, Makenzie L. Barr 1, Rebecca L. Hagedorn 1, Jane Ruseski 2, Jade A. White 1, Caitlyn A. Warner 1, Alex A. Morrell 1, Pamela J. Murray 3, I. Mark Olfert 3, Joseph W. McFadden 1, Marianne T. Downes 3, Sara E. Colby, Melissa D. Olfert 1*
1 West Virginia University, Davis College of Agriculture, Natural Resources, and Design, Division of Animal and Nutritional Sciences, Morgantown, WV; [email protected] 2 West Virginia University, College of Business and Economics, Morgantown, WV 3 West Virginia University, School of Medicine Morgantown, WV 4 University of Tennessee, Knoxville, TN * Correspondence: [email protected]; Tel.: 304-293-1918 Abstract: One commonly reported barrier to healthy eating is cost. This analysis examined the food expenditures of young adults on a university campus following the USDA MyPlate guidelines for fruits and vegetables. Meal receipts and dietary intake were recorded weekly. Anthropometrics and clinical assessments were recorded pre and post-intervention. Researchers rated compliance based on the participant’s dietary food log, receipt matching, food pictures, and reports during weekly 1-hour consultations. Fifty-three young adults (18-30 years old) at-risk of, or diagnosed with, Metabolic Syndrome were enrolled, with 10 excluded (n=43) due to campus dining meal plan enrollment. A two sample t-test assessed differences in food costs and regression analysis determined associations between food cost and diet compliance while controlling for confounding factors of age, sex, and body mass index (BMI). Diet compliant subjects (n=38) had higher weekly food cost at $95.73 compared to non-compliant subjects (n=5) spending $66.24 (p=0.01). A regression analysis controlling for age, sex, BMI, and geographical region, also indicated cost differences based on diet compliance (p<0.0001). Results indicate a ~ $29.00 per week increase in food cost when eating the recommended amount of fruit and vegetables. These findings help to determine strategies to improve diet in this population. Keywords: keyword 1; young adults 2; healthy eating 3; cost 4; fruits and vegetables
68
1. Introduction
Diet quality and weight status are modifiable factors that contribute to diet-related
chronic diseases including cardiovascular disease, type 2 diabetes, and some cancers [1, 2].
Primary (preventing the onset of disease) and secondary (detecting disease in earliest stages)
prevention of these diseases can by influenced by adopting healthy eating behavior practices as
young adults. However, many young adults do not practice healthy eating [3]. A systematic
review of diet quality in 187 countries found young adults aged 20-29 had lower dietary quality
(44 points) than older adults (51 points) based on the Healthy Eating Index which is a validated
scoring system rated out of 100 points [4]. The United States Departments of Health and Human
Services (DHHS) and Department of Agriculture (USDA) Dietary Guidelines recommend
Americans fill half their plate with fruits and vegetables at each meal (4-5 cups daily) [5].
However, only 12.3% of adults older than 20 years of age meet the recommended goals for fruit
and vegetable intake [6]. For most young adults, the amount of fruit and vegetable intake is also
suboptimal for the prevention of chronic diseases of adulthood [7].
Many of the benefits of healthy eating, and maintaining a healthy weight are known. However,
the continued rise in weight [3, 8] and decrease in food quality [9] indicate there are barriers to
adopting healthier behaviors. Young adulthood is a time of self-definition, where individuals
establish and practice health habits which impact their weight status as they gain more
independence in economic and dietary practices [10]. Key influences of dietary intake include:
current and past social environment, cost, preparation, purchase and storage of food, knowledge,
motivation, and cost [3].
This study focuses on monetary costs associated with increasing intake of dietary fruit
and vegetables in the context of an 8-week, personalized, diet education program. Populations in
the United Kingdom [11], Holland [12], and the United States [13, 14] report food cost to be a
major barrier to buying healthy foods. Understanding the food cost of a healthy diet is important
because even with an effective education program, access to healthy foods, and motivation,
people may not make changes which can positively influence their health if they believe they
cannot afford the food. Increasing cost is known to influence choice and behavior (e.g. cigarettes
and alcohol, where increasing costs, such as taxes decreases consumption [15]). In this study we
evaluate food costs associated with a positive dietary change.
69
The cost of a healthy dietary pattern (increased in fruits, vegetables, and lean protein) has
been found to have an increased cost of $1.50 per day in the United States with healthier
meat/protein options contributing to the largest price difference [16]. Another study completed in
Europe found there was an 18% increase in cost when the diet consisted of all five food groups
instead of just two to three [17]. This increased cost can be an important consideration,
especially in the young adult, college population. Thirty-two percent of college students report
finances are traumatic or very difficult to handle [18]. An increased financial stress, higher cost
of healthy diet, and the young adult time period being understudied [7] indicates food cost for
this age group is an area which needs further investigation.
Mulik and Haynes Maslow used the most current publicly available data from the USDA
to analyze price of the MyPlate’s dietary guidelines for all food groups. Their findings indicate
that men and women (19-30 years old) have an increased cost of food with no significant
difference in the type of fruit or vegetable (fresh, canned, or frozen), with an average increase of
$3.82 in women, and $4.25 in men [19]. The main objective of this project was to determine the
amount of money spent by young adults not enrolled in a university meal plan to follow the U.S.
Dietary Guidelines (half of the plate consisting of fruits and vegetables) as a prospective study. It
was hypothesized that participants following the recommended diet would spend more money on
food, compared to those who did not follow the diet. A higher cost would be incurred because it
was hypothesized that individuals would replace the cheaper convenience foods (high in added
fats and sugars and generally low cost) they were eating with the fruits and vegetables the diet
intervention was encouraging them to eat..
2. Materials and Methods
An 8-week diet intervention study was conducted with 53 young adults from West
Virginia University (WVU) in two different cohorts, the spring of 2015 and the fall of 2016,
investigating increased fruit and vegetable intake on clinical and metabolomic outcomes [20].
Recruitment occurred through word of mouth, flyers posted around campus, announcements in
classrooms, and emails to the student body. To be eligible participants had to be between the
ages of 18-30, and be at-risk of, or diagnosed, with metabolic syndrome (MetS). ‘At-risk of
MetS’ was defined as 3 or more of the following risk factors- any of the 5 MetS risk factors in
addition to BMI (>25 for men or women), personal or family history of CVD, diabetes (Type 1,
Type 2, or gestational), or abnormal lipids, race/ethnicity, low physical activity, increased
70
sedentary time, poor nutritional quality, current smoker, or excessive alcohol intake [21]. The
guidelines set forth by the National Cholesterol Education Program Adult Treatment Panel III
were used to diagnosis MetS. Individuals with three of the five following criteria were defined
with MetS: waist circumference >102cm (men), >88cm (women); serum triglycerides
>150mg/dl; serum HDL <40mg/dl (men), <50mg/dl (women); blood pressure ≥130/85mm Hg;
and fasting blood glucose ≥ 100mg/dl [22]. This was determined through in-person
anthropometric and blood measurements. Exclusions included a diagnosis or treatment of a
serious mental or behavioral disorder within the past year, and pregnancy. Students eating the
campus meal plan were removed from this analysis since they did not have out of pocket costs
for much of their food consumption. Approval was obtained from the WVU Institutional Review
Board and informed consent was collected from each subject prior to enrollment in the study.
Outcome Measures
Demographic information was collected during the health assessment. Geographic region
was defined as if the participant identified as being from an Appalachian (encompassing all of
West Virginia and parts of 12 other states along the Appalachian Mountains), or non-
Appalachian area. Clinical and nutrition history was obtained to assess risk and/or diagnosis of
MetS. Weight was measured when participants were minimally clothed, without shoes using
digital scales (SECA 874) and recorded to the nearest 0.1 kg. Height was measured in a standing
position without shoes using a Stadiometer (SECA 213). Body mass index (BMI) was calculated
and expressed in kg/m2. Waist circumference was measured at the narrowest point, and hip
circumference was measured at the maximum point over light clothing using a Gulick tape
meter. Height and waist circumference measurements were recorded to the nearest 0.1 cm after
being taken twice, and averaged for analysis.
Diet compliance was determined through subjective and objective measures to eliminate
bias throughout the 8-week intervention. Compliance with diet and assessment of food
expenditures were determined through food pictures (generally taken on their phone and emailed
or show to researcher during counseling session), participant’s dietary food log (matched to food
shopping receipts), food pictures (to determine portion sizes) and weekly 1-hour consultation
with a trained researcher. Cost of all liquid and solid food and alcohol were determined through
food receipts collected from participants every week. Costs were recorded and labeled according
to location the food was purchased. Receipts were retrieved from participants for grocery store,
71
restaurant, vending machine, cafe, and any other food establishment purchases. Participants
recorded cost of food in individual food logs when receipts were unavailable.
Study procedures
Each participant was instructed to follow a calorie intake (based on the U.S. Dietary
Guidelines for Americans) to maintain weight calculated using their current weight, age, and
physical activity status; they were asked to maintain their current activity level. All subjects were
asked to consume a diet consisting of 4-5 servings fruit and vegetables and not change their
dietary supplement intake. As part of the main project protocol, participants in the first cohort
were also randomly assigned to follow the increased fruit and vegetable diet only, or to
additionally follow low refined carbohydrate or low fat recommendations. Each participant had
their USDA MyPlate food group recommendations calculated using the computer software
program Nutritionist ProTM (Axxya Systems LLC, Redmond, WA). Participants were provided
with kitchen tools (measuring cups and spoons, Tupperware containers, knives, etc.) to facilitate
food preparation at home, and financially compensated throughout the 8-week study for a total of
$250 at their weekly consultations.
During the weekly consultation participants also reviewed their daily food log with researchers
that were analyzed using Nutritionist Pro. At this time researchers would use motivational
interviewing techniques (all had completed a two-day training) to facilitate behavior change [23,
24] and develop strategies to reach personalized goals. The weekly dietary reports were used as
markers to gauge participant improvement and dietary intervention compliance. Dietary
compliance was defined as maintaining the diet intervention guidelines 75% of the time during 6
weeks of the intervention as determined by the researcher.
Statistical Analysis
Food costs were analyzed with the Stata 14 software system [25]. Two sample t-tests
with unequal variances were used to determine differences in food costs between compliant and
non-compliant dietary intake status. The unequal variances are used to account for the uneven
compliant and non-compliant groups [26]. Regression analyses were used to determine
differences between groups while controlling for age, sex, and BMI. Results were considered
significant if the two-tailed p-value was ≤0.05.
3. Results
72
Ten participants from the primary study group were excluded from this analysis (n=43)
because of enrollment in a campus dining plan which is based on fixed quarterly cost. This study
sample was 60% female, and most individuals were diet compliant (88%). Demographic
information is presented in Table 1 and baseline clinical measurents are included in Table 2.
Among participants there was an even distribution of BMI categories (normal weight= 15,
overweight= 10, obese= 8, and morbidly obese= 10). A detailed analysis of the dietary intake
associated with the larger study has been previously reported [20, 27]. By the end of the 8-week
study participants had demonstrated improvements in fruit and vegetable consumption, fiber
intake, and a decrease in empty calorie intake with no supplement intake included in the analysis.
Compliant individuals, on average, spent $95.73 ± $75.33 per week compared to non-compliant
individuals spending $66.24 ± $65.31 per week. Figure 1 shows the average weekly spending of
these two groups throughout the 8-week study. Compliant participants spent more on food
compared with non-compliant participants (p=0.02). Spending differences between compliant
and non-compliant groups remained after controlling for age, sex, BMI, and region (p<0.0001).
There were differences in amount spent on food between obese and morbidly obese
(p<0.05), and between obese and overweight (p<0.05) participants. Those that were overweight
spent $86.09 ± $8.07, obese spent $112.94 ± $10.52, and those that were morbidly obese spent
$82.82 ± $8.71. On average, females spent $101.82 ± $75.40, while males spent $77.42 ± $71.48
which was different with equal variances (p<0.01), and unequal variances (p<0.01).
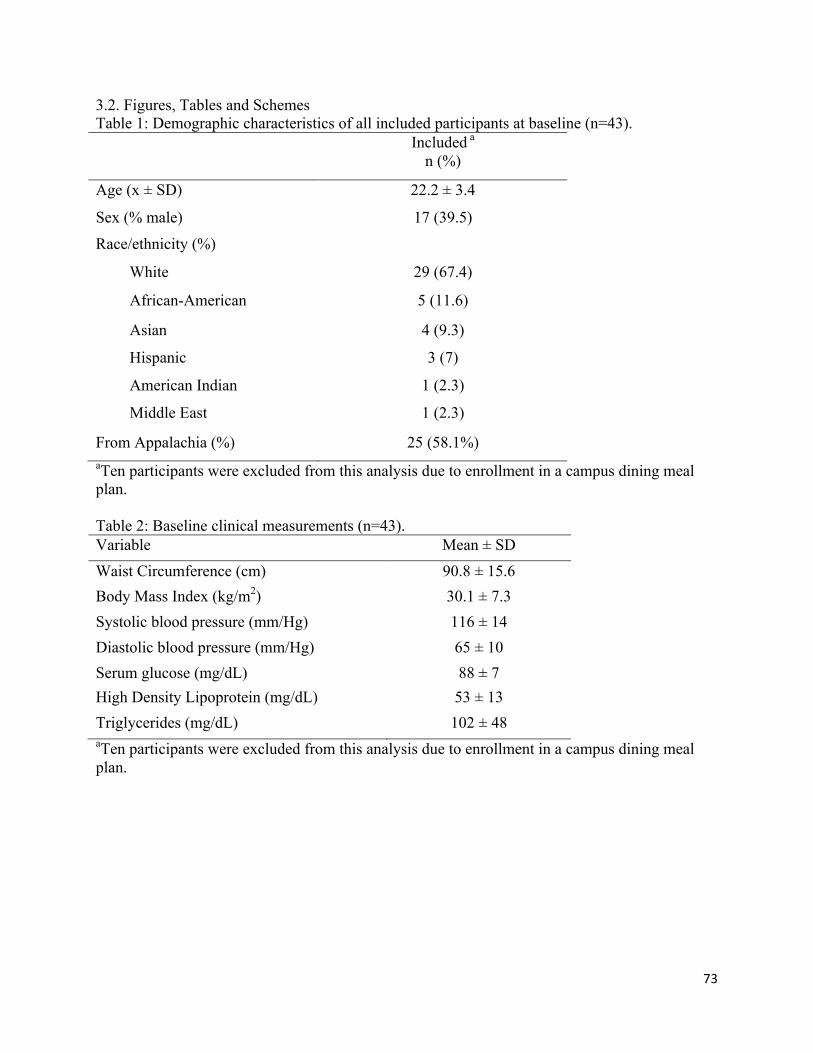
73
3.2. Figures, Tables and Schemes Table 1: Demographic characteristics of all included participants at baseline (n=43). Included a
n (%)
Age (x ± SD) 22.2 ± 3.4
Sex (% male) 17 (39.5)
Race/ethnicity (%)
White 29 (67.4)
African-American 5 (11.6)
Asian 4 (9.3)
Hispanic 3 (7)
American Indian 1 (2.3)
Middle East 1 (2.3)
From Appalachia (%) 25 (58.1%) aTen participants were excluded from this analysis due to enrollment in a campus dining meal plan. Table 2: Baseline clinical measurements (n=43). Variable Mean ± SD Waist Circumference (cm) 90.8 ± 15.6 Body Mass Index (kg/m2) 30.1 ± 7.3 Systolic blood pressure (mm/Hg) 116 ± 14 Diastolic blood pressure (mm/Hg) 65 ± 10 Serum glucose (mg/dL) 88 ± 7 High Density Lipoprotein (mg/dL) 53 ± 13 Triglycerides (mg/dL) 102 ± 48 aTen participants were excluded from this analysis due to enrollment in a campus dining meal plan.
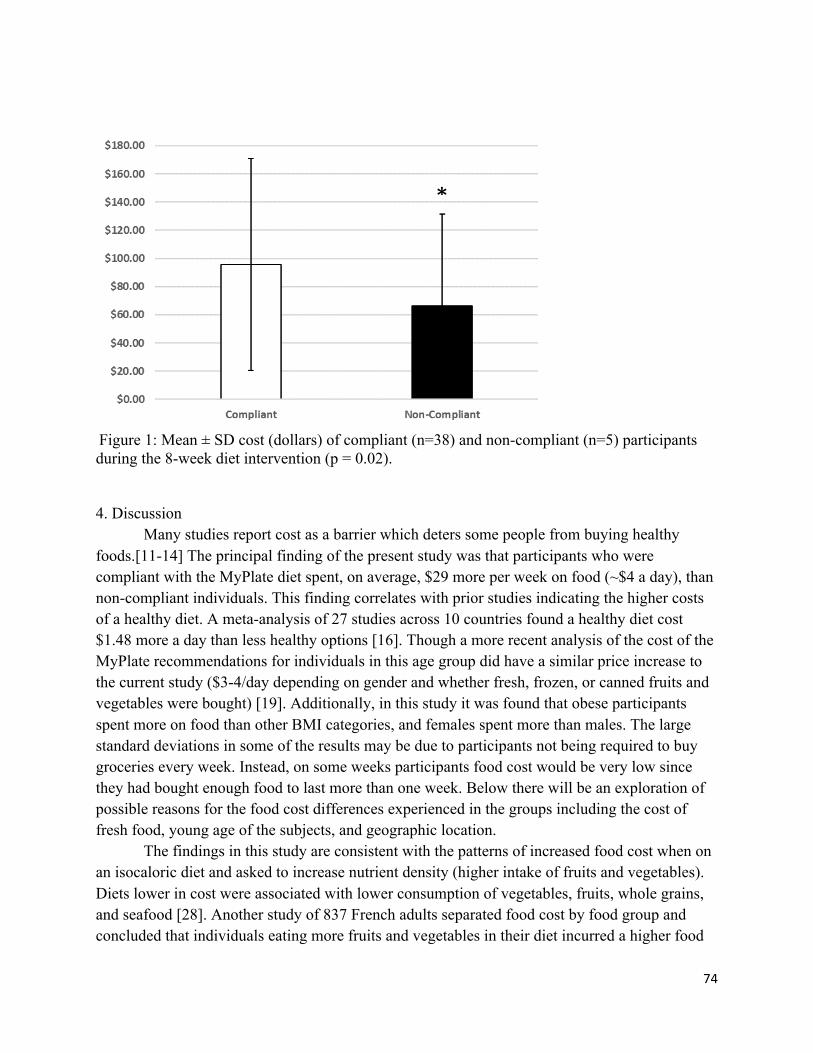
74
Figure 1: Mean ± SD cost (dollars) of compliant (n=38) and non-compliant (n=5) participants during the 8-week diet intervention (p = 0.02). 4. Discussion
Many studies report cost as a barrier which deters some people from buying healthy foods.[11-14] The principal finding of the present study was that participants who were compliant with the MyPlate diet spent, on average, $29 more per week on food (~$4 a day), than non-compliant individuals. This finding correlates with prior studies indicating the higher costs of a healthy diet. A meta-analysis of 27 studies across 10 countries found a healthy diet cost $1.48 more a day than less healthy options [16]. Though a more recent analysis of the cost of the MyPlate recommendations for individuals in this age group did have a similar price increase to the current study ($3-4/day depending on gender and whether fresh, frozen, or canned fruits and vegetables were bought) [19]. Additionally, in this study it was found that obese participants spent more on food than other BMI categories, and females spent more than males. The large standard deviations in some of the results may be due to participants not being required to buy groceries every week. Instead, on some weeks participants food cost would be very low since they had bought enough food to last more than one week. Below there will be an exploration of possible reasons for the food cost differences experienced in the groups including the cost of fresh food, young age of the subjects, and geographic location.
The findings in this study are consistent with the patterns of increased food cost when on an isocaloric diet and asked to increase nutrient density (higher intake of fruits and vegetables). Diets lower in cost were associated with lower consumption of vegetables, fruits, whole grains, and seafood [28]. Another study of 837 French adults separated food cost by food group and concluded that individuals eating more fruits and vegetables in their diet incurred a higher food
*
75
cost [29]. Another way to look at nutritional quality is using a measure of nutrient density. Foods with a higher nutrient content or density are frequently higher in cost compared to less healthy, calorie-dense options [30]. No matter how these studies determine dietary health, all come to the same conclusion of healthy diets costing more money.
In understanding the results of this study it is important to consider the unique experiences, education, and financial situations of young adulthood. Young adults and university students commonly do not have a traditional job and income stream, and have been found to make suboptimal financial decisions [31]. When stratifying diet cost by age group, young adults (20-29 years of age) spent the least, and had the lowest diet quality compared to any other age group [28]. The survey of young adults (18-38 years old) in the Bougalusa Heart study found those with lower income ate less fruits, vegetables, and more fats, sweetened beverages and statistically higher amounts of burgers and sandwiches [32]. The income of young adults as well as their inclination for ready-to-eat, processed, frozen, or canned foods for convenience may be a significant variable for young adults in college to eat a healthy diet [32-34].
To increase fruit and vegetable consumption, studies have employed educational interventions, public campaigns, and price reductions. The Supermarket Healthy Eating for Life Trial conducted a randomized controlled trial over three months to determine if a price reduction of fruits and vegetables would result in increased fruit and vegetable consumption. A 20% reduction in price resulted in a 35% increase in fruit and 15% increase in vegetable purchases. The behavior was not maintained six months after the intervention when food returned to their original cost [35]. A recent study developed a model to compare the effectiveness of a multimedia campaign or price decrease to increase fruit and vegetable consumption using current diet trends, national databases, and other studies to determine projected change. This study demonstrated that media and financial interventions increased fruit and vegetable intake; although the effect of the price reduction was more powerful and sustainable [36]. This supports the role for price incentive or reduced cost as a factor in food purchasing decisions. Our study provided research participation incentives ($250 total/eight weeks) that may have been used to offset participants’ food costs to enable them to buy healthier options, though the financial incentive could have been spent on other items as well.
What an individual chooses to eat is multi-factorial, and has other determinants beside cost. Other factors can include taste, convenience, interest in health and nutrition, familiarity of the food, cooking skills, and mental health [37, 38]. NHANES data determined taste was the most important factor in food decisions, followed by nutrition, cost and convenience [39]. Carlson and Frazao further explored reasons for food decisions. In this study it concluded that higher income individuals may spend more money on food, but their diet was not necessarily healthier than low income individuals [40]. This indicated that spending more money on food did not guarantee the food being purchased was healthy. So, aside from just financially incentivizing healthy food purchases, it is important to incorporate education on nutrition as well as how to cook and prepare healthy foods that are palatable to the individual.
76
The current study being examined used the combined education and financial incentive component to encourage healthy eating. Another point which should be explored is the perceptions that all healthy food is expensive. For example, the cost of the Mediterranean diet, which is viewed as being healthful, is perceived to cost more. However, some components of the diet cost less (e.g., certain vegetables, beans, legumes, grains, nuts, and some dairy products) and can replace the more expensive items [41]. The fact that healthier diets can cost less given different food-related decisions is a phenomenon called nutrition resilience. This indicates healthy diets can be maintained at a lower cost given optimal decision making and knowledge of how to eat healthy on a budget [42]. However, it may take more time than the current study (8-weeks) for individuals to be educated on, explore, and put into practice buying and eating food items that are healthy and affordable.
This study has limitations. First, there was a small number of individuals in the non-compliant group. This could have influenced the resultant higher cost for diet compliant individuals as well as the difference in the cost of healthy eating by BMI category. To accommodate the uneven group sizes a t-test with unequal variances was used in the statistical analysis [26]. Second, the amount of money spent on the different food groups was not determined in this study, though dietary intake reveals participants’ fruit and vegetable intake increased. Third, individual’s income was not obtained which may have also helped to see if that played a role in the amount of money spent on food. To overcome these limitations further studies should more thoroughly define the locations of the purchased food, as well as the food groups purchased, and include larger sample sizes of young adults from several different geographic regions. This would help to develop further explanations for these groups’ different food-spending habits. 5. Conclusions
This study contributes new data on the costs of implementing the USDA MyPlate guidelines for young adults living in a university setting. This age group spent $29 more per week, on average, when complying with the national health guidelines. These findings can contribute to research incentive design, program planning cost, and determining effective interventions to improve diet in this population. Future research regarding food costs is needed with this age group as well as an expanded analysis to include what food groups or choices are contributing to the food cost. Additional knowledge can contribute to education and public health interventions in this population to increase the affordability of healthy foods and give the education needed by this age group to improve budgeting and food preparation skills to be able to use the healthy foods in a way that is palatable to their tastes and lifestyle.
77
Author Contributions: The conception of the study was from MDO, PJM, IMO, and JWM, with cost/receipt analysis specifically over seen by MDO. Data was collected by RLC, OAF, MLB, RLH, JAM, CAW, and AAM. Data analysis was done by RLC, OAF, MLB, RLH, JAM, CAW, and AAM. And statistical analysis was completed by JR, RLC, OAF and MDO. First draft of the manuscript was prepared by RLC with input from MDO and final draft reviewed and approved by all of the authors. Funding: This work was funded by the following grants: USDA/AFRI #2014-67001-21851; WVU Hatch WVA00641; WV Clinical and Translational Science Institute (NIH/MIGMS Award Number U54GM104942); WVU Mountains of Excellence Pilot Grant Program; and WVU Pediatrics Department Grant Acknowledgments: The authors thank the entire FRUVEDomics research team at West Virginia University. Conflicts of Interest: The authors declare no conflict of interest. References 1. Murray Christopher JL: The State of US Health, 1990-2010. JAMA: Journal of the American Medical Association 2013, 310(6):591. 2. Holben DH, Zurmehly A, Jackson L, Holcomb JP: Food Insecurity Is Associated with Increased Diabetes Risk, Obesity, and Poorer Perceived Diet and Health among Women in Rural Appalachian Ohio. Journal of the American Dietetic Association Journal of the American Dietetic Association 2009, 109(9):A96. 3. Munt AE, Partridge SR, Allman-Farinelli M: The barriers and enablers of healthy eating among young adults: a missing piece of the obesity puzzle: A scoping review. Obesity Reviews 2017, 18(1):1-17. 4. Imamura F, Micha R, Khatibzadeh S, Fahimi S, Shi P, Powles J, Mozaffarian D, Nutrition GBoD, Group CDE: Dietary quality among men and women in 187 countries in 1990 and 2010: a systematic assessment. The Lancet Global Health 2015, 3(3):e132-e142. 5. Health UDo, Services H: 2015–2020 dietary guidelines for Americans. Washington (DC): USDA 2015. 6. MEMBERS WG, Go AS, Mozaffarian D, Roger VL, Benjamin EJ, Berry JD, Blaha MJ, Dai S, Ford ES, Fox CS: Heart disease and stroke statistics—2014 update: a report from the American Heart Association. circulation 2014, 129(3):e28. 7. Lipsky LM, Nansel TR, Haynie DL, Liu D, Li K, Pratt CA, Iannotti RJ, Dempster KW, Simons-Morton B: Diet quality of US adolescents during the transition to adulthood: changes and predictors. The American Journal of Clinical Nutrition 2017, 105(6):1424-1432. 8. AllmanFarinelli M: Nutrition promotion to prevent obesity in young adults. Healthcare 2015, 3:809-821. 9. Glendinning G, Alaunyte I, Amirabdollahian F: An investigation into gender variation in the nutritional status of young adults. Proceedings of the Nutrition Society 2015, 74(OCE5). 10. Nelson MC, Story M, Larson NI, Neumark-Sztainer D, Lytle LA: Emerging adulthood and college-aged youth: an overlooked age for weight-related behavior change. Obesity 2008, 16(10):2205-2211.
78
11. Hampson SE, Martin J, Jorgensen J, Barker M: A social marketing approach to improving the nutrition of low-income women and children: an initial focus group study. Public health nutrition 2009, 12(9):1563-1568. 12. Waterlander WE, De Mul A, Schuit AJ, Seidell JC, Steenhuis IH: Perceptions on the use of pricing strategies to stimulate healthy eating among residents of deprived neighbourhoods: a focus group study. International Journal of Behavioral Nutrition and Physical Activity 2010, 7(1):44. 13. Hill SE, Baskett K, Bradshaw HK, Prokosch ML, DelPriore DJ, Rodeheffer CD: Tempting foods and the affordability axiom: Food cues change beliefs about the costs of healthy eating. Appetite 2016, 107:274-279. 14. Dammann KW, Smith C: Factors affecting low-income women's food choices and the perceived impact of dietary intake and socioeconomic status on their health and weight. Journal of nutrition education and behavior 2009, 41(4):242-253. 15. Chaloupka FJ, Grossman M, Saffer H: The effects of price on alcohol consumption and alcohol-related problems. Alcohol research and health 2002, 26(1):22-34. 16. Rao M, Afshin A, Singh G, Mozaffarian D: Do healthier foods and diet patterns cost more than less healthy options? A systematic review and meta-analysis. BMJ open 2013, 3(12):e004277. 17. Conklin AI, Monsivais P, Khaw K-T, Wareham NJ, Forouhi NG: Dietary diversity, diet cost, and incidence of type 2 diabetes in the United Kingdom: a prospective cohort study. PLoS medicine 2016, 13(7):e1002085. 18. Association ACH: American College Health Association-National College Health Assessment II: Reference Group Executive Summary Fall 2016. In. Edited by Association ACH. Hanover, MD; 2017. 19. Mulik Kranti K, Haynes-Maslow L: The Affordability of MyPlate: An Analysis of SNAP Benefits and the Actual Cost of Eating According to the Dietary Guidelines. Journal of Nutrition Education and Behavior 2017, 49(8):623-631. 20. Mathews AT, Famodu OA, Olfert MD, Murray PJ, Cuff CF, Downes MT, Haughey NJ, Colby SE, Chantler PD, Olfert IM: Efficacy of nutritional interventions to lower circulating ceramides in young adults: FRUVEDomic pilot study. Physiological Reports 2017, 5(13):e13329. 21. Olfert M, Famodu O, Clark R, Holaskova I, Murray P, Waander T, Molina C, Morrell J: Development of an ‘At Risk for Metabolic Syndrome’Score. Journal of Nutrition Education and Behavior 2017, 49(7):S40. 22. Miccoli R, Bianchi C, Odoguardi L, Penno G, Caricato F, Giovannitti MG, Pucci L, Del Prato S: Prevalence of the metabolic syndrome among Italian adults according to ATP III definition. NUMECD Nutrition, Metabolism and Cardiovascular Diseases 2005, 15(4):250-254. 23. Miller WR, Rollnick S: Motivational interviewing: Helping people change: Guilford press; 2012. 24. Armstrong M, Mottershead T, Ronksley P, Sigal R, Campbell T, Hemmelgarn B: Motivational interviewing to improve weight loss in overweight and/or obese patients: a systematic review and meta-analysis of randomized controlled trials. Obesity reviews 2011, 12(9):709-723. 25. StataCorp: Stata Statistical Software: Release 14. In. College Station, TX: StataCorp LLC; 2015.
79
26. Ruxton GD: The unequal variance t-test is an underused alternative to Student's t-test and the Mann–Whitney U test. Behavioral Ecology 2006, 17(4):688-690. 27. Clark RL, Famodu OA, Barr ML, Murray PJ, Olfert IM, Downes MT, Cuff CC, McFadden JW, Chantler PD, Colby SE: Fruit and Vegetable Diet Intervention in Young Adults with Metabolic Syndrome: Fruvedomics Pilot Study. The FASEB Journal 2017, 31(1 Supplement):970.979-970.979. 28. Rehm CD, Monsivais P, Drewnowski A: Relation between diet cost and Healthy Eating Index 2010 scores among adults in the United States 2007-2010. Preventive medicine 2015, 73:70-75. 29. Drewnowski A, Darmon N, Briend A: Replacing fats and sweets with vegetables and fruits—a question of cost. American journal of public health 2004, 94(9):1555-1559. 30. Darmon N, Briend A, Drewnowski A: Energy-dense diets are associated with lower diet costs: a community study of French adults. Public health nutrition 2004, 7(1):21-27. 31. Letkiewicz JC: Self-control, financial literacy, and the financial behaviors of young adults: The Ohio State University; 2012. 32. Deshmukh-Taskar P, Nicklas TA, Yang S-J, Berenson GS: Does food group consumption vary by differences in socioeconomic, demographic, and lifestyle factors in young adults? The Bogalusa Heart Study. Journal of the American Dietetic Association 2007, 107(2):223-234. 33. Drewnowski A: Obesity and the food environment: dietary energy density and diet costs. American journal of preventive medicine 2004, 27(3):154-162. 34. French SA: Pricing effects on food choices. The Journal of nutrition 2003, 133(3):841S-843S. 35. Ball K, McNaughton SA, Le HN, Gold L, Mhurchu CN, Abbott G, Pollard C, Crawford D: Influence of price discounts and skill-building strategies on purchase and consumption of healthy food and beverages: outcomes of the Supermarket Healthy Eating for Life randomized controlled trial. The American journal of clinical nutrition 2015, 101(5):1055-1064. 36. Pearson-Stuttard J, Bandosz P, Rehm CD, Afshin A, Peñalvo JL, Whitsel L, Danaei G, Micha R, Gaziano T, Lloyd-Williams F: Comparing effectiveness of mass media campaigns with price reductions targeting fruit and vegetable intake on US cardiovascular disease mortality and race disparities. The American Journal of Clinical Nutrition 2017:ajcn143925. 37. Todd JE: Changes in eating patterns and diet quality among working-age adults, 2005-2010: United States Department of Agriculture, Economic Research Service; 2014. 38. Deaton A, Muellbauer J: Economics and consumer behavior: Cambridge university press; 1980. 39. Aggarwal A, Rehm CD, Monsivais P, Drewnowski A: Importance of taste, nutrition, cost and convenience in relation to diet quality: Evidence of nutrition resilience among US adults using National Health and Nutrition Examination Survey (NHANES) 2007–2010. Preventive medicine 2016, 90:184-192. 40. Carlson A, Frazão E: Food costs, diet quality and energy balance in the United States. Physiology & Behavior 2014, 134(5):20-31. 41. Drewnowski A, Eichelsdoerfer P: The Mediterranean diet: does it have to cost more? Public health nutrition 2009, 12(9A):1621-1628. 42. Drewnowski A, Kawachi I: Diets and health: How food decisions are shaped by biology, economics, geography, and social interactions. Big data 2015, 3(3):193-197.
1


2