Impact Fee - City of Albuquerque · Summary of Modifications ... Comparative Police Fees ... update...
128
Transcript of Impact Fee - City of Albuquerque · Summary of Modifications ... Comparative Police Fees ... update...


Impact Fee
Land Use Assumptions and Capital
Improvements Plan, 2012-2022
prepared for the
City of Albuquerque, New Mexico
Sites Southwest
Parsons Brinckerhoff
September 2012
Final Draft


Table of Contents
EXECUTIVE SUMMARY ................................................................................................................ 1 Background ...................................................................................................................................... 1 Overall Approach ............................................................................................................................ 1 Summary of Modifications ............................................................................................................. 2 Summary of Updated Fees ............................................................................................................. 3
INTRODUCTION ........................................................................................................................... 10 Legal Framework ........................................................................................................................... 10 Alternative Methodologies ........................................................................................................... 11 Role of the Capital Plan ................................................................................................................ 12
LAND USE ASSUMPTIONS ........................................................................................................ 13 Service Areas .................................................................................................................................. 13 Background .................................................................................................................................... 14 Existing Population and Housing ............................................................................................... 15 Existing Nonresidential Development ....................................................................................... 17 Housing Projections ...................................................................................................................... 21 Population Projections ................................................................................................................. 22 Nonresidential Projections ........................................................................................................... 23
ROADS ............................................................................................................................................... 25 Service Areas .................................................................................................................................. 25 Methodology .................................................................................................................................. 25 Service Units ................................................................................................................................... 28 Cost per Service Unit .................................................................................................................... 32 Net Cost per Service Unit ............................................................................................................ 35 Potential Impact Fee Schedule .................................................................................................... 36 Capital Plan ..................................................................................................................................... 39
PARKS ................................................................................................................................................ 41 Service Areas .................................................................................................................................. 41 Methodology .................................................................................................................................. 42 Service Units ................................................................................................................................... 42 Cost per Service Unit .................................................................................................................... 43 Net Cost per Service Unit ............................................................................................................ 44 Potential Impact Fee Schedule .................................................................................................... 47 Capital Plan ..................................................................................................................................... 47
OPEN SPACE ................................................................................................................................... 50 Service Areas .................................................................................................................................. 50 Methodology .................................................................................................................................. 50 Service Units ................................................................................................................................... 50 Cost per Service Unit .................................................................................................................... 50 Net Cost per Service Unit ............................................................................................................ 54 Potential Impact Fee Schedule .................................................................................................... 56 Capital Plan ..................................................................................................................................... 56
TRAILS ............................................................................................................................................... 59 Service Areas .................................................................................................................................. 59 Methodology .................................................................................................................................. 59 Service Units ................................................................................................................................... 59 Cost per Service Unit .................................................................................................................... 59 Net Cost per Service Unit ............................................................................................................ 61 Potential Impact Fee Schedule .................................................................................................... 62 Capital Plan ..................................................................................................................................... 63
FIRE .................................................................................................................................................... 65 Service Areas .................................................................................................................................. 65

Service Units ................................................................................................................................... 65 Cost per Service Unit .................................................................................................................... 65 Net Cost per Service Unit ............................................................................................................ 69 Potential Impact Fee Schedule .................................................................................................... 71 Capital Plan ..................................................................................................................................... 72
POLICE .............................................................................................................................................. 73 Service Areas .................................................................................................................................. 73 Service Units ................................................................................................................................... 73 Cost per Service Unit .................................................................................................................... 74 Net Cost per Service Unit ............................................................................................................ 76 Potential Impact Fee Schedule .................................................................................................... 78 Capital Plan ..................................................................................................................................... 79
DRAINAGE ...................................................................................................................................... 81 Service Areas .................................................................................................................................. 81 Capital Plan ..................................................................................................................................... 82
APPENDIX A: PERSONS PER UNIT ........................................................................................ 83 APPENDIX B: FUNCTIONAL POPULATION ...................................................................... 85 APPENDIX C: OUTSTANDING DEBT ................................................................................... 88 APPENDIX D: EXISTING ROAD INVENTORY – EAST............................................... 102 APPENDIX E: EXISTING ROAD INVENTORY – WEST ............................................... 108 APPENDIX F: PARK INVENTORY ........................................................................................ 115
List of Tables
Table 1. Summary of Updated Impact Fees ................................................................................... 3 Table 2. Comparison of Current and Updated Total Fees ........................................................... 8 Table 3. Housing Units by Type and Area, 2010-2025 ............................................................... 17 Table 4. Nonresidential Acres by Land Use, 2012 ....................................................................... 18 Table 5. Employment by Area, 2008-2015 ................................................................................... 19 Table 6. Typical Floor-to-Area Ratios ........................................................................................... 20 Table 7. FAR Assumptions by Service Area ................................................................................. 20 Table 8. Nonresidential Square Feet, 2012.................................................................................... 20 Table 9. Occupancy Rates ............................................................................................................... 21 Table 10. Average Square Feet per Employee .............................................................................. 21 Table 11. Housing Projections, 2012-2022 ................................................................................... 22 Table 12. Average Persons per Dwelling Unit ............................................................................. 22 Table 13. Population Projections.................................................................................................... 23 Table 14. Employment Projections ................................................................................................ 23 Table 15. Nonresidential Square Footage Projections ................................................................ 24 Table 16. National Average Trip Lengths ..................................................................................... 29 Table 17. Expected City-Wide Vehicle-Miles of Travel .............................................................. 30 Table 18. Local Travel Adjustment Factor ................................................................................... 30 Table 19. Travel Demand Schedule ............................................................................................... 31 Table 20. Existing and Projected Road Service Units, 2012-2022 ............................................. 31 Table 21. Comparison of Estimated to Actual Road Service Units, 2012 ............................... 32 Table 22. Existing Arterial Roadway Level of Service ................................................................ 32 Table 23. Generalized Roadway Costs per Lane-Mile ................................................................. 33 Table 24. Generalized Capacity per Lane ...................................................................................... 34 Table 25. Cost per Vehicle-Mile of Travel .................................................................................... 34 Table 26. Road Debt Credit ............................................................................................................ 35 Table 27. Transportation Infrastructure Tax Credit .................................................................... 36 Table 28. Road Net Cost per Service Unit .................................................................................... 36
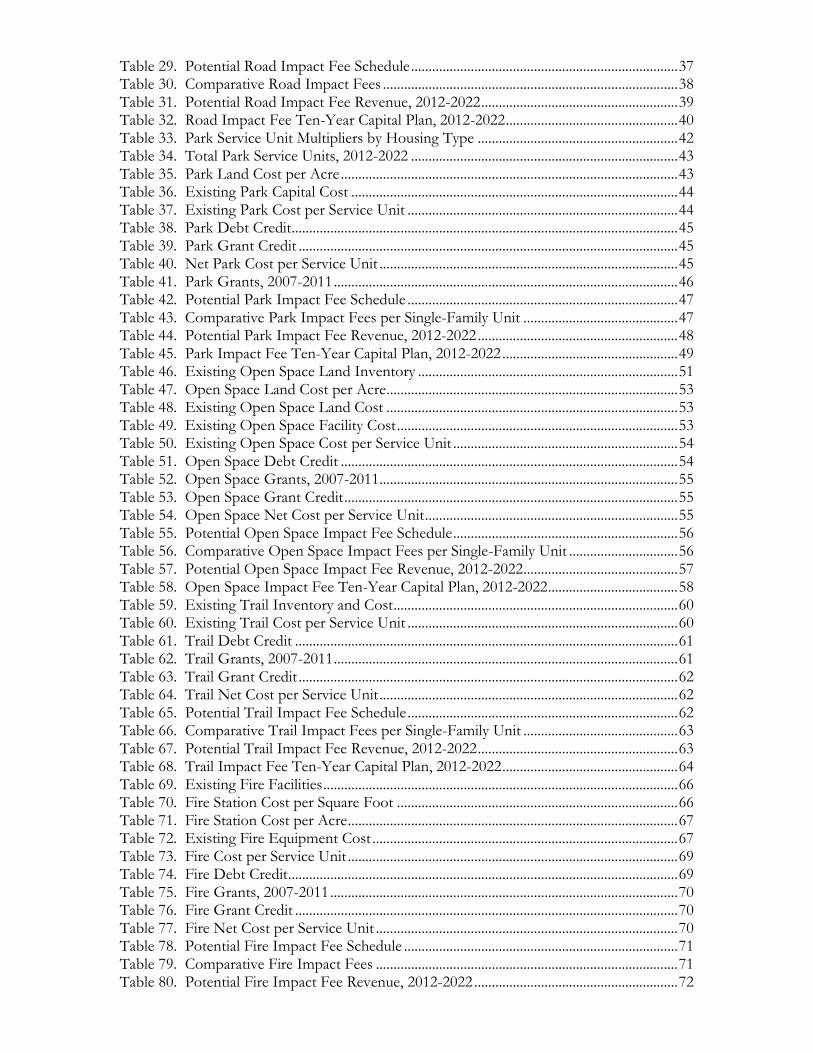
Table 29. Potential Road Impact Fee Schedule ............................................................................ 37 Table 30. Comparative Road Impact Fees .................................................................................... 38 Table 31. Potential Road Impact Fee Revenue, 2012-2022 ........................................................ 39 Table 32. Road Impact Fee Ten-Year Capital Plan, 2012-2022 ................................................. 40 Table 33. Park Service Unit Multipliers by Housing Type ......................................................... 42 Table 34. Total Park Service Units, 2012-2022 ............................................................................ 43 Table 35. Park Land Cost per Acre ................................................................................................ 43 Table 36. Existing Park Capital Cost ............................................................................................. 44 Table 37. Existing Park Cost per Service Unit ............................................................................. 44 Table 38. Park Debt Credit .............................................................................................................. 45 Table 39. Park Grant Credit ............................................................................................................ 45 Table 40. Net Park Cost per Service Unit ..................................................................................... 45 Table 41. Park Grants, 2007-2011 .................................................................................................. 46 Table 42. Potential Park Impact Fee Schedule ............................................................................. 47 Table 43. Comparative Park Impact Fees per Single-Family Unit ............................................ 47 Table 44. Potential Park Impact Fee Revenue, 2012-2022 ......................................................... 48 Table 45. Park Impact Fee Ten-Year Capital Plan, 2012-2022 .................................................. 49 Table 46. Existing Open Space Land Inventory .......................................................................... 51 Table 47. Open Space Land Cost per Acre ................................................................................... 53 Table 48. Existing Open Space Land Cost ................................................................................... 53 Table 49. Existing Open Space Facility Cost ................................................................................ 53 Table 50. Existing Open Space Cost per Service Unit ................................................................ 54 Table 51. Open Space Debt Credit ................................................................................................ 54 Table 52. Open Space Grants, 2007-2011 ..................................................................................... 55 Table 53. Open Space Grant Credit ............................................................................................... 55 Table 54. Open Space Net Cost per Service Unit ........................................................................ 55 Table 55. Potential Open Space Impact Fee Schedule ................................................................ 56 Table 56. Comparative Open Space Impact Fees per Single-Family Unit ............................... 56 Table 57. Potential Open Space Impact Fee Revenue, 2012-2022 ............................................ 57 Table 58. Open Space Impact Fee Ten-Year Capital Plan, 2012-2022 ..................................... 58 Table 59. Existing Trail Inventory and Cost ................................................................................. 60 Table 60. Existing Trail Cost per Service Unit ............................................................................. 60 Table 61. Trail Debt Credit ............................................................................................................. 61 Table 62. Trail Grants, 2007-2011 .................................................................................................. 61 Table 63. Trail Grant Credit ............................................................................................................ 62 Table 64. Trail Net Cost per Service Unit ..................................................................................... 62 Table 65. Potential Trail Impact Fee Schedule ............................................................................. 62 Table 66. Comparative Trail Impact Fees per Single-Family Unit ............................................ 63 Table 67. Potential Trail Impact Fee Revenue, 2012-2022 ......................................................... 63 Table 68. Trail Impact Fee Ten-Year Capital Plan, 2012-2022 .................................................. 64 Table 69. Existing Fire Facilities ..................................................................................................... 66 Table 70. Fire Station Cost per Square Foot ................................................................................ 66 Table 71. Fire Station Cost per Acre .............................................................................................. 67 Table 72. Existing Fire Equipment Cost ....................................................................................... 67 Table 73. Fire Cost per Service Unit .............................................................................................. 69 Table 74. Fire Debt Credit ............................................................................................................... 69 Table 75. Fire Grants, 2007-2011 ................................................................................................... 70 Table 76. Fire Grant Credit ............................................................................................................. 70 Table 77. Fire Net Cost per Service Unit ...................................................................................... 70 Table 78. Potential Fire Impact Fee Schedule .............................................................................. 71 Table 79. Comparative Fire Impact Fees ...................................................................................... 71 Table 80. Potential Fire Impact Fee Revenue, 2012-2022 .......................................................... 72

Table 81. Fire Impact Fee Ten-Year Capital Plan, 2012-2022 ................................................... 72 Table 82. Existing Police Facilities ................................................................................................. 74 Table 83. Police Station Unit Costs ................................................................................................ 74 Table 84. Existing Police Equipment Cost ................................................................................... 75 Table 85. Police Cost per Service Unit .......................................................................................... 76 Table 86. Police Debt Credit ........................................................................................................... 77 Table 87. Police Grants, 2007-2011 ............................................................................................... 77 Table 88. Police Grant Credit ......................................................................................................... 78 Table 89. Police Net Cost per Service Unit .................................................................................. 78 Table 90. Potential Police Impact Fee Schedule .......................................................................... 78 Table 91. Comparative Police Impact Fees ................................................................................... 79 Table 92. Potential Police Impact Fee Revenue, 2012-2022 ...................................................... 79 Table 93. Police Impact Fee Ten-Year Capital Plan, 2012-2022 ............................................... 80 Table 94. Drainage Impact Fee Ten-Year Capital Plan, 2012-2022 .......................................... 82 Table 95. Persons per Unit, 2000 Census ...................................................................................... 83 Table 96. Persons per Unit, 2006-2010 ACS ................................................................................ 83 Table 97. Persons per Unit Comparison ....................................................................................... 84 Table 98. Residential Functional Population Multipliers ............................................................ 85 Table 99. Nonresidential Functional Population Multipliers ..................................................... 86 Table 100. Functional Population Multipliers .............................................................................. 87 Table 101. Functional Population, 2012-2022 .............................................................................. 87 Table 102. Summary of Outstanding Debt ................................................................................... 88 Table 103. Outstanding Non-Stormwater GO Bonds ................................................................ 88 Table 104. 2001 Bond Project Authorizations ............................................................................. 89 Table 105. 2003 Bond Project Authorizations ............................................................................. 92 Table 106. 2005 Bond Project Authorizations ............................................................................. 94 Table 107. 2007 Series A Bond Project Authorizations .............................................................. 96 Table 108. 2007 Series B Bond Project Authorizations .............................................................. 98 Table 109. 2009 Bond Project Authorizations ........................................................................... 100 Table 110. Existing Road Inventory, East of I-25 ..................................................................... 102 Table 111. Existing Road Inventory, West of I-25 .................................................................... 108 Table 112. Existing Park Inventory .............................................................................................. 115
List of Figures
Figure 1. Comparative Road Impact Fees for Major Land Uses ................................................. 4 Figure 2. Comparative Nonresidential Road Fees by Detailed Land Use .................................. 4 Figure 3. Comparative Park Fees ...................................................................................................... 5 Figure 4. Comparative Park, OS/Trail Fees ................................................................................... 5 Figure 5. Comparative OS/Trail Fees ............................................................................................. 5 Figure 6. Comparative Fire Fees ....................................................................................................... 6 Figure 7. Comparative Police Fees ................................................................................................... 6 Figure 8. Comparative Public Safety Fees ....................................................................................... 6 Figure 9. Consolidated Service Areas for Comparison Table ...................................................... 7 Figure 10. Comparative Total Fees .................................................................................................. 9 Figure 12. Current and Potential Road Impact Fee Service Areas ............................................ 26 Figure 13. Current and Suggested Park Impact Fee Service Areas ........................................... 41 Figure 14. Drainage Service Areas .................................................................................................. 81 Figure 15. Nonresidential Functional Population Formula ........................................................ 86 Duncan Associates, 360 Nueces St., Suite 2701, Austin, TX 78701, 512-258-7347; [email protected]

City of Albuquerque, NM FINAL draft
Impact Fee Study 1 September 13, 2012
EXECUTIVE SUMMARY
The consultant team, led by Duncan Associates, has been retained by the City of Albuquerque to update the City’s impact fee system for roads, parks and public safety (fire and police) facilities. While the City also has drainage impact fees, these will be updated by City staff and have been excluded from the consultant’s scope of services.
Background
The City of Albuquerque adopted road, park, public safety (fire and police) and drainage impact fees in 2004. A temporary partial moratorium was enacted effective September 23, 2009 that reduced impact fees to 50% of the maximum rates. After twice being extended, the partial moratorium was slated to expire on March 23, 2012 (30 months after enactment), but was extended a third time pending completion of this study. The first phase of this project involved an analysis of the current impact fee system and recommendations for changes.1 The phase one report addressed policy issues involved in the impact fee update relating to service areas, the role of the capital plan, methodologies, fee reductions, land use categories and ordinance structure. Some of that analysis is replicated in this report, while other portions are only summarized here.
Overall Approach
The basic approach taken in the 2004 impact fee studies was to develop differential impact fees by geographic area to reflect actual differences in the cost to provide services. The differential fees would act as incentives to encourage new development in older, more established areas of the city, where the needed infrastructure is already largely in place and where it would be less expensive for the City to provide services. At the same time, higher impact fees in developing areas would serve to discourage urban sprawl and the accompanying costly investments in new infrastructure. While these are laudable goals, the differential fees were primarily the result of policy preferences embedded in the methodology rather than objective cost differences. Nor is there clear evidence that they have had the desired effect. Designing the fees to further policy objectives has created a complex system of overlapping service areas, generated political controversy over significant fee differences by area, and spawned extensive waivers and exemptions that have sapped their revenue potential. In contrast, the updated system, with fewer service areas and recommended uniform city-wide fees, is designed to make the system simple to understand and administer and to focus on the primary rationale for impact fees – raising revenue to fund improvements necessitated by growth.
1 Duncan Associates, Impact Fee Policy Directions Memorandum, February 2, 2012. 2 Tindale-Oliver & Associates, Roadway Facilities Impact Cost Study, August 2004; James C. Nicholas and Arthur C Nelson, Park, Recreation, Trail and Open Space Development Impact Fees, November 2004; James C. Nicholas, Public Safety Development

Executive Summary
City of Albuquerque, NM Final draft
Impact Fee Study September 13, 2012 2
Summary of Modifications
The major modifications from the current impact fee system that are reflected in this impact fee update are summarized as follows. □ Number of Fees. While the City nominally has only four impact fees (roads, parks, public
safety and drainage), in practice it has eight (roads, parks, open space, trails, fire, non-city-wide police facilities, city-wide police facilities, and drainage). The City should formally adopt separate fire and police impact fees that would both be city-wide, thus eliminating the need to have separate fees for city-wide and non-city-wide police facilities. In addition, open space and trail fees should be structured as separate fees.
□ Road Service Areas. Limit road impact fees to arterial street improvements, allowing larger
service areas. Replace the current eight road service areas with a single, city-wide arterial street impact fee service area.
□ Park Service Areas. Replace the current seven service areas with four larger service areas
for park impact fees (see Figure 12 on page 41). Continue to assess open space and trail impact fees city-wide.
□ Public Safety Service Areas. Separate public safety into fire and police impact fees, and
use a city-wide service area for both types of fees. □ Exemptions. Waivers and exemptions have significantly eroded impact fee revenues. The
residential “green path” reductions, in particular, are popular with builders, but have virtually eliminated impact fee revenue from new single-family housing. Given that the amount of the fee reduction may exceed the relatively low cost beyond current code requirements needed to qualify, and the likelihood that many builders would build green in the absence of the exemption to secure a marketing advantage, this exemption may act more as a subsidy than an incentive. The problem with impact fee waivers is that they are often perceived as not costing the City anything. If energy-efficient housing is a high priority, strengthening code requirements or providing targeted general fund-supported rebates would likely be more cost-effective approaches. It is recommended that all impact fee waivers/exemptions be eliminated.
□ Residential Land Use Categories. Assess residential fees on a per dwelling unit basis,
rather than the current approach of assessing by three housing unit size categories (roads), or per square foot (parks and public safety). Mobile home parks should be assessed per pad at the time of development of the mobile home park.
□ Nonresidential Land Use Categories. Simplify the nonresidential road impact fee
schedule by collapsing the current 39 categories into a fewer number of broader categories. This approach recognizes that commercial land uses often change, avoids extremely high fees for a small number of land uses (e.g., restaurants, convenience stores), eliminates most impact fee charges for change of use, thereby encouraging reuse of existing buildings, and simplifies impact fee administration.

Executive Summary
City of Albuquerque, NM Final draft
Impact Fee Study September 13, 2012 3
Summary of Updated Fees
The updated city-wide impact fees are summarized for the recommended land use categories in Table 1. Comparisons with current adopted fees by service area are provided below.
Table 1. Summary of Updated Impact Fees
Open
Land Use Unit Roads Parks Space Trails Fire Police Total
Single-Family Detached Dwelling $2,797 $1,804 $897 $98 $266 $116 $5,978
Multi-Family Dwelling $1,298 $974 $484 $53 $145 $63 $3,017
Mobile Home/RV Park Space $902 $1,551 $771 $84 $229 $100 $3,637
Hotel/Motel Room $1,856 $0 $0 $0 $162 $70 $2,088
Commercial 1,000 sq. ft. $2,818 $0 $0 $0 $243 $106 $3,167
Public/Institutional 1,000 sq. ft. $1,769 $0 $0 $0 $152 $66 $1,987
Industrial/Warehouse 1,000 sq. ft. $1,176 $0 $0 $0 $37 $16 $1,229
Mini-Warehouse 1,000 sq. ft. $456 $0 $0 $0 $20 $9 $485 Source: Table 29 (roads); Table 42 (parks); Table 55 (open space); Table 65 (trails); Table 78 (fire); Table 90 (police).
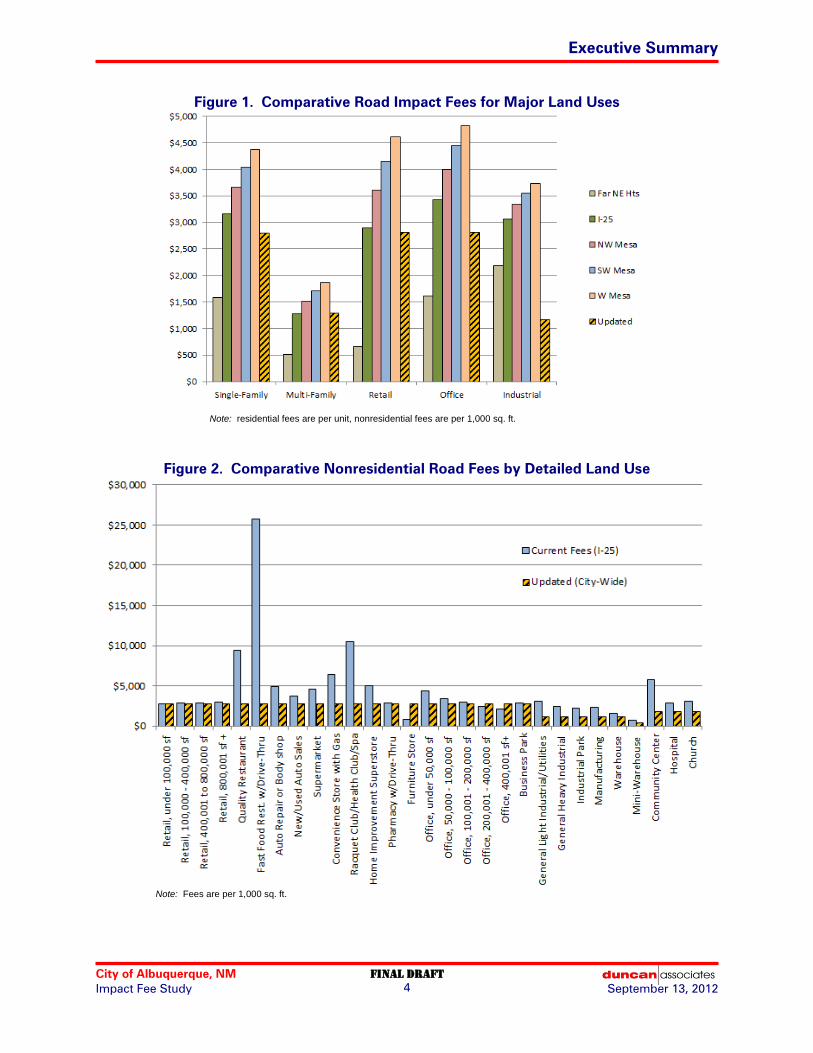
Roads. The road impact fee update is based on the same conservative consumption-based methodology used in the 2004 study. The updated cost of $1.52 million per lane-mile is 22% lower than the cost of $1.95 million per lane-mile used in the 2004 study. As with the 2004 study, this update uses a city-wide cost calculation. Unlike the 2004 study, however, differential revenue credits are not provided based on the amount of revenue that would be generated by existing development in each service area. Credit for revenue generated by existing development is not required, and essentially amounts to a policy-based reduction in fees that favors areas with a large amount of existing development. This study excludes right-of-way (ROW) costs from the road impact fee calculations, for two reasons. First, ROW costs are extremely variable and difficult to estimate in advance. Second, excluding ROW costs will avoid the need to provide developers with credit for ROW dedications – avoiding an imbalance between developer credits and fee revenues. Graphically comparing current adopted road impact fees (without the temporary 50% fee reduction) to updated fees is difficult because of the large number of service areas and land use categories (a detailed comparison table is presented in Table 30 in the Roads section). Figure 1 on the following page compares road impact fees for five major land use categories (fees are per unit for residential and per 1,000 square feet for nonresidential; current retail and office fees are based on 100,000 sq. ft. building). Excluded from the comparison are the three existing service areas (Downtown, Northeast Heights and Near North Valley), where road impact fees are not currently charged and which would not be represented by a visible column. In general, the updated fees for these major land use categories tend to fall in the mid-range of current fees by service area. Looking only at a few major land use categories, however, does not fully capture the range of changes for more detailed categories. The updated fee schedule has a smaller number of broader nonresidential land use categories. This has the result of significantly reducing road impact fees for some specialized land uses. Figure 2 on the following page compares current adopted road fees per 1,000 square feet for the I-25 Corridor service area to the updated city-wide fees per 1,000 square feet.
Executive Summary
City of Albuquerque, NM Final draft
Impact Fee Study September 13, 2012 4
Figure 1. Comparative Road Impact Fees for Major Land Uses
Note: residential fees are per unit, nonresidential fees are per 1,000 sq. ft.
Figure 2. Comparative Nonresidential Road Fees by Detailed Land Use
Note: Fees are per 1,000 sq. ft.
Executive Summary
City of Albuquerque, NM Final draft
Impact Fee Study September 13, 2012 5
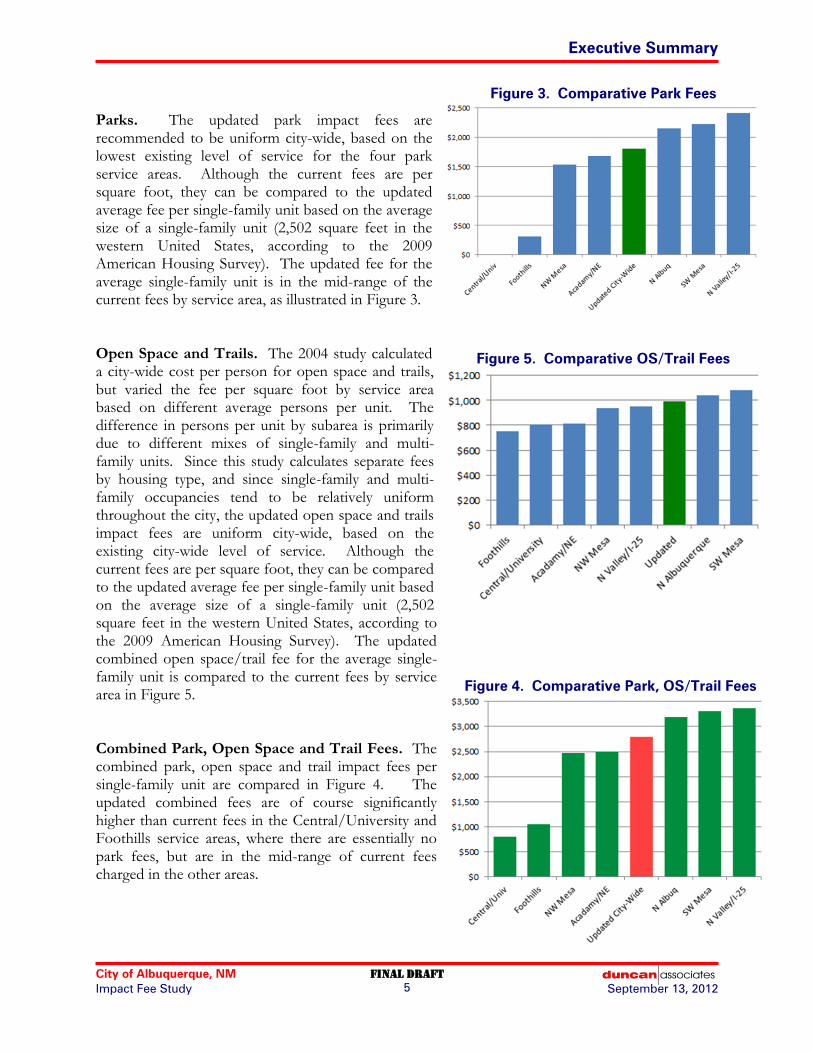
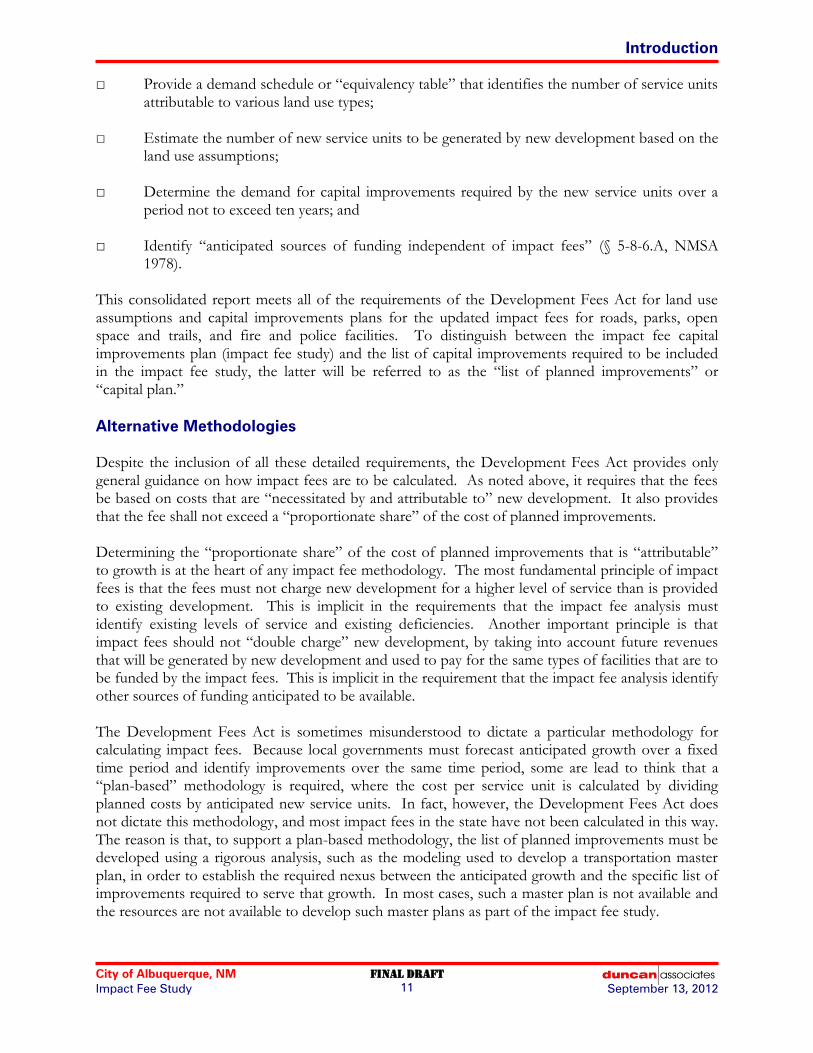
Parks. The updated park impact fees are recommended to be uniform city-wide, based on the lowest existing level of service for the four park service areas. Although the current fees are per square foot, they can be compared to the updated average fee per single-family unit based on the average size of a single-family unit (2,502 square feet in the western United States, according to the 2009 American Housing Survey). The updated fee for the average single-family unit is in the mid-range of the current fees by service area, as illustrated in Figure 3. Open Space and Trails. The 2004 study calculated a city-wide cost per person for open space and trails, but varied the fee per square foot by service area based on different average persons per unit. The difference in persons per unit by subarea is primarily due to different mixes of single-family and multi-family units. Since this study calculates separate fees by housing type, and since single-family and multi-family occupancies tend to be relatively uniform throughout the city, the updated open space and trails impact fees are uniform city-wide, based on the existing city-wide level of service. Although the current fees are per square foot, they can be compared to the updated average fee per single-family unit based on the average size of a single-family unit (2,502 square feet in the western United States, according to the 2009 American Housing Survey). The updated combined open space/trail fee for the average single-family unit is compared to the current fees by service area in Figure 5. Combined Park, Open Space and Trail Fees. The combined park, open space and trail impact fees per single-family unit are compared in Figure 4. The updated combined fees are of course significantly higher than current fees in the Central/University and Foothills service areas, where there are essentially no park fees, but are in the mid-range of current fees charged in the other areas.
Figure 3. Comparative Park Fees
Figure 5. Comparative OS/Trail Fees
Figure 4. Comparative Park, OS/Trail Fees

Executive Summary
City of Albuquerque, NM Final draft
Impact Fee Study September 13, 2012 6
Fire. The 2004 study calculated higher fire impact fees on the east side of the Rio Grande, based in anticipated needs. The updated fees are based on the existing city-wide level of service, since fire facilities form an integrated response network. The updated fees are in the mid-range of current adopted fees for residential and retail; lower for industrial/warehouse, and higher for office and institutional uses, as illustrated in Figure 6. Police. The 2004 study calculated virtually identical police impact fees east and west of the Rio Grande. The updated fees are based on the existing city-wide level of service, since most police facilities are centralized. As illustrated in Figure 7, the updated fees are lower than current adopted fees for all land use categories except office and institutional. Combined Public Safety Fees. The combined public safety (fire and police) fees are compared in Figure 8. The updated combined fees are lower for single-family and industrial, in the mid-range of current fees for multi-family and retail; and higher for office and institutional uses. Higher fees for office and institutional uses correct for under-estimates of functional population for those land uses, although the reason for the under-estimate in the 2004 study cannot be determined, because that study did not provide any details about how the functional population multipliers were determined. This study documents the data sources and assumptions used in developing the functional population multipliers, and these types of differential increases and decreases should not occur in future updates.
Figure 6. Comparative Fire Fees
Figure 7. Comparative Police Fees
Figure 8. Comparative Public Safety Fees

Executive Summary
City of Albuquerque, NM Final draft
Impact Fee Study September 13, 2012 7
Total Impact Fees. The total updated city-wide fees (sum of road, park, open space, trail, fire and police fees) are compared with current total adopted fees (before the temporary 50% reduction) by service area in Table 2. Some simplifications were required to make a manageable comparison table. The service areas shown are either road or park service areas (west of the river and north of I-40/west of I-25 are road service areas; the rest are park service areas). The Near North Valley road service area actually goes further south into the Central/University park service area and the North Albuquerque park service area covers only a portion of the Far Northeast Heights road service area. The consolidated service areas are illustrated in Figure 9.
Figure 9. Consolidated Service Areas for Comparison Table
Note that the current nonresidential fees are identical for the Central/University, Foothills, Academy/Northeast and Near North Valley park service areas, since only public safety fees are charged in these areas (nonresidential is not subject to park, open space or trail impact fees, and road fees are not currently charged in these areas, with a few exceptions). Ten current nonresidential land use categories are not shown, since the road fees for those categories are based on some measure other than building square footage (such as beds, students, acres, holes and screens), and they could not be combined with the public safety fees or compared to the revised fees. Assumptions were made about typical dwelling unit and hotel room size, as indicated in the notes at the bottom of the table.

Executive Summary
City of Albuquerque, NM Final draft
Impact Fee Study September 13, 2012 8
Table 2. Comparison of Current and Updated Total Fees
Cntrl/ Foot- Acad/ Near N North I-25 NW SW West Updated
Land Use Unit Univ Hills NE Valley Albuq Corr Mesa Mesa Mesa Fees
Single-Family Det. (avg) Dwelling $1,366 $1,633 $3,069 $3,911 $5,344 $7,071 $6,570 $7,775 $7,280 $5,978
Multi-Family Dwelling $591 $706 $1,326 $1,689 $2,135 $2,965 $2,775 $3,315 $3,119 $3,017
Condominium/Townhouse Dwelling $591 $706 $1,326 $1,689 $1,841 $2,574 $2,353 $2,869 $2,653 $3,017
Mobile Home Park Space $591 $706 $1,326 $1,689 $2,388 $3,033 $2,784 $3,280 $3,045 $3,637
RV Park RV Space $591 $706 $1,326 $1,689 $2,064 $2,714 $2,466 $2,963 $2,730 $3,637
Retirement Home Dwelling $1,366 $1,633 $3,069 $3,911 $3,833 $4,246 $3,326 $4,210 $3,443 $5,978
Congregate Care Facility Dwelling $591 $706 $1,326 $1,689 $1,690 $1,882 $1,489 $1,873 $1,545 $3,017
Hotel Room $228 $228 $228 $228 $228 $1,097 $1,324 $1,542 $1,726 $2,088
Motel Room $228 $228 $228 $228 $564 $1,065 $1,167 $1,290 $1,393 $2,088
Retail, under 100,000 sf 1,000 sf $455 $455 $455 $455 $655 $3,215 $3,918 $4,542 $5,071 $3,167
Retail, 100,000-400,000 sf 1,000 sf $455 $455 $455 $455 $1,117 $3,349 $3,948 $4,492 $4,954 $3,167
Retail, 400,001-800,000 sf 1,000 sf $455 $455 $455 $455 $1,247 $3,375 $3,940 $4,459 $4,899 $3,167
Retail, 800,001 sf + 1,000 sf $455 $455 $455 $455 $1,330 $3,387 $3,929 $4,431 $4,856 $3,167
Quality Restaurant 1,000 sf $455 $455 $455 $455 $3,903 $9,913 $11,717 $13,184 $14,426 $3,167
Fast Food w/Drive-Thru 1,000 sf $455 $455 $455 $455 $6,049 $26,210 $32,529 $37,448 $41,614 $3,167
Auto Repair or Body shop 1,000 sf $455 $455 $455 $455 $2,679 $5,375 $6,121 $6,779 $7,336 $3,167
New/Used Auto Sales 1,000 sf $455 $455 $455 $455 $899 $4,213 $5,156 $5,965 $6,650 $3,167
Supermarket 1,000 sf $455 $455 $455 $455 $2,590 $5,035 $5,701 $6,298 $6,803 $3,167
Convenience Store 1,000 sf $455 $455 $455 $455 $455 $6,916 $10,711 $13,700 $16,232 $3,167
Racquet/Health Club/Spa 1,000 sf $455 $455 $455 $455 $6,686 $10,895 $12,124 $13,151 $14,021 $3,167
Home Improvmt Superstore 1,000 sf $455 $455 $455 $455 $2,625 $5,486 $6,285 $6,983 $7,574 $3,167
Pharmacy w/Drive-Thru 1,000 sf $455 $455 $455 $455 $1,537 $3,340 $3,802 $4,242 $4,614 $3,167
Furniture Store 1,000 sf $455 $455 $455 $455 $866 $1,304 $1,330 $1,437 $1,527 $3,167
Office, under 50,000 sf 1,000 sf $100 $100 $100 $100 $2,176 $4,512 $5,232 $5,802 $6,285 $3,167
Office, 50,000 - 100,000 sf 1,000 sf $100 $100 $100 $100 $1,712 $3,527 $4,081 $4,524 $4,898 $3,167
Office, 100,001 - 200,000 sf 1,000 sf $100 $100 $100 $100 $1,475 $3,022 $3,491 $3,868 $4,188 $3,167
Office, 200,001 - 400,000 sf 1,000 sf $100 $100 $100 $100 $1,272 $2,591 $2,987 $3,309 $3,582 $3,167
Office, 400,001 sf+ 1,000 sf $100 $100 $100 $100 $1,099 $2,224 $2,558 $2,832 $3,065 $3,167
Business Park 1,000 sf $100 $100 $100 $100 $1,377 $2,995 $3,486 $3,881 $4,215 $3,167
General Light Industrial 1,000 sf $111 $111 $111 $506 $2,298 $3,176 $3,428 $3,642 $3,824 $1,229
General Heavy Industrial 1,000 sf $111 $1,156 $1,156 $1,990 $2,375 $2,564 $2,597 $2,643 $2,682 $1,229
Industrial Park 1,000 sf $111 $111 $111 $111 $1,419 $2,296 $2,548 $2,762 $2,943 $1,229
Manufacturing 1,000 sf $111 $111 $111 $961 $1,943 $2,424 $2,550 $2,667 $2,767 $1,229
Warehouse 1,000 sf $111 $111 $111 $111 $1,032 $1,657 $1,828 $1,980 $2,110 $1,229
Mini-Warehouse 1,000 sf $111 $111 $111 $111 $505 $820 $893 $969 $1,035 $485
Community Center 1,000 sf $108 $108 $108 $108 $2,877 $5,926 $6,872 $7,616 $8,246 $1,987
Hospital 1,000 sf $108 $108 $108 $108 $1,062 $3,010 $3,604 $4,079 $4,482 $1,987
Church 1,000 sf $108 $108 $108 $426 $2,316 $3,242 $3,511 $3,737 $3,929 $1,987
Current Adopted Fees by Service Area
Notes: Total fees are sum of road, parks, open space, trails, fire and police fees (do not include drainage); current adopted fees are before
temporary 50% reduction; current single-family and retirement home fees assume 2,052 square feet; current multi-family, condo/townhouse,
mobile home, RV park and congregate care fees assume 886 square feet; current hotel/motel fees assume 500 square feet per room.
Source: Current fees from City of Albuquerque website (http://www.cabq.gov/council/impact-fees); updated fees from Table 29 (roads); Table 42
(parks); Table 55 (open space); Table 65 (trails); Table 78 (fire); Table 90 (police).
The total adopted road, park, open space, trail, fire and police fees for the various service areas, per residential dwelling unit and per 1,000 square feet of nonresidential development, are compared to total updated city-wide fees in Figure 10 for five major land use categories. In general, the updated city-wide fees are in the mid-range of current adopted fees by service area.

Executive Summary
City of Albuquerque, NM Final draft
Impact Fee Study September 13, 2012 9
Figure 10. Comparative Total Fees

City of Albuquerque, NM FINAL draft
Impact Fee Study 10 September 13, 2012
INTRODUCTION
The City of Albuquerque adopted road, park, public safety (fire and police) and drainage impact fees in 2004, based on studies prepared by a group of consultants.2 The fees went into effect at 34% of the maximum rates on July 1, 2005. The fees were increased to 67% on January 1, 2006 and to 100% on January 1, 2007. A temporary partial moratorium was enacted effective September 23, 2009 that reduced impact fees to 50% of the maximum rates and deferred the time of fee collection from building permit to certificate of occupancy. After twice being extended, the partial moratorium was slated to expire on March 23, 2012 (30 months after enactment), but was extended a third time pending completion of this study. A precursor to this effort was an independent review of the City’s impact fee system conducted by Colgan Consulting in March 2011 (“Colgan report”).3 The Colgan report found few issues with the City’s drainage impact fees, and an update of those fees was not included in the present consultant’s scope of services, which includes only peer review of the in-house staff update of the drainage impact fees. The first phase of this project was the preparation of an Impact Fee Policy Directions Memorandum,4 which provided an analysis of the City’s current impact fee system and a number of recommendations. An initial draft of the policy memorandum was reviewed by the City’s Impact Fees Capital Improvements Plan Advisory Committee, and some of the committee’s comments were incorporated into the final draft presented to the City Council at a workshop on February 21, 2012. While the City Council took no formal action, the recommendations contained in the Policy Directions Memorandum formed the initial basis for this update. Some variations from the recommendations of the Memorandum were made in this final draft in response to local input.
Legal Framework
The New Mexico Development Fees Act (Article 8 of Chapter 5, NMSA 1978) is the State’s enabling act for impact fees. It requires that local governments prepare “land use assumptions” (growth projections) covering at least a five-year period; define service units (a common measure of demand for service), and prepare a “capital improvement plan” (§ 5-8-2, NMSA 1978). Despite its name, the capital improvements plan is not primarily a list of improvements, but rather an impact fee study that must address all of the following requirements: □ Identify existing deficiencies that must be corrected in order to serve existing development; □ Identify existing levels of service; □ Identify capital improvements and costs “necessitated by and attributable to” new
development in each service area based on approved land use assumptions;
2 Tindale-Oliver & Associates, Roadway Facilities Impact Cost Study, August 2004; James C. Nicholas and Arthur C Nelson, Park, Recreation, Trail and Open Space Development Impact Fees, November 2004; James C. Nicholas, Public Safety Development Impact Fees, August 2004; Integrated Utilities Group, Drainage Impact Fee Study, September 2004. 3 Colgan Consulting Corporation, Review of Albuquerque’s Development Impact Fees, March 25, 2011 4 Duncan Associates, Impact Fee Policy Directions Memorandum, February 2, 2012.
Introduction
City of Albuquerque, NM Final draft
Impact Fee Study September 13, 2012 11
□ Provide a demand schedule or “equivalency table” that identifies the number of service units attributable to various land use types;
□ Estimate the number of new service units to be generated by new development based on the
land use assumptions; □ Determine the demand for capital improvements required by the new service units over a
period not to exceed ten years; and □ Identify “anticipated sources of funding independent of impact fees” (§ 5-8-6.A, NMSA
1978). This consolidated report meets all of the requirements of the Development Fees Act for land use assumptions and capital improvements plans for the updated impact fees for roads, parks, open space and trails, and fire and police facilities. To distinguish between the impact fee capital improvements plan (impact fee study) and the list of capital improvements required to be included in the impact fee study, the latter will be referred to as the “list of planned improvements” or “capital plan.”
Alternative Methodologies
Despite the inclusion of all these detailed requirements, the Development Fees Act provides only general guidance on how impact fees are to be calculated. As noted above, it requires that the fees be based on costs that are “necessitated by and attributable to” new development. It also provides that the fee shall not exceed a “proportionate share” of the cost of planned improvements. Determining the “proportionate share” of the cost of planned improvements that is “attributable” to growth is at the heart of any impact fee methodology. The most fundamental principle of impact fees is that the fees must not charge new development for a higher level of service than is provided to existing development. This is implicit in the requirements that the impact fee analysis must identify existing levels of service and existing deficiencies. Another important principle is that impact fees should not “double charge” new development, by taking into account future revenues that will be generated by new development and used to pay for the same types of facilities that are to be funded by the impact fees. This is implicit in the requirement that the impact fee analysis identify other sources of funding anticipated to be available. The Development Fees Act is sometimes misunderstood to dictate a particular methodology for calculating impact fees. Because local governments must forecast anticipated growth over a fixed time period and identify improvements over the same time period, some are lead to think that a “plan-based” methodology is required, where the cost per service unit is calculated by dividing planned costs by anticipated new service units. In fact, however, the Development Fees Act does not dictate this methodology, and most impact fees in the state have not been calculated in this way. The reason is that, to support a plan-based methodology, the list of planned improvements must be developed using a rigorous analysis, such as the modeling used to develop a transportation master plan, in order to establish the required nexus between the anticipated growth and the specific list of improvements required to serve that growth. In most cases, such a master plan is not available and the resources are not available to develop such master plans as part of the impact fee study.

Introduction
City of Albuquerque, NM Final draft
Impact Fee Study September 13, 2012 12
The principal alternative to the plan-based methodology is “standards-based.” The key difference is that the plan-based approach is based on a complex level of service (LOS) standard, such as “every road shall function at LOS D or better,” or “the average fire response time shall not exceed three minutes,” that requires projecting growth by small areas and using sophisticated modeling or analysis to determine the specific improvements needed to maintain the desired LOS. In contrast, a standards-based approach uses a generalized LOS standard, such as the ratio of park acres to population, that does not require an extensive master planning effort in order to determine the improvements and costs that are attributable to a specific quantity of growth. All of the City’s current impact fees have been calculated using the standards-based methodology. The consultant recommends continuing to use the standards-based methodology in this impact fee update.
Role of the Capital Plan
Under the standards-based approach, the fee is not determined based on the total cost for a particular list of planned improvements divided by projected growth, but rather on the average cost to add capacity (e.g., the average cost to add a lane-mile of roadway or to develop an acre of park-land) and the existing or desired level of service. This has important implications for the role of the list of planned projects required to be identified in the capital improvements plan. Under a plan-based methodology, the master planning analysis identifies the specific improvements that must be constructed to serve anticipated new development over the planning horizon. Any change to the list of planned improvement should only be undertaken on the basis of an updated master plan. In contrast, under the standards-based methodology, the list of planned improvement can be changed over time without affecting the basis for the impact fee calculation. The City’s current approach to the capital plan is consistent with the standards-based methodologies that were used to calculate the fees. The impact fee capital plans, called Component Capital Improvements Plans (CCIPs),5 are included as a separate component in the City’s overall Capital Implementation Program (CIP), which is known as the Decade Plan. The CCIPs are amended every two years as part of the regular update of the CIP. The impact fee ordinance defines the CCIP as a plan required by the Development Fees Act that “identifies types of capital improvements or facility expansions for which impact fees may be assessed” (§ 14-19-1-3, § 14-19-2-3, § 14-19-3-3 and § 14-19-4-3, ROA 1994). The Development Fees Act requires that impact fees be spent only on “capital improvement or facility expansions identified in the capital improvements plan” (§ 5-8-5.A, NMSA 1978). The City’s impact fee ordinance further stipulates that developers may receive credit against their impact fees only for improvements that are “listed on the CCIP” (§ 14-19-1-20(A), § 14-19-2-20(A), § 14-19-3-20(A) and § 14-19-4-20(A), ROA 1994). The primary role of the CCIP, then, is to identify projects on which impact fees may be spent and for which developer credits against the impact fees may be given.
5 not to be confused with the impact fee capital improvements plan, which is the impact fee study in which the CCIPs should be included by reference
City of Albuquerque, NM FINAL draft
Impact Fee Study 13 September 13, 2012
LAND USE ASSUMPTIONS
The City of Albuquerque is required by the Development Fees Act to develop land use assumptions (LUAs) as the basis for its impact fees. Land use assumptions are to include “a description of the service area and projections of changes in land uses, densities, intensities and population in the service area over at least a five-year period.” This section develops land use assumptions for the ten-year period from 2012-2022.
Service Areas
The complexity of the City’s current impact fee system is largely due to the number of overlapping service areas. There are 19 different combinations of service areas for road, park, public safety and drainage impact fees, although fees in three of these areas are the same, due to the fact that the road and drainage impact fees are zero in the Downtown, Near North Valley and Northeast Heights service areas. This results in 17 different fee schedules applicable to different areas of the city (for a breakdown of fees see the Policy Directions Memorandum). The Mesa del Sol area is subject to a development agreement to provide infrastructure and is exempt from impact fees. However, the updated land use assumptions include existing and projected land use and population projections for the Mesa del Sol area. While the updated road impact fees are based on a single, city-wide service area, an option was originally developed to have two service areas, replacing the current eight service areas. This simplification is made possible by the exclusion of collector road costs from the updated impact fees. The City has tentatively decided to collapse the two service areas into a single city-wide (excluding Mesa del Sol) service area. However, the land use assumptions continue to show two potential service areas. The East service area is defined all of the area within the city limits (excluding Mesa del Sol) east of I-25, while the West service are includes all areas of the city west of I-25. A map of the potential road service areas can be found in Figure 11 in the Roads section. The updated open space, trail, fire and police impact fees are based on a single city-wide service area, excluding Mesa del Sol. The city-wide service area for open space and trails is consistent with the current service area structure. The city-wide fire and police service areas will replace the current east and west (and city-wide for centralized police facilities) service areas for those facilities. Since only road, fire and police fees are assessed on nonresidential development, existing and projected nonresidential development estimates and forecasts are provided only for the East and West road impact fee service areas. The updated park impact fees are based on four service areas: Northeast, Southeast, Northwest and Southwest. The east/west boundary line is I-25, which is consistent with the boundary for road impact fees. To the west of I-25, the north/south boundary is I-40. To the east of I-25, the north/south boundary is Candelaria Road. The Southeast service area excludes Mesa del Sol. A map of the proposed park service areas can be found in Figure 12 in the Parks section.

Land Use Assumptions
City of Albuquerque, NM Final draft
Impact Fee Study September 13, 2012 14
Background
The City developed its initial set of LUAs in late 2003 and its impact fee capital improvements plan in late 2004. The City updated the land use assumptions and the capital improvements plan in 2009. This study updates the assumptions for 2012, with projections for 2017 and 2022. This second update of the LUAs and capital improvements plan is taking place concurrently with a general revision in the impact fees program, including revising impact fee service areas. By Ordinance O-02-39, which adopted the City’s Planned Growth Strategy (PGS), the City’s Land Use Assumptions must be based on an Infrastructure and Growth Plan, which is guided by the following principles that underlie the PGS: • Grow efficiently by developing where infrastructure and facilities already exist. • Take into consideration topological and geological constraints, environmental constraints and aquifer recharge zones. • Take into consideration market absorption rates in different areas. • Locate more jobs where people reside and locate more residences where jobs exist • Where neighborhoods develop at the urban fringe, each ideally should contain a school, local serving businesses, park and pedestrian and bicycle friendly streets. • Foster community in older and newer neighborhoods. • Prioritize the needs of the older parts of Albuquerque in terms of vitality and development. Encourage infill and redevelopment. • Support Centers and Corridors, especially transportation oriented corridors. • Protect the character of the North and South Valley, including the more rural parts of the valley, and preserve farmland there. The initial (2003) Infrastructure and Growth Plan and the initial Land Use Assumptions were based on a series of special county-level runs of the Mid-Region Council of Government (MRCOG) Land Use Analysis Model (LAM), with projections for growth in population, housing and employment for 2025. These special runs were designed to reflect PGS principles. The 2009 LUAs reflect a number of changes in the impact fee program and in development patterns: • The 2009 LUAs focus on the City only and recognize limitations on future annexations and extraterritorial planning and zoning due to legislative actions prior to 2009. • The LAM was modified to run as a regional model, making it an inappropriate choice for developing the 2009 LUAs. • The impact fee study areas were modified to include only the City boundaries and were renamed. • The 2003 LUAs based on the PGS 2025 Scenario B were compared to the MRCOG Metropolitan Transportation Plan (MTP) 2030 projections, which reflected post-2003 actual development trends and adopted plans. These projections emphasized land use characteristics, recent decisions and post-2003 plans. • The land use projections of each methodology were not radically different and were used to bracket the choices discussed for the 2009 update.

Land Use Assumptions
City of Albuquerque, NM Final draft
Impact Fee Study September 13, 2012 15
Ten years have passed since the adoption of the Planned Growth Strategy, and actual counts are available for population and housing from the 2010 Census and actual 2010 employment is available for Bernalillo County. The base year for the LUAs can be reset for these characteristics based on recent data. It is now possible to track actual development trends in relation to both the original PGS projections and the 2009 LUAs and compare the current trend to the prior projections. New master plan communities have been approved since the 2009 LUAs were developed. In addition, economic conditions since 2008 have depressed new home construction, delaying the start of communities that were included in the MRCOG 2030 projections. Employment dropped dramatically from 2008 to 2010, with nearly 21,000 jobs lost in Bernalillo County. An additional 6,000 jobs were lost from 2010 to January of 2011. As of the fourth quarter of 2011, these trends are beginning to moderate and reverse, with employment back to the 2010 level. The MRCOG completed new projections in early 2011 for the 2035 MTP. The beginning point for these projections was 2008 estimates. The methodology notes that land consumption and travel are growing at a faster rate than population, indicating that the compact land use scenario supported by PGS policies is slow to come about in the short term. The 2035 forecasts, which are based on current land use patterns and adopted plans for the region, incorporate the City of Albuquerque’s PGS policies regarding infill and higher density centers and corridors. The proposed methodology for the 2012 update to Albuquerque’s impact fees changes service areas and the information needed from the land use assumptions. The key information for the update includes single-family and multi-family housing estimates and projections and estimates and projections of nonresidential square feet by type. The updated land use assumptions include population, housing, employment and nonresidential square feet. The methodologies used to estimate current conditions and projections to 2017 and 2022 are described below, along with data tables for the updated land use assumptions. The calculations of existing level of service are based on 2012 housing units and nonresidential square footage, by housing/land use type and by impact fee service area. The updated Land Use Assumptions begin with housing, employment and land use, which are then used to estimate population and building square footage. The Data Analysis Subzone (DASZ)-level data for the 2009 Interim Land Use Assumptions were aggregated to the new park service areas and compared to 2010 Census counts. There were significant differences between the interim land use assumptions and Census counts in the northeast, northwest and southwest. Slower growth than projected and a different distribution of growth contributed to these differences. Actual housing and population counts in the 2010 Census were used as the new starting point for the 2012 base year estimates.
Existing Population and Housing
Preliminary Analysis Based on 2010 Census Data. The population and housing estimates and projections in the MTP 2035 datasets for 2008, 2015 and 2025 were aggregated to park service areas. The 2008 data were reviewed because they are the base year for the 2035 forecasts. However, new base year data based on the 2010 Census of population and housing were used as the starting point

Land Use Assumptions
City of Albuquerque, NM Final draft
Impact Fee Study September 13, 2012 16
for the updated land use assumptions. 2010 Census population and total housing counts were aggregated by Census block into park service areas. The impact fees distinguish between single-family and multi-family housing types. The single-family category includes single-family detached units. Mobile homes and recreational vehicles, while not conventional housing, are included in the single-family category. Single-family attached units (townhouses) and units in multi-unit structures (from duplexes up) are included in the multi-family category. Estimates of housing units by the number of units in the structure are available by Census tract through the American Community Survey (ACS). The American Community Survey is an ongoing survey of detailed population and housing characteristics from a sample of households. These sample data are compiled for multiple years to estimate detailed household characteristics not asked in surveys for the official Census count. The most recent ACS data are for 2006-2010. Because the ACS figures are based on a sample, the totals reported vary slightly from the Census counts. The number of single-family detached housing units and multi-family housing units in each park service area were calculated by applying the percentages in the ACS samples to the 100% Census counts. The resulting population and housing counts for 2010 are shown in Table 3. Update to 2012. City of Albuquerque building permit records were reviewed to develop estimates of 2012 housing totals. New single-family detached permits were added to single-family housing. Townhouses, duplexes and units in multi-family structures were added to multi-family housing. Some duplicate permits were eliminated based on identical permit number, date, unit address and description, so the permit totals used in the impact fee analysis vary slightly from the reported City of Albuquerque totals for residential permits. Townhouses were reclassified as multi-family for the impact fee analysis. A total of 1,228 single-family homes and 737 multi-family units were permitted from January 2010 through March 2012. This indicates that 1,965 units were added to the city’s housing stock by early 2012. Current 2012 housing estimates for the four park impact fee service areas (which can be aggregated to East and West road impact fee service areas as well as city-wide service areas for open space/trails, fire and police) and Mesa del Sol are shown in Table 3. 2015 and 2025 Projections. MTP 2035 projections are considered to be the official socioeconomic projections for the impact fee study area. Relevant projection years for the impact fee analysis are 2015 and 2025. Projections of population and housing were aggregated to park service areas. The MTP 2035 forecasts include both single-family detached and attached in the single-family category, so the number of single-family and multi-family units was revised based on the 2012 estimates to account for shifting single-family attached units into the multi-family category. Housing estimates and projections for park service areas and Mesa del Sol are shown in Table 3.

Land Use Assumptions
City of Albuquerque, NM Final draft
Impact Fee Study September 13, 2012 17
Table 3. Housing Units by Type and Area, 2010-2025
2012-15 2015-25
Housing Type/Area 2010 2012 2015 2025 Growth Growth
Single-Family, Northeast 35,543 35,592 35,798 36,043 206 245
Single-Family, Northwest 42,999 43,598 47,458 52,348 3,860 4,890
Single-Family, Southeast 48,783 49,036 50,722 53,199 1,686 2,477
Single-Family, Southwest 30,258 30,569 31,914 34,125 1,344 2,212
Single-Family, Mesa del Sol 0 16 1,598 24,304 1,582 22,706
Total, Single-Family 157,583 158,811 167,490 200,019 8,678 32,530
Multi-Family, Northeast 24,702 24,763 24,907 25,077 144 170
Multi-Family, Northwest 13,803 14,015 15,256 16,828 1,241 1,572
Multi-Family, Southeast 35,106 35,389 36,605 38,393 1,216 1,788
Multi-Family, Southwest 7,795 7,976 8,727 8,904 752 176
Multi-Family, Mesa del Sol 0 0 0 4,405 0 4,405
Total, Multi-Family 81,406 82,143 85,495 93,607 3,353 8,111
Total, Northeast 60,245 60,355 60,705 61,120 350 415
Total, Northwest 56,802 57,613 62,714 69,176 5,101 6,462
Total, Southeast 83,889 84,425 87,327 91,592 2,902 4,265
Total, Southwest 38,053 38,545 40,641 43,029 2,096 2,388
Total, Mesa del Sol 0 16 1,598 28,709 1,582 27,111
Total Housing Units 238,989 240,954 252,985 293,626 12,031 40,641 Note: Single-family category includes single-family detached and mobile home/RV; multi-family category
includes single-family attached (townhouses) and all other housing with more than one unit per structure.
Source: Prepared by Sites Southwest in May 2012, based on 2010 US Census 100% counts, 2006-2010
American Community Survey sample data, City building permits issued from January 2010 through March 2012,
and Mid-Region Council of Governments Metropolitan Transportation Plan projections from 2008 to 2035.
Existing Nonresidential Development
The methodology for establishing impact fees for nonresidential development relies on estimates of square footage for nonresidential development. Calculations of existing level of service and projected revenues include four major categories of nonresidential development: retail, office, institutional and industrial. Data Sources. There is no comprehensive data source for nonresidential square footage in the City of Albuquerque. However, there are several information sources that provide a basis from which to estimate nonresidential square feet by the four nonresidential categories for the east and west road impact fee areas. The data sources used for this analysis are as follows:
Current City of Albuquerque Land Use GIS database. This database classifies land use polygons by four-digit land use codes. These data were used to estimate the total acres of developed land designated retail, office, institutional and industrial. Acres were then converted to building square footage using typical floor-to-area ratios. MRCOG MTP 2035 Employment Data by DASZ. Estimates of retail, service and basic employment by DASZ for 2008, 2015, and 2025. These data were used as a “reality check” to compare with 2012 employee estimates derived from square footage, using average local occupancy rates and typical square feet per employee ratios.

Land Use Assumptions
City of Albuquerque, NM Final draft
Impact Fee Study September 13, 2012 18
Grubb & Ellis and CBRE quarterly real estate trends reports. These reports contain estimates of retail, office and industrial space compiled by local real estate firms, with the following caveats: □ Retail buildings include all multi-tenant and single tenant buildings at least 10,000 square feet. Shopping malls are not included in calculations. Retail data were available for the 4th quarter of 2011. □ Office buildings include all multi-tenant and single tenant buildings of at least 10,000 square feet. Owner-occupied, government and medical buildings are not included. Office data were available for the first quarter of 2012. □ Industrial buildings include all multi-tenant, single tenant and owner occupied buildings at least 10,000 square feet. Industrial data were available for the first quarter of 2012. Data provided by local real estate trends reports include total square footage for the samples and occupancy rates by market area. This information was compiled by road service area. Reported building space is a portion of each market segment, but is representative of overall occupancy rates. New Mexico Department of Workforce Solutions, Quarterly Census of Employment by Industry, 2010 and 2011 Annual Estimates. Annual and monthly estimates of employment (jobs) in Bernalillo County are available from reported wage and salary employment for workers covered by New Mexico unemployment insurance and for federal government employees covered by the Unemployment Compensation for Federal Employees (UCFE). Unemployment insurance does not cover all workers.
Acres by Land Use. The City of Albuquerque’s geographic information system (GIS) database classifies land use polygons by four-digit land use codes. These data were used to estimate the total acres of existing developed land designated retail, office, institutional and industrial. The City uses four-digit land use codes, with the first digit indicating the major land use category. Retail uses are classified by the 2000 land use codes. Services (office) are classified by the 3000 land use codes. Industrial uses are classified by the 4000, 5000 and 6000 land use codes. Institutional uses are classified by the 7000 land use codes. Land uses in the 8000 and 9000 land use codes are primarily open space and recreational uses and vacant and agricultural land, and were not utilized in this analysis. The numbers of developed acres for major land use type by area are shown in Table 4.
Table 4. Nonresidential Acres by Land Use, 2012
Mesa City
Land Use Northwest Southwest Northeast Southeast del Sol Total
Retail 1,026.7 402.3 695.2 1,351.2 0.0 3,475.4
Office 1,154.5 555.0 798.7 1,428.1 111.2 4,047.5
Institutional 1,004.1 681.8 1,085.6 2,244.9 25.5 5,041.9
Industrial 2,100.9 1,028.8 484.9 2,741.3 118.2 6,474.1
Total 5,286.2 2,667.9 3,064.4 7,765.5 254.9 19,038.9 . Source: Sites Southwest, based on City of Albuquerque GIS database, May 2012.
Land Use Assumptions
City of Albuquerque, NM Final draft
Impact Fee Study September 13, 2012 19
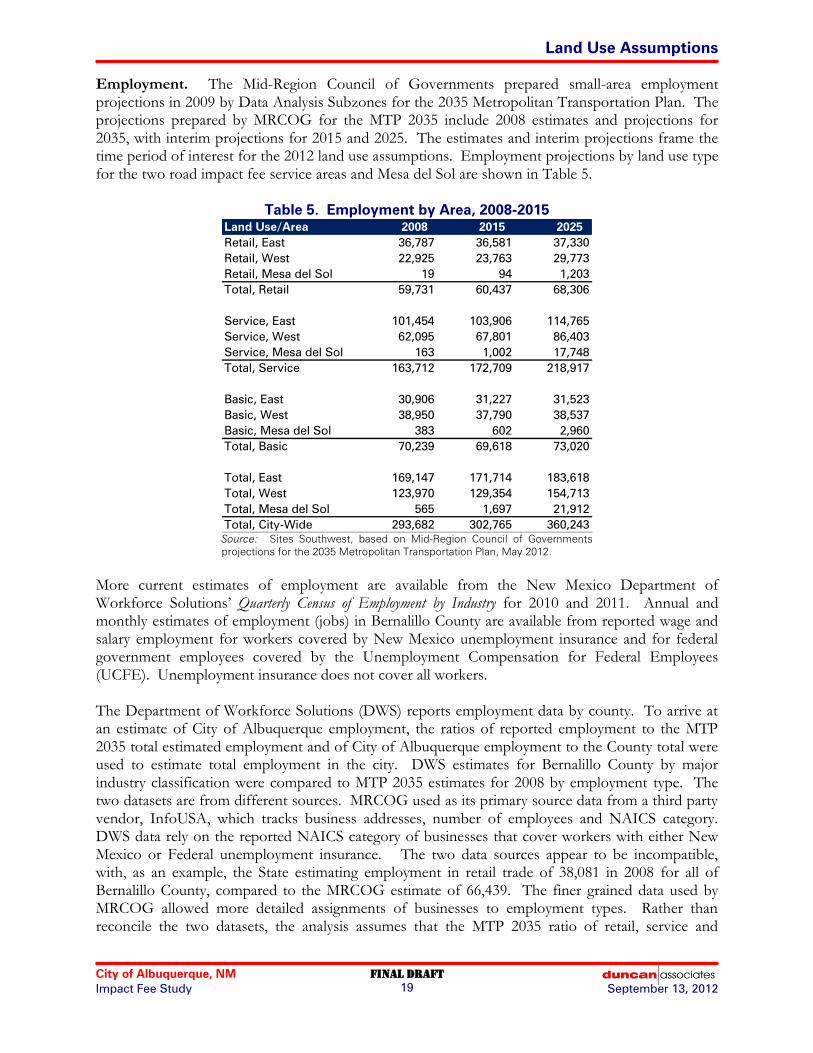
Employment. The Mid-Region Council of Governments prepared small-area employment projections in 2009 by Data Analysis Subzones for the 2035 Metropolitan Transportation Plan. The projections prepared by MRCOG for the MTP 2035 include 2008 estimates and projections for 2035, with interim projections for 2015 and 2025. The estimates and interim projections frame the time period of interest for the 2012 land use assumptions. Employment projections by land use type for the two road impact fee service areas and Mesa del Sol are shown in Table 5.
Table 5. Employment by Area, 2008-2015
Land Use/Area 2008 2015 2025
Retail, East 36,787 36,581 37,330
Retail, West 22,925 23,763 29,773
Retail, Mesa del Sol 19 94 1,203
Total, Retail 59,731 60,437 68,306
Service, East 101,454 103,906 114,765
Service, West 62,095 67,801 86,403
Service, Mesa del Sol 163 1,002 17,748
Total, Service 163,712 172,709 218,917
Basic, East 30,906 31,227 31,523
Basic, West 38,950 37,790 38,537
Basic, Mesa del Sol 383 602 2,960
Total, Basic 70,239 69,618 73,020
Total, East 169,147 171,714 183,618
Total, West 123,970 129,354 154,713
Total, Mesa del Sol 565 1,697 21,912
Total, City-Wide 293,682 302,765 360,243 Source: Sites Southwest, based on Mid-Region Council of Governments
projections for the 2035 Metropolitan Transportation Plan, May 2012.
More current estimates of employment are available from the New Mexico Department of Workforce Solutions’ Quarterly Census of Employment by Industry for 2010 and 2011. Annual and monthly estimates of employment (jobs) in Bernalillo County are available from reported wage and salary employment for workers covered by New Mexico unemployment insurance and for federal government employees covered by the Unemployment Compensation for Federal Employees (UCFE). Unemployment insurance does not cover all workers. The Department of Workforce Solutions (DWS) reports employment data by county. To arrive at an estimate of City of Albuquerque employment, the ratios of reported employment to the MTP 2035 total estimated employment and of City of Albuquerque employment to the County total were used to estimate total employment in the city. DWS estimates for Bernalillo County by major industry classification were compared to MTP 2035 estimates for 2008 by employment type. The two datasets are from different sources. MRCOG used as its primary source data from a third party vendor, InfoUSA, which tracks business addresses, number of employees and NAICS category. DWS data rely on the reported NAICS category of businesses that cover workers with either New Mexico or Federal unemployment insurance. The two data sources appear to be incompatible, with, as an example, the State estimating employment in retail trade of 38,081 in 2008 for all of Bernalillo County, compared to the MRCOG estimate of 66,439. The finer grained data used by MRCOG allowed more detailed assignments of businesses to employment types. Rather than reconcile the two datasets, the analysis assumes that the MTP 2035 ratio of retail, service and

Land Use Assumptions
City of Albuquerque, NM Final draft
Impact Fee Study September 13, 2012 20
industrial employment holds true for the land use assumptions, both for the city total and for the road service areas. Development Intensity. Floor-to-area ratios (FARs) are used to convert land area to square footage estimates and to check the validity of these estimates. A floor-to-area ratio is the ratio of building floor area to land area. While these numbers vary widely from building to building, the ratios used are intended to represent averages. Typical FARs were obtained through research of fiscal impact and land use studies in suburban communities. High, medium and low FARs for retail, office, institutional and industrial development were estimated for Albuquerque based on the ranges in these studies, and are shown in Table 6.
Table 6. Typical Floor-to-Area Ratios
Land Use Low Medium High
Retail 0.180 0.211 0.250
Office 0.150 0.275 0.350
Institutional 0.100 0.110 0.150
Industrial 0.190 0.230 0.270 Source: Sites Southwest (retail is actually 0.21075).
Floor-to-area ratios vary by area of the city. The following assumptions were used to estimate floor area for building types by park service area.
Table 7. FAR Assumptions by Service Area
Land Use Northwest Southwest Northeast Southeast
Retail High High High High
Office Low Medium Low Low
Institutional Low Medium Medium High
Industrial Medium High High Medium Source: Sites Southwest.
Nonresidential Square Feet. Estimates of existing nonresidential square footage in 2012 by land use and area were developed using land use acreage estimates and floor-to-area ratios, as shown in Table 8.
Table 8. Nonresidential Square Feet, 2012
Mesa
Land Use West East del Sol City Total
Retail 15,561,810 22,285,296 0 37,847,106
Office 14,191,848 14,549,911 298,000 29,039,759
Institutional 7,640,772 19,869,938 0 27,510,710
Industrial 33,148,419 33,167,542 579,600 66,895,561
Total 70,542,849 89,872,687 877,600 161,293,136 Source: Sites Southwest, based on acres of developed land by land use from City
GIS data in Table 4 and floor-to-area ratios and area assumptions in Table 6 and
Table 7.
Reasonableness Check Using Employment. To check the estimates of building area for reasonableness, they were converted to employment estimates using occupancy rates and employee density ratios, and then compared to actual employment. Occupied space was estimated using the information in the most recent real estate trends reports. Occupied space was then compared to the expected space used based on retail, office (includes institutional), and industrial employment for the service area. Occupancy estimates from real estate trend reports were assumed to apply across all

Land Use Assumptions
City of Albuquerque, NM Final draft
Impact Fee Study September 13, 2012 21
buildings. Institutional buildings, which are not included in the trends reports, are assumed to be fully occupied. Occupancy assumptions by building type and road impact fee area are shown in Table 9.
Table 9. Occupancy Rates
Land Use West East
Retail 91.5% 91.0%
Office 79.4% 82.9%
Institutional 100.0% 100.0%
Industrial 89.0% 86.3% Source: Sites Southwest.
As with floor area ratios, the number of square feet occupied per employee varies considerably from business to business. The following averages used in fiscal impact studies were assumed in the calculations (see Table 10).
Table 10. Average Square Feet per Employee
Land Use Sq. Feet
Retail 650
Service (Office) 225
Service (Institutional) 500
Industrial 1,000 Source: Sites Southwest.
Using the occupancy rates and employee per square foot averages above, the building area in Table 8 would account for 271,846 employees. The estimated number of employees in the City of Albuquerque in 2012 is 275,157. Since the estimated number of employees associated with building square footage estimates closely match actual city-wide employment (within one percent), the square footage estimates would appear to be reasonable. In addition to 2012 base year estimates, projections for five years in the future are required by statute. The updated land use assumptions include projections of housing, population and nonresidential square footage for five and ten years, 2017 and 2022.
Housing Projections
The Mid-Region Council of Government housing forecasts for 2015 and 2025 (shown above in Table 3) are accepted as small area forecasts for the Albuquerque region. The forecasts for the City of Albuquerque are consistent with the trends observed in 2010 Census counts. Therefore, the 2015 and 2025 forecasts are the foundation of the 2017 and 2022 land use assumptions, with minor modifications to housing projections to account for including townhouses in the multi-family category in the land use assumptions. The 2015 projections are reasonable relative to the 2012 estimates. Therefore, the 2017 and 2022 projections are assumed to fall with a straight line projection between 2015 and 2025. Land use assumptions for housing are shown in Table 11.

Land Use Assumptions
City of Albuquerque, NM Final draft
Impact Fee Study September 13, 2012 22
Table 11. Housing Projections, 2012-2022
2012-17 2017-22
Housing Type/Area 2012 2017 2022 Growth Growth
Single-Family, Northeast 35,592 35,847 35,970 255 123
Single-Family, Northwest 43,598 48,436 50,881 4,838 2,445
Single-Family, Southeast 49,036 51,217 52,456 2,181 1,239
Single-Family, Southwest 30,569 32,356 33,462 1,787 1,106
Single-Family, Mesa del Sol 16 6,139 17,492 6,123 11,353
Total, Single-Family 158,811 173,995 190,261 15,184 16,266
Multi-Family, Northeast 24,763 24,941 25,026 178 85
Multi-Family, Northwest 14,015 15,570 16,356 1,555 786
Multi-Family, Southeast 35,389 36,963 37,857 1,574 894
Multi-Family, Southwest 7,976 8,763 8,851 787 88
Multi-Family, Mesa del Sol 0 881 3,084 881 2,203
Total, Multi-Family 82,143 87,118 91,174 4,975 4,056
Total, Northeast 60,355 60,788 60,996 433 208
Total, Northwest 57,613 64,006 67,237 6,393 3,231
Total, Southeast 84,425 88,180 90,313 3,755 2,133
Total, Southwest 38,545 41,119 42,313 2,574 1,194
Total, Mesa del Sol 16 7,020 20,576 7,004 13,556
Total Housing Units 240,954 261,113 281,435 20,159 20,322 Source: Table 3 (2017 projections based on 2015 plus two years of average annual new units from
2015-2025; 2022 projections based on 2017 projections plus five years of average annual new units
from 2015-2025).
Population Projections
Population projections are based on housing units and persons per unit, which accounts for both household size and occupancy rates. Generally, household sizes are decreasing over time, and this trend is expected to continue in all areas of the City. The MTP 2035 project decreasing household sizes as well. Persons per unit assumptions by year and by park service area are shown in Table 12.
Table 12. Average Persons per Dwelling Unit
Area 2010 2012 2017 2022
Northeast 2.12 2.12 2.10 2.07
Northwest 2.42 2.42 2.36 2.33
Southeast 2.10 2.10 2.02 1.99
Southwest 2.73 2.73 2.56 2.50
Mesa del Sol n/a 2.67 2.51 2.35 Source: Sites Southwest, May 2012.
The estimates of persons per unit were applied to the housing estimates and projections. The resulting population estimates and projections are shown in Table 13.
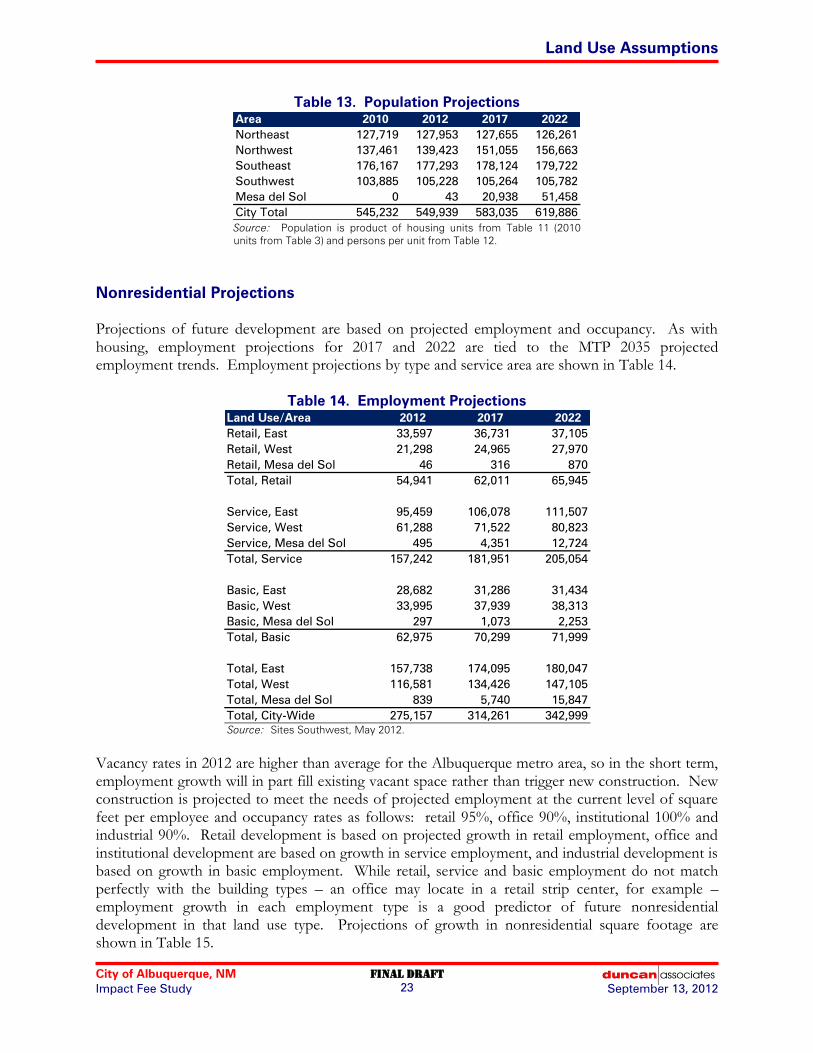
Land Use Assumptions
City of Albuquerque, NM Final draft
Impact Fee Study September 13, 2012 23
Table 13. Population Projections
Area 2010 2012 2017 2022
Northeast 127,719 127,953 127,655 126,261
Northwest 137,461 139,423 151,055 156,663
Southeast 176,167 177,293 178,124 179,722
Southwest 103,885 105,228 105,264 105,782
Mesa del Sol 0 43 20,938 51,458
City Total 545,232 549,939 583,035 619,886 Source: Population is product of housing units from Table 11 (2010
units from Table 3) and persons per unit from Table 12.
Nonresidential Projections
Projections of future development are based on projected employment and occupancy. As with housing, employment projections for 2017 and 2022 are tied to the MTP 2035 projected employment trends. Employment projections by type and service area are shown in Table 14.
Table 14. Employment Projections
Land Use/Area 2012 2017 2022
Retail, East 33,597 36,731 37,105
Retail, West 21,298 24,965 27,970
Retail, Mesa del Sol 46 316 870
Total, Retail 54,941 62,011 65,945
Service, East 95,459 106,078 111,507
Service, West 61,288 71,522 80,823
Service, Mesa del Sol 495 4,351 12,724
Total, Service 157,242 181,951 205,054
Basic, East 28,682 31,286 31,434
Basic, West 33,995 37,939 38,313
Basic, Mesa del Sol 297 1,073 2,253
Total, Basic 62,975 70,299 71,999
Total, East 157,738 174,095 180,047
Total, West 116,581 134,426 147,105
Total, Mesa del Sol 839 5,740 15,847
Total, City-Wide 275,157 314,261 342,999 Source: Sites Southwest, May 2012.
Vacancy rates in 2012 are higher than average for the Albuquerque metro area, so in the short term, employment growth will in part fill existing vacant space rather than trigger new construction. New construction is projected to meet the needs of projected employment at the current level of square feet per employee and occupancy rates as follows: retail 95%, office 90%, institutional 100% and industrial 90%. Retail development is based on projected growth in retail employment, office and institutional development are based on growth in service employment, and industrial development is based on growth in basic employment. While retail, service and basic employment do not match perfectly with the building types – an office may locate in a retail strip center, for example – employment growth in each employment type is a good predictor of future nonresidential development in that land use type. Projections of growth in nonresidential square footage are shown in Table 15.

Land Use Assumptions
City of Albuquerque, NM Final draft
Impact Fee Study September 13, 2012 24
Table 15. Nonresidential Square Footage Projections
2012-2017 2017-2022
Land Use/Area 2012 2017 2022 Growth Growth
Retail, East 22,285,296 23,337,453 23,581,492 1,052,157 244,039
Retail, West 15,561,810 17,569,545 19,688,913 2,007,735 2,119,368
Retail, Mesa del Sol 0 220,785 607,856 220,785 387,071
Total, Retail 37,847,106 41,127,783 43,878,261 3,280,677 2,750,478
Office, East 14,549,911 14,899,495 15,666,314 349,584 766,819
Office, West 14,191,848 14,705,268 16,583,736 513,420 1,878,468
Office, Mesa del Sol 298,000 934,943 2,734,132 636,943 1,799,189
Total, Office 29,039,759 30,539,706 34,984,182 1,499,947 4,444,476
Institutional, East 19,869,938 22,078,581 23,207,670 2,208,643 1,129,089
Institutional, West 7,640,772 8,961,796 10,189,886 1,321,024 1,228,090
Institutional, Mesa del Sol 0 243,007 510,248 243,007 267,241
Total, Institutional 27,510,710 31,283,384 33,907,804 3,772,674 2,624,420
Industrial, East 33,167,542 34,676,082 34,855,636 1,508,540 179,554
Industrial, West 33,148,419 36,605,541 36,957,612 3,457,122 352,071
Industrial, Mesa del Sol 579,600 1,704,354 4,705,382 1,124,754 3,001,028
Total, Industrial 66,895,561 72,985,977 76,518,630 6,090,416 3,532,653
Total, East 89,872,687 94,991,611 97,311,112 5,118,924 2,319,501
Total, West 70,542,849 77,842,150 83,420,147 7,299,301 5,577,997
Total, Mesa del Sol 877,600 3,103,089 8,557,618 2,225,489 5,454,529
Total 161,293,136 175,936,850 189,288,877 14,643,714 13,352,027
Source: 2012 square footage from Table 8; projections by Sites Southwest, June 1, 2012.
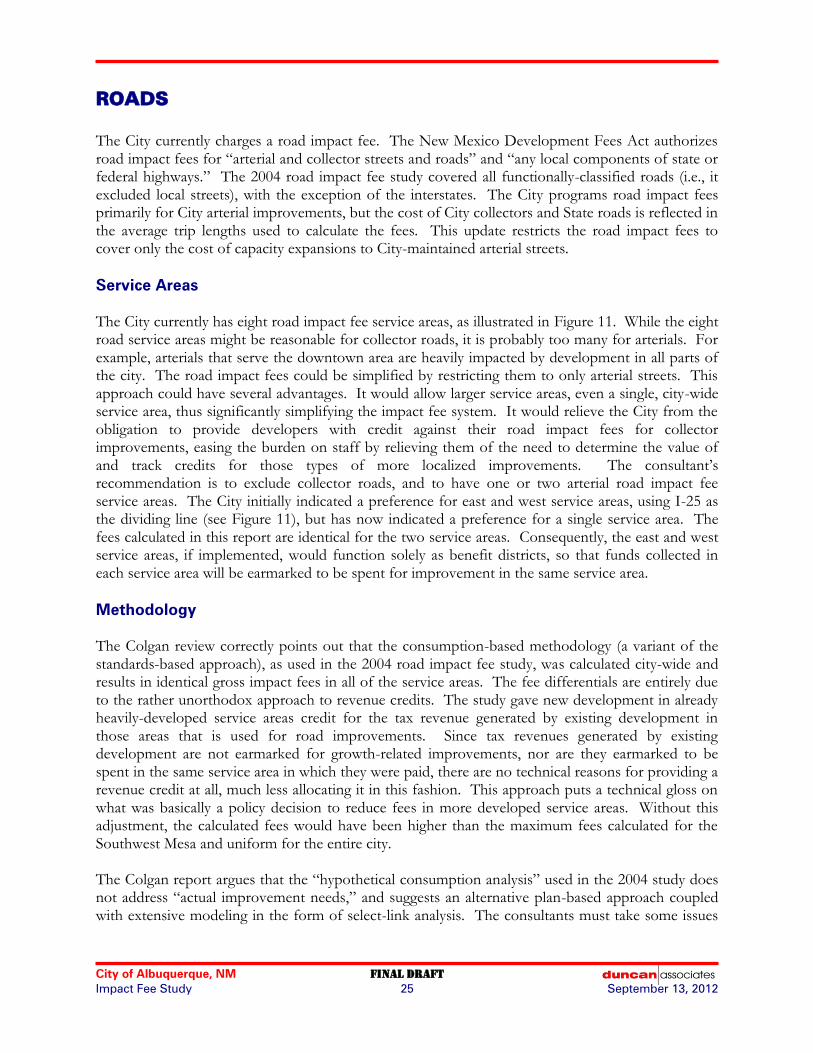
City of Albuquerque, NM FINAL draft
Impact Fee Study 25 September 13, 2012
ROADS
The City currently charges a road impact fee. The New Mexico Development Fees Act authorizes road impact fees for “arterial and collector streets and roads” and “any local components of state or federal highways.” The 2004 road impact fee study covered all functionally-classified roads (i.e., it excluded local streets), with the exception of the interstates. The City programs road impact fees primarily for City arterial improvements, but the cost of City collectors and State roads is reflected in the average trip lengths used to calculate the fees. This update restricts the road impact fees to cover only the cost of capacity expansions to City-maintained arterial streets.
Service Areas
The City currently has eight road impact fee service areas, as illustrated in Figure 11. While the eight road service areas might be reasonable for collector roads, it is probably too many for arterials. For example, arterials that serve the downtown area are heavily impacted by development in all parts of the city. The road impact fees could be simplified by restricting them to only arterial streets. This approach could have several advantages. It would allow larger service areas, even a single, city-wide service area, thus significantly simplifying the impact fee system. It would relieve the City from the obligation to provide developers with credit against their road impact fees for collector improvements, easing the burden on staff by relieving them of the need to determine the value of and track credits for those types of more localized improvements. The consultant’s recommendation is to exclude collector roads, and to have one or two arterial road impact fee service areas. The City initially indicated a preference for east and west service areas, using I-25 as the dividing line (see Figure 11), but has now indicated a preference for a single service area. The fees calculated in this report are identical for the two service areas. Consequently, the east and west service areas, if implemented, would function solely as benefit districts, so that funds collected in each service area will be earmarked to be spent for improvement in the same service area.
Methodology
The Colgan review correctly points out that the consumption-based methodology (a variant of the standards-based approach), as used in the 2004 road impact fee study, was calculated city-wide and results in identical gross impact fees in all of the service areas. The fee differentials are entirely due to the rather unorthodox approach to revenue credits. The study gave new development in already heavily-developed service areas credit for the tax revenue generated by existing development in those areas that is used for road improvements. Since tax revenues generated by existing development are not earmarked for growth-related improvements, nor are they earmarked to be spent in the same service area in which they were paid, there are no technical reasons for providing a revenue credit at all, much less allocating it in this fashion. This approach puts a technical gloss on what was basically a policy decision to reduce fees in more developed service areas. Without this adjustment, the calculated fees would have been higher than the maximum fees calculated for the Southwest Mesa and uniform for the entire city. The Colgan report argues that the “hypothetical consumption analysis” used in the 2004 study does not address “actual improvement needs,” and suggests an alternative plan-based approach coupled with extensive modeling in the form of select-link analysis. The consultants must take some issues
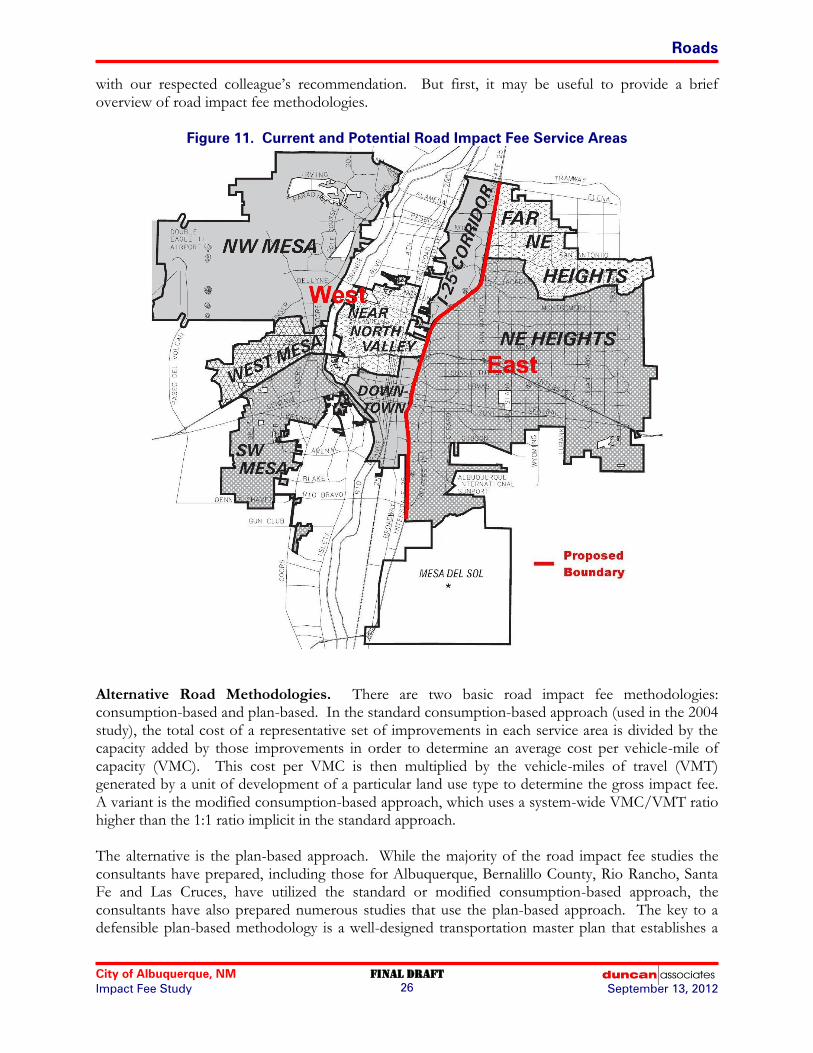
Roads
City of Albuquerque, NM Final draft
Impact Fee Study September 13, 2012 26
with our respected colleague’s recommendation. But first, it may be useful to provide a brief overview of road impact fee methodologies.
Figure 11. Current and Potential Road Impact Fee Service Areas
Alternative Road Methodologies. There are two basic road impact fee methodologies: consumption-based and plan-based. In the standard consumption-based approach (used in the 2004 study), the total cost of a representative set of improvements in each service area is divided by the capacity added by those improvements in order to determine an average cost per vehicle-mile of capacity (VMC). This cost per VMC is then multiplied by the vehicle-miles of travel (VMT) generated by a unit of development of a particular land use type to determine the gross impact fee. A variant is the modified consumption-based approach, which uses a system-wide VMC/VMT ratio higher than the 1:1 ratio implicit in the standard approach. The alternative is the plan-based approach. While the majority of the road impact fee studies the consultants have prepared, including those for Albuquerque, Bernalillo County, Rio Rancho, Santa Fe and Las Cruces, have utilized the standard or modified consumption-based approach, the consultants have also prepared numerous studies that use the plan-based approach. The key to a defensible plan-based methodology is a well-designed transportation master plan that establishes a

Roads
City of Albuquerque, NM Final draft
Impact Fee Study September 13, 2012 27
strong nexus between anticipated growth over a 10-20 year period and the improvements that will be required to accommodate growth over that planning horizon. The cost per VMT (or per trip) is determined by dividing the cost of the planned improvements by the growth in VMT. The cost per VMT is then multiplied by the vehicle-miles of travel (VMT) generated by a unit of development of a particular land use type to determine the gross impact fee. There are advantages and disadvantages to the two methodologies. The consumption-based approach, at least in its standard form, tends to be conservative and generally results in lower impact fees than the plan-based approach. This is because most roadway systems need more than one unit of capacity (VMC) for each unit of travel demand (VMT) in order to function at an acceptable level of service (the modified consumption-based approach addresses this issue and is less conservative). Plan-based fees using a transportation plan that identifies all of the improvements needed to provide acceptable levels of service on all roadways will almost always result in higher fees. The major advantage of a consumption-based methodology is that it is more flexible, since the fees are not dependent on the specific projects included in the list of improvements, only on the average cost to construct a vehicle-mile of capacity. Changing the list of planned projects typically does not require recalculation of consumption-based road impact fees, since a single project is likely to have an insignificant impact on the average cost of capacity added by all of the improvements. This allows the capital plan to change in response to unforeseen development without triggering the need for an impact fee update. That flexibility can also be seen as a major disadvantage of the consumption-based approach, although the consultants disagree. Many people, particularly developers and builders, tend to like the certainty of knowing which projects will be funded with their impact fees. This advantage of plan-based fees can be over-rated, however. The Development Fees Act requires that there be a list of planned improvements, and that the impact fees be spent only on listed projects, regardless of the methodology on which the fees are based. In addition, the impact fee capital plan must be updated at least every five years, and many communities find it necessary to modify their plan even between updates. The real difference between the methodologies is that any change to the capital plan for a plan-based fee would require a new transportation plan and impact fee update. There may not be as much more certainty with a plan-based fee as appears to be commonly believed, but there definitely is more rigidity. The major advantage of a plan-based fee is that it can better reflect the actual marginal costs of improvements needed to serve new development in geographic subareas, as is pointed out in the Colgan review. This is a particularly important aspect of an impact fee system if the primary goal is not cost recovery, but the direction of growth to areas that already have roadways with significant excess capacity. A potential problem with this strategy, however, is that areas where infill and redevelopment are desired often have the most congested roadways, whereas roadways in more remote areas often have more excess capacity. This was a criticism often leveled at Florida’s concurrency requirements, for example, which tended to discourage growth in urban areas and encourage sprawl. The consultants tend to prefer the consumption-based approach because of its greater flexibility and the fact that its soundness is not dependent on the availability and quality of a transportation master plan. It is also really the only practical approach for this update, since the City does not have a recently-prepared transportation master plan that could serve as the basis for a plan-based approach.
Roads
City of Albuquerque, NM Final draft
Impact Fee Study September 13, 2012 28
Cost Components. The cost components that go into the road impact fee calculation are also key variables. Communities can get into trouble if they adopt fees that are only a fraction of the true cost, since this can create an imbalance between fee revenues and developer credits, since developers receive credit for the full cost of their improvements, regardless of whether the fees are based on full costs. For example, a former client of ours, the Washoe County Regional Transportation Commission (Reno, Nevada), had failed to charge full-cost impact fees for years. Developers amassed enormous credits in excess of the fees due for their subdivisions, and the RTC now is in a position where the outstanding developer credits could potentially be used to pay all future impact fees for development anticipated in the next 20 years, threatening their impact fee revenue stream. If there is not the political will to charge full cost road impact fees, it is much better to remove some of the cost components in order to reduce the cost than to simply adopt the fees at a fraction of the full cost. One way to do this is to remove collector streets from the road impact fee program, as suggested earlier. When the consultants recently updated Phoenix’s road impact fees, the City went much farther, ultimately deciding that they were only willing to charge a fee that would cover the cost of major bridges and drainage structures. Under their revised system, developers will no longer receive credit for right-of-way (ROW) dedication or road-way construction, which will revert to a system of negotiated developer exactions. Recommendation. The consultant’s recommendation is that the City’s updated road impact fees continue to be calculated using the consumption-based methodology. Not only does this approach provide greater flexibility in updating the capital improvements plan to reflect changing needs and priorities, it is also really the only practical approach, since the City does not have a suitable transportation master plan on which to base the alternative plan-based calculation. The consultants also recommend that the City exclude collector street improvement costs and ROW costs from the updated road impact fee calculations. Eliminating collector road costs allows larger service areas and simplifies the impact fee system, while excluding both collector road and ROW costs will result in lower fees that are more likely to be adopted at full cost, thereby helping to ensure a reasonable balance is maintained between the amount of the fees and the value of developer credits. This study calculates road fees for arterial streets only, and excludes ROW costs. With ROW costs excluded, the City will not be obligated to give impact fee credits for ROW dedications.
Service Units
A service unit is a unit of measurement that expresses the demand for facilities resulting from different types of development. For the purpose of road impact fees, the service unit is a vehicle-mile of travel (VMT). Road impact fees may be based on either daily or peak hour travel demand. The 2004 study used peak hour travel for determining costs, and daily travel for calculating revenue credits. This resulted in some service areas having no fees for most uses, but fees for selected uses that did not have credits that exceeded costs. To simplify the system, and because the available traffic counts are in terms of average daily trips, this study uses average daily VMT as the service unit. The average daily VMT generated by specific land use types in Albuquerque is a product of four factors: 1) trip generation, 2) percent new trips, 3) average trip length and 4) a local adjustment factor to calibrate VMT based on national travel characteristics to reflect local travel demand.

Roads
City of Albuquerque, NM Final draft
Impact Fee Study September 13, 2012 29
Trip Generation. Trip generation rates are based on information published in the most recent edition of the Institute of Transportation Engineers’ (ITE) Trip Generation manual. Trip generation rates represent trip ends, or driveway crossings at the site of a land use. Thus, a single one way trip from home to work counts as one trip end for the residence and one trip end for the work place, for a total of two trip ends. To avoid over counting, all trip rates have been divided by two. This places the burden of travel equally between the origin and destination of the trip and eliminates double charging for any particular trip. New Trip Factor. Trip rates must also be adjusted by a “new trip factor” to exclude pass by and diverted-linked trips. This adjustment is intended to reduce the possibility of over-counting by only including primary trips generated by the development. Pass by trips are those trips that are already on a particular route for a different purpose and simply stop at a development on that route. For example, a stop at a convenience store on the way home from the office is a pass by trip for the convenience store. A pass by trip does not create an additional burden on the street system and therefore should not be counted in the assessment of impact fees. A diverted-linked trip is similar to a pass by trip, but a diversion is made from the regular route to make an interim stop. The reduction for pass by and diverted-linked trips was drawn from ITE and other published information. Average Trip Length. In the context of a road impact fee based on a consumption-based methodology, it is important to determine the average length of a trip on the major roadway system within Albuquerque. This study uses national data for both trip generation rates and average trip lengths and calibrates total VMT to local conditions using a local adjustment factor. The local adjustment factor is derived by dividing the VMT that is actually observed on the major roadway system by the VMT that would be expected using national average trip lengths and trip generation rates. Table 16 below shows national average trip lengths by trip purpose from the U.S. Department of Transportation’s 2009 National Household Travel Survey. The national survey identifies average trip lengths for specific trip purposes, including home-to-work trips, doctor/dentist, school/church, shopping, and other personal trips.
Table 16. National Average Trip Lengths
Trip Purpose Miles
To or from work 11.98
Single-Family Detached 9.75
Multi-Family 6.51
Mobile Home 6.03
Medical/Dental 9.61
Average 9.28
School/Church 8.47
Family/Personal 6.61
Shopping 6.27 Source: US. Department of Transportation, National
Household Travel Survey, 2009 (multi-family based on ratio
of multi-family to single-family trip lengths from Tindale-
Oliver & Associates, Roadway Facilities Impact Cost Study,
August 2004). Local Adjustment Factor. The adjustment factor is used to calibrate national data on trip generation and average trip length to local conditions in Albuquerque. The first step in developing
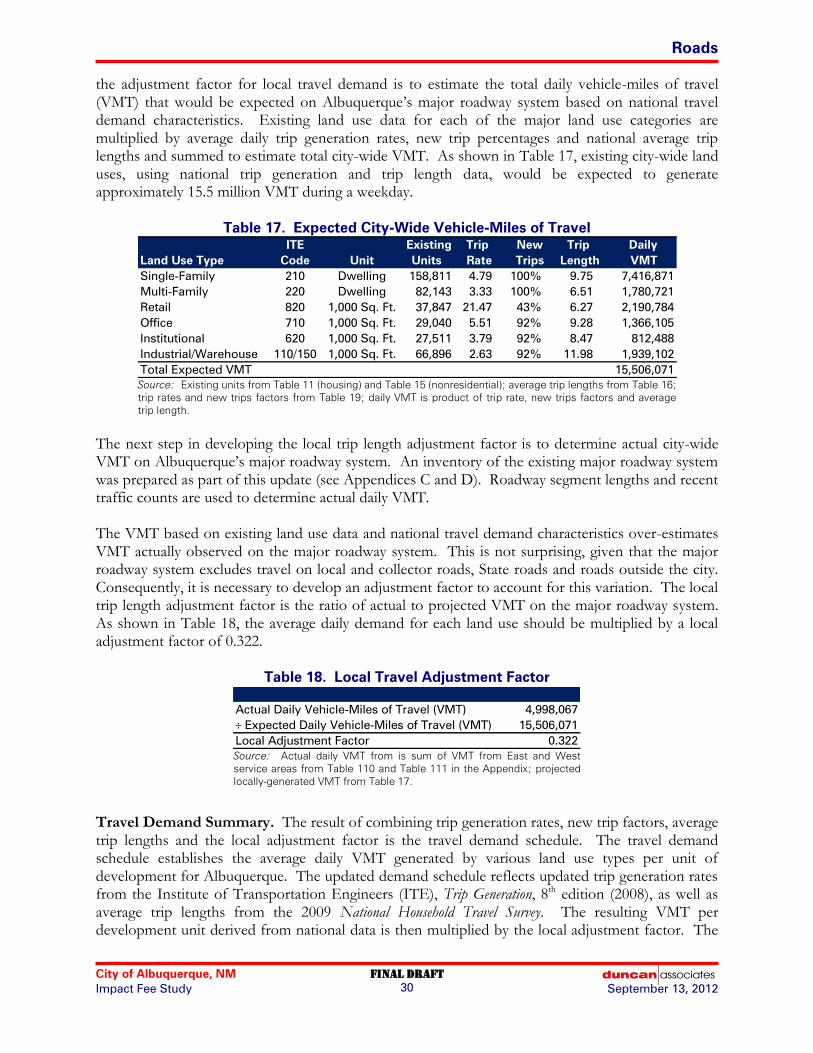
Roads
City of Albuquerque, NM Final draft
Impact Fee Study September 13, 2012 30
the adjustment factor for local travel demand is to estimate the total daily vehicle-miles of travel (VMT) that would be expected on Albuquerque’s major roadway system based on national travel demand characteristics. Existing land use data for each of the major land use categories are multiplied by average daily trip generation rates, new trip percentages and national average trip lengths and summed to estimate total city-wide VMT. As shown in Table 17, existing city-wide land uses, using national trip generation and trip length data, would be expected to generate approximately 15.5 million VMT during a weekday.
Table 17. Expected City-Wide Vehicle-Miles of Travel
ITE Existing Trip New Trip Daily
Land Use Type Code Unit Units Rate Trips Length VMT
Single-Family 210 Dwelling 158,811 4.79 100% 9.75 7,416,871
Multi-Family 220 Dwelling 82,143 3.33 100% 6.51 1,780,721
Retail 820 1,000 Sq. Ft. 37,847 21.47 43% 6.27 2,190,784
Office 710 1,000 Sq. Ft. 29,040 5.51 92% 9.28 1,366,105
Institutional 620 1,000 Sq. Ft. 27,511 3.79 92% 8.47 812,488
Industrial/Warehouse 110/150 1,000 Sq. Ft. 66,896 2.63 92% 11.98 1,939,102
Total Expected VMT 15,506,071 Source: Existing units from Table 11 (housing) and Table 15 (nonresidential); average trip lengths from Table 16;
trip rates and new trips factors from Table 19; daily VMT is product of trip rate, new trips factors and average
trip length.
The next step in developing the local trip length adjustment factor is to determine actual city-wide VMT on Albuquerque’s major roadway system. An inventory of the existing major roadway system was prepared as part of this update (see Appendices C and D). Roadway segment lengths and recent traffic counts are used to determine actual daily VMT. The VMT based on existing land use data and national travel demand characteristics over-estimates VMT actually observed on the major roadway system. This is not surprising, given that the major roadway system excludes travel on local and collector roads, State roads and roads outside the city. Consequently, it is necessary to develop an adjustment factor to account for this variation. The local trip length adjustment factor is the ratio of actual to projected VMT on the major roadway system. As shown in Table 18, the average daily demand for each land use should be multiplied by a local adjustment factor of 0.322.
Table 18. Local Travel Adjustment Factor
Actual Daily Vehicle-Miles of Travel (VMT) 4,998,067
÷ Expected Daily Vehicle-Miles of Travel (VMT) 15,506,071
Local Adjustment Factor 0.322 Source: Actual daily VMT from is sum of VMT from East and West
service areas from Table 110 and Table 111 in the Appendix; projected
locally-generated VMT from Table 17.
Travel Demand Summary. The result of combining trip generation rates, new trip factors, average trip lengths and the local adjustment factor is the travel demand schedule. The travel demand schedule establishes the average daily VMT generated by various land use types per unit of development for Albuquerque. The updated demand schedule reflects updated trip generation rates from the Institute of Transportation Engineers (ITE), Trip Generation, 8th edition (2008), as well as average trip lengths from the 2009 National Household Travel Survey. The resulting VMT per development unit derived from national data is then multiplied by the local adjustment factor. The

Roads
City of Albuquerque, NM Final draft
Impact Fee Study September 13, 2012 31
recommended travel demand schedule is presented in Table 19. For each land use, the daily VMT is the product of trip rate, trip length, new trip factor and the local adjustment factor.
Table 19. Travel Demand Schedule
ITE 1-Way Trip % New Adjust. Daily
Land Use Type Code Unit Trips Length Trips Factor VMT
Single-Family Detached 210 Dwelling 4.79 9.75 100% 0.322 15.04
Multi-Family 220 Dwelling 3.33 6.51 100% 0.322 6.98
Mobile Home Park 240 Space 2.50 6.03 100% 0.322 4.85
Hotel/Motel 310/320 Room 3.45 11.98 75% 0.322 9.98
Retail/Commercial 820 1,000 sq. ft. 21.47 6.03 43% 0.322 17.93
Office 710 1,000 sq. ft. 5.51 9.28 92% 0.322 15.15
Public/Institutional 620 1,000 sq. ft. 3.79 8.47 92% 0.322 9.51
Industrial 110 1,000 sq. ft. 3.48 11.98 92% 0.322 12.35
Warehouse 150 1,000 sq. ft. 1.78 11.98 92% 0.322 6.32
Mini-Warehouse 151 1,000 sq. ft. 1.25 6.61 92% 0.322 2.45 Source: 1-way trips are ½ of trip ends from Institute of Transportation Engineers (ITE), Trip Generation, 8th Edition, 2008
(commercial based on office; public/institutional on nursing home and industrial/warehouse on warehouse) ; new trip
percentages for retail/commercial uses from ITE, Trip Generation Handbook, June 2004; new trip percentage for other uses
from Tindale-Oliver & Associates, City of Albuquerque Road Facilities Impact Cost Study, August 2004; average trip lengths
from Table 16; local adjustment factor from Table 18; VMT is product of trip rate, new trips, trip length and local adjustment
factor.
Using the travel demand schedule and the amount of existing and projected development from the land use assumptions, existing service units in 2012 and projected service units in 2022 can be estimated (see Table 20).
Table 20. Existing and Projected Road Service Units, 2012-2022
VMT/
Land Use Type Unit East West M d Sol Unit East West M d Sol Total
Single-Family, 2012 Dwelling 84,628 74,167 16 15.04 1,272,805 1,115,472 241 2,388,518
Multi-Family, 2012 Dwelling 60,152 21,991 0 6.98 419,861 153,497 0 573,358
Retail/Comm., 2012 1,000 sf 22,285 15,562 0 17.93 399,570 279,027 0 678,597
Office, 2012 1,000 sf 14,550 14,192 298 15.15 220,433 215,009 4,515 439,957
Institutional, 2012 1,000 sf 19,870 7,641 0 9.51 188,964 72,666 0 261,630
Indust./Whse, 2012 1,000 sf 33,168 33,148 580 9.34 309,789 309,602 5,417 624,808
Total VMT, 2012 2,811,422 2,145,273 10,173 4,966,868
Single-Family, 2022 Dwelling 88,426 84,343 17,492 15.04 1,329,927 1,268,519 263,080 2,861,526
Multi-Family, 2022 Dwelling 62,883 25,207 3,084 6.98 438,923 175,945 21,526 636,394
Retail/Comm., 2022 1,000 sf 23,581 19,689 608 17.93 422,807 353,024 10,901 786,732
Office, 2022 1,000 sf 15,666 16,584 2,734 15.15 237,340 251,248 41,420 530,008
Institutional, 2022 1,000 sf 23,208 10,190 510 9.51 220,708 96,907 4,850 322,465
Indust./Whse, 2022 1,000 sf 34,856 36,958 4,705 9.34 325,555 345,188 43,945 714,688
Total VMT, 2022 2,975,260 2,490,831 385,722 5,851,813
New VMT, 2012-2022 163,838 345,558 375,549 884,945
Development Units Vehicle-Miles of Travel (VMT)
Source: 2012 and 2022 development units from Table 11 (housing) and Table 15 (nonresidential); VMT per unit from Table 19
(industrial/warehouse is average of the two); VMT is product of units and VMT per unit.
Table 21 below compares estimated 2012 service units (VMT) based on the travel demand schedule and existing land uses to the actual current VMT observed on the major road system (which are based on 2010 traffic counts). The fact that the travel demand schedule estimates actual vehicle-miles of travel within less than one percent indicates that the calibration of the travel demand schedule worked well.

Roads
City of Albuquerque, NM Final draft
Impact Fee Study September 13, 2012 32
Table 21. Comparison of Estimated to Actual Road Service Units, 2012
Estimated 2012 VMT Based on Demand Schedule 4,966,868
Actual 2010 VMT Based on Road Inventory 4,998,067
Ratio, Estimated to Actual Vehicle-Miles of Travel 99.38% Source: Estimated 2012 VMT from Table 20; actual VMT in 2010 from Table 18.
Existing Level of Service. As described in the previous section, the level of service measure used in the consumption-based approach is expressed in terms of the ratio of system-wide capacity (vehicle-miles of capacity or VMC) to demand (vehicle-miles of travel or VMT). The existing VMC/VMT ratio is similar for the potential east and west service areas, as shown in Table 22. While the fees could be based on any VMC/VMT ratio lower than the existing level, most road impact free studies that use the consumption-based approach, including the 2004 study for Albuquerque, use 1.0. However, some communities have used higher ratios. For example, Rio Rancho’s road impact fees are based on a 2.0 VMC/VMT ratio (they had an existing ratio of 2.15). To be conservative, and consistent with the approach used in the 2004 study, this study will use a 1.0 VMC/VMT ratio in the fee calculations. It should be noted that there are no existing deficiencies for the purpose of updated road impact fees based on this level of service.
Table 22. Existing Arterial Roadway Level of Service
East West Total
Daily Vehicle-Miles of Capacity (VMC) 4,947,777 3,562,196 8,509,973
÷ Daily Vehicle-Miles of Travel (VMT) 2,832,874 2,165,193 4,998,067
Existing VMC/VMT Ratio 1.75 1.65 1.70 Source: Table 110 and Table 111 in the Appendix.
Cost per Service Unit
In a consumption-based impact fee system, roadway construction costs are entered into the formula as an average cost for providing new roadway capacity. One of the key inputs into the road impact fee formula is the cost per vehicle-mile of capacity to construct new roadway capacity. Using this method, assuming there are no dramatic changes to the type of construction contemplated, it is not necessary to revisit impact fees each time that the capital improvement program changes. Updates at reasonable periodic intervals are sufficient to analyze potential changes to average costs. Generalized construction costs were generated by Parsons Brinckerhoff using recent City of Albuquerque arterial construction projects. Bid tabs were collected from the City of Albuquerque and include the following projects: Paradise Boulevard Improvements, Wyoming Boulevard Widening Project, McMahon Boulevard Extension, Fortuna Road Improvements, Wyoming Boulevard Widening Phase II, Unser Boulevard SW Improvements Phase II and Universe Boulevard Improvement Project. Average unit costs were calculated for major bid items using the provided bid tabs and used to calculate five types of road widening or new road projects. The construction cost per lane-mile added by the various types of improvement ranges from $1.2 million for a new six-lane roadway to $2.0 million for a widening from two to four lanes (see Table 23). While right-of-way (ROW) costs can be a significant part of road improvement costs, they have been excluded from the impact fee calculations, for two reasons. First, ROW costs are extremely variable and difficult to estimate in advance. Second, excluding ROW costs will avoid the need to

Roads
City of Albuquerque, NM Final draft
Impact Fee Study September 13, 2012 33
provide developers with credit for ROW dedications – avoiding an imbalance between developer credits and fee revenues.
Table 23. Generalized Roadway Costs per Lane-Mile
Cost Items (Notes) Unit Cost Unit New 2-Lane New 4-Lane New 6-Lane 2-4 Lane 4-6 Lane
Asphalt Pavement (1) $350,000 Lane-Mile $700,000 $1,400,000 $2,100,000 $700,000 $700,000
Standard Curb and Gutter (2) $90,000 Side, Mile $180,000 $180,000 $180,000 $180,000 $0
Median Curb and Gutter (3) $80,000 Side, Mile $0 $160,000 $160,000 $0 $160,000
Sidewalk, 6 Foot Standard (4) $120,000 Side, Mile $240,000 $240,000 $240,000 $240,000 $0
On-Street Bicycle Lanes (5) $100,000 Side, Mile $0 $200,000 $200,000 $200,000 $0
Landscaping, Outboard (6) $180,000 Side, Mile $360,000 $360,000 $360,000 $360,000 $0
Landscaping, Median (7) $460,000 Mile $0 $460,000 $460,000 $0 $460,000
Street Lighting (8) $240,000 Mile $240,000 $240,000 $240,000 $240,000 $0
Traffic Signals (9) $160,000 Intersection $0 $320,000 $480,000 $320,000 $160,000
Removals (10) $120,000 Mile $120,000 $120,000 $120,000 $120,000 $120,000
Roadway Drainage (11) $260,000 Mile $260,000 $260,000 $260,000 $260,000 $57,200
Construction Cost per Mile $2,100,000 $3,940,000 $4,800,000 $2,620,000 $1,657,200
Preliminary Engr. & Design 10.0% $210,000 $394,000 $480,000 $262,000 $165,720
Contingencies 15.0% $315,000 $591,000 $720,000 $393,000 $248,580
NMGRT 7.0% $147,000 $275,800 $336,000 $183,400 $116,004
Traffic Control 3.0% $63,000 $118,200 $144,000 $78,600 $49,716
Mobilization 3.5% $73,500 $137,900 $168,000 $91,700 $58,002
Demobilization 2.0% $42,000 $78,800 $96,000 $52,400 $33,144
Testing and Survey 5.0% $105,000 $197,000 $240,000 $131,000 $82,860
Construction Management 7.0% $147,000 $275,800 $336,000 $183,400 $116,004
Development Cost per Mile 52.5% $1,102,500 $2,068,500 $2,520,000 $1,375,500 $870,030
Construction/Development Cost per Mile $3,202,500 $6,008,500 $7,320,000 $3,995,500 $2,527,230
ROW Cost per Mile $495,000 $495,000 $495,000 $495,000 $495,000
Total Cost per Mile $3,697,500 $6,503,500 $7,815,000 $4,490,500 $3,022,230
÷ Number of New Lanes 2 4 6 2 2
Construction/Development Cost per Lane-Mile $1,601,250 $1,502,125 $1,220,000 $1,997,750 $1,263,615 Notes: (1) Includes all earthwork, construction signage.
(2) For 2 to 4 lane expansions, assume the existing outside curb and gutter does not exist or must be rebuilt in a new location. For 4 to 6 lane
expansions, assume outside curb and gutter to be correctly placed.
(3) Assumes the inside curb and gutter is constructed when the roadway expansion goes from 4 to 6 lanes.
(4) For 2 to 4 lane expansions, assume there are no existing sidewalks or that they must be rebuilt in a new location.
(5) Assume on-street bicycle lanes are constructed with the 2 to 4 lane expansion.
(6) For 2 to 4 lane expansions, assume existing streets do not already have outside landscaping or substantial modifications to the existing
streetscape are necessary.
(7) Assumes the median landscaping is constructed when the additional 5th and 6th lanes are added to the median.
(8) For the 2 to 4 lane expansion, assume that existing street lighting does not exist or must be relocated to a new location
(9) For a mile of urban arterial roadway, 3 signalized intersections are assumed. For 2 to 4 lane expansions, two signals are assumed. When the
4 to 6 lane expansion occurs, the third signal is added.
(10) Covers the cost of removing and disposing of existing improvements (e.g. removing non-standard arterial pavement, curb and gutter in the
wrong location, broken sidewalk etc.)
(11) Assumes road related storm drain improvements are installed at the time the roadway is expanded from 2 to 4 lanes. When the 4 to 6 lane
expansion occurs, work is limited to minor extensions to laterals and inlet adjustments.
Source: Parsons Brinckerhoff, May 31, 2012.
Arterial roadway capacity was established through coordination with the Mid Region Council of Governments (MRCOG). The MRCOG has established 1,000 vehicles per lane per hour (vphpl) for urban principal arterials and 900 vphpl for minor arterials for the Albuquerque Metropolitan Area.6 MRCOG does not take into account the impact of lane width, shoulders, vehicle mix, directional split, land use and other friction factors on roadway/lane capacity at a macro level. The City of
6 Middle Rio Grande Regional Travel Model, Table 73: Akcelik Delay Parameters and Capacity.
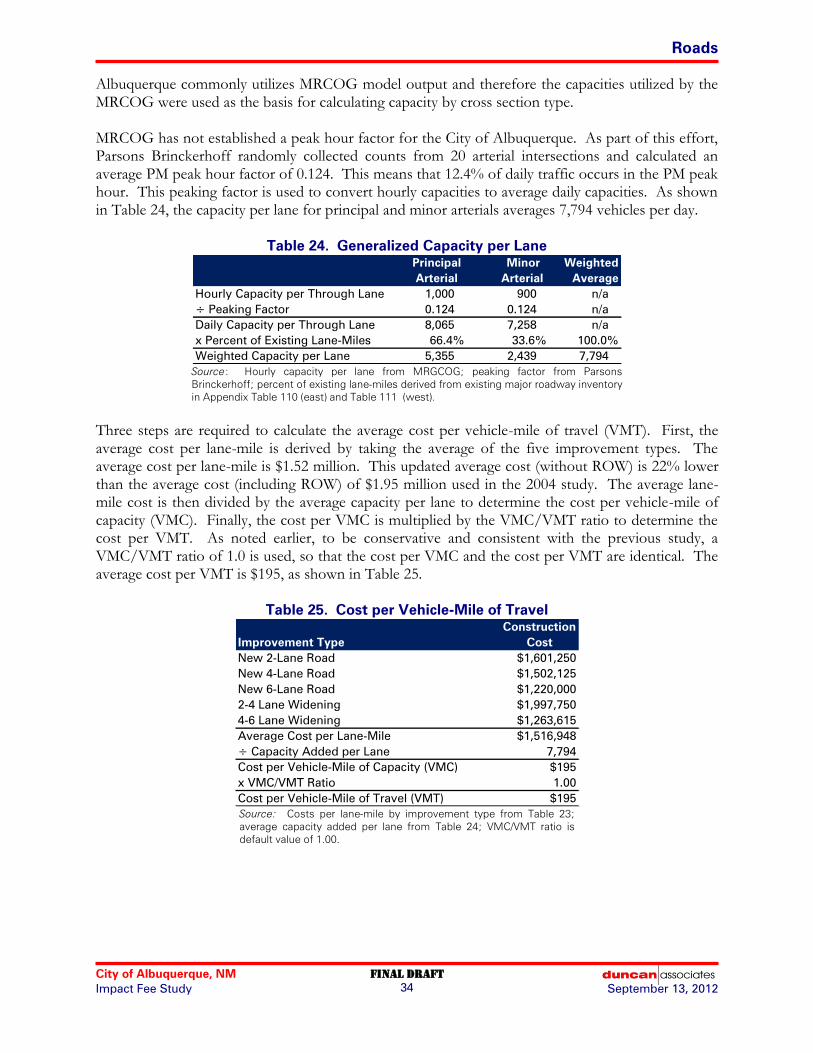
Roads
City of Albuquerque, NM Final draft
Impact Fee Study September 13, 2012 34
Albuquerque commonly utilizes MRCOG model output and therefore the capacities utilized by the MRCOG were used as the basis for calculating capacity by cross section type. MRCOG has not established a peak hour factor for the City of Albuquerque. As part of this effort, Parsons Brinckerhoff randomly collected counts from 20 arterial intersections and calculated an average PM peak hour factor of 0.124. This means that 12.4% of daily traffic occurs in the PM peak hour. This peaking factor is used to convert hourly capacities to average daily capacities. As shown in Table 24, the capacity per lane for principal and minor arterials averages 7,794 vehicles per day.
Table 24. Generalized Capacity per Lane
Principal Minor Weighted
Arterial Arterial Average
Hourly Capacity per Through Lane 1,000 900 n/a
÷ Peaking Factor 0.124 0.124 n/a
Daily Capacity per Through Lane 8,065 7,258 n/a
x Percent of Existing Lane-Miles 66.4% 33.6% 100.0%
Weighted Capacity per Lane 5,355 2,439 7,794 Source: Hourly capacity per lane from MRGCOG; peaking factor from Parsons
Brinckerhoff; percent of existing lane-miles derived from existing major roadway inventory
in Appendix Table 110 (east) and Table 111 (west).
Three steps are required to calculate the average cost per vehicle-mile of travel (VMT). First, the average cost per lane-mile is derived by taking the average of the five improvement types. The average cost per lane-mile is $1.52 million. This updated average cost (without ROW) is 22% lower than the average cost (including ROW) of $1.95 million used in the 2004 study. The average lane-mile cost is then divided by the average capacity per lane to determine the cost per vehicle-mile of capacity (VMC). Finally, the cost per VMC is multiplied by the VMC/VMT ratio to determine the cost per VMT. As noted earlier, to be conservative and consistent with the previous study, a VMC/VMT ratio of 1.0 is used, so that the cost per VMC and the cost per VMT are identical. The average cost per VMT is $195, as shown in Table 25.
Table 25. Cost per Vehicle-Mile of Travel
Construction
Improvement Type Cost
New 2-Lane Road $1,601,250
New 4-Lane Road $1,502,125
New 6-Lane Road $1,220,000
2-4 Lane Widening $1,997,750
4-6 Lane Widening $1,263,615
Average Cost per Lane-Mile $1,516,948
÷ Capacity Added per Lane 7,794
Cost per Vehicle-Mile of Capacity (VMC) $195
x VMC/VMT Ratio 1.00
Cost per Vehicle-Mile of Travel (VMT) $195 Source: Costs per lane-mile by improvement type from Table 23;
average capacity added per lane from Table 24; VMC/VMT ratio is
default value of 1.00.

Roads
City of Albuquerque, NM Final draft
Impact Fee Study September 13, 2012 35
Net Cost per Service Unit
To calculate the net impact of new development, credit needs to be given for revenue generated by new development that will be used to pay for capacity-related capital improvements. For road improvements, several types of revenue will be generated by new development that will be used to fund capacity-expanding road improvements. These include property tax payments used to repay debt used for past road improvements, motor fuel taxes returned to the City in the form of Federal and State highway funding for City arterial road improvements, and Transportation Infrastructure Tax payments used to fund arterial road improvements. The City has an estimated $24 million in outstanding general obligation debt for past arterial road capacity improvements, as detailed in Appendix C. The most straight-forward way to calculate a credit for outstanding road debt is to divide current outstanding debt by existing road impact fee service units (i.e., city-wide VMT). This puts new development on an equal footing with existing development, by assuming that new development will be able to fund the same portion of its share of capacity-expanding capital costs through general obligations bonds as existing development. The result is shown in Table 26.
Table 26. Road Debt Credit
Outstanding Eligible Road Debt $23,920,476
÷ Existing VMT 4,998,067
Road Debt Credit per VMT $5 Source: Outstanding eligible road debt from Table 102 in
Appendix C; existing VMT is city-wide VMT from Table 22.
A credit for motor fuel taxes paid by new development is not warranted, since no Federal or State funds are currently programmed in MRCOG’s adopted Transportation Improvement Program (TIP) to make capacity-expanding improvements to any City-maintained arterial roadways. In October 2009, Albuquerque voters approved an excise tax equal to one-quarter of one percent of gross receipts to be used for transportation infrastructure improvements. While most of the approximately $109 million that is estimated to be generated over the ten-year life of the tax will be devoted to rehabilitation, maintenance or transit improvements, approximately $25.8 million is earmarked for capacity-expanding improvements to City arterial roadways, or an average of about $2.6 million annually. If no growth was factored into these estimates, existing development would be expected to generate about $0.52 per vehicle-mile of travel (VMT) each year. Over the ten-year life of the current authorization, existing development would generate a net present value of $4 per VMT, as shown in Table 27. This is a conservative (i.e. high) estimate, since it does not assume any growth, and new development will be assumed to generate this same amount.
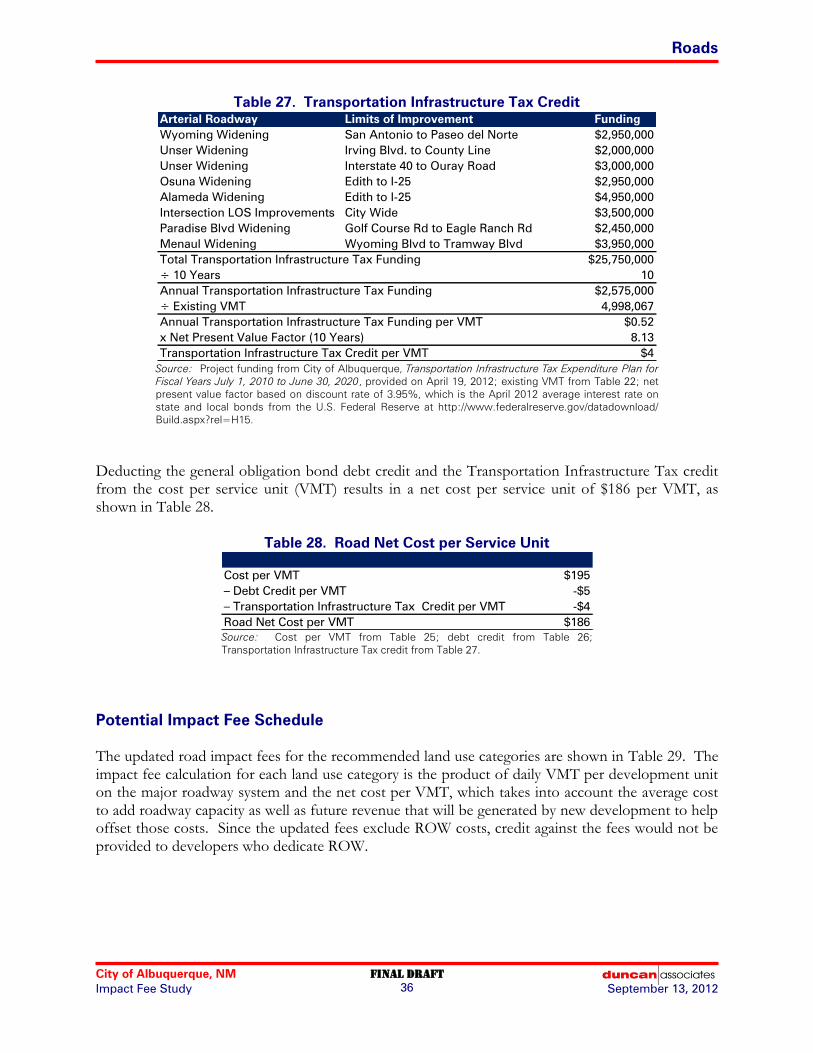
Roads
City of Albuquerque, NM Final draft
Impact Fee Study September 13, 2012 36
Table 27. Transportation Infrastructure Tax Credit
Arterial Roadway Limits of Improvement Funding
Wyoming Widening San Antonio to Paseo del Norte $2,950,000
Unser Widening Irving Blvd. to County Line $2,000,000
Unser Widening Interstate 40 to Ouray Road $3,000,000
Osuna Widening Edith to I-25 $2,950,000
Alameda Widening Edith to I-25 $4,950,000
Intersection LOS Improvements City Wide $3,500,000
Paradise Blvd Widening Golf Course Rd to Eagle Ranch Rd $2,450,000
Menaul Widening Wyoming Blvd to Tramway Blvd $3,950,000
Total Transportation Infrastructure Tax Funding $25,750,000
÷ 10 Years 10
Annual Transportation Infrastructure Tax Funding $2,575,000
÷ Existing VMT 4,998,067
Annual Transportation Infrastructure Tax Funding per VMT $0.52
x Net Present Value Factor (10 Years) 8.13
Transportation Infrastructure Tax Credit per VMT $4 Source: Project funding from City of Albuquerque, Transportation Infrastructure Tax Expenditure Plan for
Fiscal Years July 1, 2010 to June 30, 2020, provided on April 19, 2012; existing VMT from Table 22; net
present value factor based on discount rate of 3.95%, which is the April 2012 average interest rate on
state and local bonds from the U.S. Federal Reserve at http://www.federalreserve.gov/datadownload/
Build.aspx?rel=H15.
Deducting the general obligation bond debt credit and the Transportation Infrastructure Tax credit from the cost per service unit (VMT) results in a net cost per service unit of $186 per VMT, as shown in Table 28.
Table 28. Road Net Cost per Service Unit
Cost per VMT $195
– Debt Credit per VMT -$5
– Transportation Infrastructure Tax Credit per VMT -$4
Road Net Cost per VMT $186 Source: Cost per VMT from Table 25; debt credit from Table 26;
Transportation Infrastructure Tax credit from Table 27.
Potential Impact Fee Schedule
The updated road impact fees for the recommended land use categories are shown in Table 29. The impact fee calculation for each land use category is the product of daily VMT per development unit on the major roadway system and the net cost per VMT, which takes into account the average cost to add roadway capacity as well as future revenue that will be generated by new development to help offset those costs. Since the updated fees exclude ROW costs, credit against the fees would not be provided to developers who dedicate ROW.
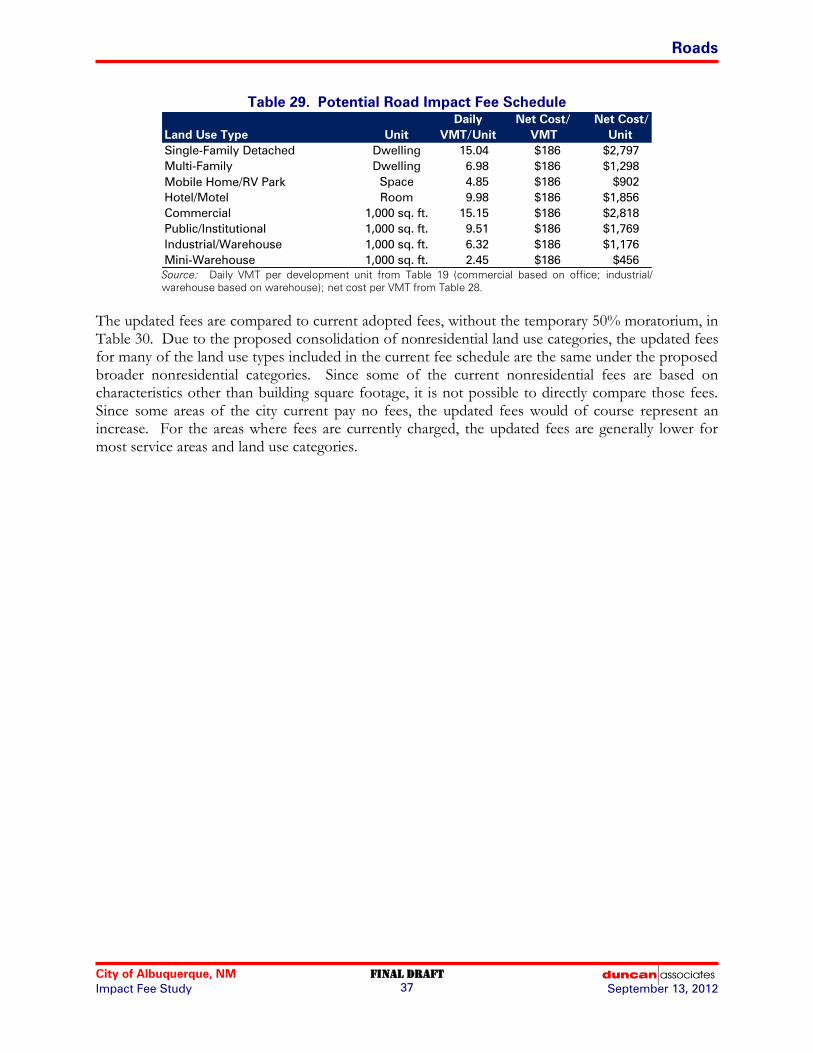
Roads
City of Albuquerque, NM Final draft
Impact Fee Study September 13, 2012 37
Table 29. Potential Road Impact Fee Schedule
Daily Net Cost/ Net Cost/
Land Use Type Unit VMT/Unit VMT Unit
Single-Family Detached Dwelling 15.04 $186 $2,797
Multi-Family Dwelling 6.98 $186 $1,298
Mobile Home/RV Park Space 4.85 $186 $902
Hotel/Motel Room 9.98 $186 $1,856
Commercial 1,000 sq. ft. 15.15 $186 $2,818
Public/Institutional 1,000 sq. ft. 9.51 $186 $1,769
Industrial/Warehouse 1,000 sq. ft. 6.32 $186 $1,176
Mini-Warehouse 1,000 sq. ft. 2.45 $186 $456 Source: Daily VMT per development unit from Table 19 (commercial based on office; industrial/
warehouse based on warehouse); net cost per VMT from Table 28.
The updated fees are compared to current adopted fees, without the temporary 50% moratorium, in Table 30. Due to the proposed consolidation of nonresidential land use categories, the updated fees for many of the land use types included in the current fee schedule are the same under the proposed broader nonresidential categories. Since some of the current nonresidential fees are based on characteristics other than building square footage, it is not possible to directly compare those fees. Since some areas of the city current pay no fees, the updated fees would of course represent an increase. For the areas where fees are currently charged, the updated fees are generally lower for most service areas and land use categories.
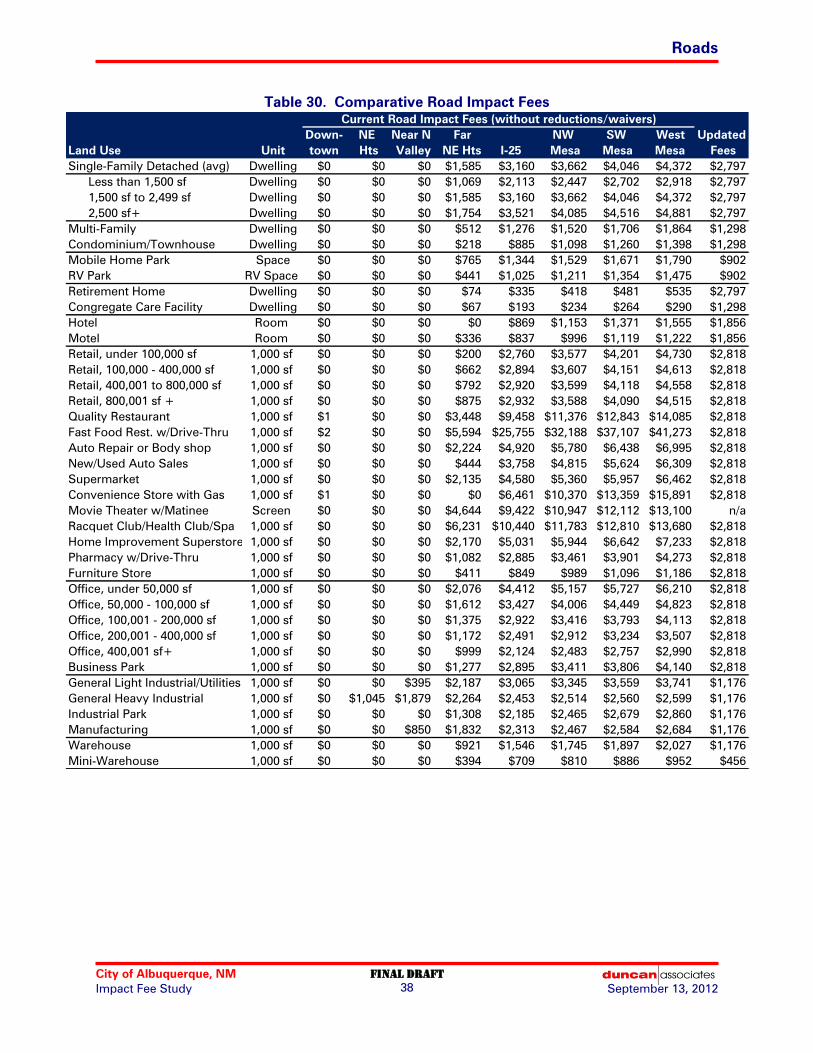
Roads
City of Albuquerque, NM Final draft
Impact Fee Study September 13, 2012 38
Table 30. Comparative Road Impact Fees
Down- NE Near N Far NW SW West Updated
Land Use Unit town Hts Valley NE Hts I-25 Mesa Mesa Mesa Fees
Single-Family Detached (avg) Dwelling $0 $0 $0 $1,585 $3,160 $3,662 $4,046 $4,372 $2,797
Less than 1,500 sf Dwelling $0 $0 $0 $1,069 $2,113 $2,447 $2,702 $2,918 $2,797
1,500 sf to 2,499 sf Dwelling $0 $0 $0 $1,585 $3,160 $3,662 $4,046 $4,372 $2,797
2,500 sf+ Dwelling $0 $0 $0 $1,754 $3,521 $4,085 $4,516 $4,881 $2,797
Multi-Family Dwelling $0 $0 $0 $512 $1,276 $1,520 $1,706 $1,864 $1,298
Condominium/Townhouse Dwelling $0 $0 $0 $218 $885 $1,098 $1,260 $1,398 $1,298
Mobile Home Park Space $0 $0 $0 $765 $1,344 $1,529 $1,671 $1,790 $902
RV Park RV Space $0 $0 $0 $441 $1,025 $1,211 $1,354 $1,475 $902
Retirement Home Dwelling $0 $0 $0 $74 $335 $418 $481 $535 $2,797
Congregate Care Facility Dwelling $0 $0 $0 $67 $193 $234 $264 $290 $1,298
Hotel Room $0 $0 $0 $0 $869 $1,153 $1,371 $1,555 $1,856
Motel Room $0 $0 $0 $336 $837 $996 $1,119 $1,222 $1,856
Retail, under 100,000 sf 1,000 sf $0 $0 $0 $200 $2,760 $3,577 $4,201 $4,730 $2,818
Retail, 100,000 - 400,000 sf 1,000 sf $0 $0 $0 $662 $2,894 $3,607 $4,151 $4,613 $2,818
Retail, 400,001 to 800,000 sf 1,000 sf $0 $0 $0 $792 $2,920 $3,599 $4,118 $4,558 $2,818
Retail, 800,001 sf + 1,000 sf $0 $0 $0 $875 $2,932 $3,588 $4,090 $4,515 $2,818
Quality Restaurant 1,000 sf $1 $0 $0 $3,448 $9,458 $11,376 $12,843 $14,085 $2,818
Fast Food Rest. w/Drive-Thru 1,000 sf $2 $0 $0 $5,594 $25,755 $32,188 $37,107 $41,273 $2,818
Auto Repair or Body shop 1,000 sf $0 $0 $0 $2,224 $4,920 $5,780 $6,438 $6,995 $2,818
New/Used Auto Sales 1,000 sf $0 $0 $0 $444 $3,758 $4,815 $5,624 $6,309 $2,818
Supermarket 1,000 sf $0 $0 $0 $2,135 $4,580 $5,360 $5,957 $6,462 $2,818
Convenience Store with Gas 1,000 sf $1 $0 $0 $0 $6,461 $10,370 $13,359 $15,891 $2,818
Movie Theater w/Matinee Screen $0 $0 $0 $4,644 $9,422 $10,947 $12,112 $13,100 n/a
Racquet Club/Health Club/Spa 1,000 sf $0 $0 $0 $6,231 $10,440 $11,783 $12,810 $13,680 $2,818
Home Improvement Superstore 1,000 sf $0 $0 $0 $2,170 $5,031 $5,944 $6,642 $7,233 $2,818
Pharmacy w/Drive-Thru 1,000 sf $0 $0 $0 $1,082 $2,885 $3,461 $3,901 $4,273 $2,818
Furniture Store 1,000 sf $0 $0 $0 $411 $849 $989 $1,096 $1,186 $2,818
Office, under 50,000 sf 1,000 sf $0 $0 $0 $2,076 $4,412 $5,157 $5,727 $6,210 $2,818
Office, 50,000 - 100,000 sf 1,000 sf $0 $0 $0 $1,612 $3,427 $4,006 $4,449 $4,823 $2,818
Office, 100,001 - 200,000 sf 1,000 sf $0 $0 $0 $1,375 $2,922 $3,416 $3,793 $4,113 $2,818
Office, 200,001 - 400,000 sf 1,000 sf $0 $0 $0 $1,172 $2,491 $2,912 $3,234 $3,507 $2,818
Office, 400,001 sf+ 1,000 sf $0 $0 $0 $999 $2,124 $2,483 $2,757 $2,990 $2,818
Business Park 1,000 sf $0 $0 $0 $1,277 $2,895 $3,411 $3,806 $4,140 $2,818
General Light Industrial/Utilities 1,000 sf $0 $0 $395 $2,187 $3,065 $3,345 $3,559 $3,741 $1,176
General Heavy Industrial 1,000 sf $0 $1,045 $1,879 $2,264 $2,453 $2,514 $2,560 $2,599 $1,176
Industrial Park 1,000 sf $0 $0 $0 $1,308 $2,185 $2,465 $2,679 $2,860 $1,176
Manufacturing 1,000 sf $0 $0 $850 $1,832 $2,313 $2,467 $2,584 $2,684 $1,176
Warehouse 1,000 sf $0 $0 $0 $921 $1,546 $1,745 $1,897 $2,027 $1,176
Mini-Warehouse 1,000 sf $0 $0 $0 $394 $709 $810 $886 $952 $456
Current Road Impact Fees (without reductions/waivers)

Roads
City of Albuquerque, NM Final draft
Impact Fee Study September 13, 2012 39
Table 30. Continued
Down- NE Near N Far NW SW West Updated
Land Use Unit town Hts Valley NE Hts I-25 Mesa Mesa Mesa Fees
Golf Course Hole $0 $0 $0 $3,513 $8,206 $9,703 $10,848 $11,818 n/a
General Recreation (City Park) Acre $0 $0 $0 $162 $374 $442 $493 $537 n/a
Community Center 1,000 sf $0 $0 $0 $2,769 $5,818 $6,791 $7,535 $8,165 $1,769
Hospital 1,000 sf $0 $0 $0 $954 $2,902 $3,523 $3,998 $4,401 $1,769
Nursing Home Bed $0 $0 $0 $200 $358 $409 $447 $480 n/a
Elementary School Student $0 $0 $265 $502 $618 $655 $683 $707 n/a
Middle School Student $0 $0 $252 $630 $814 $873 $919 $957 n/a
High School Student $0 $0 $141 $551 $752 $816 $865 $906 n/a
Junior/Community College Student $0 $0 $0 $146 $329 $387 $432 $470 n/a
University Student $0 $0 $0 $299 $661 $777 $865 $940 n/a
Church 1,000 sf $0 $0 $318 $2,208 $3,134 $3,430 $3,656 $3,848 $1,769
Cemetery Acre $0 $0 $521 $2,324 $3,208 $3,490 $3,706 $3,889 n/a
Current Road Impact Fees (without reductions/waivers)
Source: Current fees from City of Albuquerque website (http://www.cabq.gov/council/impact-fees), without temporary 50% reduction or
jobs/housing balance reductions; updated fees from Table 29.
Capital Plan
The New Mexico Development Fees Act requires the preparation of a description of “capital improvements or facility expansions and their costs necessitated by and attributable to new development in the service area based on the approved land use assumptions.” As noted earlier, the capital plan does not drive the calculation of the fees – instead, the fees are based on the existing level of service. Consequently, the capital plan required by the Act functions as a guide to spending impact fee funds on eligible improvements. A first step in preparing the capital plan is to estimate future impact fee revenues. Assuming that the updated road impact fees are adopted at the full net costs calculated in this study, potential impact fees over the ten-year planning period are estimated to be about $89 million, as shown in Table 31.
Table 31. Potential Road Impact Fee Revenue, 2012-2022
New Fee/ Potential
Land Use Type Unit Units* Unit Revenue
Single-Family Detached Dwelling 13,974 $2,797 $39,085,278
Multi-Family Dwelling 5,947 $1,298 $7,719,206
Commercial 1,000 sf 8,931 $2,818 $25,167,558
Institutional 1,000 sf 5,887 $1,769 $10,414,103
Industrial/Warehouse 1,000 sf 5,498 $1,176 $6,465,648
Total $88,851,793
* excluding Mesa del Sol
Source: New development units from Table 20; fee per unit from Table 29.
The initial ten-year capital plan for the expenditure of anticipated road impact fees is shown in Table 32. Based on the growth projections in the land use assumptions, and assuming adoption of the updated fees at 100% with few reductions or waivers, anticipated impact fee revenues will not cover the total estimated cost of planned improvements. Impact fees are not committed to any particular project, and not all of the projects will necessarily be completed in the ten-year period. This capital plan will be incorporated into the Component Capital Improvements Plan (CCIP), which is part of

Roads
City of Albuquerque, NM Final draft
Impact Fee Study September 13, 2012 40
the City’s Decade Plan. The CCIP will be amended every two years as part of the regular update of the Decade Plan.
Table 32. Road Impact Fee Ten-Year Capital Plan, 2012-2022
Construction Antic. Fee
Project Description Cost Funding
98th Street, Colobell-Blake $3,200,000
Alameda Blvd, I-25 to 2nd St $7,500,000
Irving Blvd Widening, Unser-Rio Los Pinos $4,500,000
McMahon Blvd Widening Universe-Rockcliff $4,200,000
Osuna, NDC to 2nd Street $8,000,000
Paradise Blvd, Unser-Eagle Ranch (w/in city) $2,900,000
Paseo Del Norte Widening (II), Golf Course-Universe $9,300,000
Paseo Del Norte Widening (I), Universe-Ventana W $5,000,000
St Joseph's, Coors-Atrisco $1,300,000
Tower Road, Unser-Coors $600,000
Universe Blvd, Paseo-Unser $5,000,000
Unser Blvd Widening (III), Paseo del Norte-Paradise $6,300,000
Unser Blvd Widening (IV), Rainbow-Paseo del Norte $5,300,000
Westside Blvd Widening, NM 528-City Limits $5,700,000
Irving/Universe Intersection $500,000
Blake/98th Intersection $1,000,000
Paradise Blvd/Golf Course Intersection $300,000
Paradise Blvd/Eagle Ranch Intersection $100,000
Unser and Central Intersections $5,000,000
Unser/Ladera Interchange $10,000,000
Alameda Blvd Widening, San Pedro to Louisiana $2,100,000
Eubank Blvd Widening, Central-Southern $800,000
San Pedro Widening, Alameda to Carmel $3,500,000
University Blvd Widening, Rio Bravo-Mesa del Sol $11,000,000
Wyoming Extension, Elena-Tramway $3,500,000
Academy/Eubank Intersection $300,000
Alameda/Louisiana Intersection $500,000
Carmel/Holly and Barstow Intersection $400,000
Central/Juan Tabo Intersection $3,000,000
Copper/Eubank Intersection $800,000
Eubank/Central Intersection $900,000
Lomas/Louisiana Intersection $300,000
Menaul/Wyoming Intersection $300,000
Montgomery/Eubank Intersection $1,000,000
San Pedro/Constitution Intersection $2,000,000
University/Lomas Intersection $2,000,000
Zuni/Alvarado Intersection $1,200,000
City-Wide Total $119,300,000 $88,851,793 Source: City of Albuquerque Department of Municipal Development, June 20, 2012; potential impact
fee revenue from Table 31.

City of Albuquerque, NM FINAL draft
Impact Fee Study 41 September 13, 2012
PARKS
The City currently charges new residential development a park impact fee. While the park impact fee is technically a single fee with seven service areas, the City maintains separate accounts for parks (multiple service areas), open space (city-wide) and trails (city-wide). This study recommends three separate impact fees – for parks, open space and trails. The park impact fee is the subject of this section.
Service Areas
The City currently has seven park impact fee service areas, which were based on combinations of cash-in-lieu areas that preceded the impact fees (see Figure 12). The consultant’s recommendation is to reduce the number of park impact fee service areas from the current seven to four. The recommended park service areas use I-25 as the east-west boundary (as with the road impact fee service area), I-40 as the north-south boundary to the west and Candelaria Road as the north-south boundary to the east, as illustrated in Figure 12.
Figure 12. Current and Suggested Park Impact Fee Service Areas

Parks
City of Albuquerque, NM Final draft
Impact Fee Study September 13, 2012 42
Methodology
The City has only a few regional park facilities, such as Balloon Fiesta, Civic Plaza and 118th Street Regional Sports Complex. These were not included in the 2004 park impact fee calculation, and will be excluded from the updated park impact fees. Even though community centers are often located in parks, they are also excluded from the park impact fees. The 2004 park impact fee study used a city-wide average of 2.6 acres of developed parkland per 1,000 population as the basis for the park fee calculation in all service areas. While a ratio of acres to population may be a useful level of service (LOS) measure for park planning purposes, it is less appropriate as the basis for impact fee calculation. An acre developed with ball fields represents a much lower capital investment than an acre developed with a swimming pool. The proposed approach is to inventory actual improvements and use current replacement costs to quantify the capital investment in each service area. The existing LOS will be defined in terms of capital investment per service unit. Basing the fees on the existing LOS will avoid creating existing deficiencies and the need to deal with the accompanying complexities. The fees could be based on the existing LOS in each service area, or, if the City desires to have a fee that is uniform across the city, the fees could be based on the existing LOS for the service area that currently has the lowest level of service.
Service Units
A service unit is a unit of measurement that expresses the demand for facilities resulting from different types of development. Park impact fees are typically assessed only on residential development, and generally use population as the indicator of demand for parks. This was the approach used in the City’s 2004 impact fee study. In this update, population is used indirectly as the indicator of demand for parks. The proposed service unit is an Equivalent Dwelling Unit, or EDU. A typical single-family home represents one EDU, while the EDUs for other housing types are based on the average persons per unit relative to a typical single-family unit. The proposed EDU multipliers by housing type are shown in Table 33.
Table 33. Park Service Unit Multipliers by Housing Type
Persons/ EDU
Housing Type Unit Multiplier
Single-Family Detached 2.58 1.00
Multi-Family (all) 1.65 0.64
Multi-Family, 50+ units 1.40 0.54
Mobile Home/RV Park 2.23 0.86 Source: Persons per unit from Table 95; EDU multiplier is the ratio of
the persons per unit for the housing type to the persons per unit for
the average single-family detached unit.
The total number of existing park service units in each service area, and projected new EDUs anticipated over the next ten years, are calculated in Table 34 based on the land use assumptions.
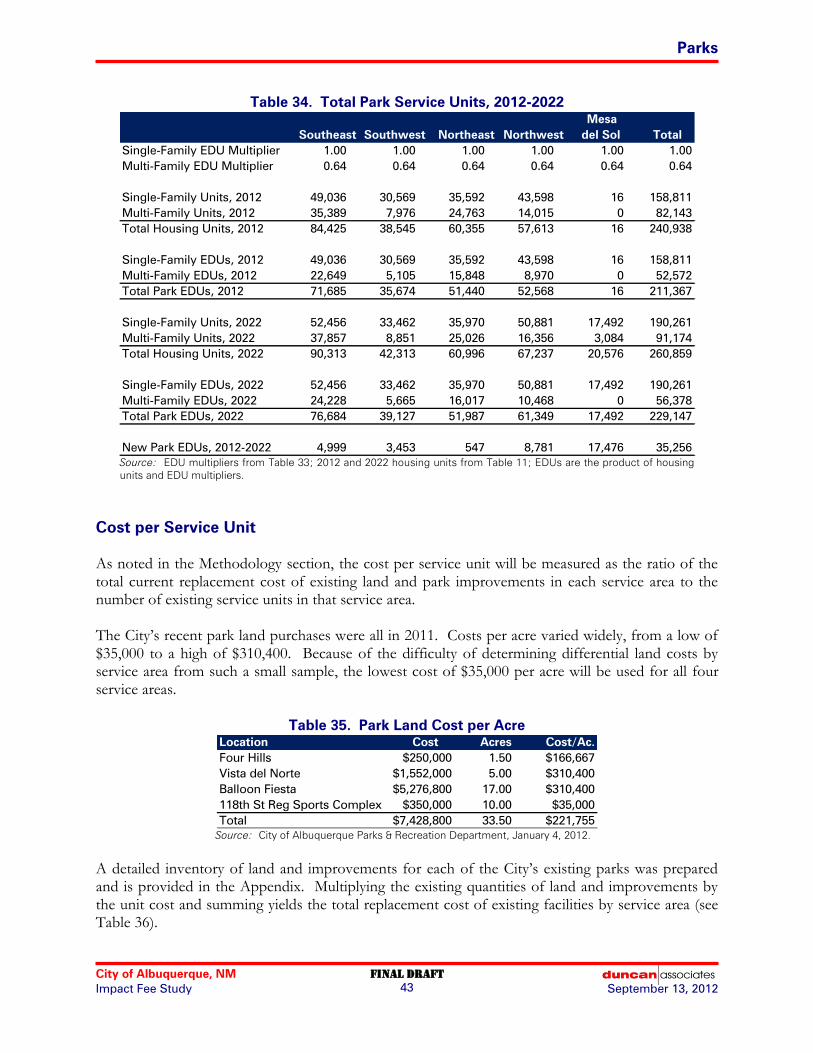
Parks
City of Albuquerque, NM Final draft
Impact Fee Study September 13, 2012 43
Table 34. Total Park Service Units, 2012-2022
Mesa
Southeast Southwest Northeast Northwest del Sol Total
Single-Family EDU Multiplier 1.00 1.00 1.00 1.00 1.00 1.00
Multi-Family EDU Multiplier 0.64 0.64 0.64 0.64 0.64 0.64
Single-Family Units, 2012 49,036 30,569 35,592 43,598 16 158,811
Multi-Family Units, 2012 35,389 7,976 24,763 14,015 0 82,143
Total Housing Units, 2012 84,425 38,545 60,355 57,613 16 240,938
Single-Family EDUs, 2012 49,036 30,569 35,592 43,598 16 158,811
Multi-Family EDUs, 2012 22,649 5,105 15,848 8,970 0 52,572
Total Park EDUs, 2012 71,685 35,674 51,440 52,568 16 211,367
Single-Family Units, 2022 52,456 33,462 35,970 50,881 17,492 190,261
Multi-Family Units, 2022 37,857 8,851 25,026 16,356 3,084 91,174
Total Housing Units, 2022 90,313 42,313 60,996 67,237 20,576 260,859
Single-Family EDUs, 2022 52,456 33,462 35,970 50,881 17,492 190,261
Multi-Family EDUs, 2022 24,228 5,665 16,017 10,468 0 56,378
Total Park EDUs, 2022 76,684 39,127 51,987 61,349 17,492 229,147
New Park EDUs, 2012-2022 4,999 3,453 547 8,781 17,476 35,256 Source: EDU multipliers from Table 33; 2012 and 2022 housing units from Table 11; EDUs are the product of housing
units and EDU multipliers.
Cost per Service Unit
As noted in the Methodology section, the cost per service unit will be measured as the ratio of the total current replacement cost of existing land and park improvements in each service area to the number of existing service units in that service area. The City’s recent park land purchases were all in 2011. Costs per acre varied widely, from a low of $35,000 to a high of $310,400. Because of the difficulty of determining differential land costs by service area from such a small sample, the lowest cost of $35,000 per acre will be used for all four service areas.
Table 35. Park Land Cost per Acre
Location Cost Acres Cost/Ac.
Four Hills $250,000 1.50 $166,667
Vista del Norte $1,552,000 5.00 $310,400
Balloon Fiesta $5,276,800 17.00 $310,400
118th St Reg Sports Complex $350,000 10.00 $35,000
Total $7,428,800 33.50 $221,755 Source: City of Albuquerque Parks & Recreation Department, January 4, 2012.
A detailed inventory of land and improvements for each of the City’s existing parks was prepared and is provided in the Appendix. Multiplying the existing quantities of land and improvements by the unit cost and summing yields the total replacement cost of existing facilities by service area (see Table 36).
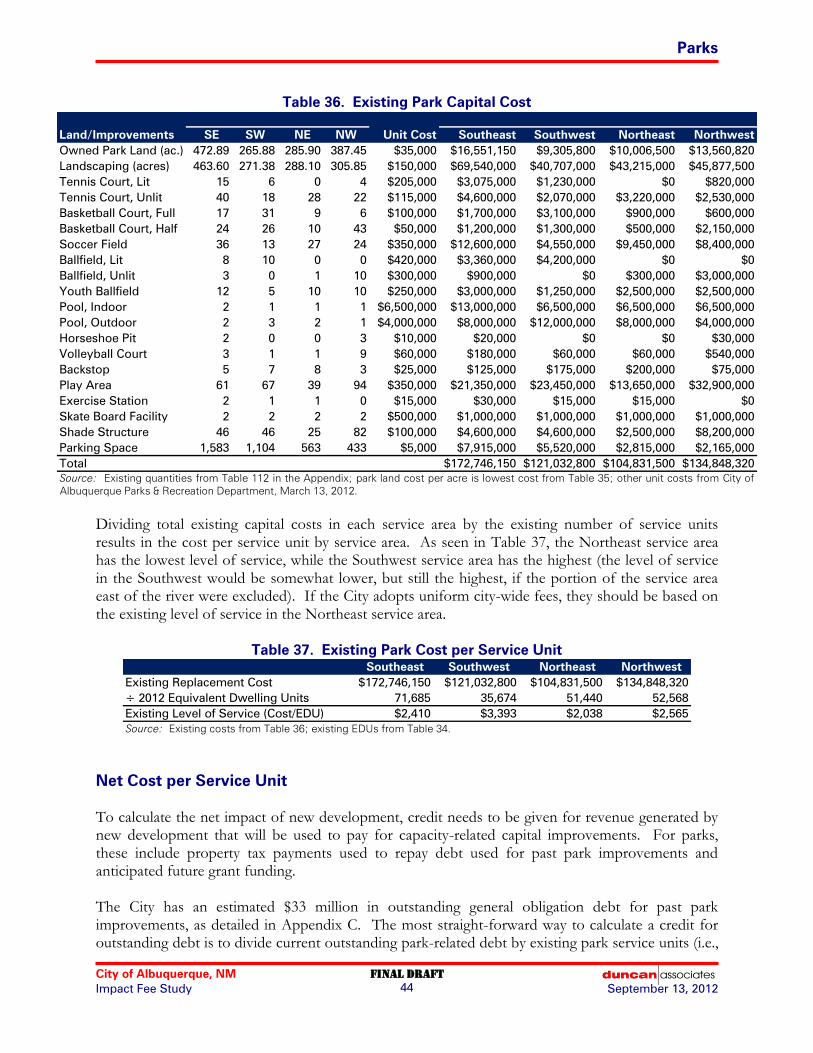
Parks
City of Albuquerque, NM Final draft
Impact Fee Study September 13, 2012 44
Table 36. Existing Park Capital Cost
Land/Improvements SE SW NE NW Unit Cost Southeast Southwest Northeast Northwest
Owned Park Land (ac.) 472.89 265.88 285.90 387.45 $35,000 $16,551,150 $9,305,800 $10,006,500 $13,560,820
Landscaping (acres) 463.60 271.38 288.10 305.85 $150,000 $69,540,000 $40,707,000 $43,215,000 $45,877,500
Tennis Court, Lit 15 6 0 4 $205,000 $3,075,000 $1,230,000 $0 $820,000
Tennis Court, Unlit 40 18 28 22 $115,000 $4,600,000 $2,070,000 $3,220,000 $2,530,000
Basketball Court, Full 17 31 9 6 $100,000 $1,700,000 $3,100,000 $900,000 $600,000
Basketball Court, Half 24 26 10 43 $50,000 $1,200,000 $1,300,000 $500,000 $2,150,000
Soccer Field 36 13 27 24 $350,000 $12,600,000 $4,550,000 $9,450,000 $8,400,000
Ballfield, Lit 8 10 0 0 $420,000 $3,360,000 $4,200,000 $0 $0
Ballfield, Unlit 3 0 1 10 $300,000 $900,000 $0 $300,000 $3,000,000
Youth Ballfield 12 5 10 10 $250,000 $3,000,000 $1,250,000 $2,500,000 $2,500,000
Pool, Indoor 2 1 1 1 $6,500,000 $13,000,000 $6,500,000 $6,500,000 $6,500,000
Pool, Outdoor 2 3 2 1 $4,000,000 $8,000,000 $12,000,000 $8,000,000 $4,000,000
Horseshoe Pit 2 0 0 3 $10,000 $20,000 $0 $0 $30,000
Volleyball Court 3 1 1 9 $60,000 $180,000 $60,000 $60,000 $540,000
Backstop 5 7 8 3 $25,000 $125,000 $175,000 $200,000 $75,000
Play Area 61 67 39 94 $350,000 $21,350,000 $23,450,000 $13,650,000 $32,900,000
Exercise Station 2 1 1 0 $15,000 $30,000 $15,000 $15,000 $0
Skate Board Facility 2 2 2 2 $500,000 $1,000,000 $1,000,000 $1,000,000 $1,000,000
Shade Structure 46 46 25 82 $100,000 $4,600,000 $4,600,000 $2,500,000 $8,200,000
Parking Space 1,583 1,104 563 433 $5,000 $7,915,000 $5,520,000 $2,815,000 $2,165,000
Total $172,746,150 $121,032,800 $104,831,500 $134,848,320
Existing Quantity Land/Improvement Cost
Source: Existing quantities from Table 112 in the Appendix; park land cost per acre is lowest cost from Table 35; other unit costs from City of
Albuquerque Parks & Recreation Department, March 13, 2012.
Dividing total existing capital costs in each service area by the existing number of service units results in the cost per service unit by service area. As seen in Table 37, the Northeast service area has the lowest level of service, while the Southwest service area has the highest (the level of service in the Southwest would be somewhat lower, but still the highest, if the portion of the service area east of the river were excluded). If the City adopts uniform city-wide fees, they should be based on the existing level of service in the Northeast service area.
Table 37. Existing Park Cost per Service Unit
Southeast Southwest Northeast Northwest
Existing Replacement Cost $172,746,150 $121,032,800 $104,831,500 $134,848,320
÷ 2012 Equivalent Dwelling Units 71,685 35,674 51,440 52,568
Existing Level of Service (Cost/EDU) $2,410 $3,393 $2,038 $2,565 Source: Existing costs from Table 36; existing EDUs from Table 34.
Net Cost per Service Unit
To calculate the net impact of new development, credit needs to be given for revenue generated by new development that will be used to pay for capacity-related capital improvements. For parks, these include property tax payments used to repay debt used for past park improvements and anticipated future grant funding. The City has an estimated $33 million in outstanding general obligation debt for past park improvements, as detailed in Appendix C. The most straight-forward way to calculate a credit for outstanding debt is to divide current outstanding park-related debt by existing park service units (i.e.,
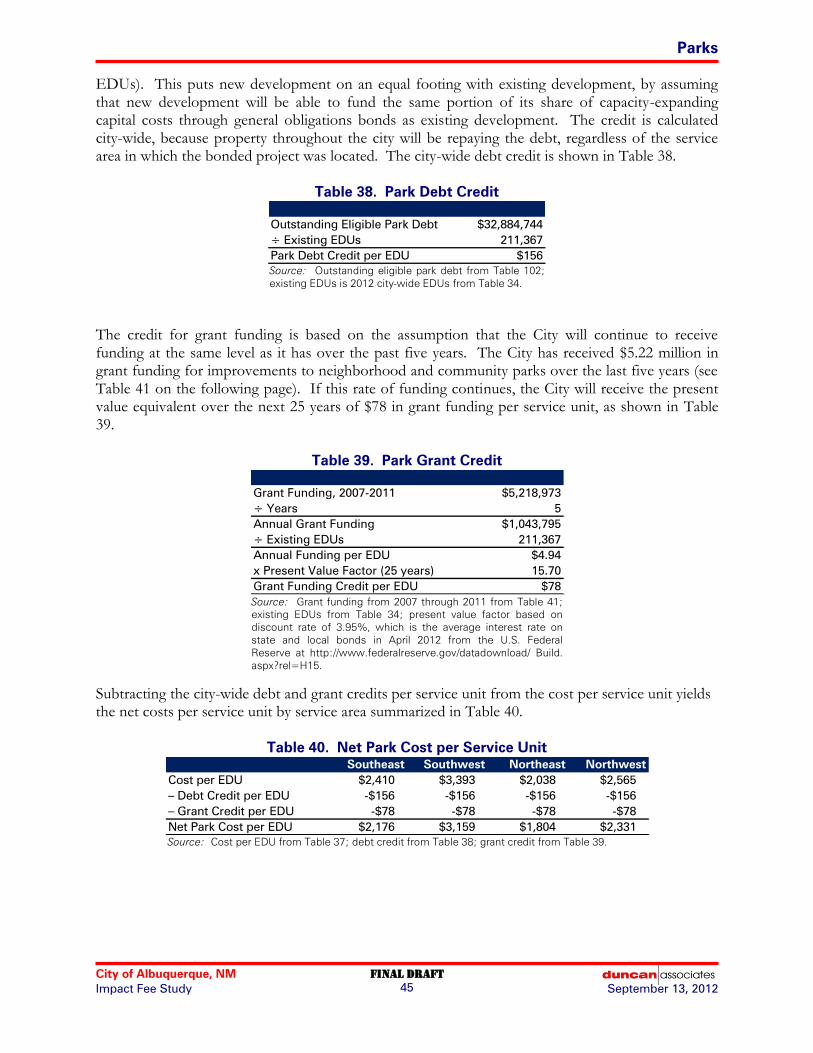
Parks
City of Albuquerque, NM Final draft
Impact Fee Study September 13, 2012 45
EDUs). This puts new development on an equal footing with existing development, by assuming that new development will be able to fund the same portion of its share of capacity-expanding capital costs through general obligations bonds as existing development. The credit is calculated city-wide, because property throughout the city will be repaying the debt, regardless of the service area in which the bonded project was located. The city-wide debt credit is shown in Table 38.
Table 38. Park Debt Credit
Outstanding Eligible Park Debt $32,884,744
÷ Existing EDUs 211,367
Park Debt Credit per EDU $156 Source: Outstanding eligible park debt from Table 102;
existing EDUs is 2012 city-wide EDUs from Table 34.
The credit for grant funding is based on the assumption that the City will continue to receive funding at the same level as it has over the past five years. The City has received $5.22 million in grant funding for improvements to neighborhood and community parks over the last five years (see Table 41 on the following page). If this rate of funding continues, the City will receive the present value equivalent over the next 25 years of $78 in grant funding per service unit, as shown in Table 39.
Table 39. Park Grant Credit
Grant Funding, 2007-2011 $5,218,973
÷ Years 5
Annual Grant Funding $1,043,795
÷ Existing EDUs 211,367
Annual Funding per EDU $4.94
x Present Value Factor (25 years) 15.70
Grant Funding Credit per EDU $78 Source: Grant funding from 2007 through 2011 from Table 41;
existing EDUs from Table 34; present value factor based on
discount rate of 3.95%, which is the average interest rate on
state and local bonds in April 2012 from the U.S. Federal
Reserve at http://www.federalreserve.gov/datadownload/ Build.
aspx?rel=H15.
Subtracting the city-wide debt and grant credits per service unit from the cost per service unit yields the net costs per service unit by service area summarized in Table 40.
Table 40. Net Park Cost per Service Unit
Southeast Southwest Northeast Northwest
Cost per EDU $2,410 $3,393 $2,038 $2,565
– Debt Credit per EDU -$156 -$156 -$156 -$156
– Grant Credit per EDU -$78 -$78 -$78 -$78
Net Park Cost per EDU $2,176 $3,159 $1,804 $2,331 Source: Cost per EDU from Table 37; debt credit from Table 38; grant credit from Table 39.

Parks
City of Albuquerque, NM Final draft
Impact Fee Study September 13, 2012 46
Table 41. Park Grants, 2007-2011
Grant Purpose Year Amount
Alameda Little League Park 2007 $256,140
Alameda Little League Park 2009 $67,519
Albuquerque Southwest Velodrome 2007 $50,000
Arroyo Del Oso Tennis 2007 $75,000
Burton Park Playground 2007 $120,000
Casa Verde Comm Park 2007 $3,776
Dog Park Eubnk San Antonio 2007 $10,000
Eastdale Little League Field Improvements 2007 $142,328
Garfield Park 2008 $4,155
Grecian Park Improvement 2007 $32,736
Highland Pool Renovation 2007 $14,518
Jade Park Equipment 2007 $46,380
Jade Park Equipment 2008 $9,807
Jerry Kline Park 2007 $220,279
Korean Veteran Memorial 2007 $34,285
Lassetter Park Equipment 2007 $87,877
Laurelwood Linear Pk 2007 $120,000
Martineztown Santa Barbara Park 2008 $19,967
Martineztown Santa Barbara Park 2007 $227,383
Mesa Verde Park Light 2007 $20,000
Mile High Baseball Complex 2007 $14,112
N Domingo Baca 2008 $611,827
Novella Park Playground 2007 $166,866
Off Leash Dog Parks 2007 $22,482
Pat Hurley Park 2007 $275,000
Petroglyph Little League 2007 $107,196
Rancho Encantada Park 2008 $11,052
Roadrunner Little League 2007 $546,789
Roadrunner Little League 2008 $225,000
Robinson Park 2008 $37,741
Sandia Vista Park 2007 $7,904
Snow Heights Park 2007 $304,400
Sunduro South Park 2008 $25,000
Sunport Pool Circulation Building 2007 $39,851
Supper Rock Park 2007 $46,902
Swml Wls Prk 2007 $3,780
Thunderbird Little League Fields 2007 $52,648
Tom Bolack Park 2007 $4,090
Tower Community Park 2007 $200,000
Tower Westgate Little League 2007 $195,011
USS Bullhead Park 2007 $45,577
Valley Pool 2007 $99,646
Ventana Ranch Park 2007 $170,000
Ventana Ranch Park 2008 $25,000
West Mesa Little League 2007 $219,381
West Side Soccer Field 2007 $84,568
Workers Park Equipment 2007 $75,000
Zia Little League 2007 $40,000
Total Park Grants, 2007-2011 $5,218,973 Source: City of Albuquerque Parks & Recreation Department, March 23, 2012.

Parks
City of Albuquerque, NM Final draft
Impact Fee Study September 13, 2012 47
Potential Impact Fee Schedule
The City has the option to adopt differential fees by service area to reflect the existing levels of service in the four quadrants of the city. However, the consultant’s suggestion is to adopt a uniform fee for all four service areas, based on the lowest level of service, which is in the Northeast service area. Based on that recommendation, the potential park impact fees by housing type are calculated by multiplying the EDUs per unit by the net cost per EDU in the Northeast service area, as shown in Table 42.
Table 42. Potential Park Impact Fee Schedule
EDUs Net Cost Net Cost
Housing Type Unit per Unit per EDU per Unit
Single-Family Detached Dwelling 1.00 $1,804 $1,804
Multi-Family Dwelling 0.54 $1,804 $974
Mobile Home/RV Park Space 0.86 $1,804 $1,551 Source: EDUs per unit from Table 33 (multi-family based on apartment complexes with 50 or more
units); net cost per EDU is for the Northeast service area from Table 40.
Comparing the updated fees calculated above to current park impact fees is difficult because the current fees are assessed per 1,000 square feet regardless of housing type, whereas the updated fees are assessed per dwelling unit and vary by housing type. The table below compares the updated fee for a typical single-family unit to the current fee for a 2,052 square foot residential unit (the average size of a single-family unit in the western US). The updated fee for a typical single-family unit is in the mid-range of current fees by service area.
Table 43. Comparative Park Impact Fees per Single-Family Unit
Current New Current Updated Percent
Service Area Service Area Fee Fee Change
Central/University SW and SE $0 $1,804 n/a
Foothills Southeast $308 $1,804 486%
NW Mesa Northwest $1,538 $1,804 17%
Acadamy/NE SE and NE $1,684 $1,804 7%
N Albuquerque SE and NE $2,151 $1,804 -16%
SW Mesa Southwest $2,228 $1,804 -19%
N Valley/I-25 Northwest $2,414 $1,804 -25% Source: Current fees for a 2,052 square foot unit (average size of a single-family unit
in the western region from the 2009 American Housing Survey) and the parks portion
of the parks, trails and open space fee from the 2004 study, without temporary 50%
reduction; updated fee for average single-family unit from Table 42.
Capital Plan
The New Mexico Development Fees Act requires the preparation of a description of “capital improvements or facility expansions and their costs necessitated by and attributable to new development in the service area based on the approved land use assumptions.” As noted earlier, the capital plan does not drive the calculation of the fees – instead, the fees are based on the existing level of service. Consequently, the capital plan required by the Act functions as a guide to spending impact fee funds on eligible improvements. A first step in preparing the capital plan is to estimate future impact fee revenues. Assuming that the updated park impact fees are adopted at the full net costs calculated in this study, potential impact fees over the ten-year planning period are estimated

Parks
City of Albuquerque, NM Final draft
Impact Fee Study September 13, 2012 48
to range from a low of about $0.9 million in the Northeast service area to a high of $15.4 million in the Northwest service area, as shown in Table 44.
Table 44. Potential Park Impact Fee Revenue, 2012-2022
Southeast Southwest Northeast Northwest City-Wide
New Single-Family Units 3,420 2,893 378 7,283 13,974
New Multi-Family Units 2,468 875 263 2,341 5,947
Fee per Single-Family Unit $1,804 $1,804 $1,804 $1,804 $1,804
Fee per Multi-Family Unit $974 $974 $974 $974 $974
Potential Revenue $8,573,512 $6,071,222 $938,074 $15,418,666 $31,001,474 Source: New units from Table 34; potential fee per unit from Table 42.
The initial ten-year capital plan for the expenditure of park impact fees is shown in Table 45 on the following page. Based on the growth projections in the land use assumptions, and assuming adoption of the updated fees at 100% with few reductions or waivers, anticipated impact fee revenues will not cover all of the total estimated cost of planned improvements in any of the four service areas. Impact fees are not committed to any particular project, and not all of the projects will necessarily be completed in the ten-year period. This capital plan will be incorporated into the Component Capital Improvements Plan (CCIP), which is part of the City’s Decade Plan. The CCIP will be amended every two years as part of the regular update of the Decade Plan.

Parks
City of Albuquerque, NM Final draft
Impact Fee Study September 13, 2012 49
Table 45. Park Impact Fee Ten-Year Capital Plan, 2012-2022
Total Antic. Fee
Description Cost Funding
Four Hills Park $525,000
Los Altos Swimming Pool Expansion $3,000,000
Manzano Mesa Park $1,020,000
New Day Park $500,000
Phil Chacon Park $500,000
Sunport Park $250,000
Korean War Veterans Park $500,000
Land Acquisition $500,000
New Park Development $3,000,000
Balduini Park $400,000
Crestview Heights Park $700,000
Veloport/BMX facility $250,000
Total, Southeast Service Area $11,145,000 $8,573,512
North Domingo Baca Park $2,500,000
Lafayette Park $175,000
Arroyo del Oso Park $1,000,000
Comanche North Park $1,000,000
San Antonio Corridor Park $500,000
Tanoan Corridor Park $700,000
Land Acquisition $200,000
Total, Northeast Service Area $6,075,000 $938,074
Silver Tree Park $1,400,000
El Rancho Grande Park $875,000
El Rancho Grande Unit 17 Park $2,500,000
Anderson Heights Park $700,000
Sunrise Terrace Park $861,000
Tower Pond Park $500,000
Westgate Community Park $1,000,000
Land Acquisition $500,000
New Park Development $1,000,000
Total, Southwest Service Area $9,336,000 $6,071,222
Ridgeview Village $700,000
Andalucia Park $850,000
Shawn McWethy Park $1,800,000
Creighton Park $2,300,000
Piedras Marcadas Dam Park $350,000
Vista Allegre Park $3,000,000
Ventana Ranch Community Park $1,000,000
Vista del Norte Park $5,000,000
Land Acquisition $1,000,000
New Park Development $2,000,000
Country Meadows Park $1,500,000
Ouray Off Leash Dog Area/Ladera Pond $800,000
Paradise Skies Park $1,000,000
Tuscany Park $1,000,000
Tres Placitas Park $600,000
East Atrisco Park $900,000
Total, Northwest Service Area $23,800,000 $15,418,666 Source: City of Albuquerque Parks & Recreation Department, June 19, 2012; potential
impact fee revenue from Table 44.

City of Albuquerque, NM FINAL draft
Impact Fee Study 50 September 13, 2012
OPEN SPACE
The City currently charges impact fees for open space. Technically, the open space fee is a component of the park impact fee. However, the City deposits the portion of the fees attributable to open space into a separate city-wide account that can be spent anywhere in the city. Effectively, the City has a separate city-wide open space impact fee. This section updates the calculation of the open space fee.
Service Areas
The consultant’s recommendation is to have a city-wide open space impact fee. Open space provides a regional benefit.
Methodology
The proposed methodology for the open space impact fee is the same as for the park impact fee. The fees will be based on the existing level of service, measured in terms of the replacement value of existing land and facilities per service unit.
Service Units
A service unit is a unit of measurement that expresses the demand for facilities resulting from different types of development. As with park impact fees, open space impact fees are typically assessed only on residential development, and generally use population as the indicator of demand. The proposed service unit is same as for the park impact fee – an Equivalent Dwelling Unit, or EDU. A typical single-family home would be one EDU, while the EDUs for other housing types are based on the average persons per unit relative to a typical single-family unit. The proposed EDU multipliers by housing type are the same as for the park impact fee (see Table 33 in the parks section).
Cost per Service Unit
There are two major cost components of the open space system: open space land and open space improvements. Existing City-owned open space land is listed in Table 46. The City currently owns 24,849 acres of open space.

Open Space
City of Albuquerque, NM Final draft
Impact Fee Study September 13, 2012 51
Table 46. Existing Open Space Land Inventory
Property Name Acquired Acres
Golden Park 1963 1,180.30
Gutierrez (Nature Center) 1963 300.60
Four Hills Park 1963 40.00
Carolino Canyon 1963 27.50
Shooting Range 1964-1968 4,596.00
Montesa Park 1965 577.40
Placitas 1966 560.00
La Boca Negra Park 1967 1,527.60
San Antonito 1968 168.50
Sandia Foothills 1973 490.10
Indian Petroglyph State Park 1973 75.30
Glenwood Hills 1974 70.00
Volcanoes 1976 1,320.00
Marsh Peninsula 1977 230.00
Sandia Foothills 1977 120.00
Candelaria Farms 1977 176.00
Embudo Dam 1978 49.00
Volcano Park 1978 2,120.00
Bear Canyon 1978 79.50
Glenwood Hills 1978 74.80
Volcano Park 1978 760.00
Manzano-Four Hills 1979 146.00
West Mesa O.S. 1979 3,247.50
Rinconada Canyon (Katherine Nicole) 1980 36.50
Sandia Foothills 1981 39.00
Volcano Cliffs Park 1981 61.40
Rebonito 1982 139.90
Simms Park/Elena Gallegos 1983 640.00
Piedras Marcadas 1986 28.70
Piedras Marcadas Pueblo 1988 13.80
Rounds Estate 1988 324.00
Piedras Marcadas 1988 106.90
Grevey, Torres 1989 66.00
Piedras Marcadas 1989 87.50
Piedras Marcadas 1990 73.70
Los Metates 1991 16.00
Bear Canyon 1991 35.00
Piedras Marcadas 1991 81.40
Boca Negra Canyon 1991-2003 138.00
Piedras Marcadas 1992 32.80
High Desert 1993 29.40
Piedras Marcadas 1993 87.60
Rio Grande/Alameda 1994 8.50
Sedillo/Juan Tomas 1994 1,295.00
Piedras Marcadas 1994 49.70
Roberson Ranch 1994 23.50

Open Space
City of Albuquerque, NM Final draft
Impact Fee Study September 13, 2012 52
Table 46. Continued
Property Name Acquired Acres
Piedras Marcadas 1995-1996 10.80
Mann Tract 1996 9.00
Montano Bridge Mitigation 1996 18.00
Alamo Farm (Blanchard Property) 1996-1998 20.00
Poblanos Field (Anderson Fields) 1997 138.00
Carolino Canyon 1997 2.50
Manzano/Four Hills 1998 120.00
Tres Pistolas 1998 106.00
Calabacillas Arroyo 1998 40.00
Calabacillas Arroyo 1998 70.00
Roberson Residence 1999 3.00
Hubbell Oxbow 1999 87.00
Piedras Marcadas 1999 20.00
San Antonio Oxbow 1999 9.90
San Antonio Oxbow 1999 49.00
Atrisco Terrace 2001 675.00
Pueblo Site Buffer 2002 6.50
Paseo del Volcan (Monument buffer) 2002 525.00
Black Ranch 2002 200.00
Pueblo Montano Parking 2002-2003 2.20
Pueblo Site Buffer 2003 4.00
Tijeras Canyon (State Land) 2004 327.00
Montano SW Bosque (Graham Property) 2004 126.00
Tijeras Arroyo 2004 90.00
Tijeras Arroyo 2004 26.90
Montano NW Bosque (Taylor/Christian Children’s) 2005 125.60
Calabacillas Arroyo 2005 15.00
Tijeras Arroyo/Juan Tabo 2006 36.00
North Geologic Window 2006 40.00
Unser/Ouray 2006 9.80
HawkWatch 2006 67.00
Milne/Gutierrez 2008 420.00
Bosquecito 2009 6.80
La Cuentista 2009 26.90
Tijeras Canyon/Route 66 2010 65.90
Total 24,849.20 Source: City of Albuquerque Parks & Recreation Department, March 23, 2012.
The City has acquired a number of open space properties over the last six years. The cost has averaged $22,682 per acre (see Table 47). The 2004 study used an average cost of $12,200 per acre. To be conservative, the same land cost of $12,200 used in the 2004 study will also be used in this update.

Open Space
City of Albuquerque, NM Final draft
Impact Fee Study September 13, 2012 53
Table 47. Open Space Land Cost per Acre
Property Date Cost Acres Cost/Acre
North Geologic Window 8/1/2006 $1,760,000 40.00 $44,000
HawkWatch 12/1/2006 $750,000 67.00 $11,194
Milne/Gutierrez 4/1/2008 $2,200,000 420.00 $5,238
Bosquecito 5/1/2009 $2,300,000 6.80 $338,235
La Cuentista 9/1/2009 $3,900,000 26.90 $144,981
Tijeras Canyon/Route 66 12/1/2010 $2,900,000 65.90 $44,006
Volcano Cliffs lots 12/1/2011 $851,400 19.80 $43,000
Total $14,661,400 646.40 $22,682
Assumed $12,200 Source: City of Albuquerque Parks & Recreation Department, March 26, 2012.
Using a land cost of $12,200 per acre, the replacement cost of existing City-owned open space is approximately $303 million, as shown in Table 48. However, the 2004 study reduced the open space cost by about one-third, “because projected open space fee receipts would generate more revenue than the expected cost of proposed improvements.” While the reason for this adjustment is not completely clear, the same reduction factor will be applied to be consistent with the previous study. The result is a utilized replacement cost of about $200 million.
Table 48. Existing Open Space Land Cost
Open Space Acres 24,849.20
x Cost per Acre $12,200
Open Space Land Cost $303,160,240
x Assumed Utilization Factor 0.66
Utilized Open Space Land Cost $200,085,758 Source: Open space acres from Table 46; cost per acre
from Table 47; utilization factor from James C. Nicholas and
Arthur C. Nelson, Park, Recreation, Trail and Open Space
Costs of Accommodating New Development and
Recommended Park, Recreation, Trails and Open Space
Development Impact Fees, November 2004.
In addition to land costs, there are also costs of open space improvements and facilities, including visitor centers and maintenance facilities. The estimated replacement costs of these facilities totals about $5.8 million, as shown in Table 49.
Table 49. Existing Open Space Facility Cost
Facility Address Sq. Ft. Cost/Sq. Ft. Cost
Open Space Visitor Center 6500 Coors Blvd NW 7,845 $200 $1,569,000
Elena Gallegos OS Visitor Station 7100 Tramway Blvd NE 1,200 $200 $240,000
Montessa Park OS Maintenance/Whse 3615 Los Picaros Rd SE 12,000 $125 $1,500,000
Montessa Park OS Administrative Office 3615 Los Picaros Rd SE 9,000 $200 $1,800,000
Montessa Park OS Maintenance Office 3615 Los Picaros Rd SE 3,500 $200 $700,000
Total 33,545 $5,809,000 Source: Building square feet from City of Albuquerque Energy Star Building List, December 21, 2011; costs per square
foot from City of Albuquerque Parks & Recreation Department, February 27, 2012.
The cost per service unit is computed by adding the cost of existing open space land and facilities, and dividing the total cost by the number of existing service units. The result is a cost of $974 per equivalent dwelling unit, as shown in Table 50.

Open Space
City of Albuquerque, NM Final draft
Impact Fee Study September 13, 2012 54
Table 50. Existing Open Space Cost per Service Unit
Open Space Land $200,085,758
Open Space Facilities $5,809,000
Total, Open Space Cost $205,894,758
÷ Existing Equivalent Dwelling Units (EDUs) 211,367
Cost per EDU $974 Source: Open space land cost from Table 48; open space facility cost from Table
49; existing 2012 EDUs from Table 34.
Net Cost per Service Unit
To calculate the net impact of new development, credit needs to be given for revenue generated by new development that will be used to pay for capacity-related capital improvements. For open space, these include property tax payments used to repay debt used for past open space land and improvements and anticipated future grant funding. The most straight-forward way to calculate a credit for outstanding debt is to divide current outstanding debt by existing service units (i.e., EDUs). This puts new development on an equal footing with existing development, by assuming that new development will be able to fund the same portion of its share of capacity-expanding capital costs through general obligations bonds as existing development. The credit is calculated city-wide, because property throughout the city will be repaying the debt, regardless of the service area in which the bonded project was located. The city-wide debt credit is shown in Table 51.
Table 51. Open Space Debt Credit
Outstanding Eligible Open Space Debt $7,015,389
÷ Existing EDUs 211,367
Open Space Debt Credit per EDU $33 Source: Outstanding eligible open space debt from Table 102; existing
EDUs is city-wide EDUs from Table 34.
The credit for grant funding is based on the assumption that the City will continue to receive funding at the same level as it has over the past five years. The City has received $2.9 million in grant funding for open space land acquisition and improvements over the last five years (see Table 52 on the following page).
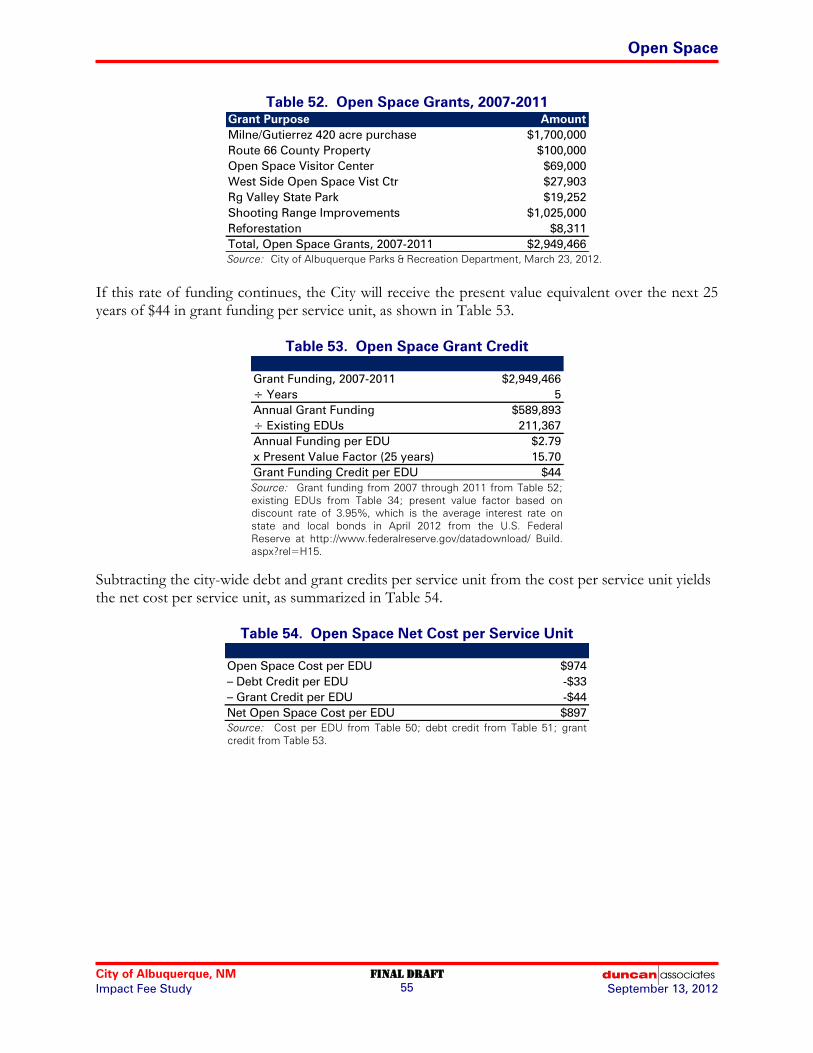
Open Space
City of Albuquerque, NM Final draft
Impact Fee Study September 13, 2012 55
Table 52. Open Space Grants, 2007-2011
Grant Purpose Amount
Milne/Gutierrez 420 acre purchase $1,700,000
Route 66 County Property $100,000
Open Space Visitor Center $69,000
West Side Open Space Vist Ctr $27,903
Rg Valley State Park $19,252
Shooting Range Improvements $1,025,000
Reforestation $8,311
Total, Open Space Grants, 2007-2011 $2,949,466 Source: City of Albuquerque Parks & Recreation Department, March 23, 2012.
If this rate of funding continues, the City will receive the present value equivalent over the next 25 years of $44 in grant funding per service unit, as shown in Table 53.
Table 53. Open Space Grant Credit
Grant Funding, 2007-2011 $2,949,466
÷ Years 5
Annual Grant Funding $589,893
÷ Existing EDUs 211,367
Annual Funding per EDU $2.79
x Present Value Factor (25 years) 15.70
Grant Funding Credit per EDU $44 Source: Grant funding from 2007 through 2011 from Table 52;
existing EDUs from Table 34; present value factor based on
discount rate of 3.95%, which is the average interest rate on
state and local bonds in April 2012 from the U.S. Federal
Reserve at http://www.federalreserve.gov/datadownload/ Build.
aspx?rel=H15.
Subtracting the city-wide debt and grant credits per service unit from the cost per service unit yields the net cost per service unit, as summarized in Table 54.
Table 54. Open Space Net Cost per Service Unit
Open Space Cost per EDU $974
– Debt Credit per EDU -$33
– Grant Credit per EDU -$44
Net Open Space Cost per EDU $897 Source: Cost per EDU from Table 50; debt credit from Table 51; grant
credit from Table 53.
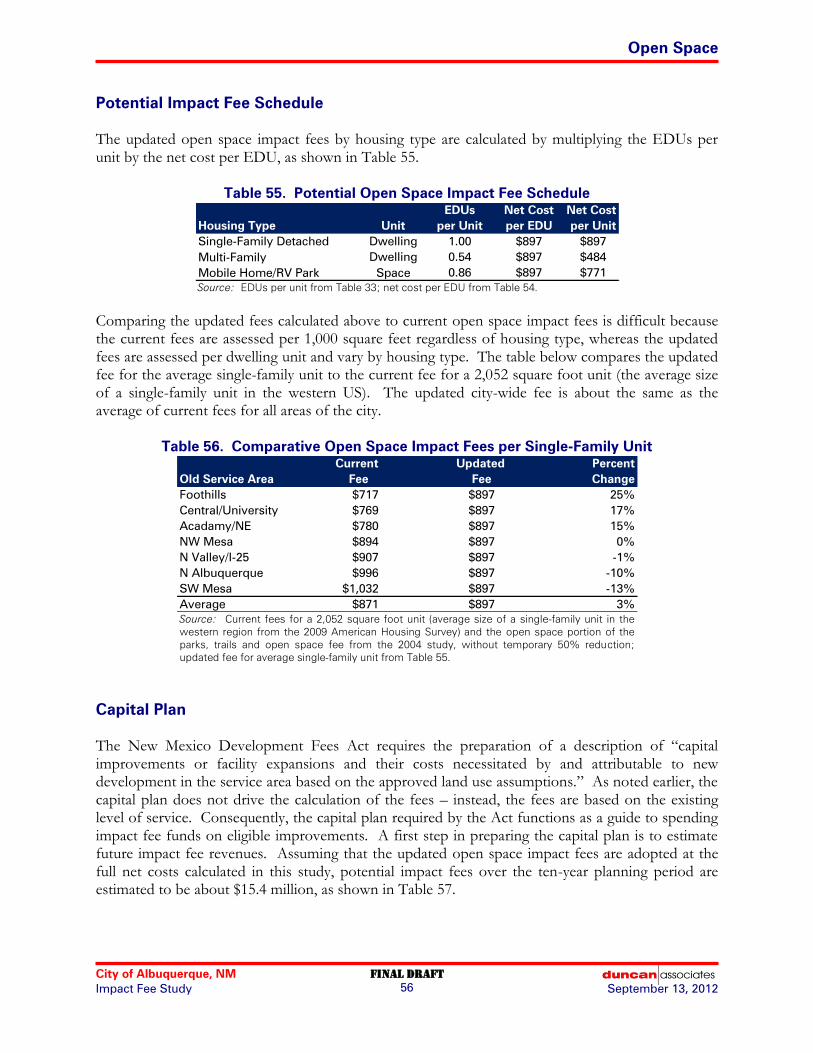
Open Space
City of Albuquerque, NM Final draft
Impact Fee Study September 13, 2012 56
Potential Impact Fee Schedule
The updated open space impact fees by housing type are calculated by multiplying the EDUs per unit by the net cost per EDU, as shown in Table 55.
Table 55. Potential Open Space Impact Fee Schedule
EDUs Net Cost Net Cost
Housing Type Unit per Unit per EDU per Unit
Single-Family Detached Dwelling 1.00 $897 $897
Multi-Family Dwelling 0.54 $897 $484
Mobile Home/RV Park Space 0.86 $897 $771 Source: EDUs per unit from Table 33; net cost per EDU from Table 54.
Comparing the updated fees calculated above to current open space impact fees is difficult because the current fees are assessed per 1,000 square feet regardless of housing type, whereas the updated fees are assessed per dwelling unit and vary by housing type. The table below compares the updated fee for the average single-family unit to the current fee for a 2,052 square foot unit (the average size of a single-family unit in the western US). The updated city-wide fee is about the same as the average of current fees for all areas of the city.
Table 56. Comparative Open Space Impact Fees per Single-Family Unit
Current Updated Percent
Old Service Area Fee Fee Change
Foothills $717 $897 25%
Central/University $769 $897 17%
Acadamy/NE $780 $897 15%
NW Mesa $894 $897 0%
N Valley/I-25 $907 $897 -1%
N Albuquerque $996 $897 -10%
SW Mesa $1,032 $897 -13%
Average $871 $897 3% Source: Current fees for a 2,052 square foot unit (average size of a single-family unit in the
western region from the 2009 American Housing Survey) and the open space portion of the
parks, trails and open space fee from the 2004 study, without temporary 50% reduction;
updated fee for average single-family unit from Table 55.
Capital Plan
The New Mexico Development Fees Act requires the preparation of a description of “capital improvements or facility expansions and their costs necessitated by and attributable to new development in the service area based on the approved land use assumptions.” As noted earlier, the capital plan does not drive the calculation of the fees – instead, the fees are based on the existing level of service. Consequently, the capital plan required by the Act functions as a guide to spending impact fee funds on eligible improvements. A first step in preparing the capital plan is to estimate future impact fee revenues. Assuming that the updated open space impact fees are adopted at the full net costs calculated in this study, potential impact fees over the ten-year planning period are estimated to be about $15.4 million, as shown in Table 57.

Open Space
City of Albuquerque, NM Final draft
Impact Fee Study September 13, 2012 57
Table 57. Potential Open Space Impact Fee Revenue, 2012-2022
New Single-Family Units 13,974
New Multi-Family Units 5,947
Fee per Single-Family Unit $897
Fee per Multi-Family Unit $484
Potential Revenue $15,413,026 Source: New units from Table 34 (excluding Mesa del Sol);
potential fee per unit from Table 55.
The initial ten-year capital plan for the expenditure of open space impact fees is shown in Table 58. Based on the growth projections in the land use assumptions, and assuming adoption of the updated fees at 100% with few reductions or waivers, anticipated impact fee revenues will cover about 20% of the estimated cost of planned land acquisition and improvements. Impact fees are not committed to any particular project, and not all of the projects will necessarily be completed in the ten-year period. This capital plan will be incorporated into the Component Capital Improvements Plan (CCIP), which is part of the City’s Decade Plan. The CCIP will be amended every two years as part of the regular update of the Decade Plan.

Open Space
City of Albuquerque, NM Final draft
Impact Fee Study September 13, 2012 58
Table 58. Open Space Impact Fee Ten-Year Capital Plan, 2012-2022
Total Antic. Fee
Description Cost Funding
Land: Calabacillas Arroyo $1,500,000
Land: North Geologic Window $3,500,000
Land: Northern Sand Dunes $2,000,000
Land: North Rio Puerco Escarpment $23,000,000
Land: Volcano Cliffs/Volcano Heights Master Plan $3,750,000
Land: Cerro Colorado Volcano $2,250,000
Land: Southwest Mesa / "Ceja" $17,500,000
Land: South Rio Puerco Escarpment $5,850,000
Land: Southern Sand Dunes $1,350,000
Land: Tijeras Arroyo $3,750,000
Land: Tijeras Canyon $1,250,000
Fencing/Protection/Access Control $1,500,000
Atrisco Terrace Trails & Parking $250,000
Calabacillas Arroyo Facilities $200,000
Candelaria Farm $200,000
Equestrian Complex $250,000
Maloof Airfield $250,000
Northern Sand Dunes Trails & Parking $350,000
Petroglyph / West Mesa Trails & Parking $500,000
Piedras Marcadas Pueblo $1,000,000
Poblanos Fields $250,000
Shooting Range $1,000,000
Visitor Center $1,000,000
Hubbell Farm $200,000
Southwest Mesa / "Ceja" - Trails & Parking $200,000
Rio Grande Valley State Park Improvements $2,000,000
Elena Gallegos / Foothills $500,000
Tijeras Arroyo/Canyon Facilities $250,000
Manzano / Four Hills $250,000
Montessa Park $200,000
Tres Pistolas/ East Mountains Facilities $200,000
Total $76,250,000 $15,413,026 Source: City of Albuquerque, Parks & Recreation Department, June 18, 2012; potential impact
fee funding from Table 57.

City of Albuquerque, NM FINAL draft
Impact Fee Study 59 September 13, 2012
TRAILS
The City currently charges impact fees for open space and trails. Technically, they are components of the park impact fee. However, the City deposits the portion of the fees attributable to open space and trails into separate city-wide accounts that can be spent anywhere in the city. Effectively, the City has separate city-wide open space and trail impact fees. This section calculates updated trail fees.
Service Areas
The consultant’s recommendation is to have a city-wide trail impact fee. Trails provide a regional network that has city-wide benefit.
Methodology
The proposed methodology for the trail impact fee is the same as for the park impact fee. The fees will be based on the existing level of service, measured in terms of the replacement value of existing land and facilities per service unit.
Service Units
A service unit is a unit of measurement that expresses the demand for facilities resulting from different types of development. As with park impact fees, trail impact fees are typically assessed only on residential development, and generally use population as the indicator of demand. The proposed service unit is same as for the park impact fee – an Equivalent Dwelling Unit, or EDU. A typical single-family home would be one EDU, while the EDUs for other housing types are based on the average persons per unit relative to a typical single-family unit. The proposed EDU multipliers by housing type are the same as for the park impact fee (see Table 33 in the parks section).
Cost per Service Unit
Paved trails cost about $200,000 per mile, although the City has one trail that has a cheaper type of surfacing. The estimated replacement cost of the existing 131 miles of trail is about $26.2 million, as summarized in Table 59. However, this total cost includes 4.88 miles of bridges and other structures that are much more expensive per mile and are generally paid for using federal grant funding. Excluding these crossing structures results in the net trail cost of $25.2 million used in the impact fee calculations.

Trails
City of Albuquerque, NM Final draft
Impact Fee Study September 13, 2012 60
Table 59. Existing Trail Inventory and Cost
Trail Name Surface Miles Cost/Mile Cost
Alameda Drain Paved 1.75 $200,000 $350,000
Amole Arroyo Paved 2.45 $200,000 $490,000
Amole del Norte Paved 1.66 $200,000 $332,000
Bear Canyon Arroyo Paved 3.60 $200,000 $720,000
Boca Negra Paved 2.73 $200,000 $546,000
Embudo Paved 1.60 $200,000 $320,000
Four Hills Paved 1.10 $200,000 $220,000
Gail Ryba Memorial Bridge Paved 0.80 $200,000 $160,000
Gibson/Kirtland Paved 3.00 $200,000 $600,000
I-40 East Paved 4.00 $200,000 $800,000
I-40 West Paved 3.90 $200,000 $780,000
Juan Tabo Hills Paved 2.40 $200,000 $480,000
La Cueva Arroyo Paved 0.90 $200,000 $180,000
Ladera Paved 1.10 $200,000 $220,000
Learning Road Paved 0.48 $200,000 $96,000
Mariposa/Riverview Paved 2.90 $200,000 $580,000
McMahon/Black Paved 7.40 $200,000 $1,480,000
North Diversion Channel Paved 8.60 $200,000 $1,720,000
North Domingo Baca Arroyo Paved 1.10 $200,000 $220,000
North Pino Arroyo Paved 6.00 $200,000 $1,200,000
Paseo del la Mesa Paved 3.95 $200,000 $790,000
Paseo del las Montansas Paved 4.80 $200,000 $960,000
Paseo del Bosque Paved 14.40 $200,000 $2,880,000
Paseo del Nordeste Paved 3.00 $200,000 $600,000
Paseo del Norte Paved 6.60 $200,000 $1,320,000
Peidras Marcadas Paved 3.00 $200,000 $600,000
Rio Bravo SCF* 1.19 $140,000 $166,600
Snow Vista Paved 2.50 $200,000 $500,000
South Diversion Channel Loop Paved 4.10 $200,000 $820,000
South Domingo Baca Arroyo Paved 2.40 $200,000 $480,000
Tramway Paved 9.60 $200,000 $1,920,000
University/Mesa del Sol Paved 2.30 $200,000 $460,000
Unser Paved 11.40 $200,000 $2,280,000
Ventana Ranch Trials Paved 2.73 $200,000 $546,000
Vista del Norte/Osuna Paved 2.00 $200,000 $400,000
Total Trail Cost 131.44 $26,216,600
– Crossing Structures Paved -4.88 $200,000 -$976,000
Net Trail Cost 126.56 $25,240,600 * SCF stands for stabilized crusher fine
Source: City of Albuquerque Parks & Recreation Department, January 4, 2012, March 2,
2012 and June 18, 2012.
The cost per service unit is computed by dividing the total replacement cost of existing trails by the number of existing service units. The result is a cost of $119 per equivalent dwelling unit, as shown in Table 60.
Table 60. Existing Trail Cost per Service Unit
Net Trail Improvement Cost $25,240,600
÷ Existing Equivalent Dwelling Units (EDUs) 211,367
Cost per EDU $119 Source: Trail improvement cost from Table 59; existing 2012 EDUs from Table 34.

Trails
City of Albuquerque, NM Final draft
Impact Fee Study September 13, 2012 61
Net Cost per Service Unit
To calculate the net impact of new development, credit needs to be given for revenue generated by new development that will be used to pay for capacity-related trail improvements. For trails, these include property tax payments used to repay debt used for past trail improvements and anticipated future grant funding. The most straight-forward way to calculate a credit for outstanding debt is to divide current outstanding debt by existing service units (i.e., EDUs). This puts new development on an equal footing with existing development, by assuming that new development will be able to fund the same portion of its share of capacity-expanding capital costs through general obligations bonds as existing development. The credit is calculated city-wide, because property throughout the city will be repaying the debt, regardless of the service area in which the bonded project was located. The city-wide debt credit is shown in Table 61.
Table 61. Trail Debt Credit
Outstanding Eligible Trail Debt $1,537,264
÷ Existing EDUs 211,367
Trail Debt Credit per EDU $7 Source: Outstanding eligible trail debt from Table 102; existing EDUs is
city-wide EDUs from Table 34.
The credit for grant funding is based on the assumption that the City will continue to receive funding at the same level as it has over the past five years. The City has received almost $9.1 million in grant funding for trail improvements over the last five years (see Table 62). However, most of that funding has been for expensive crossing structures that are not included in the trail impact fee cost. Excluding those grant funds, the City has received just under $1.0 million in eligible grant funding.
Table 62. Trail Grants, 2007-2011
Grant Purpose Total Eligible
North Diversion Crossings $1,650,000 $0
Bikeway/Trail Bridge over Rio Grande $4,118,518 $0
I-40 Trail Xing @ RG Phase II $1,240,264 $0
Bear Canyon Arroyo Trail/I-25 Crossing $1,100,000 $0
Regional East-West Bicycle & Trail $973,834 $973,834
Total Trail Grants, 2007-2011 $9,082,616 $973,834 Source: City of Albuquerque Parks & Recreation Department, March 23, 2012.
If this rate of funding continues, the City will receive the present value equivalent over the next 25 years of $14 in grant funding per service unit, as shown in Table 63.
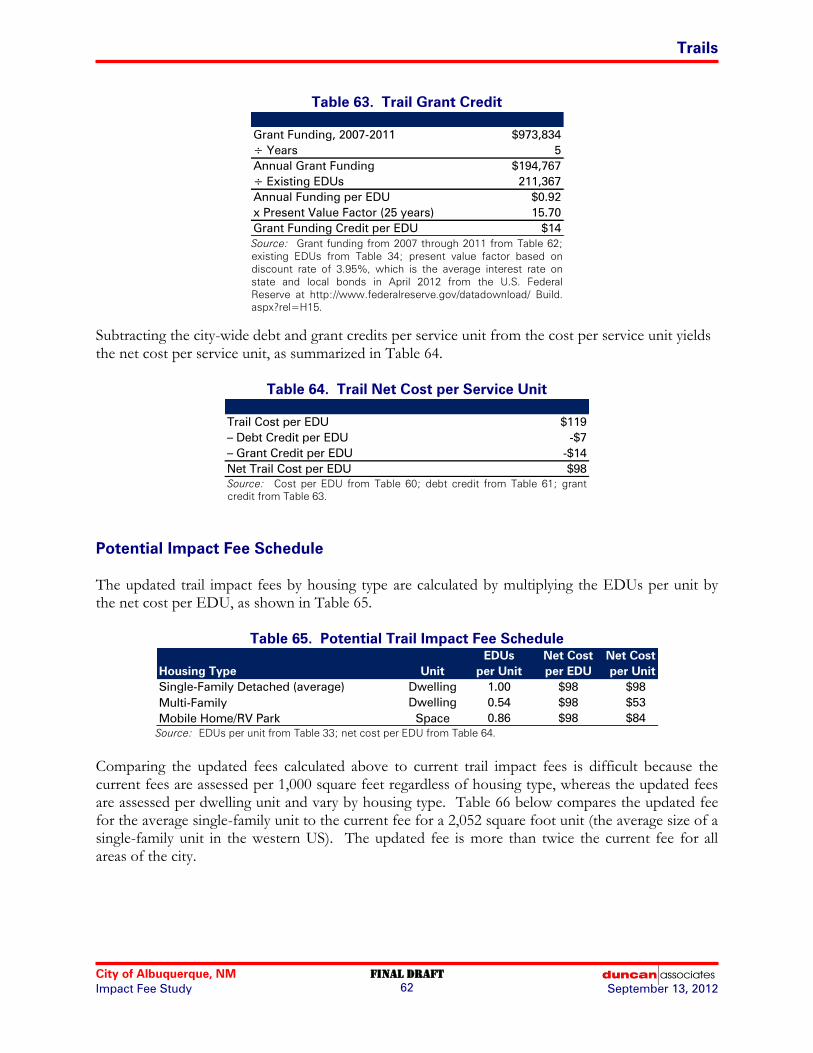
Trails
City of Albuquerque, NM Final draft
Impact Fee Study September 13, 2012 62
Table 63. Trail Grant Credit
Grant Funding, 2007-2011 $973,834
÷ Years 5
Annual Grant Funding $194,767
÷ Existing EDUs 211,367
Annual Funding per EDU $0.92
x Present Value Factor (25 years) 15.70
Grant Funding Credit per EDU $14 Source: Grant funding from 2007 through 2011 from Table 62;
existing EDUs from Table 34; present value factor based on
discount rate of 3.95%, which is the average interest rate on
state and local bonds in April 2012 from the U.S. Federal
Reserve at http://www.federalreserve.gov/datadownload/ Build.
aspx?rel=H15.
Subtracting the city-wide debt and grant credits per service unit from the cost per service unit yields the net cost per service unit, as summarized in Table 64.
Table 64. Trail Net Cost per Service Unit
Trail Cost per EDU $119
– Debt Credit per EDU -$7
– Grant Credit per EDU -$14
Net Trail Cost per EDU $98 Source: Cost per EDU from Table 60; debt credit from Table 61; grant
credit from Table 63.
Potential Impact Fee Schedule
The updated trail impact fees by housing type are calculated by multiplying the EDUs per unit by the net cost per EDU, as shown in Table 65.
Table 65. Potential Trail Impact Fee Schedule
EDUs Net Cost Net Cost
Housing Type Unit per Unit per EDU per Unit
Single-Family Detached (average) Dwelling 1.00 $98 $98
Multi-Family Dwelling 0.54 $98 $53
Mobile Home/RV Park Space 0.86 $98 $84 Source: EDUs per unit from Table 33; net cost per EDU from Table 64.
Comparing the updated fees calculated above to current trail impact fees is difficult because the current fees are assessed per 1,000 square feet regardless of housing type, whereas the updated fees are assessed per dwelling unit and vary by housing type. Table 66 below compares the updated fee for the average single-family unit to the current fee for a 2,052 square foot unit (the average size of a single-family unit in the western US). The updated fee is more than twice the current fee for all areas of the city.

Trails
City of Albuquerque, NM Final draft
Impact Fee Study September 13, 2012 63
Table 66. Comparative Trail Impact Fees per Single-Family Unit
Current Updated Percent
Old Service Area Fee Fee Change
Foothills $32 $98 206%
Central/University $35 $98 180%
Acadamy/NE $35 $98 180%
NW Mesa $41 $98 139%
N Valley/I-25 $41 $98 139%
N Albuquerque $45 $98 118%
SW Mesa $47 $98 109%
Average $39 $98 151% Source: Current fees for a 2,052 square foot unit (average size of a single-family unit in
the western region from the 2009 American Housing Survey) and the trails portion of
the parks, trails and open space fee from the 2004 study, without temporary 50%
reduction; updated fee for average single-family unit from Table 65.
Capital Plan
The New Mexico Development Fees Act requires the preparation of a description of “capital improvements or facility expansions and their costs necessitated by and attributable to new development in the service area based on the approved land use assumptions.” As noted earlier, the capital plan does not drive the calculation of the fees – instead, the fees are based on the existing level of service. Consequently, the capital plan required by the Act functions as a guide to spending impact fee funds on eligible improvements. A first step in preparing the capital plan is to estimate future impact fee revenues. Assuming that the updated trail impact fees are adopted at the full net costs calculated in this study, potential impact fees over the ten-year planning period are estimated to be about $1.7 million, as shown in Table 67.
Table 67. Potential Trail Impact Fee Revenue, 2012-2022
New Single-Family Units 13,974
New Multi-Family Units 5,947
Fee per Single-Family Unit $98
Fee per Multi-Family Unit $53
Potential Revenue $1,684,643 Source: New units from Table 34 (excluding Mesa del Sol); potential
fee per unit from Table 65.
The initial ten-year trail impact fee capital plan for the expenditure of trail impact fees is shown in Table 68. Based on the growth projections in the land use assumptions, and assuming adoption of the updated fees at 100% with few reductions or waivers, anticipated impact fee revenues will cover about 43% of the total estimated cost of planned improvements. Impact fees are not committed to any particular project, and not all of the projects will necessarily be completed in the ten-year period. This capital plan will be incorporated into the Component Capital Improvements Plan (CCIP), which is part of the City’s Decade Plan. The CCIP will be amended every two years as part of the regular update of the Decade Plan.
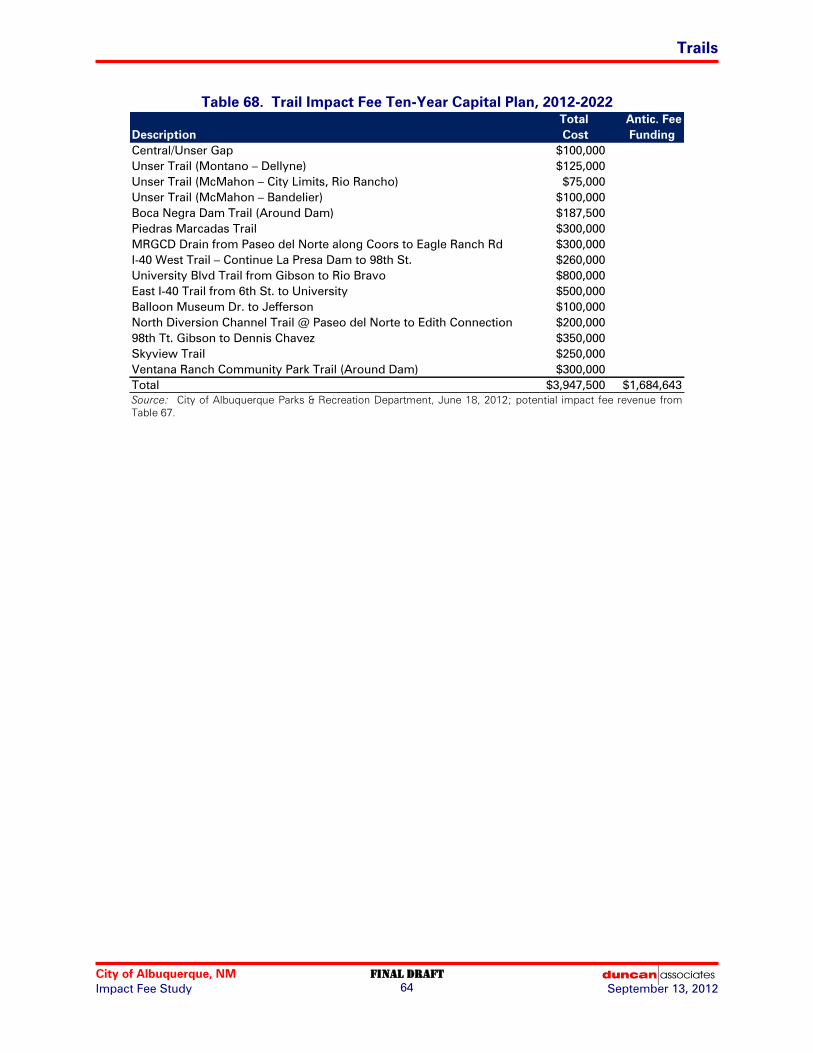
Trails
City of Albuquerque, NM Final draft
Impact Fee Study September 13, 2012 64
Table 68. Trail Impact Fee Ten-Year Capital Plan, 2012-2022
Total Antic. Fee
Description Cost Funding
Central/Unser Gap $100,000
Unser Trail (Montano – Dellyne) $125,000
Unser Trail (McMahon – City Limits, Rio Rancho) $75,000
Unser Trail (McMahon – Bandelier) $100,000
Boca Negra Dam Trail (Around Dam) $187,500
Piedras Marcadas Trail $300,000
MRGCD Drain from Paseo del Norte along Coors to Eagle Ranch Rd $300,000
I-40 West Trail – Continue La Presa Dam to 98th St. $260,000
University Blvd Trail from Gibson to Rio Bravo $800,000
East I-40 Trail from 6th St. to University $500,000
Balloon Museum Dr. to Jefferson $100,000
North Diversion Channel Trail @ Paseo del Norte to Edith Connection $200,000
98th Tt. Gibson to Dennis Chavez $350,000
Skyview Trail $250,000
Ventana Ranch Community Park Trail (Around Dam) $300,000
Total $3,947,500 $1,684,643 Source: City of Albuquerque Parks & Recreation Department, June 18, 2012; potential impact fee revenue from
Table 67.

City of Albuquerque, NM FINAL draft
Impact Fee Study 65 September 13, 2012
FIRE
The City currently charges a public safety impact fee. While the public safety fee is technically a single fee, the City maintains separate accounts for fire and police impact fees. This study develops separate impact fees for fire and police. Updated fire impact fees are calculated in this section.
Service Areas
Currently there are two fire impact fee service areas: Eastside and Westside, with the boundary being the Rio Grande. The Colgan review suggests that the public safety impact fee service areas could be combined into a single city-wide service area, and the consultants agree. Fire stations tend to form an integrated response system, so that a new station on either side of the Rio Grande could benefit new development wherever it is located. A city-wide service area is recommended.
Service Units
A service unit is a unit of measurement that expresses the demand for facilities resulting from different types of development. For the purpose of fire and police impact fees, there are two commonly-used alternatives: calls-for-service and functional population. The calls-for-service approach allocates costs between land uses based on historical local data on the number of calls to various land uses. This approach uses the ratio of the number of calls to the amount of existing development in each land use category to determine calls per unit of development by land use. Functional population is a widely-use and reasonable alternative that allocates the cost of public safety improvements between various types of land uses based on the presence of people at the site of a land use (a functional person is the equivalent of a person occupying a land use for 24 hours a day). The consultants have used the calls-for-service approach on many occasions, but have come to realize its limitations. The major problem with calls-for-service ratios is that they tend to change over time. In our experience, there are often wild swings in fees for various land uses when the fees are updated. In addition, a comparison of calls-for-service and functional population ratios from a large number of studies has found that the average ratios are relatively similar.7 The 2004 study used the functional population approach, and that approach will be used in this update as well. Appendix B explains the concept of functional population, calculates functional population per unit of development by land use, and determines total city-wide existing and projected functional population based on the land use assumptions.
Cost per Service Unit
The cost per service unit is calculated as the ratio of the total replacement cost of existing capital facilities to the number of existing service units. The first step in determining the cost per service unit is to compile an inventory of existing capital facilities. Existing facilities for fire protection are summarized in Table 69.
7 Clancy Mullen, Fire and Police Demand Multipliers: Calls-for-Service versus Functional Population, proceedings of the National Impact Fee Roundtable in Arlington, VA, October 5, 2006 (http://growthandinfrastructure.org/proceedings/ 2006_proceedings/fire%20police%20multipliers.pdf)

Fire
City of Albuquerque, NM Final draft
Impact Fee Study September 13, 2012 66
Table 69. Existing Fire Facilities
Building
Facility Name Physical Address Acres Sq. Ft.
Station 1 724 Silver SW 0.620 23,082
Station 2 301 High SE 0.475 2,641
Station 3 (1) 141 Girard NW n/a 5,700
Station 4 301 McKnight NW 4.090 8,151
Station 5 123 Dallas NE 0.830 10,000
Station 6 623 Griegos NW 0.430 3,100
Station 7 116 47th NW 0.386 3,400
Station 8 1400 Indian View NE 0.990 5,000
Station 9 9601 Menaul NE 0.179 3,500
Station 10 2841 Rio Grande NW 0.150 3,100
Station 11 5403 Southern SE 0.478 3,100
Station 12 201 Muriel NE 0.296 3,668
Station 13 4901 Prospect NE 1.242 7,000
Station 14 9810 Eucariz SW 0.170 2,000
Station 15 6600 Academy NE 2.000 8,000
Station 16 4727 Juan Tabo NE 0.517 4,370
Station 17 3630 Yucca NW 0.634 7,100
Station 18 6100 Taylor Ranch NW 1.070 4,400
Station 19 3520 San Andres NE 2.139 7,000
Station 20 (2) 7520 Corona NE 1.500 10,032
Station 21 10400 Cibola Loop NW 1.551 10,000
Fire Admin/Academy (3) 11500 Sunset Gardens SW 2.882 47,000
Communications Center (4) 11510 Sunset Gardens SW 0.823 7,203
Logistics / Fleet 1801 4th NW 3.271 13,800
Arson 2510 Quincy NE 1.242 4,392
Facilities Maintenance 517 98th NW 1.765 3,500
Records Management (5) 400 Roma NW n/a 1,500
Plans Checking (6) 600 2nd NW n/a 3,500
Total 29.730 215,239 Notes: (1) land leased from UNM; (2) excludes acreage used for park and building sq. ft. occupied
by police; (3) acres utilized assumed to be one-tenth of 28.82 acre site; (4) excludes portion of
building sq. ft. occupied by police, as well as proportionate share of acreage; (5) housed with Police
Dept. building; housed in Plaza del Sol
Source: City of Albuquerque Fire Department, December 23, 2011.
The City currently has two fire stations under construction. They are being constructed as part of a consolidated bid. The cost of construction is $254 per square foot, as shown in Table 70.
Table 70. Fire Station Cost per Square Foot
New Fire Station 2 Square Feet 7,962
New Fire Station 7 Square Feet 8,883
Total Building Square Feet 16,845
Combined Construction Cost $4,270,452
÷ Building Square Feet 16,845
Cost per Square Foot $254 Source: City of Albuquerque Fire Department, May 3, 2012.
The cost of land for the two fire stations under construction averaged $343,863 per acre, as shown in Table 71.
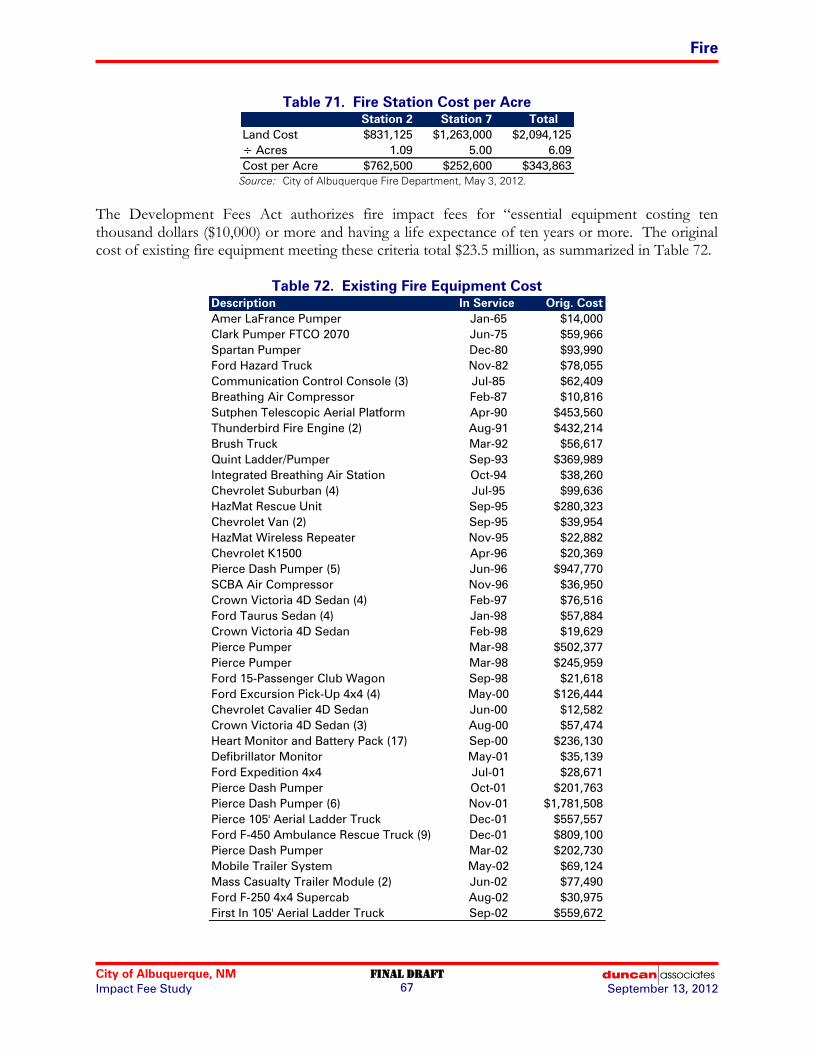
Fire
City of Albuquerque, NM Final draft
Impact Fee Study September 13, 2012 67
Table 71. Fire Station Cost per Acre
Station 2 Station 7 Total
Land Cost $831,125 $1,263,000 $2,094,125
÷ Acres 1.09 5.00 6.09
Cost per Acre $762,500 $252,600 $343,863 Source: City of Albuquerque Fire Department, May 3, 2012.
The Development Fees Act authorizes fire impact fees for “essential equipment costing ten thousand dollars ($10,000) or more and having a life expectance of ten years or more. The original cost of existing fire equipment meeting these criteria total $23.5 million, as summarized in Table 72.
Table 72. Existing Fire Equipment Cost
Description In Service Orig. Cost
Amer LaFrance Pumper Jan-65 $14,000
Clark Pumper FTCO 2070 Jun-75 $59,966
Spartan Pumper Dec-80 $93,990
Ford Hazard Truck Nov-82 $78,055
Communication Control Console (3) Jul-85 $62,409
Breathing Air Compressor Feb-87 $10,816
Sutphen Telescopic Aerial Platform Apr-90 $453,560
Thunderbird Fire Engine (2) Aug-91 $432,214
Brush Truck Mar-92 $56,617
Quint Ladder/Pumper Sep-93 $369,989
Integrated Breathing Air Station Oct-94 $38,260
Chevrolet Suburban (4) Jul-95 $99,636
HazMat Rescue Unit Sep-95 $280,323
Chevrolet Van (2) Sep-95 $39,954
HazMat Wireless Repeater Nov-95 $22,882
Chevrolet K1500 Apr-96 $20,369
Pierce Dash Pumper (5) Jun-96 $947,770
SCBA Air Compressor Nov-96 $36,950
Crown Victoria 4D Sedan (4) Feb-97 $76,516
Ford Taurus Sedan (4) Jan-98 $57,884
Crown Victoria 4D Sedan Feb-98 $19,629
Pierce Pumper Mar-98 $502,377
Pierce Pumper Mar-98 $245,959
Ford 15-Passenger Club Wagon Sep-98 $21,618
Ford Excursion Pick-Up 4x4 (4) May-00 $126,444
Chevrolet Cavalier 4D Sedan Jun-00 $12,582
Crown Victoria 4D Sedan (3) Aug-00 $57,474
Heart Monitor and Battery Pack (17) Sep-00 $236,130
Defibrillator Monitor May-01 $35,139
Ford Expedition 4x4 Jul-01 $28,671
Pierce Dash Pumper Oct-01 $201,763
Pierce Dash Pumper (6) Nov-01 $1,781,508
Pierce 105' Aerial Ladder Truck Dec-01 $557,557
Ford F-450 Ambulance Rescue Truck (9) Dec-01 $809,100
Pierce Dash Pumper Mar-02 $202,730
Mobile Trailer System May-02 $69,124
Mass Casualty Trailer Module (2) Jun-02 $77,490
Ford F-250 4x4 Supercab Aug-02 $30,975
First In 105' Aerial Ladder Truck Sep-02 $559,672
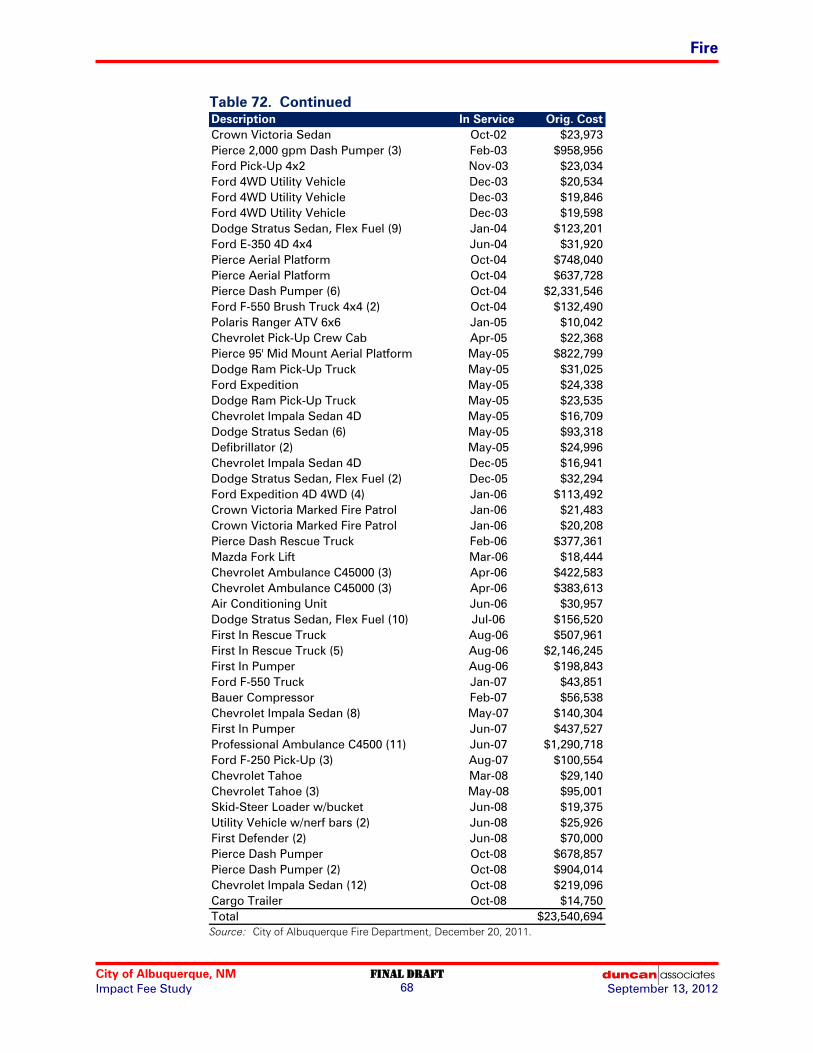
Fire
City of Albuquerque, NM Final draft
Impact Fee Study September 13, 2012 68
Table 72. Continued
Description In Service Orig. Cost
Crown Victoria Sedan Oct-02 $23,973
Pierce 2,000 gpm Dash Pumper (3) Feb-03 $958,956
Ford Pick-Up 4x2 Nov-03 $23,034
Ford 4WD Utility Vehicle Dec-03 $20,534
Ford 4WD Utility Vehicle Dec-03 $19,846
Ford 4WD Utility Vehicle Dec-03 $19,598
Dodge Stratus Sedan, Flex Fuel (9) Jan-04 $123,201
Ford E-350 4D 4x4 Jun-04 $31,920
Pierce Aerial Platform Oct-04 $748,040
Pierce Aerial Platform Oct-04 $637,728
Pierce Dash Pumper (6) Oct-04 $2,331,546
Ford F-550 Brush Truck 4x4 (2) Oct-04 $132,490
Polaris Ranger ATV 6x6 Jan-05 $10,042
Chevrolet Pick-Up Crew Cab Apr-05 $22,368
Pierce 95' Mid Mount Aerial Platform May-05 $822,799
Dodge Ram Pick-Up Truck May-05 $31,025
Ford Expedition May-05 $24,338
Dodge Ram Pick-Up Truck May-05 $23,535
Chevrolet Impala Sedan 4D May-05 $16,709
Dodge Stratus Sedan (6) May-05 $93,318
Defibrillator (2) May-05 $24,996
Chevrolet Impala Sedan 4D Dec-05 $16,941
Dodge Stratus Sedan, Flex Fuel (2) Dec-05 $32,294
Ford Expedition 4D 4WD (4) Jan-06 $113,492
Crown Victoria Marked Fire Patrol Jan-06 $21,483
Crown Victoria Marked Fire Patrol Jan-06 $20,208
Pierce Dash Rescue Truck Feb-06 $377,361
Mazda Fork Lift Mar-06 $18,444
Chevrolet Ambulance C45000 (3) Apr-06 $422,583
Chevrolet Ambulance C45000 (3) Apr-06 $383,613
Air Conditioning Unit Jun-06 $30,957
Dodge Stratus Sedan, Flex Fuel (10) Jul-06 $156,520
First In Rescue Truck Aug-06 $507,961
First In Rescue Truck (5) Aug-06 $2,146,245
First In Pumper Aug-06 $198,843
Ford F-550 Truck Jan-07 $43,851
Bauer Compressor Feb-07 $56,538
Chevrolet Impala Sedan (8) May-07 $140,304
First In Pumper Jun-07 $437,527
Professional Ambulance C4500 (11) Jun-07 $1,290,718
Ford F-250 Pick-Up (3) Aug-07 $100,554
Chevrolet Tahoe Mar-08 $29,140
Chevrolet Tahoe (3) May-08 $95,001
Skid-Steer Loader w/bucket Jun-08 $19,375
Utility Vehicle w/nerf bars (2) Jun-08 $25,926
First Defender (2) Jun-08 $70,000
Pierce Dash Pumper Oct-08 $678,857
Pierce Dash Pumper (2) Oct-08 $904,014
Chevrolet Impala Sedan (12) Oct-08 $219,096
Cargo Trailer Oct-08 $14,750
Total $23,540,694 Source: City of Albuquerque Fire Department, December 20, 2011.
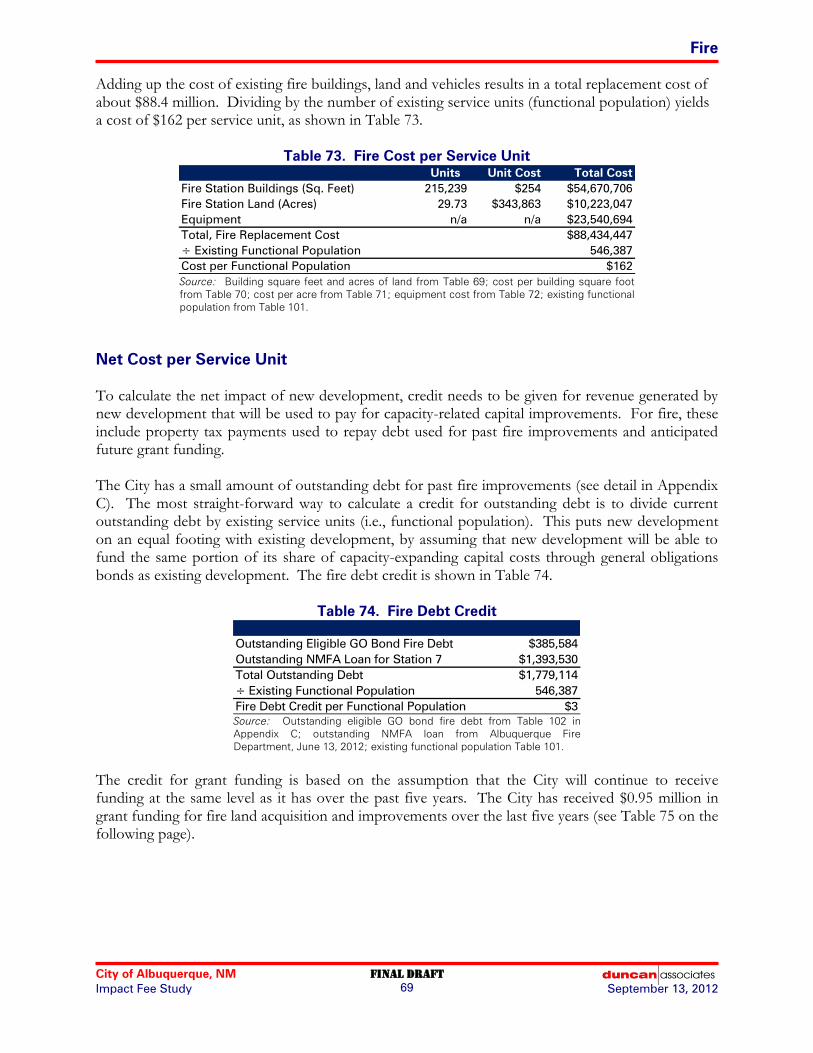
Fire
City of Albuquerque, NM Final draft
Impact Fee Study September 13, 2012 69
Adding up the cost of existing fire buildings, land and vehicles results in a total replacement cost of about $88.4 million. Dividing by the number of existing service units (functional population) yields a cost of $162 per service unit, as shown in Table 73.
Table 73. Fire Cost per Service Unit
Units Unit Cost Total Cost
Fire Station Buildings (Sq. Feet) 215,239 $254 $54,670,706
Fire Station Land (Acres) 29.73 $343,863 $10,223,047
Equipment n/a n/a $23,540,694
Total, Fire Replacement Cost $88,434,447
÷ Existing Functional Population 546,387
Cost per Functional Population $162 Source: Building square feet and acres of land from Table 69; cost per building square foot
from Table 70; cost per acre from Table 71; equipment cost from Table 72; existing functional
population from Table 101.
Net Cost per Service Unit
To calculate the net impact of new development, credit needs to be given for revenue generated by new development that will be used to pay for capacity-related capital improvements. For fire, these include property tax payments used to repay debt used for past fire improvements and anticipated future grant funding. The City has a small amount of outstanding debt for past fire improvements (see detail in Appendix C). The most straight-forward way to calculate a credit for outstanding debt is to divide current outstanding debt by existing service units (i.e., functional population). This puts new development on an equal footing with existing development, by assuming that new development will be able to fund the same portion of its share of capacity-expanding capital costs through general obligations bonds as existing development. The fire debt credit is shown in Table 74.
Table 74. Fire Debt Credit
Outstanding Eligible GO Bond Fire Debt $385,584
Outstanding NMFA Loan for Station 7 $1,393,530
Total Outstanding Debt $1,779,114
÷ Existing Functional Population 546,387
Fire Debt Credit per Functional Population $3 Source: Outstanding eligible GO bond fire debt from Table 102 in
Appendix C; outstanding NMFA loan from Albuquerque Fire
Department, June 13, 2012; existing functional population Table 101.
The credit for grant funding is based on the assumption that the City will continue to receive funding at the same level as it has over the past five years. The City has received $0.95 million in grant funding for fire land acquisition and improvements over the last five years (see Table 75 on the following page).
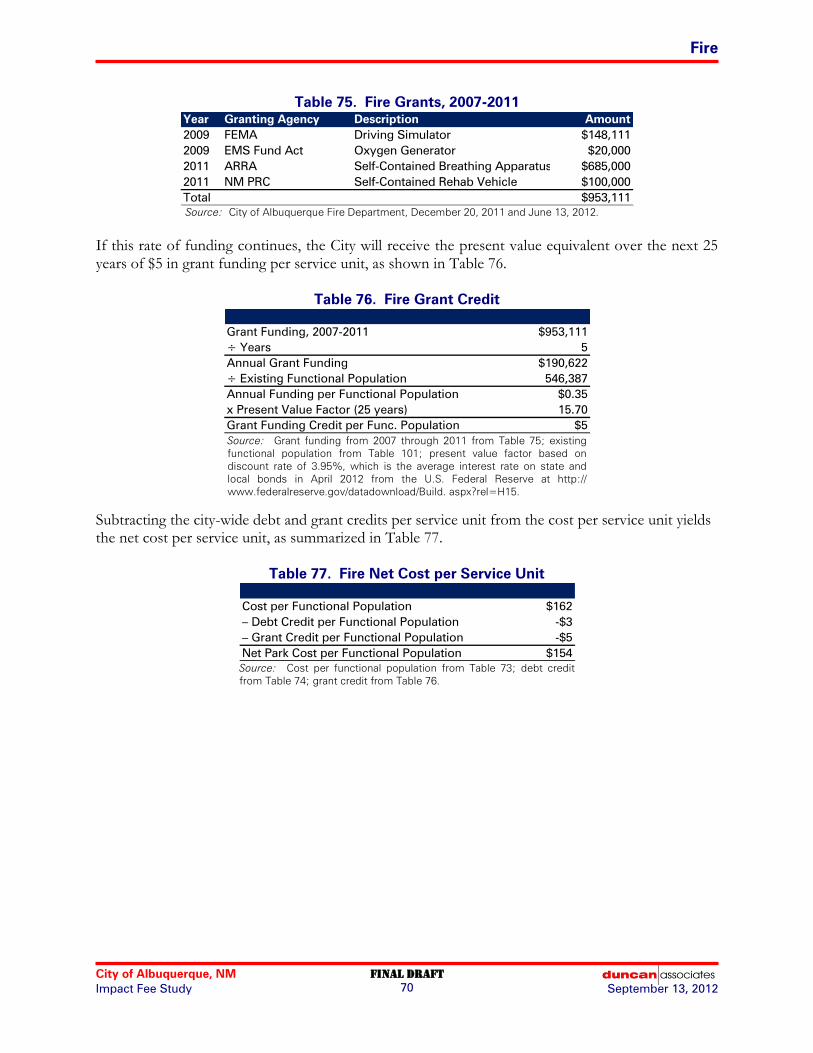
Fire
City of Albuquerque, NM Final draft
Impact Fee Study September 13, 2012 70
Table 75. Fire Grants, 2007-2011
Year Granting Agency Description Amount
2009 FEMA Driving Simulator $148,111
2009 EMS Fund Act Oxygen Generator $20,000
2011 ARRA Self-Contained Breathing Apparatus $685,000
2011 NM PRC Self-Contained Rehab Vehicle $100,000
Total $953,111 Source: City of Albuquerque Fire Department, December 20, 2011 and June 13, 2012.
If this rate of funding continues, the City will receive the present value equivalent over the next 25 years of $5 in grant funding per service unit, as shown in Table 76.
Table 76. Fire Grant Credit
Grant Funding, 2007-2011 $953,111
÷ Years 5
Annual Grant Funding $190,622
÷ Existing Functional Population 546,387
Annual Funding per Functional Population $0.35
x Present Value Factor (25 years) 15.70
Grant Funding Credit per Func. Population $5 Source: Grant funding from 2007 through 2011 from Table 75; existing
functional population from Table 101; present value factor based on
discount rate of 3.95%, which is the average interest rate on state and
local bonds in April 2012 from the U.S. Federal Reserve at http://
www.federalreserve.gov/datadownload/Build. aspx?rel=H15.
Subtracting the city-wide debt and grant credits per service unit from the cost per service unit yields the net cost per service unit, as summarized in Table 77.
Table 77. Fire Net Cost per Service Unit
Cost per Functional Population $162
– Debt Credit per Functional Population -$3
– Grant Credit per Functional Population -$5
Net Park Cost per Functional Population $154 Source: Cost per functional population from Table 73; debt credit
from Table 74; grant credit from Table 76.

Fire
City of Albuquerque, NM Final draft
Impact Fee Study September 13, 2012 71
Potential Impact Fee Schedule
The updated fire impact fees by housing type are calculated by multiplying the functional population per unit by the net cost per functional population, as shown in Table 78.
Table 78. Potential Fire Impact Fee Schedule
Functional Net Cost/ Net Cost/
Land Use Unit Pop./Unit Func. Pop. Unit
Single-Family Detached Dwelling 1.73 $154 $266
Multi-Family Dwelling 0.94 $154 $145
Mobile Home/RV Park Space 1.49 $154 $229
Hotel/Motel Room 1.05 $154 $162
Commercial 1,000 sq. ft. 1.58 $154 $243
Public/Institutional 1,000 sq. ft. 0.99 $154 $152
Industrial/Warehouse 1,000 sq. ft. 0.24 $154 $37
Mini-Warehouse 1,000 sq. ft. 0.13 $154 $20 Source: Functional population per unit from Table 100 (multi-family based on apartment complexes with
50 or more units; commercial based on office; industrial/warehouse based on warehouse); net cost per
functional population from Table 77.
The updated fees are compared to current fire impact fees in Table 79. The updated fees are in the mid-range of current fees for residential and commercial, are lower for industrial/warehouse, and are single higher for office and public/institutional. Higher fees for office and institutional uses correct for under-estimates of functional population for those land uses, although the reason for the under-estimate in the 2004 study cannot be determined, because that study did not provide any details about how the functional population multipliers were determined. This study documents the data sources and assumptions used in developing the functional population multipliers, and these types of differential increases and decreases should not occur in future updates.
Table 79. Comparative Fire Impact Fees
Updated
Land Use Unit East West Fee East West
Single-Family Detached Dwelling $362 $219 $266 -27% 21%
Multi-Family Dwelling $156 $95 $145 -7% 53%
Retail/Commercial 1,000 sq. ft. $291 $176 $243 -16% 38%
Office 1,000 sq. ft. $64 $39 $243 282% 530%
Public/Institutional 1,000 sq. ft. $69 $42 $152 121% 264%
Industrial/Warehouse 1,000 sq. ft. $71 $43 $37 -48% -14%
Current Fee Percent Change
Source: Current fire fees derived from the 2004 study for public safety fees, without temporary 50% reduction
(single-family based on average 2,052 sq. ft. unit; multi-family based on average 886 sq. ft. unit from 2009
American Housing Survey for the western region); updated fees from Table 78.

Fire
City of Albuquerque, NM Final draft
Impact Fee Study September 13, 2012 72
Capital Plan
The New Mexico Development Fees Act requires the preparation of a description of “capital improvements or facility expansions and their costs necessitated by and attributable to new development in the service area based on the approved land use assumptions.” As noted earlier, the capital plan does not drive the calculation of the fees – instead, the fees are based on the existing level of service. Consequently, the capital plan required by the Act functions as a guide to spending impact fee funds on eligible improvements. A first step in preparing the capital plan is to estimate future impact fee revenues. Assuming that the updated fire impact fees are adopted at the full net costs calculated in this study, potential impact fees over the ten-year planning period are estimated to be about $7.8 million, as shown in Table 80.
Table 80. Potential Fire Impact Fee Revenue, 2012-2022
New Fee per Potential
Land Use Type Unit Units Unit Revenue
Single-Family Dwelling 13,974 $266 $3,717,084
Multi-Family Dwelling 5,947 $145 $862,315
Commercial 1,000 Sq. Ft. 8,931 $243 $2,170,233
Public/Institutional 1,000 sq. ft. 5,887 $152 $894,824
Industrial/Warehouse 1,000 Sq. Ft. 5,498 $37 $203,426
Total $7,847,882 Source: New units (excluding Mesa del Sol) from Table 31; potential fee per unit from Table
78.
The initial ten-year capital plan for the expenditure of fire impact fees is shown in Table 81. Based on the growth projections in the land use assumptions, and assuming adoption of the updated fees at 100% with few reductions or waivers, anticipated impact fee revenues will cover about 49% of the total eligible cost of planned improvements. Impact fees are not committed to any particular project, and not all of the projects will necessarily be completed in the ten-year period. This capital plan will be incorporated into the Component Capital Improvements Plan (CCIP), which is part of the City’s Decade Plan. The CCIP will be amended every two years as part of the regular update of the Decade Plan.
Table 81. Fire Impact Fee Ten-Year Capital Plan, 2012-2022
Total Eligible Antic. Fee
Description Project Cost Cost Funding
New Volcano Vista Fire Station* $4,800,000 $4,800,000
Logistics/Fleet $9,683,500 $3,001,885
Station 9 Reconstruction $4,903,750 $2,451,875
New SW Mesa Fire Station $5,053,000 $5,053,000
Communications Center and Equipment $2,350,000 $705,000
Total $26,790,250 $16,011,760 $7,847,882 * excludes land costs, since City already owns the land
Source: City of Albuquerque Fire Department, June 15, 2012; 31% of the replacement logistics/
fleet facility eligible, based on existing 13,800 sq. ft. and new 20,000 sq. ft.; 50% of Station 9
reconstruction eligible, since replacement station will be twice the size of current 3,500 sq. ft.; 30%
of communications center improvements eligible, based on added capacity for five additional
dispatchers; total potential impact fee funding from Table 80.

City of Albuquerque, NM FINAL draft
Impact Fee Study 73 September 13, 2012
POLICE
The City currently charges a public safety impact fee. While the public safety fee is technically a single fee, the City maintains separate accounts for fire and police impact fees. This study develops separate impact fees for fire and police facilities. Updated police impact fees are calculated in this section.
Service Areas
Currently there are two police impact fee service areas: Eastside and Westside, with the boundary being the Rio Grande. The public safety impact fee ordinance provides that impact fees for police facilities collected in either service area may be spent on city-wide police facilities (§ 14-19-1-15(A)). Note that this provision implies that public safety impact fees should be divided into police and fire impact fees, and this is how the City tracks the funds. In fact, the City allocates public safety impact fees into five separate accounts based on a percentage distribution derived from the 2004 impact fee study: Fire Westside, Fire Eastside, Police Westside, Police Eastside and Police City-Wide. Since the ordinance does not mandate a separate city-wide service area for police, the City is limiting its flexibility in spending police impact fees to a greater extent than is actually required. The Colgan review suggests that the public safety impact fee service areas could be combined into a single city-wide service area, and the consultants agree. There is little difference in the police impact fees between the two service areas. The bulk of police facilities are of city-wide benefit. A city-wide service area is recommended for police fees.
Service Units
A service unit is a unit of measurement that expresses the demand for facilities resulting from different types of development. For the purpose of fire and police impact fees, there are two commonly-used alternatives: calls-for-service and functional population. Calls-for-service allocate costs between land uses based on historical local data on the number of calls to various land uses. This approach uses the ratio of the number of calls to the amount of existing development in each land use category to determine calls per unit of development by land use. Functional population is a widely-use and reasonable alternative that allocates the cost of public safety improvements between various types of land uses based on the presence of people at the site of a land use (a functional person is the equivalent of a person occupying a land use for 24 hours a day). The consultants have used calls-for-service on many occasions, but have come to realize its limitations. The major problem with calls-for-service ratios is that they tend to change over time. In our experience, there are often wild swings in fees for various land uses when the fees are updated. In addition, the consultants have compared calls-for-service and functional population ratios from a large number of studies, and found that the average ratios are relatively similar.8 The 2004 study used the functional population approach, and that approach will be used in this update as well.
8 Clancy Mullen, Fire and Police Demand Multipliers: Calls-for-Service versus Functional Population, proceedings of the National Impact Fee Roundtable in Arlington, VA, October 5, 2006 (http://growthandinfrastructure.org/proceedings/ 2006_proceedings/fire%20police%20multipliers.pdf)

Police
City of Albuquerque, NM Final draft
Impact Fee Study September 13, 2012 74
Appendix B explains the concept of functional population, calculates functional population per unit of development by land use, and determines total existing and projected city-wide functional population based on the land use assumptions.
Cost per Service Unit
The cost per service unit is calculated as the ratio of the total replacement cost of existing capital facilities to the number of existing service units. The first step in determining the cost per service unit is to compile an inventory of existing capital facilities. Existing facilities for police protection are summarized in Table 82.
Table 82. Existing Police Facilities
Facility Address Acres Sq. Ft.
APD Old Main 401 Marquette 1.50 83,502
Law Enforcement Center* 400 Roma NW 0.55 49,388
Metropolitan Forensic Science Center 5350 2nd St NW 6.25 64,000
Communications Center (APD portion) 11510 Sunset Gardens SW 0.77 6,745
Gerald Kline Valley Area Command 5408 2nd St NW 2.60 13,208
John Carrillo Northeast Area Command 8201 Osuna NE 1.89 8,907
Phil Chacon Southeast Area Command 800 Louisiana SE 1.80 11,436
Russell Foothills Area Command 12800 Lomas NE 1.62 14,824
Shawn McWethy Southwest Area Command 6404 Los Volcanes NW 1.33 9,554
Smith/King Northwest Area Command 10401 Cibola Loop 3.56 26,000
James J. Dwyer Substation 12700 Montgomery 1.00 4,700
Old Town Mini Substation 2060 Central SW 0.59 4,362
South Broadway Substation 1501 Broadway SW 1.45 3,088
Triangle Substation 2901 Central NE 0.40 400
APD Prisoner Transfer Center 401 Roma Avenue NW 0.76 1,800
APD Traffic 20 7520 Corona NE 1.61 3,848
Hoisington Police Academy 5412 2nd NE 4.10 24,600
APD Tactical Range 3701 Drag Strip Rd SW 7.60 1,200
Leadership Academy / Recruiting 5412 2nd NE 0.25 3,400
Total 39.63 334,962 * excludes 1,500 sq. ft. used by Fire Department
Source: City of Albuquerque Police Department, January 12, 2012.
The City completed construction of the Smith/King Memorial substation in 2011. The cost of construction was $235 per square foot and the cost of the land was $308,466 per acre, as shown in Table 83.
Table 83. Police Station Unit Costs
Substation Construction/FFE Cost $6,100,000
÷ Building Square Feet 26,000
Cost per Square Foot $235
Substation Land Cost $583,000
÷ Acres 1.89
Cost per Acre $308,466 Source: City of Albuquerque Police Department, January
12, 2012.

Police
City of Albuquerque, NM Final draft
Impact Fee Study September 13, 2012 75
The Development Fees Act authorizes police impact fees for “essential equipment costing ten thousand dollars ($10,000) or more and having a life expectance of ten years or more. The original costs of existing police equipment meeting these criteria total about $4 million, as summarized in Table 84.
Table 84. Existing Police Equipment Cost
Police Equipment Type Year Amount
Helicoptor 2002 $1,505,973
Air Support Night Vision (2) 2006 $20,028
Air Support Video Unit 2011 $10,304
Portable Directional Radar Trailer (3) 2005 $31,131
Munitions Storage Unit (2) 2005 $20,790
Copier BIZHUB C550 2008 $10,923
Copier MX M620R 2010 $10,951
Microfilm Reader 1999 $11,075
Refrigerated Lockers 2008 $11,494
Ranger 4-Wheeler 2008 $11,726
Bait Car Deluxe 2008 $11,995
Microscope 2009 $110,763
Portable Classroom Building 2005 $113,158
Copier BIZHUB (2) 2011 $24,588
Print System 2007 $12,476
DLP Projector and Installation System (2) 2010 $25,080
Munitions Storage Unit (2) 2010 $25,168
Advanced BQ-90 BASI Target 2010 $12,590
Copier MP C5000 2010 $12,624
Generation IV Bomb Robot 2008 $124,998
Copier/Scanner/Printer C4500 2008 $13,040
I610 Document Scanner 2009 $13,109
DLP Projector and Installation System 2011 $13,211
Gas Chromatograph DNA Multiplier 2008 $13,412
Cisco Catalyst 3750E Ethernet 2009 $13,799
QFS-T15 Film Processor 2008 $13,900
Copier MP-C45000 2008 $14,024
Microscope Stand 2001 $14,972
Portable Classroom Building (2) 2009 $287,528
ACS Video Network Bundle 2009 $15,196
235 Xeon "Cry Wolf" Server 2004 $15,547
Forensic Cabinets (2) 2002 $31,210
Copier AFICIO 3045 2008 $16,026
CPU T-5500 2008 $16,623
Mcyntyre 4000 Gun Shear 2008 $16,950
Crime Lab Server 2004 $17,042
In-Car License Plate Reader (2) 2007 $35,000
Gas Chromatograph 7890A 2008 $18,272
Crime Lab Microscope-Firearm Comparison 2008 $22,583
Dual Sensor 60 HZ Laser 2010 $207,869
Crime Lab Headspace Sampler 2008 $21,583
Helicopter Spotlight 2008 $22,000
Rover RTK Mapper w/Digital UHF 2010 $25,812
Bombtec Kit 2010 $21,513
GPS Mapping Sys Power Unit for Helic 2005 $32,200
Security System with Camera 2008 $25,855
Bore Scope 2008 $21,620

Police
City of Albuquerque, NM Final draft
Impact Fee Study September 13, 2012 76
Table 84. Continued
Police Equipment Type Year Amount
Precision T7400 Security System 2008 $24,769
Mass Spectrometer DNA Magnifier 2008 $31,485
Chemical Identifier 2008 $34,207
Envelope Stuffer M7000 2008 $19,080
Simulator 2003 $19,500
Interface Software for Use w/AFIS 2006 $30,000
Copier MP 8000 2008 $19,138
Hostage Response System Phone Link 2008 $23,500
Auto License Plate Recognition System 2010 $35,386
Altimeter - Air Support 2011 $38,860
3000 MAX Recording System Server 2010 $39,333
Livescan Workstation 3000 2006 $40,000
Print Scanner 2010 $40,906
Finger Printing ID System 2006 $400,000
DNA Robot 2009 $98,362
Total $3,992,257 Source: City of Albuquerque Police Department, December 22, 2011.
Adding up the cost of existing police buildings, land and equipment results in a total replacement cost of about $94.9 million. Dividing by the number of existing service units (functional population) yields a cost of $174 per service unit, as shown in Table 85.
Table 85. Police Cost per Service Unit
Units Cost/Unit Cost
Building (sq. ft.) 334,962 $235 $78,716,070
Land (acres) 39.63 $308,466 $12,224,508
Equipment n/a n/a $3,992,257
Total Cost $94,932,835
÷ Existing Functional Population 546,387
Cost per Functional Population $174 Source: Building square feet and acres of land from Table 82; cost per building square foot
and per acre from Table 83; equipment cost from Table 84; existing functional population
from Table 101.
Net Cost per Service Unit
To calculate the net impact of new development, credit needs to be given for revenue generated by new development that will be used to pay for capacity-related capital improvements. For police, these include property tax payments used to repay debt used for past police improvements and anticipated future grant funding. The most straight-forward way to calculate a credit for outstanding debt is to divide current outstanding debt by existing service units (i.e., functional population). This puts new development on an equal footing with existing development, by assuming that new development will be able to fund the same portion of its share of capacity-expanding capital costs through general obligations bonds as existing development. The police debt credit is shown in Table 86.
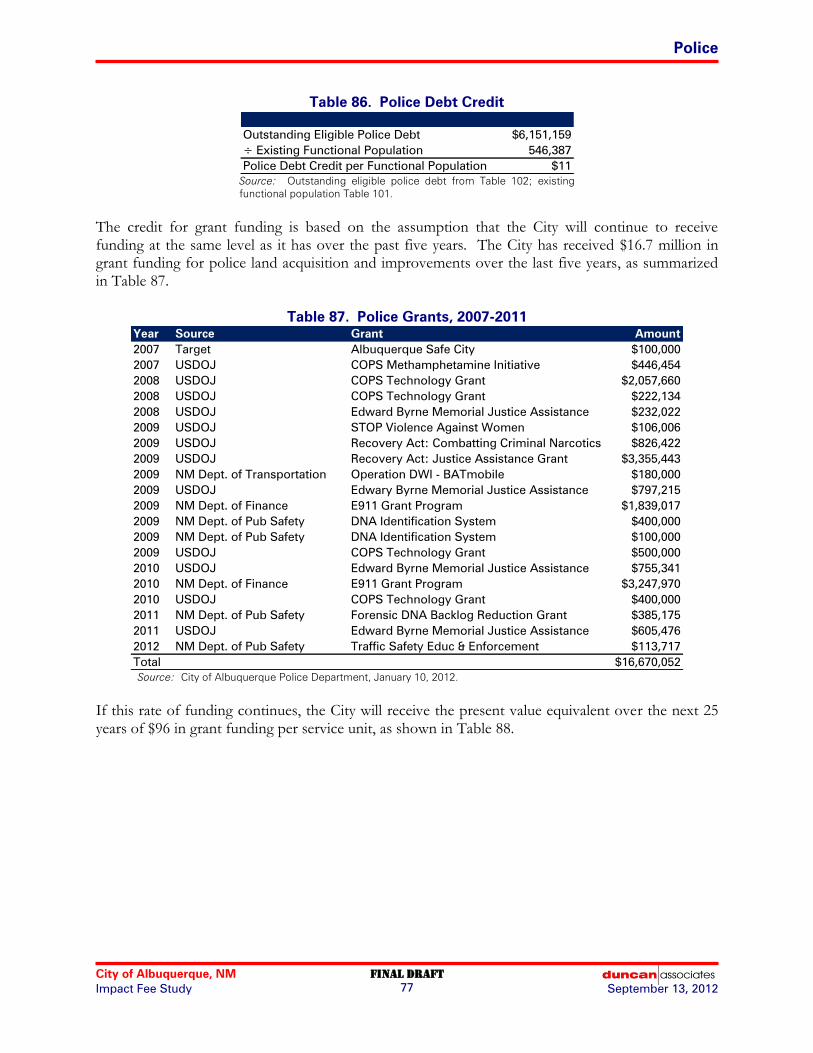
Police
City of Albuquerque, NM Final draft
Impact Fee Study September 13, 2012 77
Table 86. Police Debt Credit
Outstanding Eligible Police Debt $6,151,159
÷ Existing Functional Population 546,387
Police Debt Credit per Functional Population $11 Source: Outstanding eligible police debt from Table 102; existing
functional population Table 101.
The credit for grant funding is based on the assumption that the City will continue to receive funding at the same level as it has over the past five years. The City has received $16.7 million in grant funding for police land acquisition and improvements over the last five years, as summarized in Table 87.
Table 87. Police Grants, 2007-2011
Year Source Grant Amount
2007 Target Albuquerque Safe City $100,000
2007 USDOJ COPS Methamphetamine Initiative $446,454
2008 USDOJ COPS Technology Grant $2,057,660
2008 USDOJ COPS Technology Grant $222,134
2008 USDOJ Edward Byrne Memorial Justice Assistance $232,022
2009 USDOJ STOP Violence Against Women $106,006
2009 USDOJ Recovery Act: Combatting Criminal Narcotics $826,422
2009 USDOJ Recovery Act: Justice Assistance Grant $3,355,443
2009 NM Dept. of Transportation Operation DWI - BATmobile $180,000
2009 USDOJ Edwary Byrne Memorial Justice Assistance $797,215
2009 NM Dept. of Finance E911 Grant Program $1,839,017
2009 NM Dept. of Pub Safety DNA Identification System $400,000
2009 NM Dept. of Pub Safety DNA Identification System $100,000
2009 USDOJ COPS Technology Grant $500,000
2010 USDOJ Edward Byrne Memorial Justice Assistance $755,341
2010 NM Dept. of Finance E911 Grant Program $3,247,970
2010 USDOJ COPS Technology Grant $400,000
2011 NM Dept. of Pub Safety Forensic DNA Backlog Reduction Grant $385,175
2011 USDOJ Edward Byrne Memorial Justice Assistance $605,476
2012 NM Dept. of Pub Safety Traffic Safety Educ & Enforcement $113,717
Total $16,670,052 Source: City of Albuquerque Police Department, January 10, 2012.
If this rate of funding continues, the City will receive the present value equivalent over the next 25 years of $96 in grant funding per service unit, as shown in Table 88.

Police
City of Albuquerque, NM Final draft
Impact Fee Study September 13, 2012 78
Table 88. Police Grant Credit
Grant Funding, 2007-2011 $16,670,052
÷ Years 5
Annual Grant Funding $3,334,010
÷ Existing Functional Population 546,387
Annual Funding per Functional Population $6.10
x Present Value Factor (25 years) 15.70
Grant Funding Credit per Functional Population $96 Source: Grant funding from 2007 through 2011 from Table 87; existing
functional population from Table 101; present value factor based on
discount rate of 3.95%, which is the average interest rate on state and
local bonds in April 2012 from the U.S. Federal Reserve at http://
www.federalreserve.gov/datadownload/Build. aspx?rel=H15.
Subtracting the city-wide debt and grant credits per service unit from the cost per service unit yields the net cost per service unit, as summarized in Table 89.
Table 89. Police Net Cost per Service Unit
Cost per Functional Population $174
– Debt Credit per Functional Population -$11
– Grant Credit per Functional Population -$96
Net Cost per Functional Population $67 Source: Cost per functional population from Table 85; debt credit
from Table 86; grant credit from Table 88.
Potential Impact Fee Schedule
The updated police impact fees by housing type are calculated by multiplying the functional population per unit by the net cost per functional population, as shown in Table 90.
Table 90. Potential Police Impact Fee Schedule
Func. Pop. Net Cost Net Cost
Land Use Type Unit per Unit per Func. Pop. per Unit
Single-Family Detached Dwelling 1.73 $67 $116
Multi-Family Dwelling 0.94 $67 $63
Mobile Home/RV Park Space 1.49 $67 $100
Hotel/Motel Room 1.05 $67 $70
Commercial 1,000 sq. ft. 1.58 $67 $106
Public/Institutional 1,000 sq. ft. 0.99 $67 $66
Industrial/Warehouse 1,000 sq. ft. 0.24 $67 $16
Mini-Warehouse 1,000 sq. ft. 0.13 $67 $9 Source: Functional population per unit from Table 100 (multi-family based on apartment
complexes with 50 or more units; commercial based on office; industrial/warehouse based on
warehouse); net cost per functional population from Table 89.
The updated fees are compared to current police impact fees in Table 91. The updated fees are lower than current fees for residential, retail and industrial uses, but higher for office and institutional uses. Higher fees for office and institutional uses correct for under-estimates of functional population for those land uses, although the reason for the under-estimate in the 2004 study cannot be determined, because that study did not provide any details about how the functional
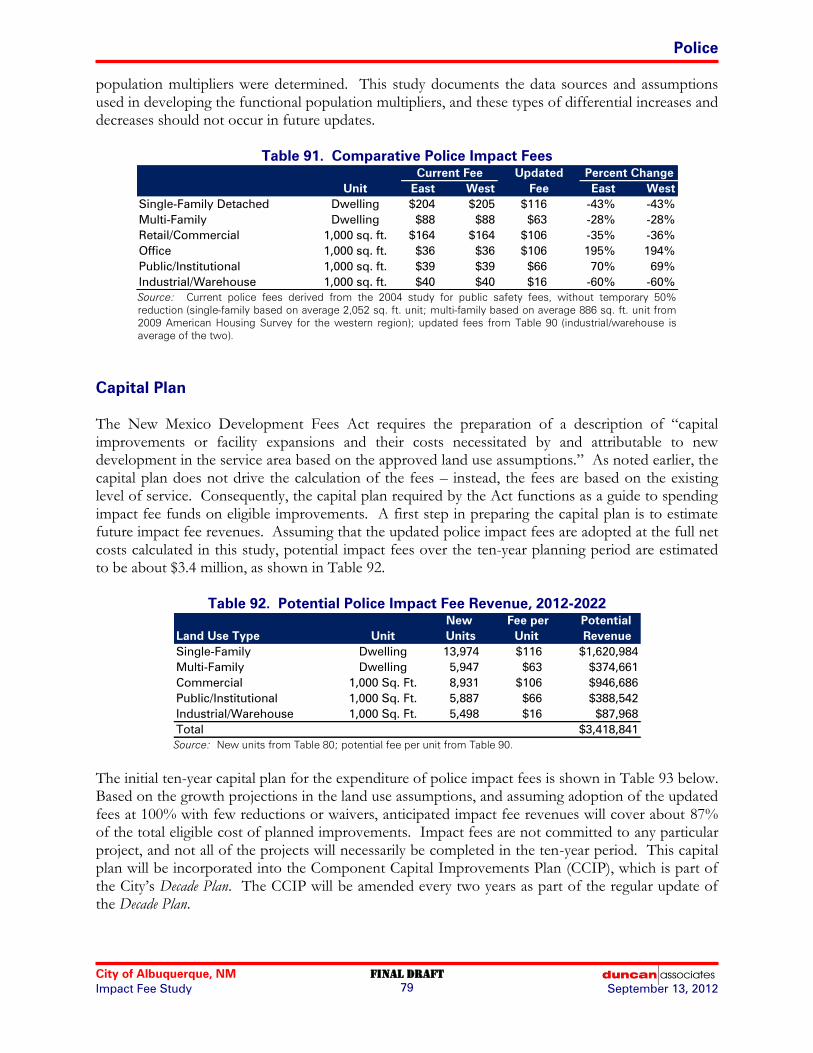
Police
City of Albuquerque, NM Final draft
Impact Fee Study September 13, 2012 79
population multipliers were determined. This study documents the data sources and assumptions used in developing the functional population multipliers, and these types of differential increases and decreases should not occur in future updates.
Table 91. Comparative Police Impact Fees
Updated
Unit East West Fee East West
Single-Family Detached Dwelling $204 $205 $116 -43% -43%
Multi-Family Dwelling $88 $88 $63 -28% -28%
Retail/Commercial 1,000 sq. ft. $164 $164 $106 -35% -36%
Office 1,000 sq. ft. $36 $36 $106 195% 194%
Public/Institutional 1,000 sq. ft. $39 $39 $66 70% 69%
Industrial/Warehouse 1,000 sq. ft. $40 $40 $16 -60% -60%
Current Fee Percent Change
Source: Current police fees derived from the 2004 study for public safety fees, without temporary 50%
reduction (single-family based on average 2,052 sq. ft. unit; multi-family based on average 886 sq. ft. unit from
2009 American Housing Survey for the western region); updated fees from Table 90 (industrial/warehouse is
average of the two).
Capital Plan
The New Mexico Development Fees Act requires the preparation of a description of “capital improvements or facility expansions and their costs necessitated by and attributable to new development in the service area based on the approved land use assumptions.” As noted earlier, the capital plan does not drive the calculation of the fees – instead, the fees are based on the existing level of service. Consequently, the capital plan required by the Act functions as a guide to spending impact fee funds on eligible improvements. A first step in preparing the capital plan is to estimate future impact fee revenues. Assuming that the updated police impact fees are adopted at the full net costs calculated in this study, potential impact fees over the ten-year planning period are estimated to be about $3.4 million, as shown in Table 92.
Table 92. Potential Police Impact Fee Revenue, 2012-2022
New Fee per Potential
Land Use Type Unit Units Unit Revenue
Single-Family Dwelling 13,974 $116 $1,620,984
Multi-Family Dwelling 5,947 $63 $374,661
Commercial 1,000 Sq. Ft. 8,931 $106 $946,686
Public/Institutional 1,000 Sq. Ft. 5,887 $66 $388,542
Industrial/Warehouse 1,000 Sq. Ft. 5,498 $16 $87,968
Total $3,418,841 Source: New units from Table 80; potential fee per unit from Table 90.
The initial ten-year capital plan for the expenditure of police impact fees is shown in Table 93 below. Based on the growth projections in the land use assumptions, and assuming adoption of the updated fees at 100% with few reductions or waivers, anticipated impact fee revenues will cover about 87% of the total eligible cost of planned improvements. Impact fees are not committed to any particular project, and not all of the projects will necessarily be completed in the ten-year period. This capital plan will be incorporated into the Component Capital Improvements Plan (CCIP), which is part of the City’s Decade Plan. The CCIP will be amended every two years as part of the regular update of the Decade Plan.
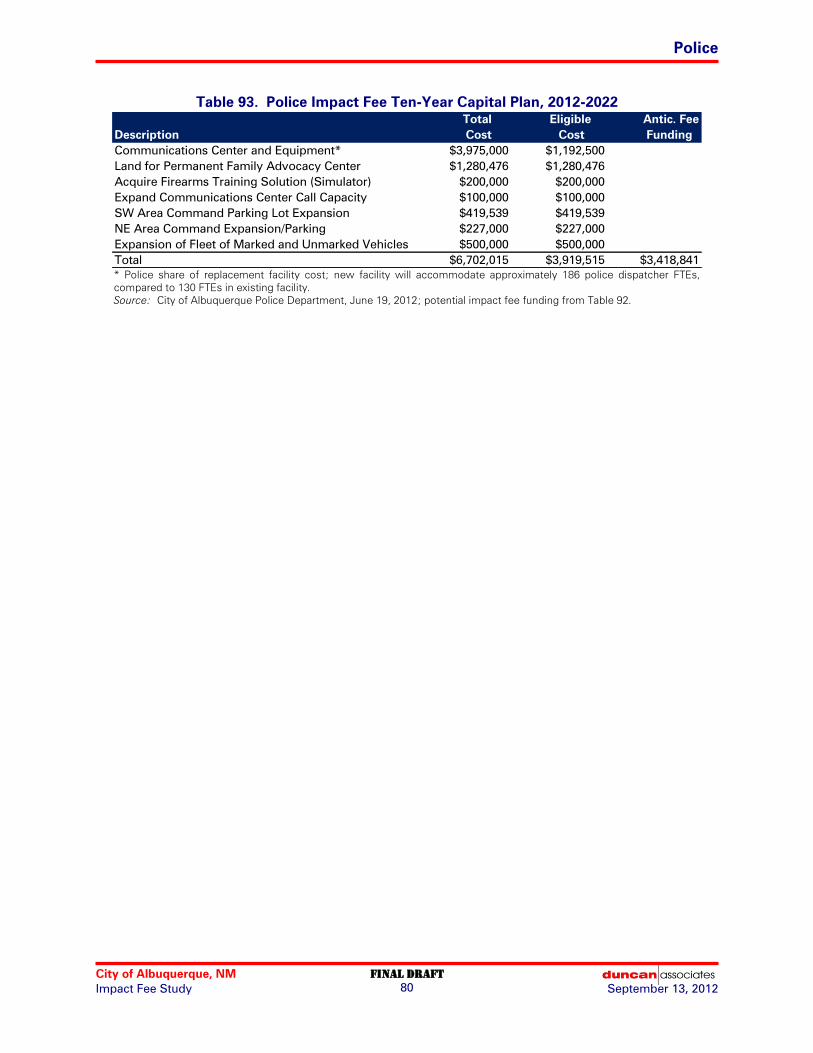
Police
City of Albuquerque, NM Final draft
Impact Fee Study September 13, 2012 80
Table 93. Police Impact Fee Ten-Year Capital Plan, 2012-2022
Total Eligible Antic. Fee
Description Cost Cost Funding
Communications Center and Equipment* $3,975,000 $1,192,500
Land for Permanent Family Advocacy Center $1,280,476 $1,280,476
Acquire Firearms Training Solution (Simulator) $200,000 $200,000
Expand Communications Center Call Capacity $100,000 $100,000
SW Area Command Parking Lot Expansion $419,539 $419,539
NE Area Command Expansion/Parking $227,000 $227,000
Expansion of Fleet of Marked and Unmarked Vehicles $500,000 $500,000
Total $6,702,015 $3,919,515 $3,418,841 * Police share of replacement facility cost; new facility will accommodate approximately 186 police dispatcher FTEs,
compared to 130 FTEs in existing facility.
Source: City of Albuquerque Police Department, June 19, 2012; potential impact fee funding from Table 92.

City of Albuquerque, NM FINAL draft
Impact Fee Study 81 September 13, 2012
DRAINAGE
The City currently charges a drainage impact fee. The update of the drainage impact fees is excluded from the consultant’s scope of service, except for reviewing work done by City staff. The City has determined that no update of the land use assumptions for the drainage impact fee service areas and no update of the impact fee capital improvements plan is required, except to update the list of projects on which drainage impact fee will be spent.
Service Areas
The City of Albuquerque is divided into five drainage impact fee service areas, as illustrated in Figure 13. No drainage fees are charged in the Central City service area. Mesa del Sol is not included in any drainage service area, and is exempt from impact fees based on a development agreement.
Figure 13. Drainage Service Areas

Drainage
City of Albuquerque, NM Final draft
Impact Fee Study September 13, 2012 82
Capital Plan
The New Mexico Development Fees Act requires the preparation of a description of “capital improvements or facility expansions and their costs necessitated by and attributable to new development in the service area based on the approved land use assumptions.” The capital plan required by the Act functions as a guide to spending impact fee funds on eligible improvements. The updated ten-year capital plan for the expenditure of drainage impact fees is shown in Table 94 below. Impact fees are not committed to any particular project, and not all of the projects will necessarily be completed in the ten-year period. This capital plan will be incorporated into the Component Capital Improvements Plan (CCIP), which is part of the City’s Decade Plan. The CCIP will be amended every two years as part of the regular update of the Decade Plan.
Table 94. Drainage Impact Fee Ten-Year Capital Plan, 2012-2022
Construction Antic. Fee
Project Description Cost Funding
La Cueva Channel Improvements (MAAMDP-C-4), Barstow-Ventura $2,000,000
Misc. System Improvements in the N Albuq Acres Master Drainage Plan $2,800,000
Misc. System Improvements in the Far NE Heights Master Drainage Plan $500,000
Total, Far Northeast Service Area $5,300,000 $5,300,000
Paseo Del Norte Storm Drain Improvements (PMDMP-B and C), Unser-escarpment $4,500,000
Scenic Road Box Culvert Crossin, South of Rainbow $500,000
Universe Blvd Storm Drain Improvements, Ave de Jamito-Boca Negra Dam $2,400,000
Unser Storm Drain Improvements, Rainbow-Paseo $3,500,000
Unser Storm Drain Improvements (PMDMP-A), Paseo-Paradise $4,900,000
North Boca Negra Channel Stabilization (BNMDMP-7) $1,000,000
Cactus Hill Detention Pond (NCDMP-3), Subdivision Pond Outlet $150,000
Ladera Pond (NWMDMP-602.00A), 3-Acre Detention Pond at Ladera and Coors $600,000
Las Ventanas Dam Storm Water Quality Facility $200,000
Misc. Storm Water Quality Features within Regional Drainage Facilities $2,000,000
Total, Northwest Service Area $19,750,000 $19,750,000
Tower Road Storm Drain, Unser-Coors $1,500,000
Powerline ROW Detention Basins (AHDMP-SB1) $2,600,000
Rudolfo Anaya Diversion Channel (AHDMP-SB3), near 98th and Blake $1,800,000
Benevidez Storm Drain System (AHDMP-SV1A & SV1B) $2,500,000
Misc. System Imp. West Mesa NA, from Isleta Watershed Study $3,700,000
Total, Southwest Service Area $12,100,000 $12,100,000
Bank Stabilization on the Tijeras Arroyo within the City Limits (TDMP-3A and 7) $1,000,000
Total, Tijeras Service Area $1,000,000 $1,000,000
Grand Total $38,150,000 $38,150,000
Source: City of Albuquerque Department of Municipal Development, June 21, 2012.

City of Albuquerque, NM FINAL draft
Impact Fee Study 83 September 13, 2012
APPENDIX A: PERSONS PER UNIT
A key input in several of the impact fee calculations is the average number of persons per unit for various housing types in Albuquerque. Persons per unit is the ratio of the number of household residents to the number of total units (including vacant units) of that housing type. The starting point is the 2000 U.S. Census for Albuquerque. The 2000 Census contains information by housing type based on a 1-in-6 sample (16.7%) of housing units. These data are presented in Table 95. The upper portion of the table shows the housing categories proposed for this update. Single-family attached units (townhomes) are proposed to be classified with multi-family. The lower portion of the table shows single-family attached separately, along with other multi-family (i.e., non-single-family attached) and a category that combines single-family detached and attached units. These categories are needed to be able to compare with more recent data, as discussed below.
Table 95. Persons per Unit, 2000 Census
Total Household Persons/
Housing Type Units Population Unit
Single-Family Detached 114,632 295,478 2.58
Multi-Family 75,296 124,339 1.65
Mobile Home 8,653 19,290 2.23
Other 133 190 1.43
Total 198,714 439,297 2.21
Single-Family Attached 12,011 23,173 1.93
Other Multi-family 63,285 101,166 1.60
Multi-Family, 50+ units 18,016 25,236 1.40
Single-Family Detached/Attached 126,643 318,651 2.52 Source: 2000 U.S. Census, City of Albuquerque, SF-3 (1-in-6 sample data).
Starting with the 2010 Census, the Census Bureau no longer collects sample data with the decennial census. Instead, the Bureau conducts annual surveys of 1% of housing units as part of its American Community Survey (ACS). The most current dataset available is a 5% sample, consisting of combined 1% samples for the years 2006-2010. These data combine single-family detached and attached units, as shown in Table 96.
Table 96. Persons per Unit, 2006-2010 ACS
Total Household Persons/
Housing Type Units Population Unit
Single-Family Detached/Attached 158,399 387,609 2.45
Multi-Family 66,885 111,034 1.66
Mobile Home 9,538 23,484 2.46
Other 69 111 1.61
Total 234,891 522,238 2.22 Source: U.S. Census, American Community Survey, City of Albuquerque, weighted 5%
sample data set based on 1% samples for years 2006 through 2010
A side-by-side comparison of average persons per unit from the 2000 Census and the 2006-2010 American Community Survey is provided in Table 97 below. There appears to have been very little change in average persons per unit in Albuquerque since the 2000 Census. The figure for all housing types is virtually unchanged at about 2.22 persons per unit. Unfortunately, it is not possible to directly compare the recommended categories (single-family detached and multi-family including

Appendix A: Persons per Unit
City of Albuquerque, NM Final draft
Impact Fee Study September 13, 2012 84
single-family attached), because the ACS groups single-family attached with single-family detached. The average persons per unit for the combined single-family detached/attached category appears to have declined slightly, while the multi-family category without single-family attached is slightly higher (as is the mobile home category). However, these minor deviations could well be attributed to the smaller sample size and larger margin of error in the ACS data. For example, the largest change is for the mobile home category, but this is based on an ACS sample of less than 500 units, compared to a 2000 Census sample of almost 1,500 units. The larger sample size and the fact that there was no change in overall persons per unit indicate that the 2000 Census data remains the best available source of data on persons per unit for Albuquerque.
Table 97. Persons per Unit Comparison
Housing Type 2000 2006-10
Single-Family Detached 2.58 n/a
Single-Family Detached/Attached 2.52 2.45
Multi-Family 1.65 n/a
Single-Family Attached 1.93 n/a
Non-Single-Family Attached 1.60 1.66
Mobile Home 2.23 2.46
All Housing Types 2.21 2.22
Persons per Unit
Source: 2000 Census data from Table 95; 2006-10 ACS data from Table
96.

City of Albuquerque, NM FINAL draft
Impact Fee Study 85 September 13, 2012
APPENDIX B: FUNCTIONAL POPULATION
The two most common methodologies used in calculating public safety service units and impact fees are the “calls-for-service” approach and the “functional population” approach. This approach is a generally-accepted methodology for these impact fee types and is based on the observation that demand for public safety facilities tends to be proportional to the presence of people at a particular site. Functional population is analogous to the concept of “full-time equivalent” employees. It represents the number of “full-time equivalent” people present at the site of a land use, and it is used for the purpose of determining the impact of a particular development on the need for facilities. For residential development, functional population is simply persons per unit times the percent of time people spend at home. For nonresidential development, functional population is based on a formula that factors trip generation rates, average vehicle occupancy and average number of hours spent by visitors at a land use. While the previous 2004 public safety impact fee study also used functional population, it did not provide the assumptions used. Consequently, it is not possible to determine why the functional population multipliers used in that study differ from the ones calculated in this update. Determining residential functional population multipliers is considerably simpler than the nonresidential component. It is estimated that people, on average, spend 16 hours, or 67 percent, of each 24-hour day at their place of residence and the other 33 percent away from home. A similar approach is used for the hotel/motel category. The functional population per unit for these uses is shown in Table 98.
Table 98. Residential Functional Population Multipliers
Average Occupancy Func.
Housing Type Unit Occupancy Rate Pop./Unit
Single-Family Det. (average) Dwelling 2.58 0.67 1.73
Multi-Family (All) Dwelling 1.65 0.67 1.11
Multi-Family, 50+units Dwelling 1.40 0.67 0.94
Mobile Home Dwelling 2.23 0.67 1.49
Hotel/Motel Room 1.57 0.67 1.05 Source: Average occupancy (persons per unit) from Table 95; residential occupancy factor
assumed; hotel/motel room occupancy based on one-half of average vehicle occupancy on vacation
trips from U.S. Department of Transportation, National Household Travel Survey, 2009.
The functional population methodology for nonresidential land uses is based on trip generation data utilized in developing the transportation demand schedule prepared for the updated transportation impact fee update. Functional population per 1,000 square feet is derived by dividing the total number of hours spent by employees and visitors during a week day by 24 hours. Employees are estimated to spend 8 hours per day at their place of employment, and visitors are estimated to spend one hour per visit. The formula used to derive the nonresidential functional population estimates is summarized in Figure 14.
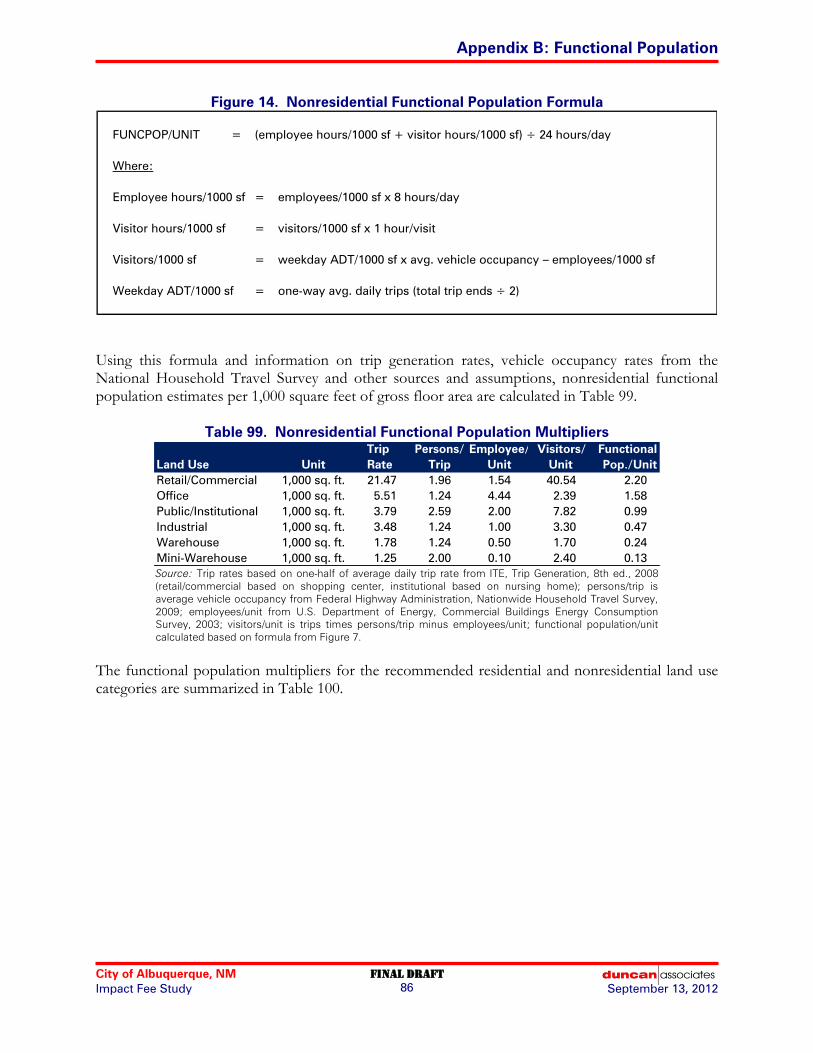
Appendix B: Functional Population
City of Albuquerque, NM Final draft
Impact Fee Study September 13, 2012 86
Figure 14. Nonresidential Functional Population Formula
FUNCPOP/UNIT = (employee hours/1000 sf + visitor hours/1000 sf) ÷ 24 hours/day
Where:
Employee hours/1000 sf = employees/1000 sf x 8 hours/day
Visitor hours/1000 sf = visitors/1000 sf x 1 hour/visit
Visitors/1000 sf = weekday ADT/1000 sf x avg. vehicle occupancy – employees/1000 sf
Weekday ADT/1000 sf = one-way avg. daily trips (total trip ends ÷ 2)
Using this formula and information on trip generation rates, vehicle occupancy rates from the National Household Travel Survey and other sources and assumptions, nonresidential functional population estimates per 1,000 square feet of gross floor area are calculated in Table 99.
Table 99. Nonresidential Functional Population Multipliers
Trip Persons/ Employee/ Visitors/ Functional
Land Use Unit Rate Trip Unit Unit Pop./Unit
Retail/Commercial 1,000 sq. ft. 21.47 1.96 1.54 40.54 2.20
Office 1,000 sq. ft. 5.51 1.24 4.44 2.39 1.58
Public/Institutional 1,000 sq. ft. 3.79 2.59 2.00 7.82 0.99
Industrial 1,000 sq. ft. 3.48 1.24 1.00 3.30 0.47
Warehouse 1,000 sq. ft. 1.78 1.24 0.50 1.70 0.24
Mini-Warehouse 1,000 sq. ft. 1.25 2.00 0.10 2.40 0.13 Source: Trip rates based on one-half of average daily trip rate from ITE, Trip Generation, 8th ed., 2008
(retail/commercial based on shopping center, institutional based on nursing home); persons/trip is
average vehicle occupancy from Federal Highway Administration, Nationwide Household Travel Survey,
2009; employees/unit from U.S. Department of Energy, Commercial Buildings Energy Consumption
Survey, 2003; visitors/unit is trips times persons/trip minus employees/unit; functional population/unit
calculated based on formula from Figure 7.
The functional population multipliers for the recommended residential and nonresidential land use categories are summarized in Table 100.

Appendix B: Functional Population
City of Albuquerque, NM Final draft
Impact Fee Study September 13, 2012 87
Table 100. Functional Population Multipliers
Functional
Land Use Unit Pop./Unit
Single-Family Detached (average) Dwelling 1.73
Multi-Family (All) Dwelling 1.11
Multi-Family, 50+units Dwelling 0.94
Mobile Home/RV Park Space 1.49
Hotel/Motel Room 1.05
Retail/Commercial 1,000 sq. ft. 2.20
Office 1,000 sq. ft. 1.58
Public/Institutional 1,000 sq. ft. 0.99
Industrial 1,000 sq. ft. 0.47
Warehouse 1,000 sq. ft. 0.24
Mini-Warehouse 1,000 sq. ft. 0.13 Source: Residential dwelling unit functional population per unit from
Table 98; nonresidential functional population per unit from Table 99.
The total existing and projected functional population for the city is determined by multiplying the existing and projected units of development for each land use category from the land use assumptions by the functional population multiplier for that land use, and summing for all land use categories. The results are displayed in Table 101.
Table 101. Functional Population, 2012-2022
Land Use Unit Units per Unit Total
Single-Family Detached/MH, 2012 Dwelling 158,811 1.73 274,743
Multi-Family, 2012 Dwelling 82,143 1.11 91,179
Retail/Commercial, 2012 1,000 sq. ft. 37,847 2.20 83,263
Office, 2012 1,000 sq. ft. 29,040 1.58 45,883
Public/Institutional, 2012 1,000 sq. ft. 27,511 0.99 27,236
Industrial/Warehouse, 2012 1,000 sq. ft. 66,896 0.36 24,083
Total, 2012 Functional Population 546,387
Single-Family Detached/MH, 2022 Dwelling 172,785 1.73 298,918
Multi-Family, 2022 Dwelling 88,090 1.11 97,780
Retail/Commercial, 2022 1,000 sq. ft. 43,270 2.20 95,194
Office, 2022 1,000 sq. ft. 32,548 1.58 51,426
Public/Institutional, 2022 1,000 sq. ft. 33,398 0.99 33,064
Industrial/Warehouse, 2022 1,000 sq. ft. 72,393 0.36 26,061
Total, 2022 Functional Population* 602,443
Functional Population Growth, 2012-2022* 56,056
Functional Population
* excludes growth in Mesa del Sol, which is exempt from impact fees
Source: Units of development from Table 11 (housing) and Table 15 (nonresidential);
functional population multipliers from Table 100 (industrial/warehouse is average of
industrial and warehouse).

City of Albuquerque, NM FINAL draft
Impact Fee Study 88 September 13, 2012
APPENDIX C: OUTSTANDING DEBT
Table 102. Summary of Outstanding Debt
Year Total
Bond Issue Issued Bond Issue Streets Parks Open Sp. Trails Fire Police
2001 Authorized $116,558,343 $15,851,000 $8,796,000 $1,500,000 $15,000 $1,560,000 $250,000
2001 Issued 2003 $81,805,000 $11,124,824 $6,173,361 $1,052,756 $10,528 $1,094,866 $175,459
2001 Outstanding $5,230,000 $711,238 $394,679 $67,305 $673 $69,998 $11,218
2003 Authorized $93,884,597 $0 $16,827,000 $1,639,000 $0 $1,318,000 $2,511,400
2003 Issued 2005 $90,595,000 $0 $16,237,403 $1,581,572 $0 $1,271,819 $2,423,404
2003 Outstanding $22,480,000 $0 $4,029,106 $392,447 $0 $315,586 $601,337
2005 Authorized $43,045,000 $8,622,400 $3,200,000 $2,200,000 $1,080,000 $0 $400,000
2005 Issued 2007 $43,045,000 $8,622,400 $3,200,000 $2,200,000 $1,080,000 $0 $400,000
2005 Outstanding $21,645,000 $4,335,738 $1,609,107 $1,106,261 $543,074 $0 $201,138
2007 Authorized $39,000,000 $6,485,000 $5,100,000 $1,300,000 $300,000 $0 $2,100,000
2007 Issued A 2008 $39,000,000 $6,485,000 $5,100,000 $1,300,000 $300,000 $0 $2,100,000
2007 Outstanding $24,675,000 $4,103,010 $3,226,731 $822,500 $189,808 $0 $1,328,654
2007 Authorized $54,970,000 $4,115,000 $8,120,000 $2,360,000 $850,000 $0 $1,005,000
2007 Issued B 2009 $54,970,000 $4,115,000 $8,120,000 $2,360,000 $850,000 $0 $1,005,000
2007 Outstanding $42,750,000 $3,200,223 $6,314,899 $1,835,365 $661,042 $0 $781,585
2009 Authorized $135,000,000 $12,165,000 $18,200,000 $2,935,000 $150,000 $0 $3,393,113
2009 Issued 2011 $135,000,000 $12,165,000 $18,200,000 $2,935,000 $150,000 $0 $3,393,113
2009 Outstanding $128,400,000 $11,570,267 $17,310,222 $2,791,511 $142,667 $0 $3,227,227
Total Outstanding $245,180,000 $23,920,476 $32,884,744 $7,015,389 $1,537,264 $385,584 $6,151,159
Impact Fee Eligible Projects
Source: Total bond amounts authorized, issued and outstanding from Table 103; impact fee-eligible project authorized amounts by
facility type from Table 104 through Table 109; for 2001 and 2003 bonds, where bond amounts issued were less than authorized, issued
amounts were reduced proportionately for all facility types; outstanding amounts by facility type based on ratio of outstanding to issued
amounts for the entire bond package.
Table 103. Outstanding Non-Stormwater GO Bonds
Bond Issue Original Outstanding
2001 Authorized $116,558,343 n/a
2001, Issued July 2003 $81,805,000 $5,230,000
2003 Authorized $93,884,597 n/a
2003, Issued June 2005 $90,595,000 $22,480,000
2005, Issued September 2007 $43,045,000 $21,645,000
2007, Issued June 2008 $39,000,000 $24,675,000
2007, Issued June 2009 $54,970,000 $42,750,000
2009, Issued January 2011 $135,000,000 $128,400,000 Source: City of Albuquerque Finance Department, January 16, 2012.

Appendix C: Outstanding Debt
City of Albuquerque, NM Final draft
Impact Fee Study September 13, 2012 89
Table 104. 2001 Bond Project Authorizations
Project Description Total Eligible
Relocation of Fire Station 5* $2,000,000 $1,560,000
Rehabilitation of Fire Department Facilities $250,000 $0
Allocation for Art/Fire $42,000 $0
Allocation for Art/Admin/Fire $10,500 $0
Fire Total $2,302,500 $1,560,000
Shawn McWethy Police Substation $250,000 $250,000
Allocation for Art $42,000 $0
Allocation for Art/Admin $10,500 $0
Police Total $302,500 $250,000
Swimming Pool Renovation $3,000,000 $0
West Mesa Aquatic Center $250,000 $125,000
Recreation Facility Improvements and Renovations $300,000 $0
Park and Playground Equipment Renovation $5,000,000 $0
Neighborhood Park Development $1,000,000 $1,000,000
Community and Regional Park Development $6,414,000 $6,414,000
Parks and Recreation Building Improvements $500,000 $0
Land Acquisition - Parks $100,000 $100,000
Tennis Center Jerry Cline, Phase 1 $150,000 $0
Recreational Shelter $50,000 $0
Tiguex Park Playground $150,000 $0
New Play Equipment for 4-H Park $200,000 $0
Quality of Life Improvements at Hoffmantown Park $80,000 $0
New Play Equipment for Graves Park $120,000 $0
Spruce Park Playground Equipment Addition $100,000 $0
Mini Skate Park and Shade Trees at New Stage $100,000 $0
Bellehaven Neighborhood Park $120,000 $0
Recreation Amenities (Play Structure) $150,000 $150,000
Columbus Park Shade and Shelter Structure $40,000 $0
Tennis Court Enhancement $50,000 $0
Pat Hurley Skate Park $100,000 $0
Park Tables and Benches $15,000 $0
Cibola High School Pool $250,000 $0
Westgate Pool $250,000 $0
West Mesa Aquatic Center Development $250,000 $125,000
Rio Grande Swimming Pool $300,000 $0
Kirtland Park $200,000 $0
Vineyard Estates Park $170,000 $170,000
Tennis Courts at Arroyo del Oso Park $150,000 $0
North Domingo Baca Park and Community Center $580,000 $580,000
Playground Equipment and Fencing $100,000 $0
Tall Tree Replacement $10,000 $0
Wilson Tennis Court Resurfacing and Improvements $50,000 $0
District 6 Park Amenity Improvements $100,000 $0
Volleyball Courts at Phil Chacon Park $100,000 $0
Phil Chacon Park Lighting $125,000 $0 * new 10,000 sq. ft. station replaced old 2,200 sq. ft. station

Appendix C: Outstanding Debt
City of Albuquerque, NM Final draft
Impact Fee Study September 13, 2012 90
Table 104. Continued
Project Description Total Eligible
Sand Volleyball in District 8 $50,000 $0
Manzano Mesa Park Development $106,000 $106,000
Singing Arrow Park $15,000 $0
La Luz de Amistad Park $25,000 $0
Zia Little League Facility Improvements $21,000 $21,000
Mile High Little League Field Improvements $20,000 $0
Volleyball Court in District 9 $5,000 $5,000
Arbolera de Vida Community Plaza / Park $40,000 $0
Allocation for Art $182,848 $0
Allocation for Art/Admin $45,712 $0
Parks Total $21,134,560 $8,796,000
Open Space Facility Renovations $500,000 $0
Open Space Building Facilities $1,000,000 $1,000,000
Rio Grande Valley State Park/Bosque Action Plan $250,000 $250,000
Open Space Land Acquisition & Protection $250,000 $250,000
Open Space Total $2,000,000 $1,500,000
Urban Trail Development $15,000 $15,000
Trail Renovation, Planning and Development $500,000 $0
Repair Existing Trails $150,000 $0
Tramway Bike Trail Rehab. and Enhancements $100,000 $0
Trails Total $765,000 $15,000
Major Paving Rehab. $5,900,000 $0
Gibson Reconstruction $3,000,000 $0
North West Arterials $1,250,000 $1,250,000
Bridge Repair $500,000 $0
Intersection Signalization $1,500,000 $1,500,000
Safety & Intersection Improvements $1,110,100 $0
Reconstruct Major Intersections $1,500,000 $0
Reconstruct Major Streets $1,500,000 $0
Advance Right-of-way Acquisition $500,000 $500,000
Advance Transportation Planning and Engineering $750,000 $750,000
Sidewalk Improvements $1,000,000 $0
Street Lighting $500,000 $0
Public Works Funding $1,000,000 $0
Traffic Sign Replacement/Pavement Markings $100,000 $0
Signal Control Expansion/ Synchronization $450,000 $450,000
Zoo Access $1,000,000 $0
Eubank Boulevard South $4,500,000 $4,500,000
Second Street $250,000 $250,000
Unser Boulevard Extension $2,000,000 $2,000,000
Neighborhood Traffic Improvements $200,000 $0
Railroad Crossing Improvements $200,000 $200,000
SAD (Special Assessment District) Program $500,000 $0
98th Street $750,000 $750,000

Appendix C: Outstanding Debt
City of Albuquerque, NM Final draft
Impact Fee Study September 13, 2012 91
Table 104. Continued
Project Description Total Eligible
Alameda Boulevard $750,000 $750,000
Unser Boulevard Corridor Study $250,000 $250,000
McMahon Boulevard Extension $300,000 $300,000
Infill/Community Vitality Projects $3,000,000 $0
Bikeways within Roadways $1,857,000 $0
Valley Pool Road $100,000 $100,000
North Valley Sidewalks $200,000 $200,000
Speedhumps - District 2 $75,000 $0
Unser Road $300,000 $300,000
Median Landscaping - Comanche, Eubank to Morris $400,000 $0
Speedhumps in District 7 $35,000 $0
Uptown Loop Road $50,000 $50,000
Pedestrian Improvements at Juan Tabo North of $50,000 $0
Sidewalk S side of Lomas, E of Manzano High School $16,000 $0
NTMP / CPTED Projects in District 5 $100,000 $100,000
CIP Overhead $80,000 $0
Los Candelarias Village Center $650,000 $650,000
International Marketplace $750,000 $750,000
Crime Prevention through Env Design (CPTED) $200,000 $0
International Market Streetscape $150,000 $0
North Valley Village Center $150,000 $150,000
West Central Facade Improvements $40,000 $0
Copper Ave Beautification/Neighborhood Protection $40,000 $0
City-wide Median Landscape Improvements $2,450,000 $0
Renewing the Streetscape of Silver Hill $60,000 $0
Dr. Martin Luther King, Jr. Avenue Streetscape Imp $300,000 $0
E. Central Stscp., Girard to San Mateo $300,000 $0
Landscaping Lomas $35,000 $0
12th Street Renewal Project $300,000 $0
Sidewalk, W.C. Ramps and Irrigation $25,000 $0
PANA Neighborhood Improvement Program $30,000 $0
Zuni SE, Median Landscaping $300,000 $0
Montgomery Medians Landscaping, Wyoming- $300,000 $0
PRORA Sidewalks Project $90,000 $0
Feasibility Studies $101,000 $101,000
District 3 Landscaping $145,000 $0
Median Landscaping - Design and Development $100,000 $0
Median Landscaping Construction $100,000 $0
Median Landscaping San Mateo, Central-Constitution $390,000 $0
Street Lighting - Nob Hill on Central $275,000 $0
Median Landscaping - Wyoming, Indian School-Mont. $500,000 $0
Median Landscaping on Spain $150,000 $0
Median Landscaping on Juan Tabo North of $150,000 $0
Median Landscaping on Eubank, N of Spain to Juan $100,000 $0
Median Landscaping on Candelaria East of Juan Tabo $100,000 $0
Median Landscaping on Lomas $300,000 $0
Allocation for Art $384,553 $0
Allocation for Art/Admin $96,138 $0
Roads Total $46,584,791 $15,851,000 Source: Total amounts authorized from City of Albuquerque Finance Department, January 16,
2012; impact-fee eligible amounts by Duncan Associates based on project descriptions.

Appendix C: Outstanding Debt
City of Albuquerque, NM Final draft
Impact Fee Study September 13, 2012 92
Table 105. 2003 Bond Project Authorizations
Project Description Total Eligible
Fire Station 1 Renovation $150,000 $0
Fire Station 10 Renovation $100,000 $0
Fire Station 12 Renovation $150,000 $0
Fire Station 16 $58,000 $58,000
Fire Station 2 Renovation $150,000 $0
Fire Station 4 Renovation $150,000 $0
Heavy Technical Rescue Vehicle $0 $0
Fire Station 5 $325,000 $325,000
New Fire Station 21 $850,000 $850,000
Station Renovation and Rehabilitation $735,000 $0
Allocation for Art/Admin $45,252 $0
Allocation for Art/Admin/Fire $11,313 $0
Apparatus Replacement $3,230,000 $0
Technical Services Enhancements $85,000 $85,000
Fire Total $6,039,565 $1,318,000
John Carrillo Memorial Substation (NE) $67,000 $67,000
Police Area Command Renovation $500,000 $500,000
Police Stations $84,000 $84,000
Public Safety Enhancements $134,000 $0
Renovation of Old Police Main Facility: Phase 1 $959,000 $0
Sixth Area Command Phase 1 $870,000 $870,000
Allocation for Art/Police $64,288 $0
Allocation for Art/Admin/Police $16,072 $0
Marked Police Vehicles* $5,791,000 $890,400
Police Department $100,000 $100,000
Police Total $8,585,360 $2,511,400
Albuquerque Southwest Velodrome $1,964,000 $0
Alvarado Park $70,000 $0
Desert Springs Park $150,000 $150,000
East Atrisco Park $150,000 $150,000
Indoor Running Track $500,000 $0
Lavaland Park $150,000 $0
Linear Park $250,000 $250,000
Little League Improvements $55,000 $0
Little Leagues in District 9 $30,000 $30,000
Los Altos Park and Garden Center $75,000 $0
Los Altos Pool $35,000 $0
Los Angeles Landfill Rehabilitation (LALF) $1,500,000 $0
McCollum Elementary $30,000 $0
Miscellaneous Facilities $175,000 $0
Modular Skate Park Facilities $1,200,000 $1,200,000
Old Town Plaza Improvements $20,000 $0
Park Development $3,589,000 $3,589,000
Park Improvements $75,000 $0
Park Improvements $300,000 $0 * percentage non-replacement based on 15.4% growth in sworn officers from Sept. 1999-Sept. 2005.

Appendix C: Outstanding Debt
City of Albuquerque, NM Final draft
Impact Fee Study September 13, 2012 93
Table 105. Continued
Project Description Total Eligible
Park Improvements, Amenities and Rehabilitation $380,000 $0
Park Water Conservation $2,000,000 $0
Park Way Park $25,000 $25,000
Parks in District 9 $165,000 $0
Parks / Neighborhood Association Improvements $200,000 $0
Regional Park Development - Veterans Memorial Park $6,300,000 $6,300,000
Rinconada Park $150,000 $150,000
Rio Grande Bosque Restoration $1,000,000 $0
Roadrunner Little League/Hahn Park Property Acquisition $100,000 $100,000
Soccer Fields at Ventana Ranch $183,000 $183,000
Tiguex Park - Tricentennial Celebration $1,133,000 $0
Tower Park $150,000 $150,000
Vineyard Estates Park $200,000 $200,000
West Mesa Aquatic Center Phase 2 $4,500,000 $2,250,000
Westgate Community Park $150,000 $150,000
Westside Skate Park $1,950,000 $1,950,000
Allocation for Art/Parks & Recreation $236,158 $0
Allocation for Art/Admin/Parks & Recreation $59,039 $0
Civic Plaza Stage $20,000 $0
Park Mgmt.: Field Equip & Vehicle Rep. Set-Aside $540,000 $0
Park Mgmt.: Large Vehicles Set-Aside $450,000 $0
Recreation: Vehicle Replacement Set-Aside $200,000 $0
Parks Total $30,409,197 $16,827,000
Manzano Open Space and Four Hills $150,000 $150,000
Open Space Acquisition and Protection $1,489,000 $1,489,000
Open Space: Vehicle Replacement Set-Aside $500,000 $0
Open Space Total $2,139,000 $1,639,000 Source: Total amounts authorized from City of Albuquerque Finance Department, January 16, 2012;
impact-fee eligible amounts by Duncan Associates based on project descriptions.

Appendix C: Outstanding Debt
City of Albuquerque, NM Final draft
Impact Fee Study September 13, 2012 94
Table 106. 2005 Bond Project Authorizations
Project Description Total Eligible
Sixth Area Command $400,000 $400,000
1% for Public Art $52,000 $0
1% for Public Art-Administration $13,000 $0
Police Total $465,000 $400,000
Albuquerque Tennis Complex $300,000 $0
Bosque Restoration and Revitalization $200,000 $0
Facility Improvements and Equipment - District 2 $150,000 $0
Los Altos Park – District 9 $50,000 $50,000
Neighborhood Park Development $1,500,000 $1,500,000
Park Improvements and Amenities - District 1 $650,000 $650,000
Park Improvements and Amenities - District 2 $400,000 $0
Park Improvements and Amenities - District 3 $201,000 $0
Park Improvements and Amenities - District 4 $506,000 $0
Park Improvements and Amenities - District 5 $500,000 $500,000
Park Improvements and Amenities - District 6 $301,500 $0
Park Improvements and Amenities - District 7 $500,000 $0
Park Improvements and Amenities - District 8 $200,000 $0
Park Improvements - District 9 $300,000 $0
Park Renovation: Water Conservation $1,500,000 $0
Pat Hurley Park, Phase 2 - Hillside Development $500,000 $500,000
Roosevelt Park $1,000,000 $0
Softball Field Renovation $500,000 $0
Swimming Pool Renovation $1,065,000 $0
Tennis Court Improvements $150,000 $0
1% for Public Art $242,988 $0
1% for Public Art-Administration $60,747 $0
Parks Total $10,777,235 $3,200,000
Improvements to Paths and Trails (Open Space) - District 8 $50,000 $50,000
Open Space Facility Renovation $200,000 $0
Open Space Land Acquisition $2,150,000 $2,150,000
Open Space Total $2,400,000 $2,200,000
Trails and Bikeways $1,080,000 $1,080,000
Advance Right-of-Way Acquisition (Streets) $400,000 $400,000
Advance Trans. Planning & Eng. (Streets) $600,000 $600,000
Albuquerque Traffic Management System $320,000 $320,000
Atrisco Drive $360,000 $360,000
Bridge Repair $160,000 $0
Coors / I-40 Improvements $800,000 $800,000
Eubank Boulevard North Widening $720,000 $720,000
Louisiana Boulevard Widening $200,000 $200,000
Major Paving Rehabilitation $3,840,000 $0
Median Landscaping, Sidewalks, & Interstate Enhancements $5,221,503 $0
Median Renovation: Water Conservation $600,000 $0
Neighborhood Enhancements - District 7 $240,000 $0

Appendix C: Outstanding Debt
City of Albuquerque, NM Final draft
Impact Fee Study September 13, 2012 95
Table 106. Continued
Project Description Total Eligible
Neighborhood Improvements / Enhancements - District 6 $282,800 $0
NW Arterial Roadway Improvements $800,000 $800,000
Public Works Funding (Streets) $360,000 $0
Reconstruction Major Intersections $1,200,000 $0
Reconstruction Major Streets $1,200,000 $0
Safety & Intersection Improvements $296,000 $0
Sidewalk / Street Improvements - District 6 $68,000 $68,000
Street Projects - District 1 $240,000 $240,000
Street Projects - District 2 $280,000 $280,000
Street Projects - District 3 $499,200 $499,200
Street Projects - District 4 $383,200 $383,200
Street Projects - District 5 $400,000 $400,000
Street Projects - District 8 $552,000 $552,000
Street Projects - District 9 $400,000 $400,000
SW Arterial Roadway Improvements $800,000 $800,000
Unser Boulevard North, Central to County Line $800,000 $800,000
1% for Public Art $250,250 $0
1% for Public Art-Administration $62,562 $0
Roads Total $22,335,515 $8,622,400 Source: Total amounts authorized from City of Albuquerque Finance Department, January 16, 2012;
impact-fee eligible amounts by Duncan Associates based on project descriptions.

Appendix C: Outstanding Debt
City of Albuquerque, NM Final draft
Impact Fee Study September 13, 2012 96
Table 107. 2007 Series A Bond Project Authorizations
Project Description Total Eligible
Fire Station Rehab. $100,000 $0
Fire Total $100,000 $0
Sixth Area Command & Headquarters $2,095,000 $2,095,000
Shawn McWethey Sub Station $5,000 $5,000
District 7, APD Facilities Renov. / Upgrade $100,000 $0
Police Total $2,300,000 $2,100,000
Community Park Development $1,000,000 $1,000,000
Neighborhood Park Development $200,000 $200,000
Pat Hurley Park $1,200,000 $1,200,000
Park Imp. & Amenities, District 8 $50,000 $0
East Gateway Park (La Luz de Amistad Park) $200,000 $0
Ventana Ranch Regional Park $500,000 $500,000
Dog Park in District 7 $50,000 $0
Vista de Estrella Park $200,000 $200,000
North Domingo Baca Park $1,200,000 $1,200,000
Swimming Pool Facility Development & Renov. $900,000 $0
Park Renov., Water Conserv., Tree & Amenity Replacement $900,000 $0
Recreation Facility Renov. $300,000 $0
Shooting Range Park Imp. $300,000 $0
Bosque Restoration & Revitalization $100,000 $0
Jerry Cline Recreation Center $350,000 $350,000
District 1, Park Imp. & Amenities $150,000 $150,000
District 2, Park Imp. & Amenities $200,000 $0
District 3, Park Imp. & Amenities $100,000 $0
District 4, Park Imp. & Amenities $500,000 $0
District 5, Ventana Ranch Regional Park $300,000 $300,000
District 6, Park Imp. & Amenities $150,000 $0
District 6, Shooting Range Park $25,000 $0
District 7, Park Imp. & Amenities $225,000 $0
District 8, Park Imp. & Amenities $250,000 $0
District 9, Park Imp. & Amenities $250,000 $0
Parks Total $10,900,000 $5,100,000
Tijeras Canyon Open Space Acquisition $100,000 $100,000
Open Space Land Acquisition, Fencing, & Protection $1,185,000 $1,185,000
Petroglyph National Monument Trails Management Plan $15,000 $15,000
Open Space Total $1,300,000 $1,300,000
Trails & Bikeways $300,000 $300,000
Fourth Street Corridor Imp. $250,000 $250,000
West Central MRA Proj. $100,000 $100,000
Reconstruction of Lead & Coal Avenues - Council District 6 $150,000 $0
Reconstruction of Lead & Coal Avenues $150,000 $0
Reconstruction Major Streets $700,000 $0
Reconstruction Major Intersections $700,000 $0
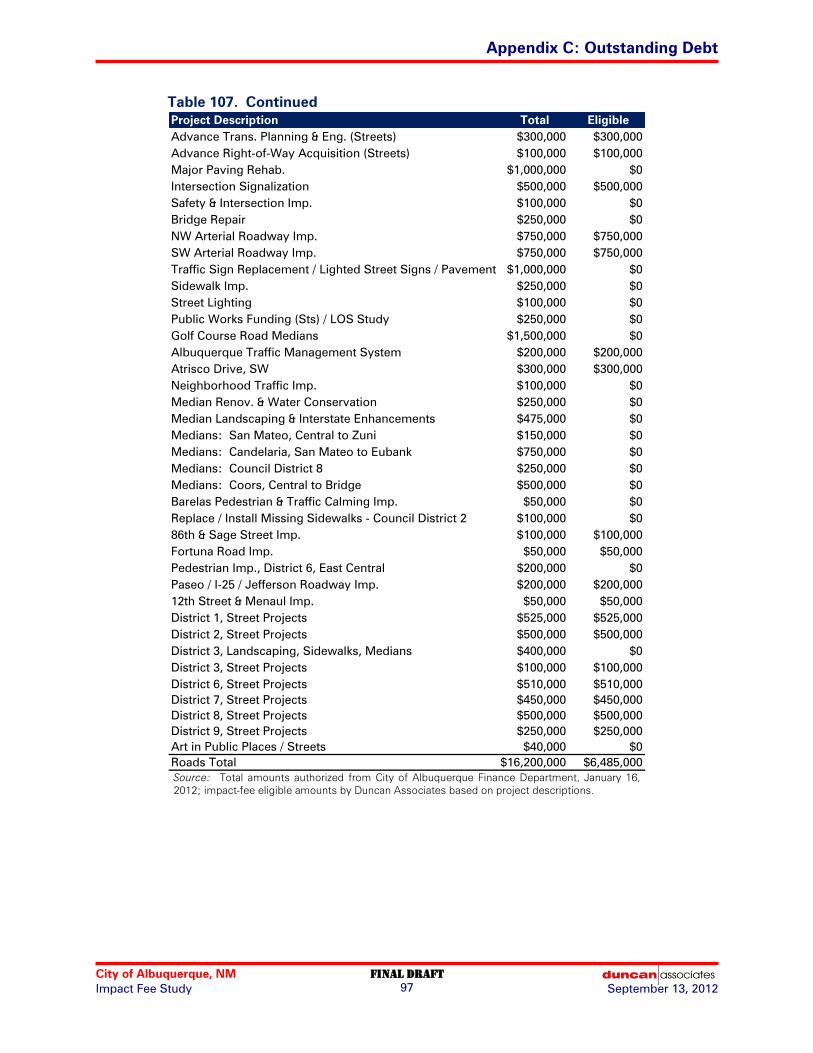
Appendix C: Outstanding Debt
City of Albuquerque, NM Final draft
Impact Fee Study September 13, 2012 97
Table 107. Continued
Project Description Total Eligible
Advance Trans. Planning & Eng. (Streets) $300,000 $300,000
Advance Right-of-Way Acquisition (Streets) $100,000 $100,000
Major Paving Rehab. $1,000,000 $0
Intersection Signalization $500,000 $500,000
Safety & Intersection Imp. $100,000 $0
Bridge Repair $250,000 $0
NW Arterial Roadway Imp. $750,000 $750,000
SW Arterial Roadway Imp. $750,000 $750,000
Traffic Sign Replacement / Lighted Street Signs / Pavement Markings $1,000,000 $0
Sidewalk Imp. $250,000 $0
Street Lighting $100,000 $0
Public Works Funding (Sts) / LOS Study $250,000 $0
Golf Course Road Medians $1,500,000 $0
Albuquerque Traffic Management System $200,000 $200,000
Atrisco Drive, SW $300,000 $300,000
Neighborhood Traffic Imp. $100,000 $0
Median Renov. & Water Conservation $250,000 $0
Median Landscaping & Interstate Enhancements $475,000 $0
Medians: San Mateo, Central to Zuni $150,000 $0
Medians: Candelaria, San Mateo to Eubank $750,000 $0
Medians: Council District 8 $250,000 $0
Medians: Coors, Central to Bridge $500,000 $0
Barelas Pedestrian & Traffic Calming Imp. $50,000 $0
Replace / Install Missing Sidewalks - Council District 2 $100,000 $0
86th & Sage Street Imp. $100,000 $100,000
Fortuna Road Imp. $50,000 $50,000
Pedestrian Imp., District 6, East Central $200,000 $0
Paseo / I-25 / Jefferson Roadway Imp. $200,000 $200,000
12th Street & Menaul Imp. $50,000 $50,000
District 1, Street Projects $525,000 $525,000
District 2, Street Projects $500,000 $500,000
District 3, Landscaping, Sidewalks, Medians $400,000 $0
District 3, Street Projects $100,000 $100,000
District 6, Street Projects $510,000 $510,000
District 7, Street Projects $450,000 $450,000
District 8, Street Projects $500,000 $500,000
District 9, Street Projects $250,000 $250,000
Art in Public Places / Streets $40,000 $0
Roads Total $16,200,000 $6,485,000 Source: Total amounts authorized from City of Albuquerque Finance Department, January 16,
2012; impact-fee eligible amounts by Duncan Associates based on project descriptions.
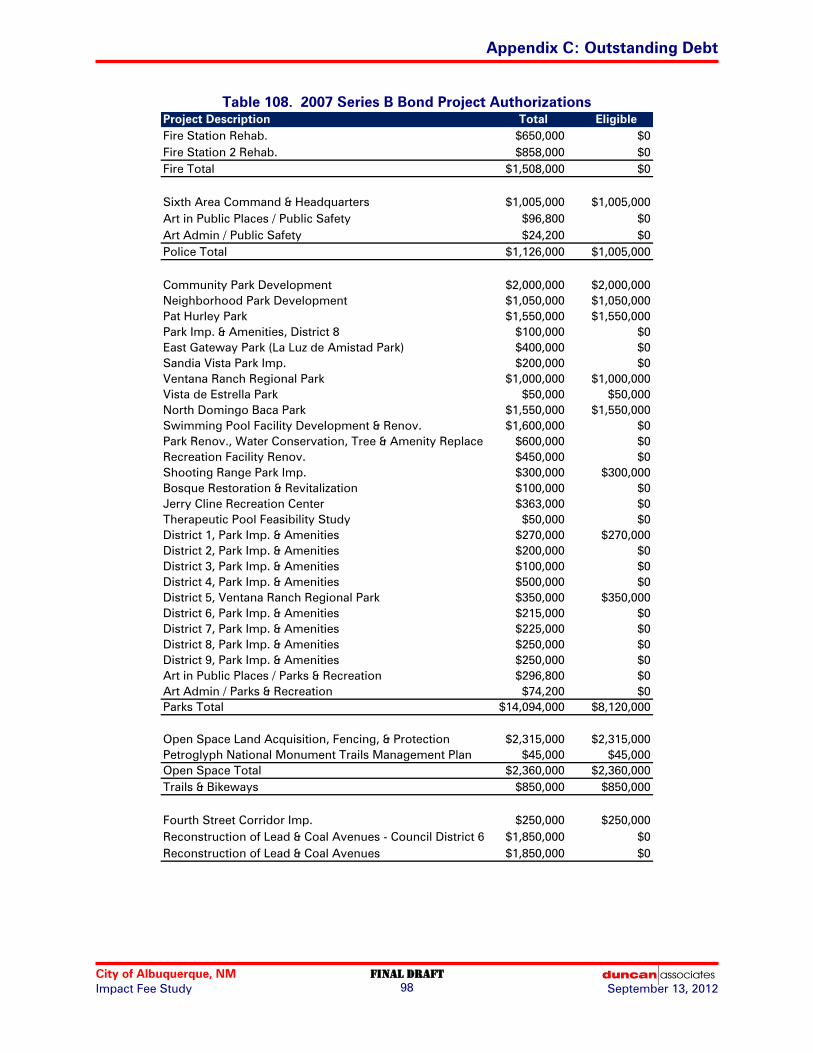
Appendix C: Outstanding Debt
City of Albuquerque, NM Final draft
Impact Fee Study September 13, 2012 98
Table 108. 2007 Series B Bond Project Authorizations
Project Description Total Eligible
Fire Station Rehab. $650,000 $0
Fire Station 2 Rehab. $858,000 $0
Fire Total $1,508,000 $0
Sixth Area Command & Headquarters $1,005,000 $1,005,000
Art in Public Places / Public Safety $96,800 $0
Art Admin / Public Safety $24,200 $0
Police Total $1,126,000 $1,005,000
Community Park Development $2,000,000 $2,000,000
Neighborhood Park Development $1,050,000 $1,050,000
Pat Hurley Park $1,550,000 $1,550,000
Park Imp. & Amenities, District 8 $100,000 $0
East Gateway Park (La Luz de Amistad Park) $400,000 $0
Sandia Vista Park Imp. $200,000 $0
Ventana Ranch Regional Park $1,000,000 $1,000,000
Vista de Estrella Park $50,000 $50,000
North Domingo Baca Park $1,550,000 $1,550,000
Swimming Pool Facility Development & Renov. $1,600,000 $0
Park Renov., Water Conservation, Tree & Amenity Replace $600,000 $0
Recreation Facility Renov. $450,000 $0
Shooting Range Park Imp. $300,000 $300,000
Bosque Restoration & Revitalization $100,000 $0
Jerry Cline Recreation Center $363,000 $0
Therapeutic Pool Feasibility Study $50,000 $0
District 1, Park Imp. & Amenities $270,000 $270,000
District 2, Park Imp. & Amenities $200,000 $0
District 3, Park Imp. & Amenities $100,000 $0
District 4, Park Imp. & Amenities $500,000 $0
District 5, Ventana Ranch Regional Park $350,000 $350,000
District 6, Park Imp. & Amenities $215,000 $0
District 7, Park Imp. & Amenities $225,000 $0
District 8, Park Imp. & Amenities $250,000 $0
District 9, Park Imp. & Amenities $250,000 $0
Art in Public Places / Parks & Recreation $296,800 $0
Art Admin / Parks & Recreation $74,200 $0
Parks Total $14,094,000 $8,120,000
Open Space Land Acquisition, Fencing, & Protection $2,315,000 $2,315,000
Petroglyph National Monument Trails Management Plan $45,000 $45,000
Open Space Total $2,360,000 $2,360,000
Trails & Bikeways $850,000 $850,000
Fourth Street Corridor Imp. $250,000 $250,000
Reconstruction of Lead & Coal Avenues - Council District 6 $1,850,000 $0
Reconstruction of Lead & Coal Avenues $1,850,000 $0

Appendix C: Outstanding Debt
City of Albuquerque, NM Final draft
Impact Fee Study September 13, 2012 99
Table 108. Continued
Project Description Total Eligible
Reconstruction Major Streets $800,000 $0
Reconstruction Major Intersections $800,000 $0
Major Paving Rehab. $4,500,000 $0
Intersection Signalization $575,000 $575,000
Safety & Intersection Imp. $400,000 $0
Bridge Repair $250,000 $0
NW Arterial Roadway Imp. $750,000 $750,000
SW Arterial Roadway Imp. $750,000 $750,000
Traffic Sign Replace/Lighted St Signs/Pavement Markings $1,000,000 $0
Atrisco Drive, SW $300,000 $300,000
Neighborhood Traffic Imp. $150,000 $0
Median Renov. & Water Conservation $250,000 $0
Median Landscaping & Interstate Enhancements $1,550,000 $0
Medians: Wyoming, Paseo del Norte to Burlison $750,000 $0
Medians: Central, Tramway to Eubank $625,000 $0
Medians: Council District 8 $250,000 $0
Barelas Pedestrian & Traffic Calming Imp. $200,000 $0
86th & Sage Street Imp. $650,000 $650,000
72nd & Ladera Landscaping $150,000 $0
Fortuna Road Imp. $450,000 $450,000
Pedestrian Imp., District 6, East Central $800,000 $0
Paseo / I-25 / Jefferson Roadway Imp. $50,000 $50,000
12th Street & Menaul Imp. $340,000 $340,000
Art in Public Places / Streets $318,400 $0
Art Admin / Streets $89,600 $0
Roads Total $20,698,000 $4,115,000 Source: Total amounts authorized from City of Albuquerque Finance Department, January 16,
2012; impact-fee eligible amounts by Duncan Associates based on project descriptions.
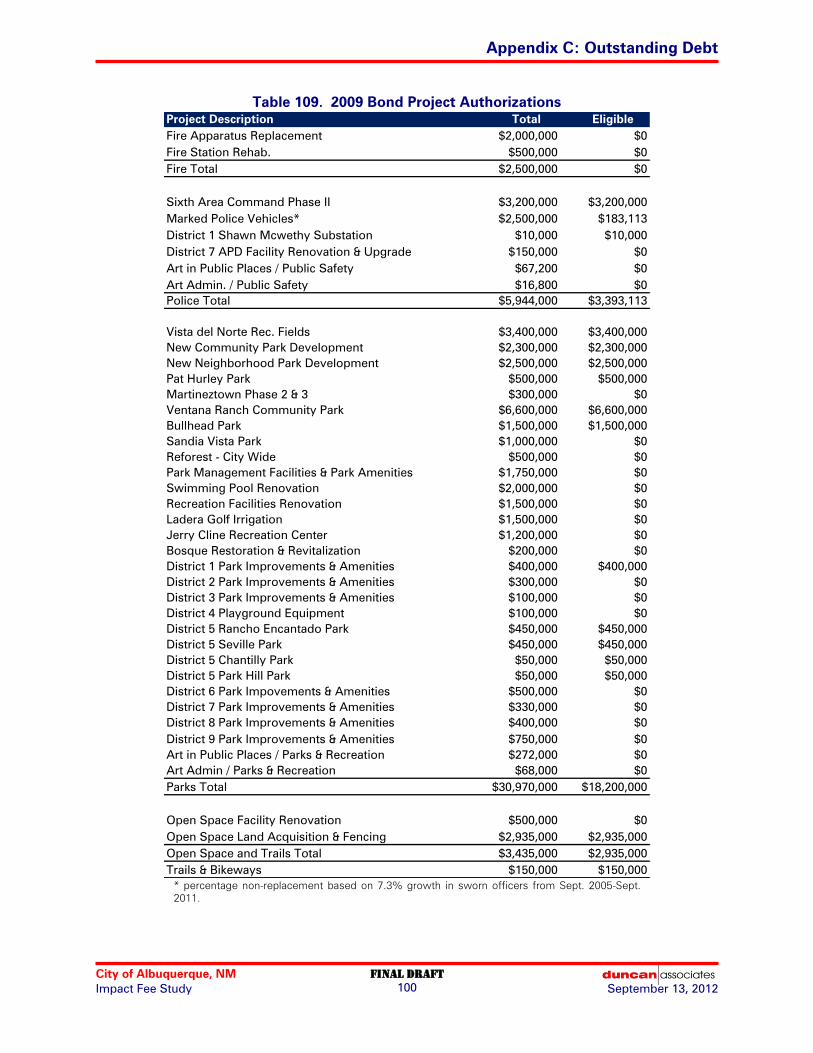
Appendix C: Outstanding Debt
City of Albuquerque, NM Final draft
Impact Fee Study September 13, 2012 100
Table 109. 2009 Bond Project Authorizations
Project Description Total Eligible
Fire Apparatus Replacement $2,000,000 $0
Fire Station Rehab. $500,000 $0
Fire Total $2,500,000 $0
Sixth Area Command Phase II $3,200,000 $3,200,000
Marked Police Vehicles* $2,500,000 $183,113
District 1 Shawn Mcwethy Substation $10,000 $10,000
District 7 APD Facility Renovation & Upgrade $150,000 $0
Art in Public Places / Public Safety $67,200 $0
Art Admin. / Public Safety $16,800 $0
Police Total $5,944,000 $3,393,113
Vista del Norte Rec. Fields $3,400,000 $3,400,000
New Community Park Development $2,300,000 $2,300,000
New Neighborhood Park Development $2,500,000 $2,500,000
Pat Hurley Park $500,000 $500,000
Martineztown Phase 2 & 3 $300,000 $0
Ventana Ranch Community Park $6,600,000 $6,600,000
Bullhead Park $1,500,000 $1,500,000
Sandia Vista Park $1,000,000 $0
Reforest - City Wide $500,000 $0
Park Management Facilities & Park Amenities $1,750,000 $0
Swimming Pool Renovation $2,000,000 $0
Recreation Facilities Renovation $1,500,000 $0
Ladera Golf Irrigation $1,500,000 $0
Jerry Cline Recreation Center $1,200,000 $0
Bosque Restoration & Revitalization $200,000 $0
District 1 Park Improvements & Amenities $400,000 $400,000
District 2 Park Improvements & Amenities $300,000 $0
District 3 Park Improvements & Amenities $100,000 $0
District 4 Playground Equipment $100,000 $0
District 5 Rancho Encantado Park $450,000 $450,000
District 5 Seville Park $450,000 $450,000
District 5 Chantilly Park $50,000 $50,000
District 5 Park Hill Park $50,000 $50,000
District 6 Park Impovements & Amenities $500,000 $0
District 7 Park Improvements & Amenities $330,000 $0
District 8 Park Improvements & Amenities $400,000 $0
District 9 Park Improvements & Amenities $750,000 $0
Art in Public Places / Parks & Recreation $272,000 $0
Art Admin / Parks & Recreation $68,000 $0
Parks Total $30,970,000 $18,200,000
Open Space Facility Renovation $500,000 $0
Open Space Land Acquisition & Fencing $2,935,000 $2,935,000
Open Space and Trails Total $3,435,000 $2,935,000
Trails & Bikeways $150,000 $150,000 * percentage non-replacement based on 7.3% growth in sworn officers from Sept. 2005-Sept.
2011.
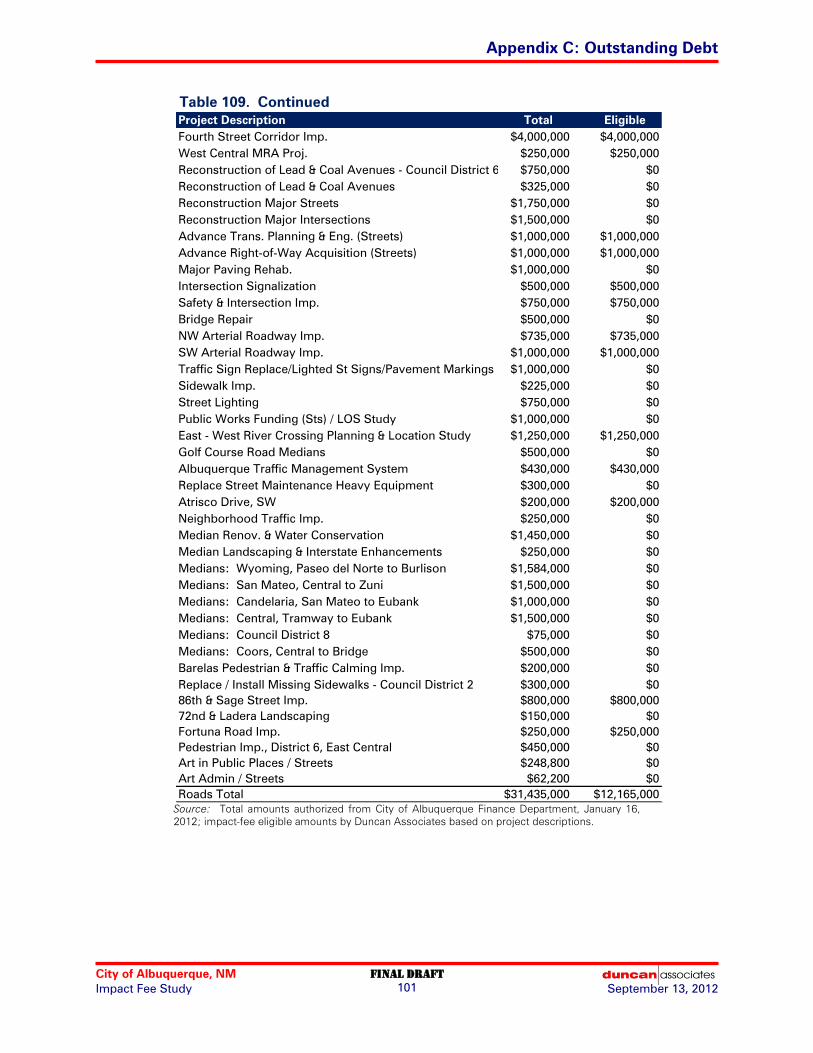
Appendix C: Outstanding Debt
City of Albuquerque, NM Final draft
Impact Fee Study September 13, 2012 101
Table 109. Continued
Project Description Total Eligible
Fourth Street Corridor Imp. $4,000,000 $4,000,000
West Central MRA Proj. $250,000 $250,000
Reconstruction of Lead & Coal Avenues - Council District 6 $750,000 $0
Reconstruction of Lead & Coal Avenues $325,000 $0
Reconstruction Major Streets $1,750,000 $0
Reconstruction Major Intersections $1,500,000 $0
Advance Trans. Planning & Eng. (Streets) $1,000,000 $1,000,000
Advance Right-of-Way Acquisition (Streets) $1,000,000 $1,000,000
Major Paving Rehab. $1,000,000 $0
Intersection Signalization $500,000 $500,000
Safety & Intersection Imp. $750,000 $750,000
Bridge Repair $500,000 $0
NW Arterial Roadway Imp. $735,000 $735,000
SW Arterial Roadway Imp. $1,000,000 $1,000,000
Traffic Sign Replace/Lighted St Signs/Pavement Markings $1,000,000 $0
Sidewalk Imp. $225,000 $0
Street Lighting $750,000 $0
Public Works Funding (Sts) / LOS Study $1,000,000 $0
East - West River Crossing Planning & Location Study $1,250,000 $1,250,000
Golf Course Road Medians $500,000 $0
Albuquerque Traffic Management System $430,000 $430,000
Replace Street Maintenance Heavy Equipment $300,000 $0
Atrisco Drive, SW $200,000 $200,000
Neighborhood Traffic Imp. $250,000 $0
Median Renov. & Water Conservation $1,450,000 $0
Median Landscaping & Interstate Enhancements $250,000 $0
Medians: Wyoming, Paseo del Norte to Burlison $1,584,000 $0
Medians: San Mateo, Central to Zuni $1,500,000 $0
Medians: Candelaria, San Mateo to Eubank $1,000,000 $0
Medians: Central, Tramway to Eubank $1,500,000 $0
Medians: Council District 8 $75,000 $0
Medians: Coors, Central to Bridge $500,000 $0
Barelas Pedestrian & Traffic Calming Imp. $200,000 $0
Replace / Install Missing Sidewalks - Council District 2 $300,000 $0
86th & Sage Street Imp. $800,000 $800,000
72nd & Ladera Landscaping $150,000 $0
Fortuna Road Imp. $250,000 $250,000
Pedestrian Imp., District 6, East Central $450,000 $0
Art in Public Places / Streets $248,800 $0
Art Admin / Streets $62,200 $0
Roads Total $31,435,000 $12,165,000
Source: Total amounts authorized from City of Albuquerque Finance Department, January 16,
2012; impact-fee eligible amounts by Duncan Associates based on project descriptions.
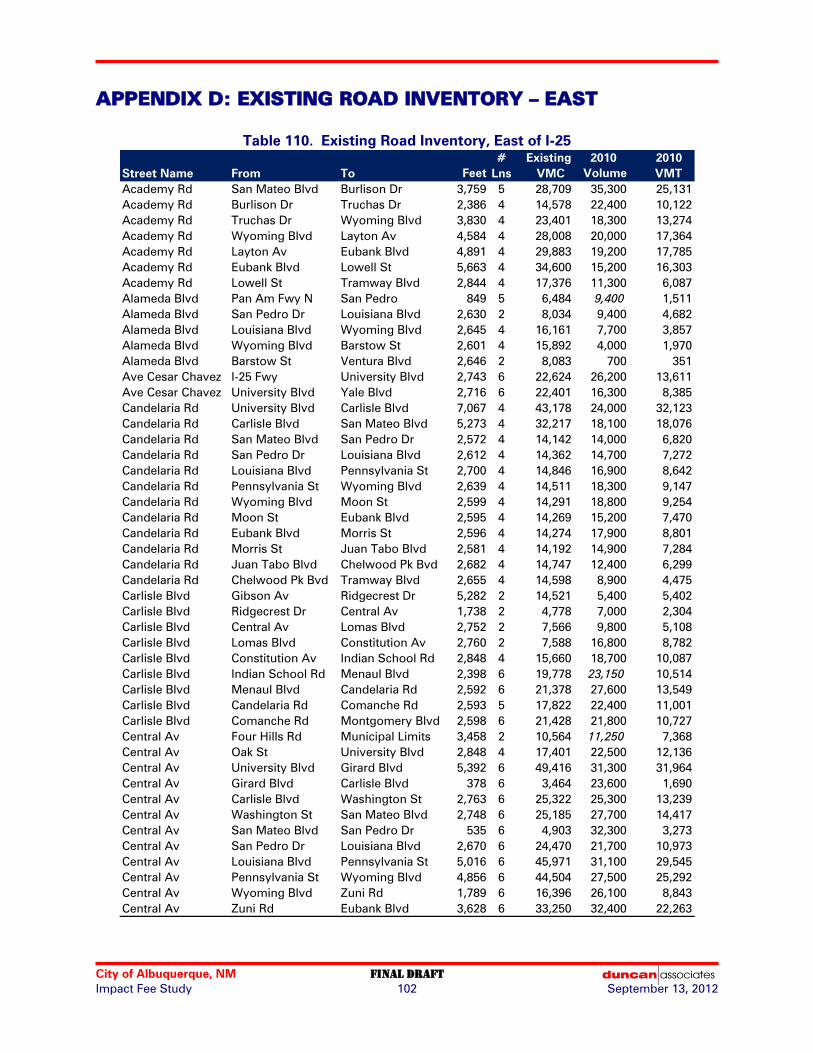
City of Albuquerque, NM FINAL draft
Impact Fee Study 102 September 13, 2012
APPENDIX D: EXISTING ROAD INVENTORY – EAST
Table 110. Existing Road Inventory, East of I-25
# Existing 2010 2010
Street Name From To Feet Lns VMC Volume VMT
Academy Rd San Mateo Blvd Burlison Dr 3,759 5 28,709 35,300 25,131
Academy Rd Burlison Dr Truchas Dr 2,386 4 14,578 22,400 10,122
Academy Rd Truchas Dr Wyoming Blvd 3,830 4 23,401 18,300 13,274
Academy Rd Wyoming Blvd Layton Av 4,584 4 28,008 20,000 17,364
Academy Rd Layton Av Eubank Blvd 4,891 4 29,883 19,200 17,785
Academy Rd Eubank Blvd Lowell St 5,663 4 34,600 15,200 16,303
Academy Rd Lowell St Tramway Blvd 2,844 4 17,376 11,300 6,087
Alameda Blvd Pan Am Fwy N San Pedro 849 5 6,484 9,400 1,511
Alameda Blvd San Pedro Dr Louisiana Blvd 2,630 2 8,034 9,400 4,682
Alameda Blvd Louisiana Blvd Wyoming Blvd 2,645 4 16,161 7,700 3,857
Alameda Blvd Wyoming Blvd Barstow St 2,601 4 15,892 4,000 1,970
Alameda Blvd Barstow St Ventura Blvd 2,646 2 8,083 700 351
Ave Cesar Chavez I-25 Fwy University Blvd 2,743 6 22,624 26,200 13,611
Ave Cesar Chavez University Blvd Yale Blvd 2,716 6 22,401 16,300 8,385
Candelaria Rd University Blvd Carlisle Blvd 7,067 4 43,178 24,000 32,123
Candelaria Rd Carlisle Blvd San Mateo Blvd 5,273 4 32,217 18,100 18,076
Candelaria Rd San Mateo Blvd San Pedro Dr 2,572 4 14,142 14,000 6,820
Candelaria Rd San Pedro Dr Louisiana Blvd 2,612 4 14,362 14,700 7,272
Candelaria Rd Louisiana Blvd Pennsylvania St 2,700 4 14,846 16,900 8,642
Candelaria Rd Pennsylvania St Wyoming Blvd 2,639 4 14,511 18,300 9,147
Candelaria Rd Wyoming Blvd Moon St 2,599 4 14,291 18,800 9,254
Candelaria Rd Moon St Eubank Blvd 2,595 4 14,269 15,200 7,470
Candelaria Rd Eubank Blvd Morris St 2,596 4 14,274 17,900 8,801
Candelaria Rd Morris St Juan Tabo Blvd 2,581 4 14,192 14,900 7,284
Candelaria Rd Juan Tabo Blvd Chelwood Pk Bvd 2,682 4 14,747 12,400 6,299
Candelaria Rd Chelwood Pk Bvd Tramway Blvd 2,655 4 14,598 8,900 4,475
Carlisle Blvd Gibson Av Ridgecrest Dr 5,282 2 14,521 5,400 5,402
Carlisle Blvd Ridgecrest Dr Central Av 1,738 2 4,778 7,000 2,304
Carlisle Blvd Central Av Lomas Blvd 2,752 2 7,566 9,800 5,108
Carlisle Blvd Lomas Blvd Constitution Av 2,760 2 7,588 16,800 8,782
Carlisle Blvd Constitution Av Indian School Rd 2,848 4 15,660 18,700 10,087
Carlisle Blvd Indian School Rd Menaul Blvd 2,398 6 19,778 23,150 10,514
Carlisle Blvd Menaul Blvd Candelaria Rd 2,592 6 21,378 27,600 13,549
Carlisle Blvd Candelaria Rd Comanche Rd 2,593 5 17,822 22,400 11,001
Carlisle Blvd Comanche Rd Montgomery Blvd 2,598 6 21,428 21,800 10,727
Central Av Four Hills Rd Municipal Limits 3,458 2 10,564 11,250 7,368
Central Av Oak St University Blvd 2,848 4 17,401 22,500 12,136
Central Av University Blvd Girard Blvd 5,392 6 49,416 31,300 31,964
Central Av Girard Blvd Carlisle Blvd 378 6 3,464 23,600 1,690
Central Av Carlisle Blvd Washington St 2,763 6 25,322 25,300 13,239
Central Av Washington St San Mateo Blvd 2,748 6 25,185 27,700 14,417
Central Av San Mateo Blvd San Pedro Dr 535 6 4,903 32,300 3,273
Central Av San Pedro Dr Louisiana Blvd 2,670 6 24,470 21,700 10,973
Central Av Louisiana Blvd Pennsylvania St 5,016 6 45,971 31,100 29,545
Central Av Pennsylvania St Wyoming Blvd 4,856 6 44,504 27,500 25,292
Central Av Wyoming Blvd Zuni Rd 1,789 6 16,396 26,100 8,843
Central Av Zuni Rd Eubank Blvd 3,628 6 33,250 32,400 22,263

Appendix D: Existing Road Inventory - East
City of Albuquerque, NM Final draft
Impact Fee Study September 13, 2012 103
Table 110. Continued
# Existing 2010 2010
Street Name From To Feet Lns VMC Volume VMT
Central Av Eubank Blvd Elizabeth St 2,293 6 21,015 27,100 11,769
Central Av Elizabeth St Juan Tabo Blvd 2,895 6 26,532 20,000 10,966
Central Av Juan Tabo Blvd Tramway Blvd 5,314 6 48,702 22,600 22,746
Central Av Tramway Blvd Four Hills Rd 748 4 4,570 11,300 1,601
Coal Av Oak St University Blvd 3,140 2 9,592 11,400 6,780
Coal Av University Blvd Yale Blvd 1,726 3 7,909 10,300 3,367
Coal Av Yale Blvd Girard Blvd 2,686 3 12,308 12,400 6,308
Coal Av Girard Blvd Carlisle Blvd 2,594 2 7,924 11,100 5,453
Coal Av Carlisle Blvd Washington St 2,768 2 8,456 8,300 4,351
Comanche Rd Pan American Fwy Carlisle Blvd 4,977 2 13,683 23,400 22,057
Eubank Blvd Southern Av Innovation Pkwy 5,289 6 48,472 19,100 19,133
Eubank Blvd Southern Av Central Av 1,725 6 15,809 29,000 9,474
Eubank Blvd Central Av I-40 Fwy 4,068 6 37,282 46,500 35,826
Eubank Blvd I-40 Fwy Lomas Blvd 1,506 6 13,802 41,150 11,737
Eubank Blvd Lomas Blvd Constitution Av 2,662 6 24,397 35,800 18,049
Eubank Blvd Constitution Av Indian School Rd 2,614 6 23,957 28,300 14,011
Eubank Blvd Indian School Rd Menaul Blvd 2,634 6 24,140 32,200 16,063
Eubank Blvd Menaul Blvd Candelaria Rd 2,625 6 24,058 31,500 15,661
Eubank Blvd Candelaria Rd Comanche Rd 2,628 6 24,085 33,900 16,873
Eubank Blvd Comanche Rd Montgomery Blvd 2,599 6 23,819 32,200 15,850
Eubank Blvd Montgomery Blvd Spain Rd 2,956 4 18,061 27,600 15,452
Eubank Blvd Spain Rd Layton Av 2,782 4 16,998 24,200 12,751
Eubank Blvd Layton Av Juan Tabo Blvd 1,338 4 8,175 19,900 5,043
Eubank Blvd Juan Tabo Blvd Academy Rd 2,226 4 13,601 25,600 10,793
Eubank Blvd Academy Rd San Antonio Dr 1,961 6 17,972 17,200 6,388
Eubank Blvd Alexandria Rd Coronado Av 2,108 4 12,880 16,700 6,667
Gibson Blvd I-25 Fwy University Blvd 2,251 6 20,630 28,600 12,193
Gibson Blvd University Blvd Yale Blvd 2,630 6 24,103 26,900 13,399
Gibson Blvd Yale Blvd Girard Blvd 2,658 6 24,360 27,800 13,995
Gibson Blvd Girard Blvd Carlisle Blvd 2,696 6 24,708 33,500 17,105
Gibson Blvd Carlisle Blvd San Mateo Blvd 5,361 6 49,132 31,200 31,679
Gibson Blvd San Mateo Blvd San Pedro Dr 2,636 6 24,158 25,200 12,581
Gibson Blvd San Pedro Dr Louisiana Blvd 2,623 6 24,039 16,200 8,048
Indian School Rd I-25 Fwy University Blvd 1,528 4 8,402 9,100 2,633
Indian School Rd University Blvd Girard Blvd 4,700 4 25,843 9,100 8,100
Indian School Rd Girard Blvd Carlisle Blvd 2,641 4 14,521 10,400 5,202
Indian School Rd Carlisle Blvd Washington St 2,661 4 14,631 15,700 7,912
Indian School Rd Washington St San Mateo Blvd 2,623 4 14,423 9,500 4,719
Indian School Rd San Pedro Dr Americas Pkwy 1,940 4 10,667 9,500 3,491
Indian School Rd Americas Pkwy Louisiana Blvd 800 4 4,399 11,200 1,697
Indian School Rd Louisiana Blvd Uptown Loop Rd 700 4 3,849 13,200 1,750
Indian School Rd Uptown Loop Rd Pennsylvania St 1,931 4 10,618 12,500 4,571
Indian School Rd Pennsylvania St Wyoming Blvd 2,675 2 7,354 15,200 7,701
Indian School Rd Wyoming Blvd Moon St 2,630 4 14,461 12,400 6,177
Indian School Rd Moon St Eubank Blvd 2,629 4 14,456 10,600 5,278
Indian School Rd Eubank Blvd Morris St 2,541 2 6,986 10,600 5,101
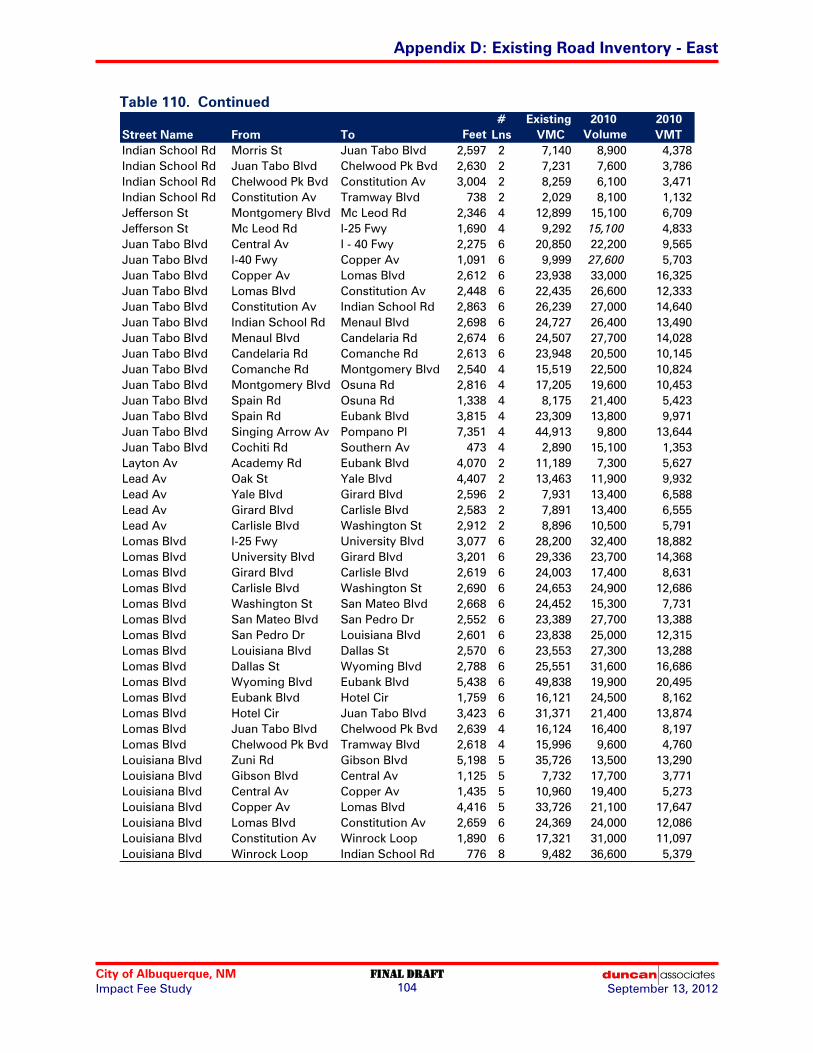
Appendix D: Existing Road Inventory - East
City of Albuquerque, NM Final draft
Impact Fee Study September 13, 2012 104
Table 110. Continued
# Existing 2010 2010
Street Name From To Feet Lns VMC Volume VMT
Indian School Rd Morris St Juan Tabo Blvd 2,597 2 7,140 8,900 4,378
Indian School Rd Juan Tabo Blvd Chelwood Pk Bvd 2,630 2 7,231 7,600 3,786
Indian School Rd Chelwood Pk Bvd Constitution Av 3,004 2 8,259 6,100 3,471
Indian School Rd Constitution Av Tramway Blvd 738 2 2,029 8,100 1,132
Jefferson St Montgomery Blvd Mc Leod Rd 2,346 4 12,899 15,100 6,709
Jefferson St Mc Leod Rd I-25 Fwy 1,690 4 9,292 15,100 4,833
Juan Tabo Blvd Central Av I - 40 Fwy 2,275 6 20,850 22,200 9,565
Juan Tabo Blvd I-40 Fwy Copper Av 1,091 6 9,999 27,600 5,703
Juan Tabo Blvd Copper Av Lomas Blvd 2,612 6 23,938 33,000 16,325
Juan Tabo Blvd Lomas Blvd Constitution Av 2,448 6 22,435 26,600 12,333
Juan Tabo Blvd Constitution Av Indian School Rd 2,863 6 26,239 27,000 14,640
Juan Tabo Blvd Indian School Rd Menaul Blvd 2,698 6 24,727 26,400 13,490
Juan Tabo Blvd Menaul Blvd Candelaria Rd 2,674 6 24,507 27,700 14,028
Juan Tabo Blvd Candelaria Rd Comanche Rd 2,613 6 23,948 20,500 10,145
Juan Tabo Blvd Comanche Rd Montgomery Blvd 2,540 4 15,519 22,500 10,824
Juan Tabo Blvd Montgomery Blvd Osuna Rd 2,816 4 17,205 19,600 10,453
Juan Tabo Blvd Spain Rd Osuna Rd 1,338 4 8,175 21,400 5,423
Juan Tabo Blvd Spain Rd Eubank Blvd 3,815 4 23,309 13,800 9,971
Juan Tabo Blvd Singing Arrow Av Pompano Pl 7,351 4 44,913 9,800 13,644
Juan Tabo Blvd Cochiti Rd Southern Av 473 4 2,890 15,100 1,353
Layton Av Academy Rd Eubank Blvd 4,070 2 11,189 7,300 5,627
Lead Av Oak St Yale Blvd 4,407 2 13,463 11,900 9,932
Lead Av Yale Blvd Girard Blvd 2,596 2 7,931 13,400 6,588
Lead Av Girard Blvd Carlisle Blvd 2,583 2 7,891 13,400 6,555
Lead Av Carlisle Blvd Washington St 2,912 2 8,896 10,500 5,791
Lomas Blvd I-25 Fwy University Blvd 3,077 6 28,200 32,400 18,882
Lomas Blvd University Blvd Girard Blvd 3,201 6 29,336 23,700 14,368
Lomas Blvd Girard Blvd Carlisle Blvd 2,619 6 24,003 17,400 8,631
Lomas Blvd Carlisle Blvd Washington St 2,690 6 24,653 24,900 12,686
Lomas Blvd Washington St San Mateo Blvd 2,668 6 24,452 15,300 7,731
Lomas Blvd San Mateo Blvd San Pedro Dr 2,552 6 23,389 27,700 13,388
Lomas Blvd San Pedro Dr Louisiana Blvd 2,601 6 23,838 25,000 12,315
Lomas Blvd Louisiana Blvd Dallas St 2,570 6 23,553 27,300 13,288
Lomas Blvd Dallas St Wyoming Blvd 2,788 6 25,551 31,600 16,686
Lomas Blvd Wyoming Blvd Eubank Blvd 5,438 6 49,838 19,900 20,495
Lomas Blvd Eubank Blvd Hotel Cir 1,759 6 16,121 24,500 8,162
Lomas Blvd Hotel Cir Juan Tabo Blvd 3,423 6 31,371 21,400 13,874
Lomas Blvd Juan Tabo Blvd Chelwood Pk Bvd 2,639 4 16,124 16,400 8,197
Lomas Blvd Chelwood Pk Bvd Tramway Blvd 2,618 4 15,996 9,600 4,760
Louisiana Blvd Zuni Rd Gibson Blvd 5,198 5 35,726 13,500 13,290
Louisiana Blvd Gibson Blvd Central Av 1,125 5 7,732 17,700 3,771
Louisiana Blvd Central Av Copper Av 1,435 5 10,960 19,400 5,273
Louisiana Blvd Copper Av Lomas Blvd 4,416 5 33,726 21,100 17,647
Louisiana Blvd Lomas Blvd Constitution Av 2,659 6 24,369 24,000 12,086
Louisiana Blvd Constitution Av Winrock Loop 1,890 6 17,321 31,000 11,097
Louisiana Blvd Winrock Loop Indian School Rd 776 8 9,482 36,600 5,379

Appendix D: Existing Road Inventory - East
City of Albuquerque, NM Final draft
Impact Fee Study September 13, 2012 105
Table 110. Continued
# Existing 2010 2010
Street Name From To Feet Lns VMC Volume VMT
Louisiana Blvd Indian School Rd Arvada Av 987 8 12,061 30,200 5,645
Louisiana Blvd Arvada Av Menaul Blvd 1,607 8 19,637 24,500 7,457
Louisiana Blvd Menaul Blvd Candelaria Rd 2,594 5 17,829 16,900 8,303
Louisiana Blvd Candelaria Rd Comanche Rd 2,589 4 14,236 18,500 9,071
Louisiana Blvd Comanche Rd Montgomery Blvd 2,531 4 13,917 17,300 8,293
Louisiana Blvd Montgomery Blvd Osuna Rd 2,717 4 14,939 8,300 4,271
Menaul Blvd I-25 Fwy University Blvd 1,180 6 10,814 28,100 6,280
Menaul Blvd University Blvd Carlisle Blvd 5,870 6 53,797 26,000 28,905
Menaul Blvd Carlisle Blvd Washington St 2,548 6 23,352 27,000 13,030
Menaul Blvd Washington St San Mateo Blvd 2,720 6 24,928 34,000 17,515
Menaul Blvd San Mateo Blvd San Pedro Dr 2,584 6 23,682 35,000 17,129
Menaul Blvd San Pedro Dr Louisiana Blvd 2,623 6 24,039 20,300 10,085
Menaul Blvd Louisiana Blvd Pennsylvania St 2,684 6 24,598 32,100 16,318
Menaul Blvd Pennsylvania St Wyoming Blvd 2,651 6 24,296 35,100 17,623
Menaul Blvd Wyoming Blvd Moon St 2,620 6 24,012 23,500 11,661
Menaul Blvd Moon St Eubank Blvd 2,612 6 23,938 28,100 13,901
Menaul Blvd Eubank Blvd Morris St 2,531 4 15,464 20,400 9,779
Menaul Blvd Morris St Juan Tabo Blvd 2,618 4 15,996 19,300 9,570
Menaul Blvd Juan Tabo Blvd Chelwood Pk Bvd 2,663 4 16,271 12,900 6,506
Menaul Blvd Chelwood Pk Bvd Tramway Blvd 2,694 4 16,460 7,500 3,827
Monte Vista Blvd Campus Blvd Girard Blvd 1,296 2 3,563 5,500 1,350
Monte Vista Blvd Carlisle Blvd Campus Blvd 2,309 2 6,348 6,900 3,017
Montgomery Blvd N Diversion Chnl Carlisle Blvd 905 6 8,294 43,600 7,473
Montgomery Blvd Carlisle Blvd Washington St 2,637 6 24,168 40,300 20,127
Montgomery Blvd Washington St San Mateo Blvd 2,638 6 24,177 46,700 23,332
Montgomery Blvd San Pedro Dr San Mateo Blvd 2,637 6 24,168 39,000 19,478
Montgomery Blvd San Pedro Dr Louisiana Blvd 2,678 6 24,543 27,700 14,049
Montgomery Blvd Louisiana Blvd Pennsylvania St 2,638 6 24,177 31,700 15,838
Montgomery Blvd Pennsylvania St Wyoming Blvd 2,658 6 24,360 47,000 23,660
Montgomery Blvd Wyoming Blvd Moon St 2,639 6 24,186 30,000 14,994
Montgomery Blvd Moon St Eubank Blvd 2,633 6 24,131 29,000 14,462
Montgomery Blvd Eubank Blvd Morris St 2,639 6 24,186 30,300 15,144
Montgomery Blvd Morris St Juan Tabo Blvd 2,634 6 24,140 24,200 12,073
Montgomery Blvd Juan Tabo Blvd Bermuda Dr 2,891 6 26,495 16,500 9,034
Montgomery Blvd Bermuda Dr Tramway Blvd 2,394 6 21,940 15,500 7,028
Osuna Rd Pan American Fwy San Mateo Blvd 1,161 2 3,192 11,500 2,529
Osuna Rd San Mateo Blvd San Pedro Dr 5,609 2 15,421 17,000 18,059
Osuna Rd San Pedro Dr Louisiana Blvd 2,856 2 7,852 11,500 6,220
Osuna Rd Louisiana Blvd Pennsylvania St 2,680 2 7,368 9,100 4,619
Osuna Rd Pennsylvania St Wyoming Blvd 2,665 2 7,327 10,400 5,249
Paseo del Norte I-25 Fwy Eubank Blvd 12,144 4 74,198 38,933 89,546
Randolph Rd University Blvd Yale Blvd 2,694 2 7,406 9,800 5,000
San Antonio Dr Pan American Fwy San Pedro Blvd 2,640 4 14,516 16,400 8,200
San Antonio Dr San Pedro Blvd Louisiana Blvd 2,627 4 14,445 22,100 10,996
San Antonio Dr Louisiana Blvd Wyoming Blvd 2,631 4 14,467 19,800 9,866
San Mateo Blvd Central Av Lomas Blvd 3,482 6 31,912 25,500 16,816
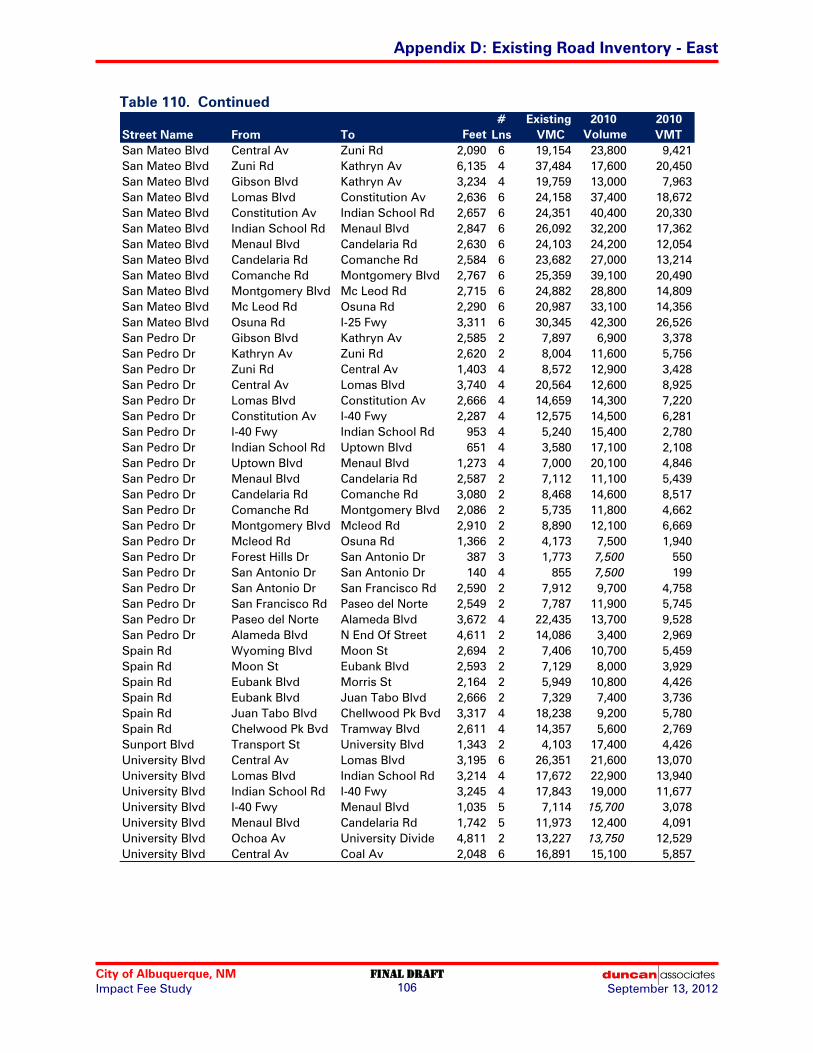
Appendix D: Existing Road Inventory - East
City of Albuquerque, NM Final draft
Impact Fee Study September 13, 2012 106
Table 110. Continued
# Existing 2010 2010
Street Name From To Feet Lns VMC Volume VMT
San Mateo Blvd Central Av Zuni Rd 2,090 6 19,154 23,800 9,421
San Mateo Blvd Zuni Rd Kathryn Av 6,135 4 37,484 17,600 20,450
San Mateo Blvd Gibson Blvd Kathryn Av 3,234 4 19,759 13,000 7,963
San Mateo Blvd Lomas Blvd Constitution Av 2,636 6 24,158 37,400 18,672
San Mateo Blvd Constitution Av Indian School Rd 2,657 6 24,351 40,400 20,330
San Mateo Blvd Indian School Rd Menaul Blvd 2,847 6 26,092 32,200 17,362
San Mateo Blvd Menaul Blvd Candelaria Rd 2,630 6 24,103 24,200 12,054
San Mateo Blvd Candelaria Rd Comanche Rd 2,584 6 23,682 27,000 13,214
San Mateo Blvd Comanche Rd Montgomery Blvd 2,767 6 25,359 39,100 20,490
San Mateo Blvd Montgomery Blvd Mc Leod Rd 2,715 6 24,882 28,800 14,809
San Mateo Blvd Mc Leod Rd Osuna Rd 2,290 6 20,987 33,100 14,356
San Mateo Blvd Osuna Rd I-25 Fwy 3,311 6 30,345 42,300 26,526
San Pedro Dr Gibson Blvd Kathryn Av 2,585 2 7,897 6,900 3,378
San Pedro Dr Kathryn Av Zuni Rd 2,620 2 8,004 11,600 5,756
San Pedro Dr Zuni Rd Central Av 1,403 4 8,572 12,900 3,428
San Pedro Dr Central Av Lomas Blvd 3,740 4 20,564 12,600 8,925
San Pedro Dr Lomas Blvd Constitution Av 2,666 4 14,659 14,300 7,220
San Pedro Dr Constitution Av I-40 Fwy 2,287 4 12,575 14,500 6,281
San Pedro Dr I-40 Fwy Indian School Rd 953 4 5,240 15,400 2,780
San Pedro Dr Indian School Rd Uptown Blvd 651 4 3,580 17,100 2,108
San Pedro Dr Uptown Blvd Menaul Blvd 1,273 4 7,000 20,100 4,846
San Pedro Dr Menaul Blvd Candelaria Rd 2,587 2 7,112 11,100 5,439
San Pedro Dr Candelaria Rd Comanche Rd 3,080 2 8,468 14,600 8,517
San Pedro Dr Comanche Rd Montgomery Blvd 2,086 2 5,735 11,800 4,662
San Pedro Dr Montgomery Blvd Mcleod Rd 2,910 2 8,890 12,100 6,669
San Pedro Dr Mcleod Rd Osuna Rd 1,366 2 4,173 7,500 1,940
San Pedro Dr Forest Hills Dr San Antonio Dr 387 3 1,773 7,500 550
San Pedro Dr San Antonio Dr San Antonio Dr 140 4 855 7,500 199
San Pedro Dr San Antonio Dr San Francisco Rd 2,590 2 7,912 9,700 4,758
San Pedro Dr San Francisco Rd Paseo del Norte 2,549 2 7,787 11,900 5,745
San Pedro Dr Paseo del Norte Alameda Blvd 3,672 4 22,435 13,700 9,528
San Pedro Dr Alameda Blvd N End Of Street 4,611 2 14,086 3,400 2,969
Spain Rd Wyoming Blvd Moon St 2,694 2 7,406 10,700 5,459
Spain Rd Moon St Eubank Blvd 2,593 2 7,129 8,000 3,929
Spain Rd Eubank Blvd Morris St 2,164 2 5,949 10,800 4,426
Spain Rd Eubank Blvd Juan Tabo Blvd 2,666 2 7,329 7,400 3,736
Spain Rd Juan Tabo Blvd Chellwood Pk Bvd 3,317 4 18,238 9,200 5,780
Spain Rd Chelwood Pk Bvd Tramway Blvd 2,611 4 14,357 5,600 2,769
Sunport Blvd Transport St University Blvd 1,343 2 4,103 17,400 4,426
University Blvd Central Av Lomas Blvd 3,195 6 26,351 21,600 13,070
University Blvd Lomas Blvd Indian School Rd 3,214 4 17,672 22,900 13,940
University Blvd Indian School Rd I-40 Fwy 3,245 4 17,843 19,000 11,677
University Blvd I-40 Fwy Menaul Blvd 1,035 5 7,114 15,700 3,078
University Blvd Menaul Blvd Candelaria Rd 1,742 5 11,973 12,400 4,091
University Blvd Ochoa Av University Divide 4,811 2 13,227 13,750 12,529
University Blvd Central Av Coal Av 2,048 6 16,891 15,100 5,857
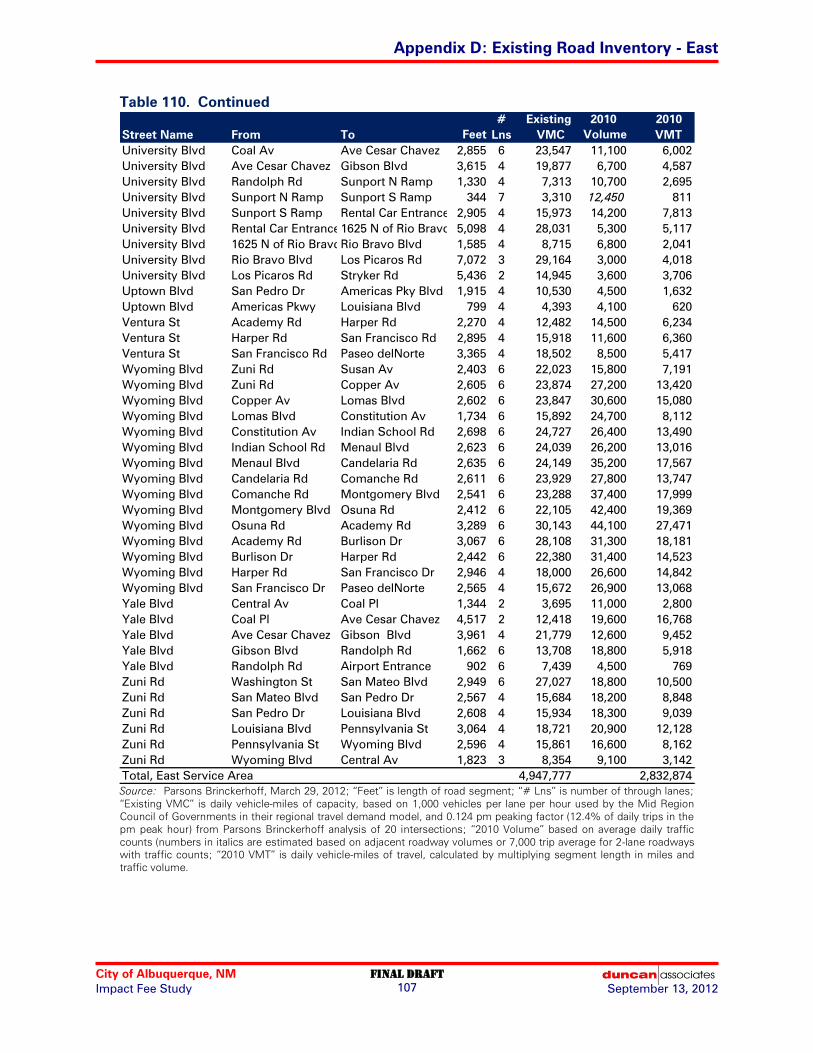
Appendix D: Existing Road Inventory - East
City of Albuquerque, NM Final draft
Impact Fee Study September 13, 2012 107
Table 110. Continued
# Existing 2010 2010
Street Name From To Feet Lns VMC Volume VMT
University Blvd Coal Av Ave Cesar Chavez 2,855 6 23,547 11,100 6,002
University Blvd Ave Cesar Chavez Gibson Blvd 3,615 4 19,877 6,700 4,587
University Blvd Randolph Rd Sunport N Ramp 1,330 4 7,313 10,700 2,695
University Blvd Sunport N Ramp Sunport S Ramp 344 7 3,310 12,450 811
University Blvd Sunport S Ramp Rental Car Entrance 2,905 4 15,973 14,200 7,813
University Blvd Rental Car Entrance1625 N of Rio Bravo 5,098 4 28,031 5,300 5,117
University Blvd 1625 N of Rio BravoRio Bravo Blvd 1,585 4 8,715 6,800 2,041
University Blvd Rio Bravo Blvd Los Picaros Rd 7,072 3 29,164 3,000 4,018
University Blvd Los Picaros Rd Stryker Rd 5,436 2 14,945 3,600 3,706
Uptown Blvd San Pedro Dr Americas Pky Blvd 1,915 4 10,530 4,500 1,632
Uptown Blvd Americas Pkwy Louisiana Blvd 799 4 4,393 4,100 620
Ventura St Academy Rd Harper Rd 2,270 4 12,482 14,500 6,234
Ventura St Harper Rd San Francisco Rd 2,895 4 15,918 11,600 6,360
Ventura St San Francisco Rd Paseo delNorte 3,365 4 18,502 8,500 5,417
Wyoming Blvd Zuni Rd Susan Av 2,403 6 22,023 15,800 7,191
Wyoming Blvd Zuni Rd Copper Av 2,605 6 23,874 27,200 13,420
Wyoming Blvd Copper Av Lomas Blvd 2,602 6 23,847 30,600 15,080
Wyoming Blvd Lomas Blvd Constitution Av 1,734 6 15,892 24,700 8,112
Wyoming Blvd Constitution Av Indian School Rd 2,698 6 24,727 26,400 13,490
Wyoming Blvd Indian School Rd Menaul Blvd 2,623 6 24,039 26,200 13,016
Wyoming Blvd Menaul Blvd Candelaria Rd 2,635 6 24,149 35,200 17,567
Wyoming Blvd Candelaria Rd Comanche Rd 2,611 6 23,929 27,800 13,747
Wyoming Blvd Comanche Rd Montgomery Blvd 2,541 6 23,288 37,400 17,999
Wyoming Blvd Montgomery Blvd Osuna Rd 2,412 6 22,105 42,400 19,369
Wyoming Blvd Osuna Rd Academy Rd 3,289 6 30,143 44,100 27,471
Wyoming Blvd Academy Rd Burlison Dr 3,067 6 28,108 31,300 18,181
Wyoming Blvd Burlison Dr Harper Rd 2,442 6 22,380 31,400 14,523
Wyoming Blvd Harper Rd San Francisco Dr 2,946 4 18,000 26,600 14,842
Wyoming Blvd San Francisco Dr Paseo delNorte 2,565 4 15,672 26,900 13,068
Yale Blvd Central Av Coal Pl 1,344 2 3,695 11,000 2,800
Yale Blvd Coal Pl Ave Cesar Chavez 4,517 2 12,418 19,600 16,768
Yale Blvd Ave Cesar Chavez Gibson Blvd 3,961 4 21,779 12,600 9,452
Yale Blvd Gibson Blvd Randolph Rd 1,662 6 13,708 18,800 5,918
Yale Blvd Randolph Rd Airport Entrance 902 6 7,439 4,500 769
Zuni Rd Washington St San Mateo Blvd 2,949 6 27,027 18,800 10,500
Zuni Rd San Mateo Blvd San Pedro Dr 2,567 4 15,684 18,200 8,848
Zuni Rd San Pedro Dr Louisiana Blvd 2,608 4 15,934 18,300 9,039
Zuni Rd Louisiana Blvd Pennsylvania St 3,064 4 18,721 20,900 12,128
Zuni Rd Pennsylvania St Wyoming Blvd 2,596 4 15,861 16,600 8,162
Zuni Rd Wyoming Blvd Central Av 1,823 3 8,354 9,100 3,142
Total, East Service Area 4,947,777 2,832,874 Source: Parsons Brinckerhoff, March 29, 2012; “Feet” is length of road segment; “# Lns” is number of through lanes;
“Existing VMC” is daily vehicle-miles of capacity, based on 1,000 vehicles per lane per hour used by the Mid Region
Council of Governments in their regional travel demand model, and 0.124 pm peaking factor (12.4% of daily trips in the
pm peak hour) from Parsons Brinckerhoff analysis of 20 intersections; “2010 Volume” based on average daily traffic
counts (numbers in italics are estimated based on adjacent roadway volumes or 7,000 trip average for 2-lane roadways
with traffic counts; “2010 VMT” is daily vehicle-miles of travel, calculated by multiplying segment length in miles and
traffic volume.

City of Albuquerque, NM FINAL draft
Impact Fee Study 108 September 13, 2012
APPENDIX E: EXISTING ROAD INVENTORY – WEST
Table 111. Existing Road Inventory, West of I-25
# Existing 2010 2010
Street Name From To Feet Lns VMC Volume VMT
2nd St Woodward Rd 3rd St 7,559 2 20,782 4,800 6,872
2nd St Coal Av Lead Av 315 2 866 4,300 257
2nd St Lead Av Gold Av 673 2 1,850 4,000 510
2nd St Gold Av Central Av 330 2 907 6,900 431
2nd St Central Av Tijeras Av 752 3 3,101 5,800 826
2nd St Tijeras Av Marquette Av 536 3 2,210 6,300 640
2nd St Marquette Av Lomas Bvd 1,058 4 5,817 5,200 1,042
2nd St Lomas Bvd Mountain Rd 1,416 2 3,893 5,700 1,529
2nd St Mountain Rd I-40 Frwy 3,970 2 10,914 4,600 3,459
2nd St I-40 Frwy Menaul Bvd 1,725 4 9,485 13,800 4,509
2nd St Menaul Bvd Candelaria Rd 3,167 4 17,414 17,900 10,737
2nd St Candelaria Rd Griegos Rd 4,053 4 22,285 18,900 14,508
2nd St Griegos Rd Montano Rd 3,109 4 17,095 23,400 13,779
2nd St Montano Rd City Limits 2,590 4 14,241 21,800 10,694
2nd St City Limits Woodward Rd 3,602 2 9,903 9,000 6,140
3rd St Ave Cesar Chavez Coal Av 3,770 2 10,365 3,000 2,142
3rd St Coal Av Lead Av 317 2 872 4,200 252
3rd St Lead Av Gold Av 634 2 1,743 3,200 384
3rd St Gold Av Copper Av 333 3 1,373 5,100 322
3rd St Copper Av Tijeras Av 374 3 1,542 6,700 475
3rd St Tijeras Av Marquette Av 513 3 2,116 6,300 612
3rd St Marquette Av Lomas Bvd 1,057 4 5,812 6,000 1,201
3rd St Lomas Bvd Mountain Rd 1,412 2 3,882 4,400 1,177
3rd St Mountain Rd 2nd St 3,643 2 10,015 4,700 3,243
4th St Central Av Gold Av 330 2 907 1,500 94
4th St Gold Av Lead Av 698 2 1,919 3,300 436
4th St Lead Av Coal Av 311 2 855 3,800 224
4th St Coal Av Ave Cesar Chavez 3,810 2 10,475 6,600 4,763
4th St Marquette Av Lomas Bvd 1,055 2 2,900 3,900 779
4th St Lomas Bvd Mountain Rd 1,410 2 3,876 11,600 3,098
4th St Mountain Rd I-40 Frwy 4,090 2 11,244 9,300 7,204
4th St I-40 Frwy Menaul Bvd 1,695 4 9,320 15,100 4,847
4th St Menaul Bvd Candelaria Rd 3,317 4 18,238 19,300 12,125
4th St Candelaria Rd Griegos Rd 3,816 4 20,982 23,500 16,984
4th St Griegos Rd Montano Rd 3,065 4 16,853 29,100 16,892
4th St Montano Rd City Limits 4,018 4 22,093 12,700 9,665
5th St Coal Av Lead Av 315 2 866 1,500 89
5th St Lead Av Gold Av 333 2 915 4,000 252
5th St Gold Av Copper Av 327 2 899 5,000 310
5th St Copper Av Tijeras Av 415 2 1,141 4,500 354
5th St Tijeras Av Marquette Av 520 2 1,430 6,700 660
5th St Marquette Av Lomas Bvd 1,069 2 2,939 4,900 992
5th St Lomas Bvd Mountain Rd 1,410 2 3,876 5,600 1,495
5th St Mountain Rd I 40 Frwy 4,224 2 11,613 6,200 4,960
6th St Tijeras Av Copper Av 496 4 2,727 5,400 507
6th St Copper Av Gold Av 650 2 1,787 3,600 443

Appendix E: Existing Road Inventory - West
City of Albuquerque, NM Final draft
Impact Fee Study September 13, 2012 109
Table 111. Continued
# Existing 2010 2010
Street Name From To Feet Lns VMC Volume VMT
6th St Gold Av Lead Av 637 2 1,751 3,100 374
6th St Lead Av Coal Av 315 2 866 2,700 161
6th St Tijeras Av Marquette Av 480 4 2,639 8,300 755
6th St Marquette Av Lomas Bvd 1,056 4 5,806 6,300 1,260
6th St Lomas Bvd Mountain Rd 1,412 2 3,882 5,100 1,364
6th St Mountain Rd I-40 Frwy 4,190 2 11,519 6,600 5,238
6th St I-40 Frwy Menaul Bvd 1,697 6 13,996 12,200 3,921
12th St Central Av Tijeras Av 200 2 550 4,200 159
12th St Tijeras Av Marquette Av 342 2 940 3,700 240
12th St Marquette Av Lomas Bvd 1,029 2 2,829 6,200 1,208
12th St Lomas Bvd Mountain Rd 1,215 2 3,340 10,700 2,462
12th St Mountain Rd Sawmill Rd 1,490 2 4,096 9,300 2,624
12th St Sawmill Rd I-40 Frwy 2,426 4 13,339 10,800 4,962
12th St I-40 Frwy Menaul Bvd 2,166 4 11,910 14,300 5,866
12th St Menaul Bvd Matthew Av 2,186 2 6,010 2,000 828
12th St Matthew Av Candelaria Rd 1,668 2 4,586 11,300 3,570
98th St 86th St Gibson Bvd 1,192 4 6,554 7,000 1,580
98th St Gibson Bvd Blake Rd 1,350 4 7,423 7,000 1,790
98th St Blake Rd Colobel Av 4,329 2 11,901 7,000 5,739
98th St Ladera Dr I-40 Frwy 2,810 4 15,451 6,300 3,353
98th St I-40 Frwy Central Av 4,834 4 26,580 26,200 23,987
98th St Central Av Tower Rd 3,266 4 17,958 36,900 22,825
98th St Tower Rd Sage Rd 2,858 4 15,715 23,400 12,666
98th St N end of street Dennis Chavez Bvd 1,783 4 9,804 7,000 2,364
Alameda Bvd 2nd St Edith Bvd 2,366 4 13,009 23,800 10,665
Alameda Bvd Edith Bvd Jefferson St 4,848 4 26,657 30,500 28,005
Alameda Bvd Jefferson St Pan Am Frwy S 2,990 4 16,440 31,000 17,555
Alameda Bvd Coors Rd E City Limits Bvd 760 4 4,179 34,700 4,995
Arenal Rd Don Aragon Dr Unser Bvd 4,817 4 26,486 10,100 9,214
Atrisco Vista Bvd I-40 Frtg Rd Shoot Rg Access 22,609 2 62,158 3,000 12,846
Atrisco Vista Bvd Shoot Rg Access Paseo del Volcan 12,874 2 35,394 2,400 5,852
Atrisco Vista Bvd Paseo del Volcan Paseo del Norte 10,811 2 29,722 1,800 3,686
Ave Cesar Chavez Barelas Rd 4th St 215 4 1,182 40,300 1,641
Ave Cesar Chavez 4th St 3rd St 385 4 2,117 36,000 2,625
Ave Cesar Chavez 3rd St Broadway Bvd 2,225 4 12,234 35,400 14,918
Ave Cesar Chavez Broadway Bvd I-25 Frwy 1,751 6 14,442 28,600 9,485
Bridge Bvd City Limits 4th St 2,623 4 14,423 40,300 20,020
Bridge Bvd Goff Bvd City Limits 1,881 4 10,343 21,400 7,624
Bridge Bvd City Limits Old Coors Dr 455 4 2,502 14,800 1,275
Bridge Bvd Old Coors Bvd Coors Bvd 3,221 2 8,855 7,600 4,636
Broadway Bvd City Limits Woodward Rd 1,640 4 9,018 8,800 2,733
Broadway Bvd Woodward Rd Gibson Bvd 1,592 4 8,754 17,000 5,126
Broadway Bvd Gibson Bvd Ave Cesar Chavez 3,175 4 17,458 16,700 10,042
Broadway Bvd Ave Cesar Chavez Coal Av 3,665 4 20,152 15,000 10,412
Broadway Bvd Coal Av Lead Av 358 4 1,968 15,500 1,051
Broadway Bvd Lead Av Central Av 1,056 4 5,806 14,900 2,980

Appendix E: Existing Road Inventory - West
City of Albuquerque, NM Final draft
Impact Fee Study September 13, 2012 110
Table 111. Continued
# Existing 2010 2010
Street Name From To Feet Lns VMC Volume VMT
Broadway Bvd Central Av Martin L King Av 941 4 5,174 18,700 3,333
Broadway Bvd Martin L King Av Lomas Bvd 1,411 4 7,758 14,000 3,741
Broadway Bvd Lomas Bvd Mountain Rd 1,469 4 8,077 15,800 4,396
Broadway Bvd Mountain Rd Odelia Rd 1,706 4 9,380 17,500 5,654
Broadway Bvd Odelia Rd Indian School Rd 4,568 4 25,117 11,600 10,036
Broadway Bvd Indian School Rd Menaul Bvd 1,923 2 5,287 7,000 2,549
Broadway Bvd Menaul Bvd Candelaria Rd 2,916 4 16,034 8,700 4,805
Candelaria Rd University Bvd Edith Bvd 3,560 4 19,575 15,400 10,383
Candelaria Rd Edith Bvd 2nd St 2,241 4 12,322 13,400 5,687
Candelaria Rd 2nd St 4th St 923 4 5,075 11,200 1,958
Candelaria Rd 4th St 12th St 3,189 4 17,535 11,700 7,067
Candelaria Rd 12th St San Isidro St 3,317 4 18,238 7,100 4,460
Candelaria Rd San Isidro St Rio Grande Bvd 534 2 1,468 6,700 678
Central Av Locust St Broadway Bvd 2,210 4 12,152 21,400 8,957
Central Av Broadway Bvd RR Tracks 710 4 3,904 16,100 2,165
Central Av RR Tracks 3rd St 1,028 2 2,826 12,500 2,434
Central Av 3rd St 4th St 372 2 1,023 10,400 733
Central Av 4th St 5th St 356 2 979 11,100 748
Central Av 5th St 6th St 354 2 973 9,700 650
Central Av 6th St 8th St 750 2 2,062 7,500 1,065
Central Av 8th St 10th St 723 4 3,975 13,400 1,835
Central Av 10th St Rio Grande Bvd 5,019 4 27,597 11,700 11,122
Central Av Rio Grande Bvd Tingley Dr 3,220 6 26,558 27,000 16,466
Central Av Tingley Dr Atrisco Dr 2,566 6 21,164 27,500 13,365
Central Av Atrisco Av Old Coors Dr 4,110 4 22,599 22,000 17,125
Central Av Old Coors Dr Coors Bvd 3,886 4 21,367 25,500 18,768
Central Av Coors Bvd 75th St 2,623 4 14,423 20,400 10,134
Central Av 75th St Unser Bvd 1,241 4 6,824 16,700 3,925
Central Av Unser Bvd 86th St 2,190 4 12,042 21,800 9,042
Central Av 86th St 98th St 4,064 4 22,346 14,500 11,161
Central Av 98th St City Limits 2,643 4 14,532 7,800 3,904
Coal Av Oak St Broadway Bvd 2,499 2 6,870 10,800 5,112
Coal Av Broadway Bvd 2nd St 1,341 4 7,373 8,000 2,032
Coal Av 2nd St 3rd St 355 2 976 8,100 545
Coal Av 3rd St 4th St 363 2 998 7,500 516
Coal Av 4th St 5th St 358 2 984 6,200 420
Coal Av 5th St 6th St 363 2 998 5,300 364
Coal Av 6th St 8th St 714 2 1,963 3,900 527
Coal Av 8th St Alcalde Pl 2,679 2 7,365 3,800 1,928
Comanche Rd Edith Bvd Pan Am Frwy 3,858 4 21,213 18,500 13,518
Coors Blvd Alameda Coors Bypass 4,224 4 23,226 18,800 15,040
Coors Blvd Coors Bypass Paseo del Norte 4,224 6 34,838 63,850 51,080
Coors Blvd Paseo del Norte Montano Rd 12,672 6 104,515 41,300 99,120
Coors Blvd Montano Rd I-40 17,424 6 143,708 46,067 152,021
Coors Blvd I-40 Central Av 10,560 6 87,096 36,375 72,750
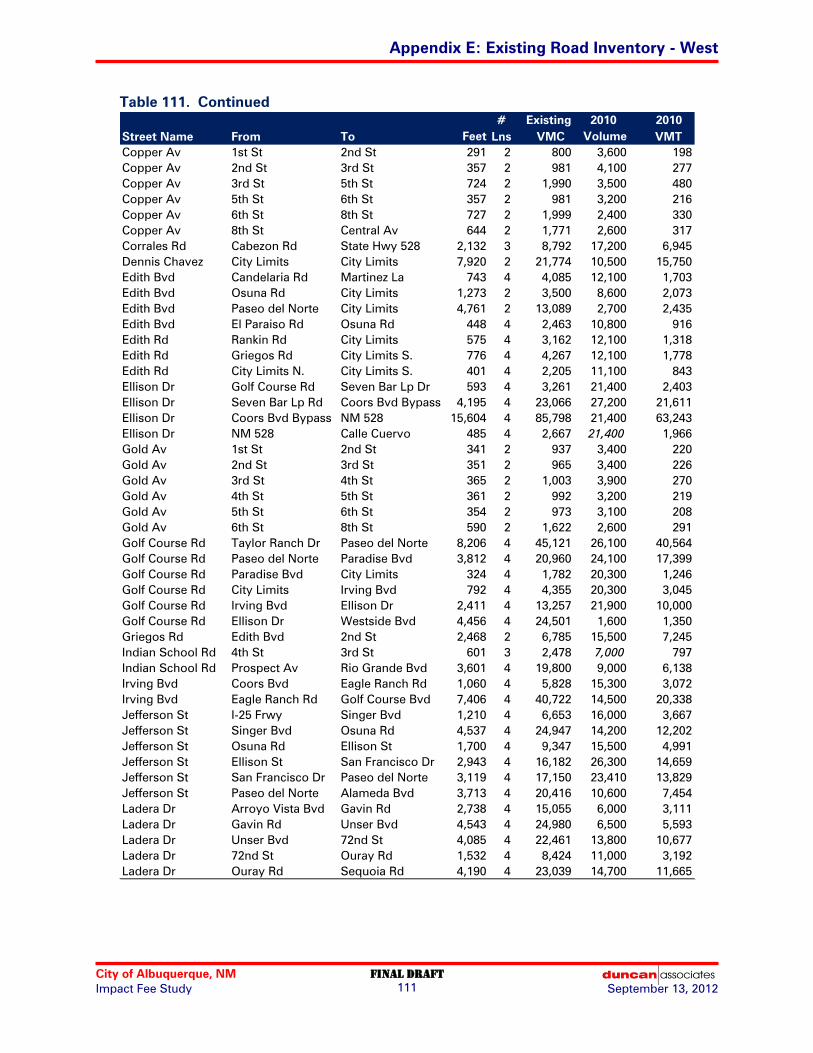
Appendix E: Existing Road Inventory - West
City of Albuquerque, NM Final draft
Impact Fee Study September 13, 2012 111
Table 111. Continued
# Existing 2010 2010
Street Name From To Feet Lns VMC Volume VMT
Copper Av 1st St 2nd St 291 2 800 3,600 198
Copper Av 2nd St 3rd St 357 2 981 4,100 277
Copper Av 3rd St 5th St 724 2 1,990 3,500 480
Copper Av 5th St 6th St 357 2 981 3,200 216
Copper Av 6th St 8th St 727 2 1,999 2,400 330
Copper Av 8th St Central Av 644 2 1,771 2,600 317
Corrales Rd Cabezon Rd State Hwy 528 2,132 3 8,792 17,200 6,945
Dennis Chavez City Limits City Limits 7,920 2 21,774 10,500 15,750
Edith Bvd Candelaria Rd Martinez La 743 4 4,085 12,100 1,703
Edith Bvd Osuna Rd City Limits 1,273 2 3,500 8,600 2,073
Edith Bvd Paseo del Norte City Limits 4,761 2 13,089 2,700 2,435
Edith Bvd El Paraiso Rd Osuna Rd 448 4 2,463 10,800 916
Edith Rd Rankin Rd City Limits 575 4 3,162 12,100 1,318
Edith Rd Griegos Rd City Limits S. 776 4 4,267 12,100 1,778
Edith Rd City Limits N. City Limits S. 401 4 2,205 11,100 843
Ellison Dr Golf Course Rd Seven Bar Lp Dr 593 4 3,261 21,400 2,403
Ellison Dr Seven Bar Lp Rd Coors Bvd Bypass 4,195 4 23,066 27,200 21,611
Ellison Dr Coors Bvd Bypass NM 528 15,604 4 85,798 21,400 63,243
Ellison Dr NM 528 Calle Cuervo 485 4 2,667 21,400 1,966
Gold Av 1st St 2nd St 341 2 937 3,400 220
Gold Av 2nd St 3rd St 351 2 965 3,400 226
Gold Av 3rd St 4th St 365 2 1,003 3,900 270
Gold Av 4th St 5th St 361 2 992 3,200 219
Gold Av 5th St 6th St 354 2 973 3,100 208
Gold Av 6th St 8th St 590 2 1,622 2,600 291
Golf Course Rd Taylor Ranch Dr Paseo del Norte 8,206 4 45,121 26,100 40,564
Golf Course Rd Paseo del Norte Paradise Bvd 3,812 4 20,960 24,100 17,399
Golf Course Rd Paradise Bvd City Limits 324 4 1,782 20,300 1,246
Golf Course Rd City Limits Irving Bvd 792 4 4,355 20,300 3,045
Golf Course Rd Irving Bvd Ellison Dr 2,411 4 13,257 21,900 10,000
Golf Course Rd Ellison Dr Westside Bvd 4,456 4 24,501 1,600 1,350
Griegos Rd Edith Bvd 2nd St 2,468 2 6,785 15,500 7,245
Indian School Rd 4th St 3rd St 601 3 2,478 7,000 797
Indian School Rd Prospect Av Rio Grande Bvd 3,601 4 19,800 9,000 6,138
Irving Bvd Coors Bvd Eagle Ranch Rd 1,060 4 5,828 15,300 3,072
Irving Bvd Eagle Ranch Rd Golf Course Bvd 7,406 4 40,722 14,500 20,338
Jefferson St I-25 Frwy Singer Bvd 1,210 4 6,653 16,000 3,667
Jefferson St Singer Bvd Osuna Rd 4,537 4 24,947 14,200 12,202
Jefferson St Osuna Rd Ellison St 1,700 4 9,347 15,500 4,991
Jefferson St Ellison St San Francisco Dr 2,943 4 16,182 26,300 14,659
Jefferson St San Francisco Dr Paseo del Norte 3,119 4 17,150 23,410 13,829
Jefferson St Paseo del Norte Alameda Bvd 3,713 4 20,416 10,600 7,454
Ladera Dr Arroyo Vista Bvd Gavin Rd 2,738 4 15,055 6,000 3,111
Ladera Dr Gavin Rd Unser Bvd 4,543 4 24,980 6,500 5,593
Ladera Dr Unser Bvd 72nd St 4,085 4 22,461 13,800 10,677
Ladera Dr 72nd St Ouray Rd 1,532 4 8,424 11,000 3,192
Ladera Dr Ouray Rd Sequoia Rd 4,190 4 23,039 14,700 11,665
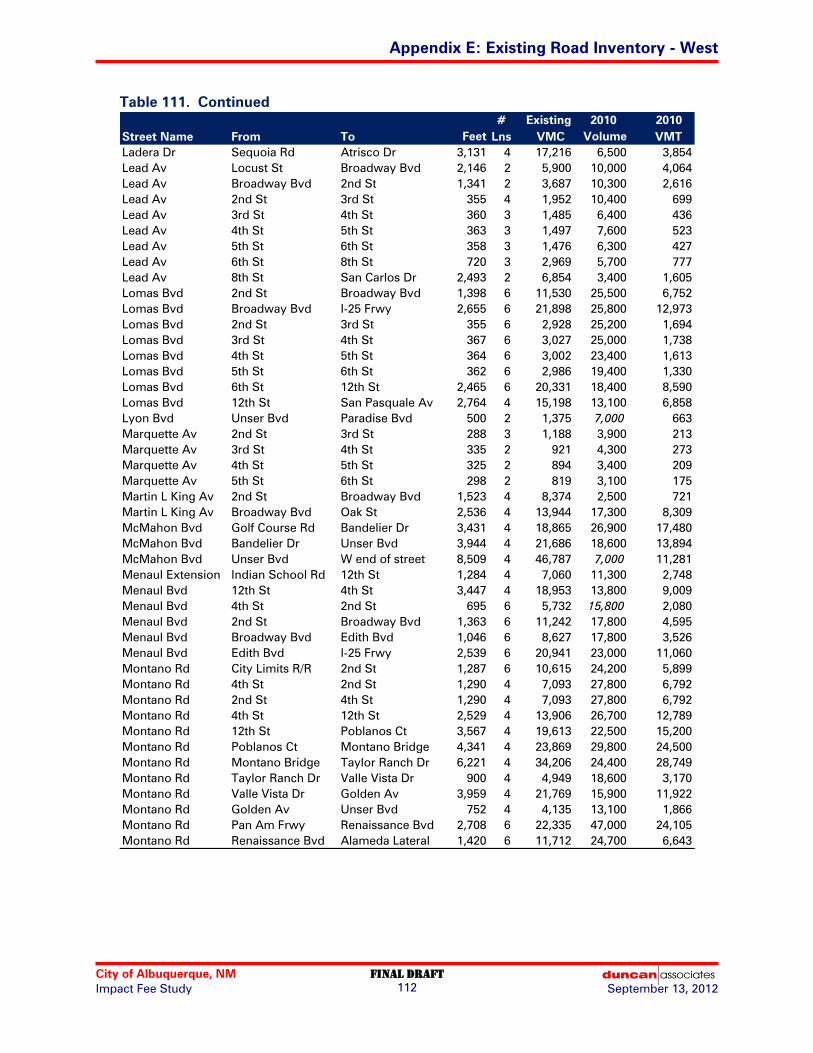
Appendix E: Existing Road Inventory - West
City of Albuquerque, NM Final draft
Impact Fee Study September 13, 2012 112
Table 111. Continued
# Existing 2010 2010
Street Name From To Feet Lns VMC Volume VMT
Ladera Dr Sequoia Rd Atrisco Dr 3,131 4 17,216 6,500 3,854
Lead Av Locust St Broadway Bvd 2,146 2 5,900 10,000 4,064
Lead Av Broadway Bvd 2nd St 1,341 2 3,687 10,300 2,616
Lead Av 2nd St 3rd St 355 4 1,952 10,400 699
Lead Av 3rd St 4th St 360 3 1,485 6,400 436
Lead Av 4th St 5th St 363 3 1,497 7,600 523
Lead Av 5th St 6th St 358 3 1,476 6,300 427
Lead Av 6th St 8th St 720 3 2,969 5,700 777
Lead Av 8th St San Carlos Dr 2,493 2 6,854 3,400 1,605
Lomas Bvd 2nd St Broadway Bvd 1,398 6 11,530 25,500 6,752
Lomas Bvd Broadway Bvd I-25 Frwy 2,655 6 21,898 25,800 12,973
Lomas Bvd 2nd St 3rd St 355 6 2,928 25,200 1,694
Lomas Bvd 3rd St 4th St 367 6 3,027 25,000 1,738
Lomas Bvd 4th St 5th St 364 6 3,002 23,400 1,613
Lomas Bvd 5th St 6th St 362 6 2,986 19,400 1,330
Lomas Bvd 6th St 12th St 2,465 6 20,331 18,400 8,590
Lomas Bvd 12th St San Pasquale Av 2,764 4 15,198 13,100 6,858
Lyon Bvd Unser Bvd Paradise Bvd 500 2 1,375 7,000 663
Marquette Av 2nd St 3rd St 288 3 1,188 3,900 213
Marquette Av 3rd St 4th St 335 2 921 4,300 273
Marquette Av 4th St 5th St 325 2 894 3,400 209
Marquette Av 5th St 6th St 298 2 819 3,100 175
Martin L King Av 2nd St Broadway Bvd 1,523 4 8,374 2,500 721
Martin L King Av Broadway Bvd Oak St 2,536 4 13,944 17,300 8,309
McMahon Bvd Golf Course Rd Bandelier Dr 3,431 4 18,865 26,900 17,480
McMahon Bvd Bandelier Dr Unser Bvd 3,944 4 21,686 18,600 13,894
McMahon Bvd Unser Bvd W end of street 8,509 4 46,787 7,000 11,281
Menaul Extension Indian School Rd 12th St 1,284 4 7,060 11,300 2,748
Menaul Bvd 12th St 4th St 3,447 4 18,953 13,800 9,009
Menaul Bvd 4th St 2nd St 695 6 5,732 15,800 2,080
Menaul Bvd 2nd St Broadway Bvd 1,363 6 11,242 17,800 4,595
Menaul Bvd Broadway Bvd Edith Bvd 1,046 6 8,627 17,800 3,526
Menaul Bvd Edith Bvd I-25 Frwy 2,539 6 20,941 23,000 11,060
Montano Rd City Limits R/R 2nd St 1,287 6 10,615 24,200 5,899
Montano Rd 4th St 2nd St 1,290 4 7,093 27,800 6,792
Montano Rd 2nd St 4th St 1,290 4 7,093 27,800 6,792
Montano Rd 4th St 12th St 2,529 4 13,906 26,700 12,789
Montano Rd 12th St Poblanos Ct 3,567 4 19,613 22,500 15,200
Montano Rd Poblanos Ct Montano Bridge 4,341 4 23,869 29,800 24,500
Montano Rd Montano Bridge Taylor Ranch Dr 6,221 4 34,206 24,400 28,749
Montano Rd Taylor Ranch Dr Valle Vista Dr 900 4 4,949 18,600 3,170
Montano Rd Valle Vista Dr Golden Av 3,959 4 21,769 15,900 11,922
Montano Rd Golden Av Unser Bvd 752 4 4,135 13,100 1,866
Montano Rd Pan Am Frwy Renaissance Bvd 2,708 6 22,335 47,000 24,105
Montano Rd Renaissance Bvd Alameda Lateral 1,420 6 11,712 24,700 6,643
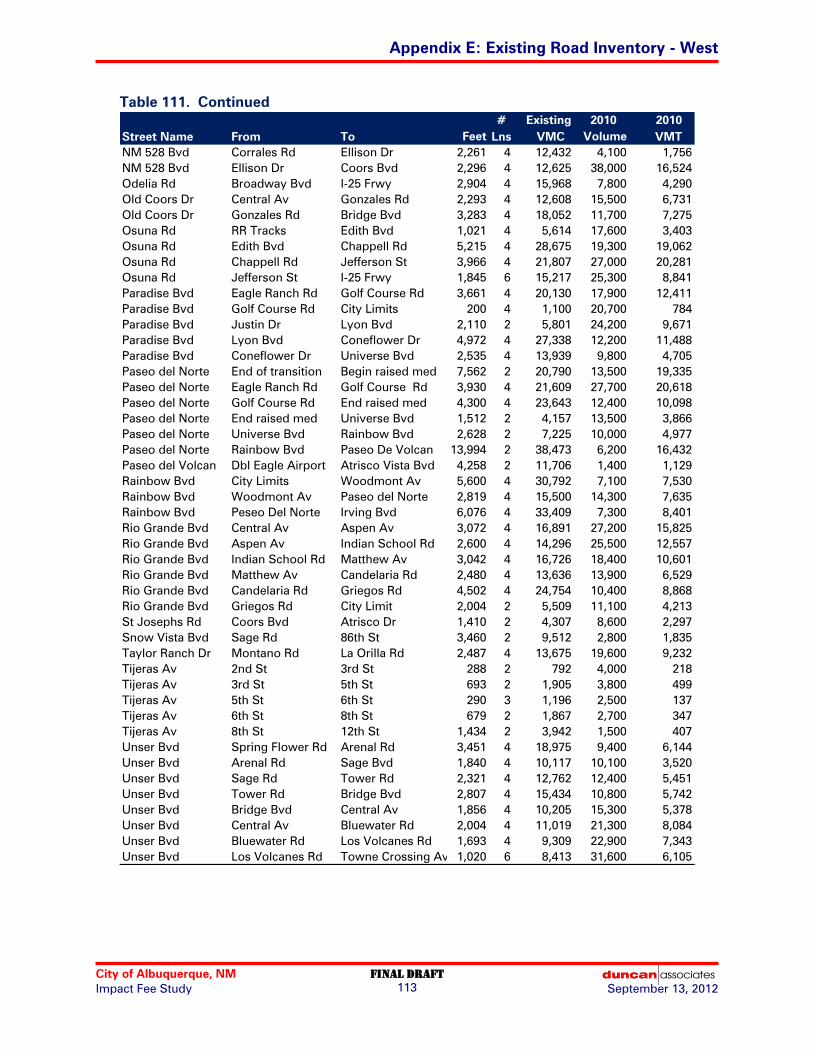
Appendix E: Existing Road Inventory - West
City of Albuquerque, NM Final draft
Impact Fee Study September 13, 2012 113
Table 111. Continued
# Existing 2010 2010
Street Name From To Feet Lns VMC Volume VMT
NM 528 Bvd Corrales Rd Ellison Dr 2,261 4 12,432 4,100 1,756
NM 528 Bvd Ellison Dr Coors Bvd 2,296 4 12,625 38,000 16,524
Odelia Rd Broadway Bvd I-25 Frwy 2,904 4 15,968 7,800 4,290
Old Coors Dr Central Av Gonzales Rd 2,293 4 12,608 15,500 6,731
Old Coors Dr Gonzales Rd Bridge Bvd 3,283 4 18,052 11,700 7,275
Osuna Rd RR Tracks Edith Bvd 1,021 4 5,614 17,600 3,403
Osuna Rd Edith Bvd Chappell Rd 5,215 4 28,675 19,300 19,062
Osuna Rd Chappell Rd Jefferson St 3,966 4 21,807 27,000 20,281
Osuna Rd Jefferson St I-25 Frwy 1,845 6 15,217 25,300 8,841
Paradise Bvd Eagle Ranch Rd Golf Course Rd 3,661 4 20,130 17,900 12,411
Paradise Bvd Golf Course Rd City Limits 200 4 1,100 20,700 784
Paradise Bvd Justin Dr Lyon Bvd 2,110 2 5,801 24,200 9,671
Paradise Bvd Lyon Bvd Coneflower Dr 4,972 4 27,338 12,200 11,488
Paradise Bvd Coneflower Dr Universe Bvd 2,535 4 13,939 9,800 4,705
Paseo del Norte End of transition Begin raised med 7,562 2 20,790 13,500 19,335
Paseo del Norte Eagle Ranch Rd Golf Course Rd 3,930 4 21,609 27,700 20,618
Paseo del Norte Golf Course Rd End raised med 4,300 4 23,643 12,400 10,098
Paseo del Norte End raised med Universe Bvd 1,512 2 4,157 13,500 3,866
Paseo del Norte Universe Bvd Rainbow Bvd 2,628 2 7,225 10,000 4,977
Paseo del Norte Rainbow Bvd Paseo De Volcan 13,994 2 38,473 6,200 16,432
Paseo del Volcan Dbl Eagle Airport Atrisco Vista Bvd 4,258 2 11,706 1,400 1,129
Rainbow Bvd City Limits Woodmont Av 5,600 4 30,792 7,100 7,530
Rainbow Bvd Woodmont Av Paseo del Norte 2,819 4 15,500 14,300 7,635
Rainbow Bvd Peseo Del Norte Irving Bvd 6,076 4 33,409 7,300 8,401
Rio Grande Bvd Central Av Aspen Av 3,072 4 16,891 27,200 15,825
Rio Grande Bvd Aspen Av Indian School Rd 2,600 4 14,296 25,500 12,557
Rio Grande Bvd Indian School Rd Matthew Av 3,042 4 16,726 18,400 10,601
Rio Grande Bvd Matthew Av Candelaria Rd 2,480 4 13,636 13,900 6,529
Rio Grande Bvd Candelaria Rd Griegos Rd 4,502 4 24,754 10,400 8,868
Rio Grande Bvd Griegos Rd City Limit 2,004 2 5,509 11,100 4,213
St Josephs Rd Coors Bvd Atrisco Dr 1,410 2 4,307 8,600 2,297
Snow Vista Bvd Sage Rd 86th St 3,460 2 9,512 2,800 1,835
Taylor Ranch Dr Montano Rd La Orilla Rd 2,487 4 13,675 19,600 9,232
Tijeras Av 2nd St 3rd St 288 2 792 4,000 218
Tijeras Av 3rd St 5th St 693 2 1,905 3,800 499
Tijeras Av 5th St 6th St 290 3 1,196 2,500 137
Tijeras Av 6th St 8th St 679 2 1,867 2,700 347
Tijeras Av 8th St 12th St 1,434 2 3,942 1,500 407
Unser Bvd Spring Flower Rd Arenal Rd 3,451 4 18,975 9,400 6,144
Unser Bvd Arenal Rd Sage Bvd 1,840 4 10,117 10,100 3,520
Unser Bvd Sage Rd Tower Rd 2,321 4 12,762 12,400 5,451
Unser Bvd Tower Rd Bridge Bvd 2,807 4 15,434 10,800 5,742
Unser Bvd Bridge Bvd Central Av 1,856 4 10,205 15,300 5,378
Unser Bvd Central Av Bluewater Rd 2,004 4 11,019 21,300 8,084
Unser Bvd Bluewater Rd Los Volcanes Rd 1,693 4 9,309 22,900 7,343
Unser Bvd Los Volcanes Rd Towne Crossing Av 1,020 6 8,413 31,600 6,105

Appendix E: Existing Road Inventory - West
City of Albuquerque, NM Final draft
Impact Fee Study September 13, 2012 114
Table 111. Continued
# Existing 2010 2010
Street Name From To Feet Lns VMC Volume VMT
Unser Bvd Ladera Dr Vista Oriente St 2,171 4 11,937 19,000 7,812
Unser Bvd Vista Oriente St St Joseph Av 6,813 4 37,461 20,200 26,065
Unser Bvd St Joseph Av Western Trl 4,363 4 23,990 19,800 16,361
Unser Bvd Western Trl Dellyne Av 4,722 4 25,964 22,000 19,675
Unser Bvd Black Arroyo Bvd McMahon Bvd 655 2 1,801 26,800 3,325
Unser Bvd McMahon Bvd Irving Bvd 5,097 2 14,013 22,100 21,334
Unser Bvd Blue Feather Av Lyon Bvd 2,134 2 5,867 7,000 2,829
Unser Bvd City Limits Dennis Chavez Bvd 3,783 4 20,801 7,000 5,015
Western Trail Unser Bvd Atrisco Dr 1,815 4 9,980 7,200 2,475
Western Trail Atrisco Dr Coors Bvd 1,960 4 10,777 5,600 2,079
Westside Bvd NM 528 Seven Bar Lp Rd 2,645 2 7,272 9,500 4,759
Westside Bvd Seven Bar Lp Rd Golf Course Rd 1,613 2 4,435 5,100 1,558
Westside Bvd Golf Course Rd W end of street 969 2 2,664 4,000 734
Total, West Service Area 3,562,196 2,165,193 Source: Parsons Brinckerhoff, March 29, 2012; “Feet” is length of road segment; “# Lns” is number of through lanes;
“Existing VMC” is daily vehicle-miles of capacity, based on 1,000 vehicles per lane per hour used by the Mid Region
Council of Governments in their regional travel demand model, and 0.124 pm peaking factor (12.4% of daily trips in the
pm peak hour) from Parsons Brinckerhoff analysis of 20 intersections; “2010 Volume” based on average daily traffic
counts (numbers in italics are estimated based on adjacent roadway volumes or 7,000 trip average for 2-lane roadways
with traffic counts; “2010 VMT” is daily vehicle-miles of travel, calculated by multiplying segment length in miles and
traffic volume.

City of Albuquerque, NM FINAL draft
Impact Fee Study 115 September 13, 2012
APPENDIX F: PARK INVENTORY
Table 112. Existing Park Inventory
Park Name Area
Total
Acres
Owned
Acres
Dev'd
Acres Ten
nis, L
it
Ten
nis, U
nlit
Basketb
all, Fu
ll
Basketb
all, H
alf
So
ccer
Ballfield
, L
it
Ballfield
, U
nlit
Yo
uth
B
allfld
Po
ol, In
do
or
Po
ol, O
utd
oo
r
Ho
rsesh
oe P
it
Vo
lleyb
all C
ou
rt
Backsto
p
Play A
rea
Exercise S
tatio
n
Skate B
oard
Sh
ad
e S
tru
ctu
re
Parkin
g S
pace
Academy Hills NE 16.60 16.60 16.60 0 0 1 0 2 0 0 0 0 0 0 0 0 1 0 0 2 0
Alameda Little League NW 15.50 15.50 0.00 0 0 0 0 0 0 0 0 0 0 0 0 0 0 0 0 0 0
Alamosa SW 4.70 4.70 4.70 0 4 0 2 0 0 0 0 0 0 0 0 0 1 0 0 2 0
Alamosa Center SW 13.70 11.70 13.70 0 0 2 0 0 0 0 0 0 0 0 0 0 0 1 0 0 0
Albuquerque Veloport SE 7.40 7.40 7.40 0 0 0 0 0 0 0 0 0 0 0 0 0 0 0 0 0 0
Altura SE 6.20 6.20 6.20 0 2 0 0 1 0 0 0 0 0 0 0 0 1 0 0 0 0
Alvarado SE 3.70 3.70 3.70 0 0 0 1 1 0 0 0 0 0 0 0 0 2 0 0 0 0
Andalucia NW 2.40 2.40 0.00 0 0 0 0 0 0 0 0 0 0 0 0 0 0 0 0 0 0
Anderson Heights SW 2.00 2.00 0.00 0 0 0 0 0 0 0 0 0 0 0 0 0 0 0 0 0 0
Anderson Highlands SW 2.20 2.20 2.20 0 0 0 1 0 0 0 0 0 0 0 0 0 1 0 0 1 0
Anderson Mesa SW 2.00 2.00 2.00 0 0 0 3 0 0 0 0 0 0 0 0 0 2 0 0 2 0
Arroyo Del Oso NE 38.50 38.50 24.50 0 6 1 0 4 0 0 0 0 0 0 0 0 1 0 0 2 234
Arroyo Del Oso Elem NE 2.70 0.00 2.70 0 0 0 0 1 0 0 0 0 0 0 0 3 0 0 0 0 0
Avalon SW 3.00 3.00 3.00 0 2 0 1 0 0 0 0 0 0 0 0 0 3 0 0 1 0
Aztec NE 5.50 5.50 5.50 0 6 0 0 1 0 0 0 0 0 0 0 0 2 0 1 1 0
Balduini SE 8.70 8.70 6.80 0 0 0 0 0 0 0 3 0 0 0 0 0 0 0 0 0 0
Bandelier Elem School SE 2.80 0.00 2.00 0 0 0 0 1 0 0 0 0 0 0 0 0 0 0 0 0 0
Barelas SW 4.10 3.10 4.10 6 0 1 3 0 0 0 0 0 0 0 0 1 2 0 0 1 23
Barelas Railroad SW 11.50 11.50 11.50 0 0 0 0 0 3 0 0 0 0 0 0 0 1 0 0 1 69
Barstow NE 4.30 4.30 4.30 0 0 0 0 0 0 0 0 0 0 0 0 0 1 0 0 1 7
Bataan Memorial SE 4.50 4.50 4.50 0 0 0 0 0 0 0 0 0 0 0 0 0 0 0 0 0 0
Bel-Air/Miramontes SE 3.40 3.40 3.40 0 0 0 0 0 0 0 0 0 0 0 0 0 3 0 0 2 5
Bellrose NW 0.10 0.10 0.00 0 0 0 1 0 0 0 0 0 0 0 0 0 1 0 0 1 0
Bernardo Trails NW 2.50 2.50 2.50 0 0 0 2 1 0 0 0 0 0 0 0 0 3 0 0 1 0
Beyer SE 0.30 0.30 0.30 0 0 0 0 0 0 0 0 0 0 0 0 0 0 0 0 0 0
Bianchetti SE 3.70 3.70 3.70 0 0 0 1 1 0 0 0 0 0 0 0 0 1 0 0 2 0
Black Arroyo NW 4.25 4.25 4.25 0 0 0 0 0 0 0 0 0 0 0 0 0 1 0 0 3 0
Briar Ridge NW 2.00 2.00 2.00 0 0 0 1 0 0 0 0 0 0 0 0 0 1 0 0 0 7
Burton SE 8.50 8.50 8.50 0 0 0 0 0 0 0 0 0 0 1 1 0 1 0 0 3 0
Butterfield Well/Park NW 0.10 0.00 0.10 0 0 0 0 0 0 0 0 0 0 0 0 0 0 0 0 1 0
Calle De Vida NW 2.00 2.00 1.00 0 0 0 2 0 0 0 0 0 0 0 0 0 3 0 0 1 0
Cardwell NE 0.90 0.90 0.90 0 0 0 0 0 0 0 0 0 0 0 0 0 0 0 0 0 0
Carlos Rey SW 7.70 7.70 7.70 0 2 0 2 1 0 0 0 0 0 0 0 0 1 0 0 1 0
Carlos Rey Elem SW 3.50 0.00 3.50 0 0 0 0 2 0 0 0 0 0 0 0 0 0 0 0 0 0
Casa Grande Linear NE 19.00 19.00 19.00 0 0 0 0 0 0 0 0 0 0 0 0 0 2 0 0 1 0
Cedar Ridge Pond SW 2.90 2.90 2.90 0 0 0 0 0 0 0 0 0 0 0 0 0 0 0 0 0 0
Chantilly NW 2.00 2.00 2.00 0 0 0 0 0 0 0 0 0 0 0 0 0 1 0 0 0 0
Chelwood SE 3.90 3.90 3.90 0 0 0 1 1 0 0 0 0 0 0 0 0 1 0 0 0 0
City View Estates SE 4.10 4.10 4.10 0 0 0 2 0 0 0 0 0 0 0 0 0 2 0 0 0 0
Cochiti Elem School NW 3.60 0.00 3.60 0 0 0 0 1 0 0 0 0 0 0 0 0 0 0 0 0 0
Columbus NW 6.40 6.40 6.40 4 0 0 1 1 0 0 0 0 0 0 0 0 1 0 0 2 68
Comanche Elem NE 1.70 0.00 1.70 0 0 0 0 1 0 0 0 0 0 0 0 0 0 0 0 0 0
Comanche North NE 7.90 0.00 0.00 0 0 0 0 0 0 0 0 0 0 0 0 0 0 0 0 0 0
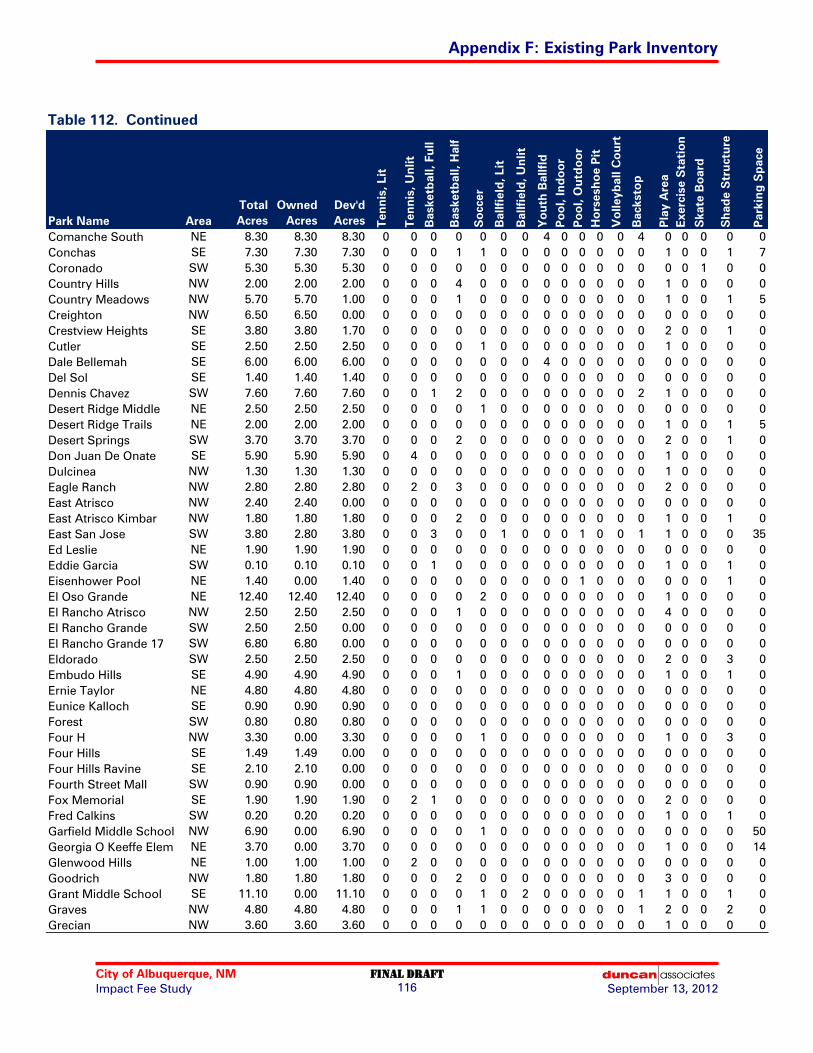
Appendix F: Existing Park Inventory
City of Albuquerque, NM Final draft
Impact Fee Study September 13, 2012 116
Table 112. Continued
Park Name Area
Total
Acres
Owned
Acres
Dev'd
Acres Ten
nis, L
it
Ten
nis, U
nlit
Basketb
all, Fu
ll
Basketb
all, H
alf
So
ccer
Ballfield
, L
it
Ballfield
, U
nlit
Yo
uth
B
allfld
Po
ol, In
do
or
Po
ol, O
utd
oo
r
Ho
rsesh
oe P
it
Vo
lleyb
all C
ou
rt
Backsto
p
Play A
rea
Exercise S
tatio
n
Skate B
oard
Sh
ad
e S
tru
ctu
re
Parkin
g S
pace
Comanche South NE 8.30 8.30 8.30 0 0 0 0 0 0 0 4 0 0 0 0 4 0 0 0 0 0
Conchas SE 7.30 7.30 7.30 0 0 0 1 1 0 0 0 0 0 0 0 0 1 0 0 1 7
Coronado SW 5.30 5.30 5.30 0 0 0 0 0 0 0 0 0 0 0 0 0 0 0 1 0 0
Country Hills NW 2.00 2.00 2.00 0 0 0 4 0 0 0 0 0 0 0 0 0 1 0 0 0 0
Country Meadows NW 5.70 5.70 1.00 0 0 0 1 0 0 0 0 0 0 0 0 0 1 0 0 1 5
Creighton NW 6.50 6.50 0.00 0 0 0 0 0 0 0 0 0 0 0 0 0 0 0 0 0 0
Crestview Heights SE 3.80 3.80 1.70 0 0 0 0 0 0 0 0 0 0 0 0 0 2 0 0 1 0
Cutler SE 2.50 2.50 2.50 0 0 0 0 1 0 0 0 0 0 0 0 0 1 0 0 0 0
Dale Bellemah SE 6.00 6.00 6.00 0 0 0 0 0 0 0 4 0 0 0 0 0 0 0 0 0 0
Del Sol SE 1.40 1.40 1.40 0 0 0 0 0 0 0 0 0 0 0 0 0 0 0 0 0 0
Dennis Chavez SW 7.60 7.60 7.60 0 0 1 2 0 0 0 0 0 0 0 0 2 1 0 0 0 0
Desert Ridge Middle NE 2.50 2.50 2.50 0 0 0 0 1 0 0 0 0 0 0 0 0 0 0 0 0 0
Desert Ridge Trails NE 2.00 2.00 2.00 0 0 0 0 0 0 0 0 0 0 0 0 0 1 0 0 1 5
Desert Springs SW 3.70 3.70 3.70 0 0 0 2 0 0 0 0 0 0 0 0 0 2 0 0 1 0
Don Juan De Onate SE 5.90 5.90 5.90 0 4 0 0 0 0 0 0 0 0 0 0 0 1 0 0 0 0
Dulcinea NW 1.30 1.30 1.30 0 0 0 0 0 0 0 0 0 0 0 0 0 1 0 0 0 0
Eagle Ranch NW 2.80 2.80 2.80 0 2 0 3 0 0 0 0 0 0 0 0 0 2 0 0 0 0
East Atrisco NW 2.40 2.40 0.00 0 0 0 0 0 0 0 0 0 0 0 0 0 0 0 0 0 0
East Atrisco Kimbar NW 1.80 1.80 1.80 0 0 0 2 0 0 0 0 0 0 0 0 0 1 0 0 1 0
East San Jose SW 3.80 2.80 3.80 0 0 3 0 0 1 0 0 0 1 0 0 1 1 0 0 0 35
Ed Leslie NE 1.90 1.90 1.90 0 0 0 0 0 0 0 0 0 0 0 0 0 0 0 0 0 0
Eddie Garcia SW 0.10 0.10 0.10 0 0 1 0 0 0 0 0 0 0 0 0 0 1 0 0 1 0
Eisenhower Pool NE 1.40 0.00 1.40 0 0 0 0 0 0 0 0 0 1 0 0 0 0 0 0 1 0
El Oso Grande NE 12.40 12.40 12.40 0 0 0 0 2 0 0 0 0 0 0 0 0 1 0 0 0 0
El Rancho Atrisco NW 2.50 2.50 2.50 0 0 0 1 0 0 0 0 0 0 0 0 0 4 0 0 0 0
El Rancho Grande SW 2.50 2.50 0.00 0 0 0 0 0 0 0 0 0 0 0 0 0 0 0 0 0 0
El Rancho Grande 17 SW 6.80 6.80 0.00 0 0 0 0 0 0 0 0 0 0 0 0 0 0 0 0 0 0
Eldorado SW 2.50 2.50 2.50 0 0 0 0 0 0 0 0 0 0 0 0 0 2 0 0 3 0
Embudo Hills SE 4.90 4.90 4.90 0 0 0 1 0 0 0 0 0 0 0 0 0 1 0 0 1 0
Ernie Taylor NE 4.80 4.80 4.80 0 0 0 0 0 0 0 0 0 0 0 0 0 0 0 0 0 0
Eunice Kalloch SE 0.90 0.90 0.90 0 0 0 0 0 0 0 0 0 0 0 0 0 0 0 0 0 0
Forest SW 0.80 0.80 0.80 0 0 0 0 0 0 0 0 0 0 0 0 0 0 0 0 0 0
Four H NW 3.30 0.00 3.30 0 0 0 0 1 0 0 0 0 0 0 0 0 1 0 0 3 0
Four Hills SE 1.49 1.49 0.00 0 0 0 0 0 0 0 0 0 0 0 0 0 0 0 0 0 0
Four Hills Ravine SE 2.10 2.10 0.00 0 0 0 0 0 0 0 0 0 0 0 0 0 0 0 0 0 0
Fourth Street Mall SW 0.90 0.90 0.00 0 0 0 0 0 0 0 0 0 0 0 0 0 0 0 0 0 0
Fox Memorial SE 1.90 1.90 1.90 0 2 1 0 0 0 0 0 0 0 0 0 0 2 0 0 0 0
Fred Calkins SW 0.20 0.20 0.20 0 0 0 0 0 0 0 0 0 0 0 0 0 1 0 0 1 0
Garfield Middle School NW 6.90 0.00 6.90 0 0 0 0 1 0 0 0 0 0 0 0 0 0 0 0 0 50
Georgia O Keeffe Elem NE 3.70 0.00 3.70 0 0 0 0 0 0 0 0 0 0 0 0 0 1 0 0 0 14
Glenwood Hills NE 1.00 1.00 1.00 0 2 0 0 0 0 0 0 0 0 0 0 0 0 0 0 0 0
Goodrich NW 1.80 1.80 1.80 0 0 0 2 0 0 0 0 0 0 0 0 0 3 0 0 0 0
Grant Middle School SE 11.10 0.00 11.10 0 0 0 0 1 0 2 0 0 0 0 0 1 1 0 0 1 0
Graves NW 4.80 4.80 4.80 0 0 0 1 1 0 0 0 0 0 0 0 1 2 0 0 2 0
Grecian NW 3.60 3.60 3.60 0 0 0 0 0 0 0 0 0 0 0 0 0 1 0 0 0 0

Appendix F: Existing Park Inventory
City of Albuquerque, NM Final draft
Impact Fee Study September 13, 2012 117
Table 112. Continued
Park Name Area
Total
Acres
Owned
Acres
Dev'd
Acres Ten
nis, L
it
Ten
nis, U
nlit
Basketb
all, Fu
ll
Basketb
all, H
alf
So
ccer
Ballfield
, L
it
Ballfield
, U
nlit
Yo
uth
B
allfld
Po
ol, In
do
or
Po
ol, O
utd
oo
r
Ho
rsesh
oe P
it
Vo
lleyb
all C
ou
rt
Backsto
p
Play A
rea
Exercise S
tatio
n
Skate B
oard
Sh
ad
e S
tru
ctu
re
Parkin
g S
pace
Grisham NE 5.20 5.20 5.20 0 0 0 0 1 0 0 0 0 0 0 0 0 1 0 0 0 0
Guadalupe SW 0.20 0.20 0.20 0 0 1 0 0 0 0 0 0 0 0 0 0 2 0 0 0 0
Hahn NE 9.30 9.30 8.20 0 0 0 0 0 0 0 5 0 0 0 0 0 0 0 0 0 0
Hawthorne Elem SE 2.30 0.00 2.30 0 0 0 0 1 0 0 0 0 0 0 0 2 0 0 0 1 0
Hayes Middle School SE 2.40 0.00 2.40 0 0 0 0 1 0 0 0 0 0 0 0 0 0 0 0 0 0
Hazeldine SW 0.10 0.10 0.10 0 0 0 1 0 0 0 0 0 0 0 0 0 0 0 0 1 0
Heights SE 2.40 0.00 1.70 0 0 0 0 0 0 0 0 0 0 0 0 0 1 0 0 0 137
Heritage Hills NE 23.00 23.00 23.00 0 0 0 1 2 0 0 0 0 0 0 0 0 1 0 0 0 83
Hermosa Green SE 0.20 0.20 0.20 0 0 0 0 0 0 0 0 0 0 0 0 0 0 0 0 0 0
High Desert NE 10.40 10.40 8.20 0 2 2 0 1 0 0 0 0 0 0 1 0 2 0 0 0 0
Highland SW 2.30 2.30 2.30 0 0 0 0 0 0 0 0 0 0 0 0 0 1 0 0 1 25
Highland Det. Pond SE 4.40 4.40 4.40 0 0 0 0 1 0 0 0 0 0 0 0 0 0 0 0 0 0
Highland Pool SE 1.10 0.00 1.10 0 0 0 0 0 0 0 0 1 0 0 0 0 0 0 0 0 0
Hoffman SE 8.00 8.00 8.00 0 3 0 4 1 0 0 0 0 0 0 0 0 1 0 0 0 0
Holiday NE 4.80 3.80 4.80 0 0 1 0 0 0 0 0 0 0 0 0 0 2 0 0 1 37
Hunter's Run NW 3.30 3.30 3.30 0 0 0 0 0 0 0 0 0 0 1 0 0 1 0 0 1 4
Hyder SE 4.10 4.10 4.10 0 0 0 0 0 0 0 0 0 0 0 0 0 0 0 0 0 0
Inez SE 3.00 3.00 3.00 0 0 0 0 1 0 0 0 0 0 0 0 0 0 0 0 0 0
Inez Elem School SE 0.80 0.00 0.80 0 0 0 0 1 0 0 0 0 0 0 0 0 0 0 0 0 0
Jack And Jill SE 0.90 0.90 0.90 0 0 0 1 0 0 0 0 0 0 0 0 0 1 1 1 2 0
Jade NE 2.00 2.00 2.00 0 0 0 0 0 0 0 0 0 0 0 0 0 1 0 0 0 1
Jeanne Bellamah SE 7.20 6.20 7.20 0 0 1 0 1 0 0 0 0 0 0 0 0 1 0 0 1 32
Jerry Cline SE 13.90 13.90 13.90 9 3 0 0 1 0 0 0 0 0 0 0 0 1 0 0 2 67
John Adams Middle SW 3.20 0.00 3.20 0 0 0 0 1 0 0 0 0 0 0 0 2 0 0 0 0 0
John Carrillo SE 2.60 2.60 2.60 0 0 3 2 0 0 0 0 0 0 0 0 0 2 0 0 1 0
Katherine Nicole NW 4.50 4.50 4.50 0 0 0 0 0 0 0 0 0 0 0 0 0 0 0 0 1 0
Kennedy Middle SE 2.00 0.00 1.60 0 0 0 0 1 0 0 0 0 0 0 0 0 0 0 0 0 0
Kirtland SE 11.40 10.40 11.40 0 0 2 0 0 0 0 0 0 0 0 0 1 1 0 0 2 67
Kit Carson SW 9.60 9.60 9.60 0 0 0 0 0 0 0 0 0 0 0 0 0 2 0 0 0 60
Kiva NE 1.00 1.00 1.00 0 0 0 1 0 0 0 0 0 0 0 0 0 2 0 0 0 0
Korean War Veterans SE 14.20 13.20 12.70 0 0 2 0 1 0 0 0 0 0 0 0 0 1 0 0 0 0
Krogh NW 1.00 1.00 1.00 0 0 0 2 0 0 0 0 0 0 0 0 0 1 0 0 0 0
La Paloma NE 0.80 0.80 0.80 0 0 0 0 0 0 0 0 0 0 0 0 0 1 0 0 0 0
La Palomita NE 1.60 1.60 1.60 0 0 0 0 0 0 0 0 0 0 0 0 0 2 0 0 0 0
Ladera Pond NW 20.60 20.60 20.60 0 0 0 0 0 0 0 0 0 0 0 0 0 0 0 0 0 0
Lafayette NE 1.10 1.10 0.60 0 0 0 2 0 0 0 0 0 0 0 0 0 2 1 0 1 0
Las Marcadas NW 0.90 0.90 0.90 0 0 0 0 0 0 0 0 0 0 0 0 0 1 0 0 1 9
Lassetter SE 1.80 1.80 1.80 0 0 0 0 0 0 0 0 0 0 0 0 0 1 0 0 0 0
Laurel Circle SE 0.50 0.50 0.50 0 0 0 0 0 0 0 0 0 0 0 0 0 0 0 0 0 0
Laurelwood NW 2.40 2.40 2.20 0 0 0 1 0 0 0 0 0 0 0 0 0 1 0 0 3 0
Lauren C Bolles SE 4.70 4.70 4.70 0 4 0 2 1 0 0 0 0 0 0 0 0 2 0 0 0 0
Lavaland SW 1.50 1.50 1.50 0 0 1 0 0 0 0 0 0 0 0 0 0 2 0 0 1 0
Lazy Day SW 2.00 2.00 2.00 0 0 0 0 0 0 0 0 0 0 0 0 0 1 0 0 1 0
LBJ Middle School NW 1.80 0.00 1.80 0 0 0 0 1 0 0 0 0 0 0 0 0 0 0 0 0 0
Loma Del Norte NE 9.70 9.70 9.70 0 2 1 0 2 0 0 0 0 0 0 0 0 2 0 0 0 0

Appendix F: Existing Park Inventory
City of Albuquerque, NM Final draft
Impact Fee Study September 13, 2012 118
Table 112. Continued
Park Name Area
Total
Acres
Owned
Acres
Dev'd
Acres Ten
nis, L
it
Ten
nis, U
nlit
Basketb
all, Fu
ll
Basketb
all, H
alf
So
ccer
Ballfield
, L
it
Ballfield
, U
nlit
Yo
uth
B
allfld
Po
ol, In
do
or
Po
ol, O
utd
oo
r
Ho
rsesh
oe P
it
Vo
lleyb
all C
ou
rt
Backsto
p
Play A
rea
Exercise S
tatio
n
Skate B
oard
Sh
ad
e S
tru
ctu
re
Parkin
g S
pace
Loma Del Rey NE 3.80 3.80 3.80 0 0 0 0 0 0 0 0 0 0 0 0 0 0 0 0 0 0
Los Altos SE 32.60 32.60 32.60 6 0 0 0 0 4 0 0 1 0 1 0 0 1 0 1 1 380
Los Duranes NW 8.00 7.00 8.00 0 0 0 1 0 0 0 0 0 0 0 0 0 2 0 0 1 80
Los Tomases NW 1.00 1.00 1.00 0 0 0 0 0 0 0 0 0 0 0 0 0 1 0 0 1 0
Lowell Elem School SE 4.80 0.00 2.30 0 0 0 0 1 0 0 0 0 0 0 0 0 0 0 0 0 0
Luecking North NE 3.70 3.70 3.70 0 0 0 0 0 0 0 0 0 0 0 0 0 0 0 0 0 0
Luecking South NE 0.60 0.60 0.60 0 0 0 0 0 0 0 0 0 0 0 0 0 1 0 0 0 0
Lynnewood SE 9.40 9.40 9.40 0 2 1 0 1 0 0 0 0 0 0 0 0 1 0 0 0 0
Madison Middle NE 6.70 0.00 6.70 0 0 0 0 2 0 0 0 0 0 0 0 0 0 0 0 1 0
Manzano Mesa SE 57.90 56.90 33.30 0 0 0 0 0 0 0 5 0 0 0 0 0 1 0 0 3 0
Mariposa Basin NW 51.00 51.00 51.00 0 0 1 0 3 0 0 5 0 0 1 1 0 2 0 0 3 0
Martineztown SW 1.90 0.00 1.90 0 0 1 0 0 0 0 0 0 0 0 0 0 1 0 0 3 0
Martineztown-S Barb SW 10.20 10.20 10.20 0 0 2 0 1 1 0 0 0 0 0 0 0 1 0 0 1 42
Mary Fox SW 0.80 0.80 0.80 0 0 0 0 0 0 0 0 0 0 0 0 0 1 0 0 1 0
Matheson SE 7.40 7.40 7.40 0 0 0 0 0 0 0 0 0 0 0 0 0 1 0 0 2 0
Matthew Meadows NW 3.80 3.80 3.80 0 0 0 0 0 0 0 0 0 0 0 0 0 3 0 0 0 0
McCollum Elem SE 4.30 0.00 4.30 0 0 0 0 1 0 0 0 0 0 0 0 0 0 0 0 0 0
McDuffie SE 3.00 3.00 3.00 0 0 0 0 0 0 0 0 0 0 0 0 0 0 0 0 0 0
McKinley Middle NE 3.00 0.00 3.00 0 0 0 0 0 0 1 0 0 0 0 0 0 0 0 0 0 0
Mesa Verde SE 8.70 7.70 8.70 0 4 1 2 0 0 0 0 0 0 0 0 0 1 0 0 2 45
Mesa View NW 1.10 1.10 0.00 0 0 0 0 0 0 0 0 0 0 0 0 0 0 0 0 0 0
Mitchell Elem School NE 1.90 0.00 1.90 0 0 1 0 0 0 0 0 0 0 0 0 0 0 0 0 1 30
Monastery Gardens SW 0.10 0.10 0.10 0 0 0 0 0 0 0 0 0 0 0 0 0 0 0 0 1 0
Montano West NW 1.30 1.30 1.30 0 0 0 2 0 0 0 0 0 0 0 0 0 1 0 0 0 0
Montecito NW 1.20 1.20 1.20 0 0 0 0 0 0 0 0 0 0 0 0 0 1 0 0 3 0
Montgomery NE 24.30 22.30 24.30 0 4 0 0 2 0 0 0 0 1 0 0 0 1 0 0 0 75
Morningside SE 1.20 1.20 1.20 0 0 0 0 0 0 0 0 0 0 0 0 0 1 0 0 0 0
Mountain View SW 3.80 0.00 3.80 0 2 0 2 0 0 0 0 0 0 0 0 0 2 0 0 1 0
Netherwood SE 5.30 5.30 5.30 0 0 0 0 0 0 0 0 0 0 0 0 0 0 0 0 0 0
New Day SE 7.50 7.50 0.00 0 0 0 0 0 0 0 0 0 0 0 0 0 0 0 0 0 0
New Kimo SE 0.40 0.40 0.40 0 0 0 0 0 0 0 0 0 0 0 0 0 0 0 0 0 0
Nor Este NE 6.50 6.50 6.50 0 0 0 0 0 0 0 0 0 0 0 0 0 0 0 0 0 0
North Domingo Baca NE 40.30 21.80 14.30 0 0 0 0 0 0 0 0 0 0 0 0 0 0 0 1 5 0
NW Modular Skate NW 2.50 2.50 0.70 0 0 0 0 0 0 0 0 0 0 0 0 0 0 0 1 1 0
Novella NE 1.70 1.70 1.70 0 0 0 0 0 0 0 0 0 0 0 0 0 1 0 0 0 0
Old Town Plaza SW 0.40 0.40 0.40 0 0 0 0 0 0 0 0 0 0 0 0 0 0 0 0 1 0
Osuna Elem School NE 3.80 0.00 3.30 0 0 0 0 1 0 0 0 0 0 0 0 0 0 0 0 0 60
Ouray Off Leash Area NW 5.00 5.00 2.30 0 0 0 0 0 0 0 0 0 0 0 0 0 0 0 0 3 0
Oxnard SW 0.48 0.48 0.48 0 0 0 0 0 0 0 0 0 0 0 0 0 0 0 0 0 0
Paradise Meadows NW 9.70 9.70 1.10 0 0 0 0 0 0 0 0 0 0 0 0 0 1 0 0 1 2
Paradise Skies NW 4.60 4.60 4.60 0 2 1 0 1 0 0 0 0 0 0 0 0 4 0 0 2 0
Park Hill NW 1.30 1.30 0.00 0 0 0 0 0 0 0 0 0 0 0 0 0 0 0 0 0 0
Parkway NW 6.30 6.30 6.30 0 0 0 0 0 0 0 0 0 0 0 0 0 2 0 0 1 11
Parkwest NW 2.60 2.60 2.60 0 0 1 0 0 0 0 0 0 0 0 1 0 2 0 0 1 0
Paseo De Estrella NW 4.00 4.00 4.00 0 0 0 0 0 0 0 0 0 0 0 0 0 4 0 0 2 0

Appendix F: Existing Park Inventory
City of Albuquerque, NM Final draft
Impact Fee Study September 13, 2012 119
Table 112. Continued
Park Name Area
Total
Acres
Owned
Acres
Dev'd
Acres Ten
nis, L
it
Ten
nis, U
nlit
Basketb
all, Fu
ll
Basketb
all, H
alf
So
ccer
Ballfield
, L
it
Ballfield
, U
nlit
Yo
uth
B
allfld
Po
ol, In
do
or
Po
ol, O
utd
oo
r
Ho
rsesh
oe P
it
Vo
lleyb
all C
ou
rt
Backsto
p
Play A
rea
Exercise S
tatio
n
Skate B
oard
Sh
ad
e S
tru
ctu
re
Parkin
g S
pace
Pat Hurley Lower SW 18.80 17.80 18.80 0 4 1 4 0 0 0 0 0 0 0 0 0 1 0 0 4 50
Pat Hurley Upper SW 4.90 4.90 4.90 0 0 0 0 0 0 0 0 0 0 0 0 0 1 0 0 0 12
Phil Chacon SE 51.30 50.30 45.30 0 0 1 0 1 0 1 0 0 0 0 0 1 1 0 0 10 173
Piedra Lisa SE 3.20 3.20 3.20 0 0 0 1 0 0 0 0 0 0 0 0 0 2 0 0 0 0
Piedras Marcadas NW 0.50 0.50 0.30 0 0 0 0 0 0 0 0 0 0 0 0 0 3 0 0 1 0
Pinon Pointe NW 2.20 2.20 2.20 0 0 0 0 0 0 0 0 0 0 0 1 0 2 0 0 1 0
Presidio NW 1.40 1.40 1.40 0 0 0 1 1 0 0 0 0 0 0 0 0 1 0 0 2 0
Quigley SE 2.90 2.90 2.90 0 0 0 0 1 0 0 0 0 0 0 0 0 2 0 0 0 0
Quintessence NE 5.30 5.30 5.30 0 0 0 2 0 0 0 0 0 0 0 0 0 0 0 0 2 0
Rancho De Palomas NE 2.40 0.00 2.40 0 0 0 0 0 0 0 0 0 0 0 0 0 1 0 0 1 10
Rancho Encantado NW 1.80 1.80 1.80 0 0 0 1 0 0 0 0 0 0 0 0 0 1 0 0 3 0
Redlands NW 10.50 10.50 10.50 0 0 0 1 0 0 0 5 0 0 1 1 1 1 0 0 1 69
Richland Hills NW 2.10 2.10 2.10 0 0 0 0 1 0 0 0 0 0 0 0 0 1 0 0 2 0
Ridgecrest SE 1.10 1.10 1.10 0 0 0 0 0 0 0 0 0 0 0 0 0 0 0 0 0 0
Ridgeview Village NW 2.00 2.00 0.00 0 0 0 0 0 0 0 0 0 0 0 0 0 0 0 0 0 0
Rinconada Point NW 7.20 7.20 7.20 0 2 1 0 1 0 0 0 0 0 0 0 0 1 0 1 2 0
Rio Grande Pool SW 2.00 2.00 2.00 0 0 0 0 0 0 0 0 0 1 0 0 0 1 0 0 0 50
Rio Grande Triangle SW 2.60 2.60 2.60 0 0 0 0 0 0 0 0 0 0 0 0 0 0 0 0 0 0
Riverview NW 9.30 9.30 9.30 0 0 0 0 0 0 0 0 0 0 0 1 0 1 0 0 1 0
Robinson SW 1.60 1.60 1.60 0 0 0 0 0 0 0 0 0 0 0 0 0 0 0 0 0 0
Roosevelt SE 3.80 0.00 3.80 0 0 0 0 0 0 0 0 0 0 0 0 0 2 0 0 0 0
Ross SE 0.60 0.60 0.60 0 0 0 0 0 0 0 0 0 0 0 0 0 0 0 0 0 0
Ross Enchanted SW 5.40 5.40 5.40 0 0 0 0 1 0 0 0 0 0 0 0 0 3 0 0 0 0
Rotary NE 4.80 4.80 4.80 0 0 0 3 0 0 0 0 0 0 0 0 0 1 0 0 1 0
Salida Del Sol NW 6.80 6.80 6.80 0 0 0 0 0 0 0 0 0 0 0 0 0 1 0 0 1 0
San Antonio Corridor NE 3.50 3.50 0.00 0 0 0 0 0 0 0 0 0 0 0 0 0 0 0 0 0 0
Sandia Pool NE 1.60 0.00 1.60 0 0 0 0 0 0 0 0 1 0 0 0 0 0 0 0 0 0
Sandia Vista SE 1.90 1.90 1.90 0 0 1 0 0 0 0 0 0 0 0 0 0 1 0 0 0 0
Santa Barbara SW 0.60 0.00 0.60 0 0 2 0 0 0 0 0 0 0 0 0 0 1 0 0 1 0
Santa Fe Village NW 16.00 15.00 16.00 0 0 0 1 1 0 0 0 0 0 0 1 0 1 0 0 0 30
Seville NW 6.30 6.30 6.30 0 0 0 1 0 0 0 0 0 0 0 0 0 2 0 0 3 0
Shawn Mcwethy NW 5.10 5.10 0.00 0 0 0 0 0 0 0 0 0 0 0 0 0 0 0 0 0 0
Sierra Vista West NW 5.50 5.50 5.50 0 10 0 0 0 0 10 0 0 1 0 1 0 0 0 0 5 45
Silver Tree SW 5.10 5.10 0.60 0 0 0 1 0 0 0 0 0 0 0 0 0 2 0 0 1 0
Singing Arrow SE 16.00 15.00 8.40 0 0 0 1 0 0 0 0 0 0 0 0 0 1 0 0 1 1
Sister Cities NE 4.50 4.50 4.50 0 4 0 0 1 0 0 0 0 0 0 0 0 1 0 0 0 0
Skyview West SW 0.70 0.70 0.00 0 0 0 0 0 0 0 0 0 0 0 0 0 0 0 0 0 0
Snow SE 8.80 7.80 8.80 0 0 1 0 1 0 0 0 0 0 0 0 0 1 0 0 2 16
Snow Heights SE 2.30 2.30 2.30 0 0 0 0 0 0 0 0 0 0 0 0 0 1 0 0 1 0
Soldiers And Sailors SW 0.20 0.20 0.20 0 0 0 0 0 0 0 0 0 0 0 0 0 0 0 0 0 0
Sombra Del Monte El NE 2.20 0.00 2.20 0 0 0 0 1 0 0 0 0 0 0 0 0 0 0 0 0 0
South Broadway SW 1.90 1.90 1.90 0 0 0 0 1 0 0 0 0 0 0 0 0 1 0 0 1 20
South San Jose SW 4.70 3.70 4.70 0 2 1 0 0 0 0 0 0 0 0 0 0 2 0 0 1 38
Spruce SE 0.80 0.80 0.80 0 0 0 0 0 0 0 0 0 0 0 0 0 1 0 0 0 0
St Pius High School NW 8.50 0.00 8.50 0 0 0 0 3 0 0 0 0 0 0 0 0 0 0 0 0 0
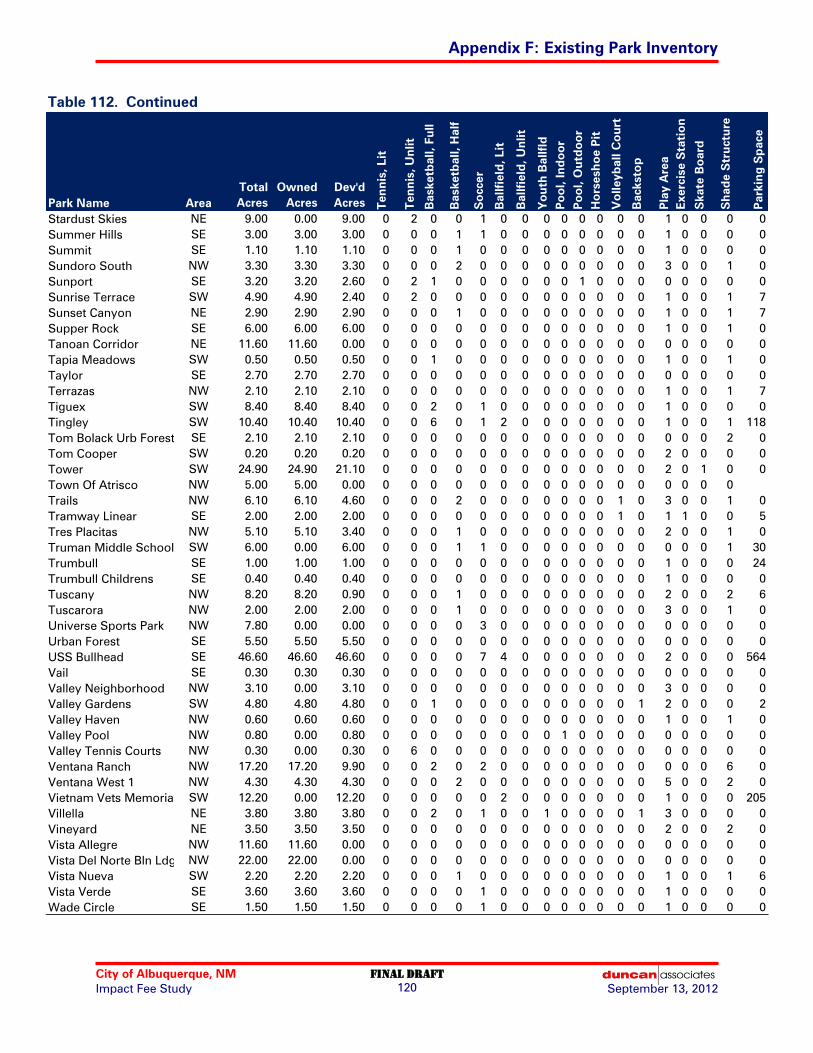
Appendix F: Existing Park Inventory
City of Albuquerque, NM Final draft
Impact Fee Study September 13, 2012 120
Table 112. Continued
Park Name Area
Total
Acres
Owned
Acres
Dev'd
Acres Ten
nis, L
it
Ten
nis, U
nlit
Basketb
all, Fu
ll
Basketb
all, H
alf
So
ccer
Ballfield
, L
it
Ballfield
, U
nlit
Yo
uth
B
allfld
Po
ol, In
do
or
Po
ol, O
utd
oo
r
Ho
rsesh
oe P
it
Vo
lleyb
all C
ou
rt
Backsto
p
Play A
rea
Exercise S
tatio
n
Skate B
oard
Sh
ad
e S
tru
ctu
re
Parkin
g S
pace
Stardust Skies NE 9.00 0.00 9.00 0 2 0 0 1 0 0 0 0 0 0 0 0 1 0 0 0 0
Summer Hills SE 3.00 3.00 3.00 0 0 0 1 1 0 0 0 0 0 0 0 0 1 0 0 0 0
Summit SE 1.10 1.10 1.10 0 0 0 1 0 0 0 0 0 0 0 0 0 1 0 0 0 0
Sundoro South NW 3.30 3.30 3.30 0 0 0 2 0 0 0 0 0 0 0 0 0 3 0 0 1 0
Sunport SE 3.20 3.20 2.60 0 2 1 0 0 0 0 0 0 1 0 0 0 0 0 0 0 0
Sunrise Terrace SW 4.90 4.90 2.40 0 2 0 0 0 0 0 0 0 0 0 0 0 1 0 0 1 7
Sunset Canyon NE 2.90 2.90 2.90 0 0 0 1 0 0 0 0 0 0 0 0 0 1 0 0 1 7
Supper Rock SE 6.00 6.00 6.00 0 0 0 0 0 0 0 0 0 0 0 0 0 1 0 0 1 0
Tanoan Corridor NE 11.60 11.60 0.00 0 0 0 0 0 0 0 0 0 0 0 0 0 0 0 0 0 0
Tapia Meadows SW 0.50 0.50 0.50 0 0 1 0 0 0 0 0 0 0 0 0 0 1 0 0 1 0
Taylor SE 2.70 2.70 2.70 0 0 0 0 0 0 0 0 0 0 0 0 0 0 0 0 0 0
Terrazas NW 2.10 2.10 2.10 0 0 0 0 0 0 0 0 0 0 0 0 0 1 0 0 1 7
Tiguex SW 8.40 8.40 8.40 0 0 2 0 1 0 0 0 0 0 0 0 0 1 0 0 0 0
Tingley SW 10.40 10.40 10.40 0 0 6 0 1 2 0 0 0 0 0 0 0 1 0 0 1 118
Tom Bolack Urb Forest SE 2.10 2.10 2.10 0 0 0 0 0 0 0 0 0 0 0 0 0 0 0 0 2 0
Tom Cooper SW 0.20 0.20 0.20 0 0 0 0 0 0 0 0 0 0 0 0 0 2 0 0 0 0
Tower SW 24.90 24.90 21.10 0 0 0 0 0 0 0 0 0 0 0 0 0 2 0 1 0 0
Town Of Atrisco NW 5.00 5.00 0.00 0 0 0 0 0 0 0 0 0 0 0 0 0 0 0 0 0
Trails NW 6.10 6.10 4.60 0 0 0 2 0 0 0 0 0 0 0 1 0 3 0 0 1 0
Tramway Linear SE 2.00 2.00 2.00 0 0 0 0 0 0 0 0 0 0 0 1 0 1 1 0 0 5
Tres Placitas NW 5.10 5.10 3.40 0 0 0 1 0 0 0 0 0 0 0 0 0 2 0 0 1 0
Truman Middle School SW 6.00 0.00 6.00 0 0 0 1 1 0 0 0 0 0 0 0 0 0 0 0 1 30
Trumbull SE 1.00 1.00 1.00 0 0 0 0 0 0 0 0 0 0 0 0 0 1 0 0 0 24
Trumbull Childrens SE 0.40 0.40 0.40 0 0 0 0 0 0 0 0 0 0 0 0 0 1 0 0 0 0
Tuscany NW 8.20 8.20 0.90 0 0 0 1 0 0 0 0 0 0 0 0 0 2 0 0 2 6
Tuscarora NW 2.00 2.00 2.00 0 0 0 1 0 0 0 0 0 0 0 0 0 3 0 0 1 0
Universe Sports Park NW 7.80 0.00 0.00 0 0 0 0 3 0 0 0 0 0 0 0 0 0 0 0 0 0
Urban Forest SE 5.50 5.50 5.50 0 0 0 0 0 0 0 0 0 0 0 0 0 0 0 0 0 0
USS Bullhead SE 46.60 46.60 46.60 0 0 0 0 7 4 0 0 0 0 0 0 0 2 0 0 0 564
Vail SE 0.30 0.30 0.30 0 0 0 0 0 0 0 0 0 0 0 0 0 0 0 0 0 0
Valley Neighborhood NW 3.10 0.00 3.10 0 0 0 0 0 0 0 0 0 0 0 0 0 3 0 0 0 0
Valley Gardens SW 4.80 4.80 4.80 0 0 1 0 0 0 0 0 0 0 0 0 1 2 0 0 0 2
Valley Haven NW 0.60 0.60 0.60 0 0 0 0 0 0 0 0 0 0 0 0 0 1 0 0 1 0
Valley Pool NW 0.80 0.00 0.80 0 0 0 0 0 0 0 0 1 0 0 0 0 0 0 0 0 0
Valley Tennis Courts NW 0.30 0.00 0.30 0 6 0 0 0 0 0 0 0 0 0 0 0 0 0 0 0 0
Ventana Ranch NW 17.20 17.20 9.90 0 0 2 0 2 0 0 0 0 0 0 0 0 0 0 0 6 0
Ventana West 1 NW 4.30 4.30 4.30 0 0 0 2 0 0 0 0 0 0 0 0 0 5 0 0 2 0
Vietnam Vets Memorial SW 12.20 0.00 12.20 0 0 0 0 0 2 0 0 0 0 0 0 0 1 0 0 0 205
Villella NE 3.80 3.80 3.80 0 0 2 0 1 0 0 1 0 0 0 0 1 3 0 0 0 0
Vineyard NE 3.50 3.50 3.50 0 0 0 0 0 0 0 0 0 0 0 0 0 2 0 0 2 0
Vista Allegre NW 11.60 11.60 0.00 0 0 0 0 0 0 0 0 0 0 0 0 0 0 0 0 0 0
Vista Del Norte Bln Ldg NW 22.00 22.00 0.00 0 0 0 0 0 0 0 0 0 0 0 0 0 0 0 0 0 0
Vista Nueva SW 2.20 2.20 2.20 0 0 0 1 0 0 0 0 0 0 0 0 0 1 0 0 1 6
Vista Verde SE 3.60 3.60 3.60 0 0 0 0 1 0 0 0 0 0 0 0 0 1 0 0 0 0
Wade Circle SE 1.50 1.50 1.50 0 0 0 0 1 0 0 0 0 0 0 0 0 1 0 0 0 0

Appendix F: Existing Park Inventory
City of Albuquerque, NM Final draft
Impact Fee Study September 13, 2012 121
Table 112. Continued
Park Name Area
Total
Acres
Owned
Acres
Dev'd
Acres Ten
nis, L
it
Ten
nis, U
nlit
Basketb
all, Fu
ll
Basketb
all, H
alf
So
ccer
Ballfield
, L
it
Ballfield
, U
nlit
Yo
uth
B
allfld
Po
ol, In
do
or
Po
ol, O
utd
oo
r
Ho
rsesh
oe P
it
Vo
lleyb
all C
ou
rt
Backsto
p
Play A
rea
Exercise S
tatio
n
Skate B
oard
Sh
ad
e S
tru
ctu
re
Parkin
g S
pace
Washington Middle SW 3.70 0.00 3.70 0 0 0 0 0 0 0 0 0 0 0 0 0 1 0 0 0 0
Wellesley SE 0.50 0.50 0.50 0 2 0 0 0 0 0 0 0 0 0 0 0 0 0 0 0 0
Wells SW 2.20 1.20 2.20 0 0 2 0 0 0 0 0 0 0 0 0 0 1 0 0 0 21
West Bluff NW 2.30 2.30 2.30 0 0 0 2 1 0 0 0 0 0 0 0 0 1 0 0 2 0
West Bluff Overlook NW 2.10 2.10 2.10 0 0 0 0 0 0 0 0 0 0 0 0 0 0 0 0 1 0
West Mesa SW 9.70 9.70 9.70 0 0 0 0 0 1 0 0 1 1 0 1 0 1 0 0 0 247
W Mesa Comm Center SW 3.90 2.90 3.90 0 0 0 0 1 0 0 0 0 0 0 0 0 1 0 0 1 0
West Old Town SW 0.90 0.90 0.90 0 0 0 0 0 0 0 0 0 0 0 0 0 2 0 0 0 0
Westgate Community SW 30.50 30.50 14.80 0 0 1 0 2 0 0 0 0 0 0 0 0 3 0 0 4 40
Westgate Comm Ctr SW 2.00 0.00 2.00 0 0 1 0 0 0 0 0 0 0 0 0 0 2 0 0 1 4
Westgate Heights SW 6.80 6.80 6.80 0 0 0 0 0 0 0 5 0 0 0 0 0 0 0 0 0 0
Whittier Elem School SE 1.40 0.00 1.40 0 0 2 0 0 0 0 0 0 0 0 1 0 1 0 0 1 15
Wildflower NW 12.40 12.40 12.40 0 0 0 0 0 0 0 0 0 0 0 1 1 0 0 0 0 40
Wilson SE 3.60 3.60 3.60 0 6 0 0 0 0 0 0 0 1 0 0 0 0 0 0 0 45
Workers Memorial SE 3.50 3.50 3.50 0 0 0 0 0 0 0 0 0 0 0 0 0 0 0 0 0 0
Zia Elem School SE 3.30 0.00 3.30 0 0 0 2 1 0 0 0 0 0 0 0 0 0 0 0 0 0
Zuni SE 2.50 2.50 2.50 0 6 0 0 0 0 0 0 0 0 0 0 0 0 0 0 0 0
Subtotal, SE Service Area 523.39 472.89 463.60 15 40 17 24 36 8 3 12 2 2 2 3 5 61 2 2 46 1583
Subtotal, SW Service Area 310.78 265.88 271.38 6 18 31 26 13 10 0 5 1 3 0 1 7 67 1 2 46 1104
Subtotal, NE Service Area 355.40 285.90 288.10 0 28 9 10 27 0 1 10 1 2 0 1 8 39 1 2 25 563
Subtotal, NW Service Area 425.65 387.45 305.85 4 22 6 43 24 0 10 10 1 1 3 9 3 94 0 2 82 433
Total 1615.22 1412.12 1328.93 25 108 63 103 100 18 14 37 5 8 5 14 23 261 4 8 199 3683 Source: City of Albuquerque Parks & Recreation Department, January 12, 2012; “Owned” acres represent acres owned by the City and used for parks
(community centers and libraries assumed to occupy one acre each).